GATA6 mutations in hiPSCs inform mechanisms for maldevelopment of the heart, pancreas, and diaphragm
- Department of Genetics, Harvard Medical School, United States
- Smidt Heart Institute, Cedars-Sinai Medical Center, United States
- Board of Governors Regenerative Medicine Institute, Cedars-Sinai Medical Center, United States
- Howard Hughes Medical Institute, Harvard Medical School, United States
- Division of Newborn Medicine, Boston Children's Hospital, United States
- Hannover Medical School, Germany
- Deutsches Herzzentrum München, Technische Universität München, Germany
- Division of Cardiovascular Medicine, Radcliffe Department of Medicine, University of Oxford, United Kingdom
- Wellcome Centre for Human Genetics, University of Oxford, United Kingdom
- Laboratory of Genetics and Molecular Cardiology, Heart Institute, Medical School of University of Sao Paulo, Brazil
- Department of Pediatrics, Stanford University School of Medicine, United States
- Department of Genetics and Genomic Sciences, Icahn School of Medicine at Mount Sinai, United States
- Department of Medicine, Columbia University Medical Center, United States
- Department of Pediatrics, The Perelman School of Medicine, University of Pennsylvania, United States
- Department of Pediatrics, University of Rochester Medical Center, United States
- Division of Pediatric Cardiology, University of Utah School of Medicine, United States
- Gladstone Institutes, United States
- Cardiovascular Division, Department of Medicine, Brigham and Women's Hospital, United States
Figures
Figure 1
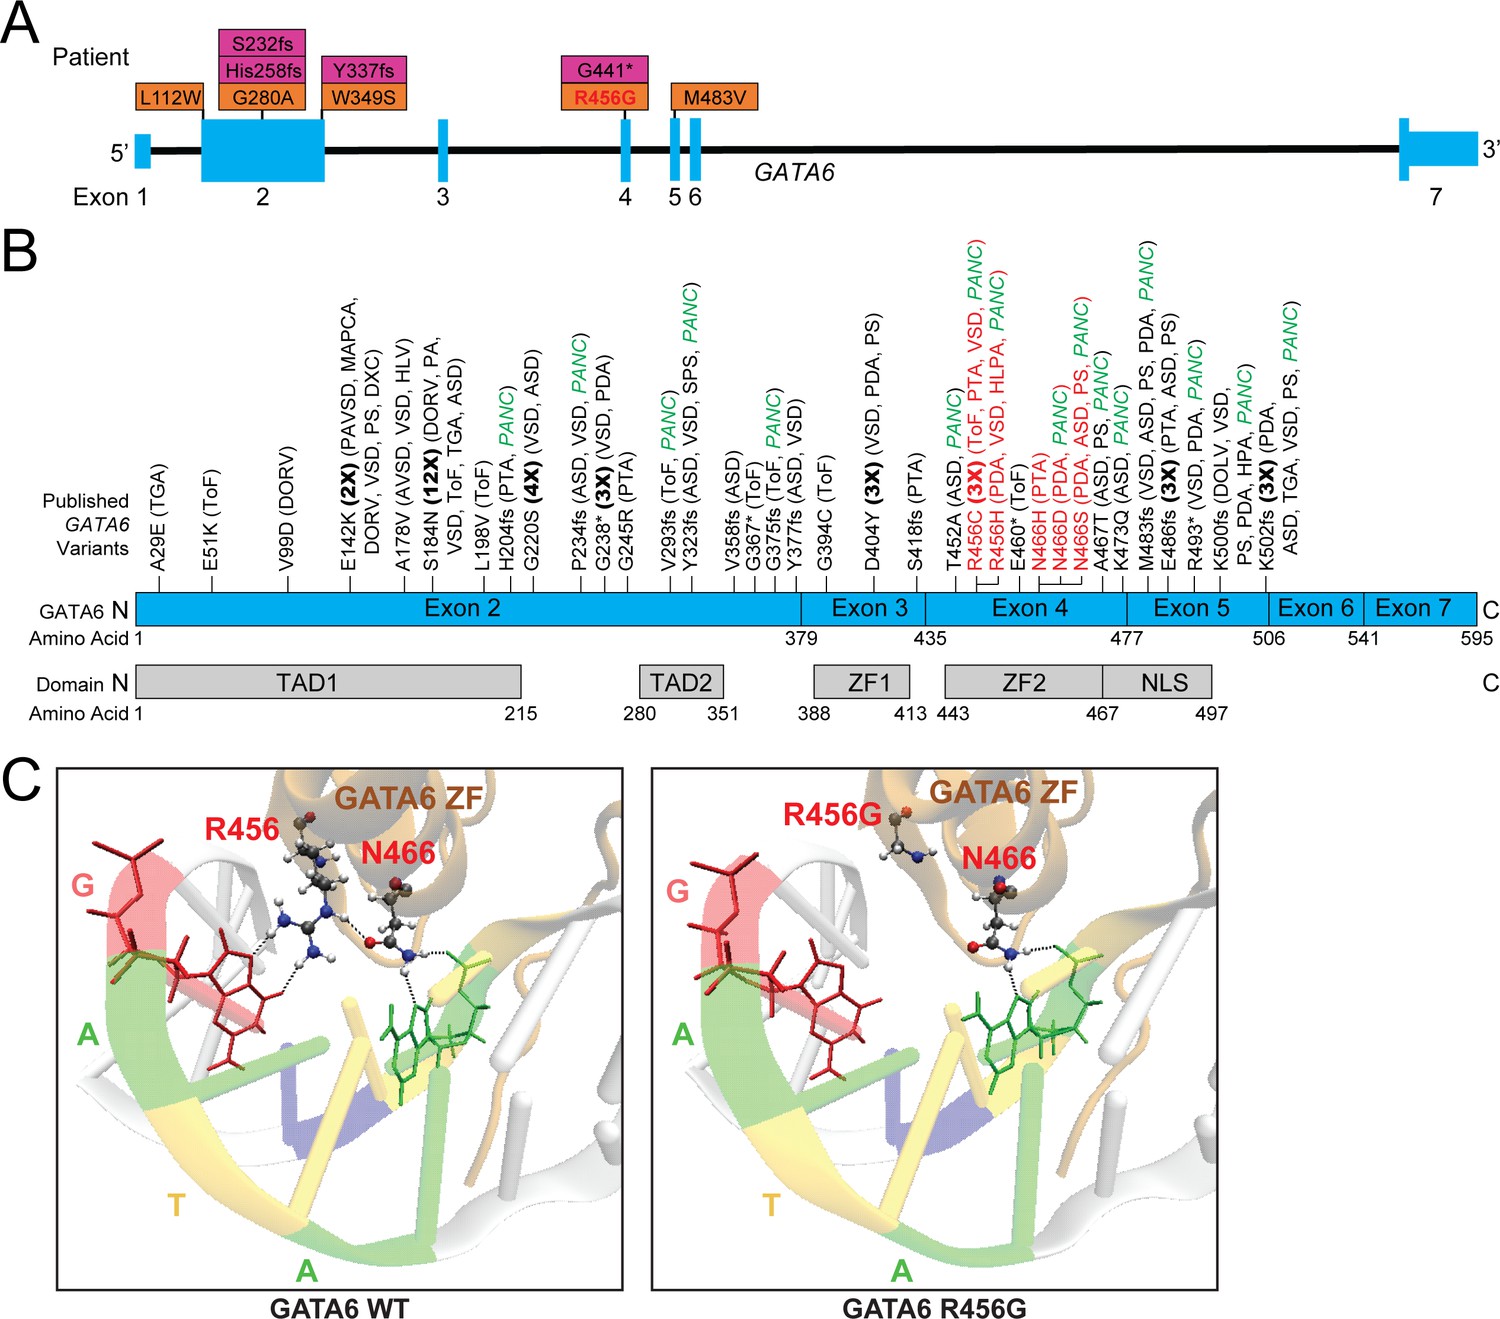
Genetic information and clinical phenotypes of individuals with GATA6 variants.
A) Schematic of GATA6 gene and locations of PCGC GATA6 variants (LoF-purple, missense-orange). (B) Previously described (see Supplementary file 1) GATA6 variants (R456 and N466 variants highlighted in red), and GATA6 protein domains. TAD: Topologically associating domain, ZF: zinc finger, NLS: nuclear localization signal. TGA: Transposition of the Great Arteries, ToF: Tetralogy of Fallot, DORV: Double-Outlet Right Ventricle, DOLV: Double-Outlet Left Ventricle, DXC: Dextrocardia, VSD: Ventricular Septal Defect, HLV: Hypoplastic Left Ventricle, PA: Pulmonary Atresia, ASD: Atrial Septal Defect, PTA: Persistent Truncus Arteriosus, SPS: Supravalvular Pulmonary Stenosis, HLPA: Hypoplastic Left Pulmonary Artery, PS: Pulmonary Stenosis, HPA: Hypoplastic Pulmonary Artery, PANC: Pancreatic Agenesis (C) Model of GATA6 DNA-binding domain bound to major groove of DNA indicating the location of amino acid residue 456. Left panel: GATA6 residues R456 and N466 normally interact with each other via hydrogen bonding (dashed lines) and with target G base and second A base in the GATA motif via hydrogen bonding, respectively (dashed lines). Right panel: Replacing the arginine (R) residue at position 456 with a glycine (G) residue alters normal molecular interactions by disrupting the hydrogen bonds.
Figure 2 with 1 supplement

GATA6 mutant hiPSCs exhibit hiPSC-CM differentiation defects.
(A) GATA6 variants in a TNNT2-GFP reporter line showed reduced (GATA6+/-) or absent (GATA6-/-) GFP-tagged sarcomeres in comparison to WT cells. (B) Distribution of dissociated GFP-TNNT2-GATA6 mutant cells assessed using the Countess system with a GFP filter cube (METHODS). (C) Number of GATA6 LoF mutant differentiation cultures (n = 25 per genotype) with beating hiPSC-CMs. (D) The GATA6R456G/R456G variant has reduced expression of GFP-tagged sarcomeres. (E) Fluorescence distribution of differentiated GFP-TNNT2 GATA6R456G/R456G cells assessed using the Countess system with a GFP filter cube (see Materials and methods). (F) Number of GFP-TNNT2 GATA6R456G/R456G differentiation cultures (n = 25) with beating day eight hiPSC-CMs. All lines were studied at differentiation day 8. Significance was assessed using Student’s t-test.
Figure 2—figure supplement 1
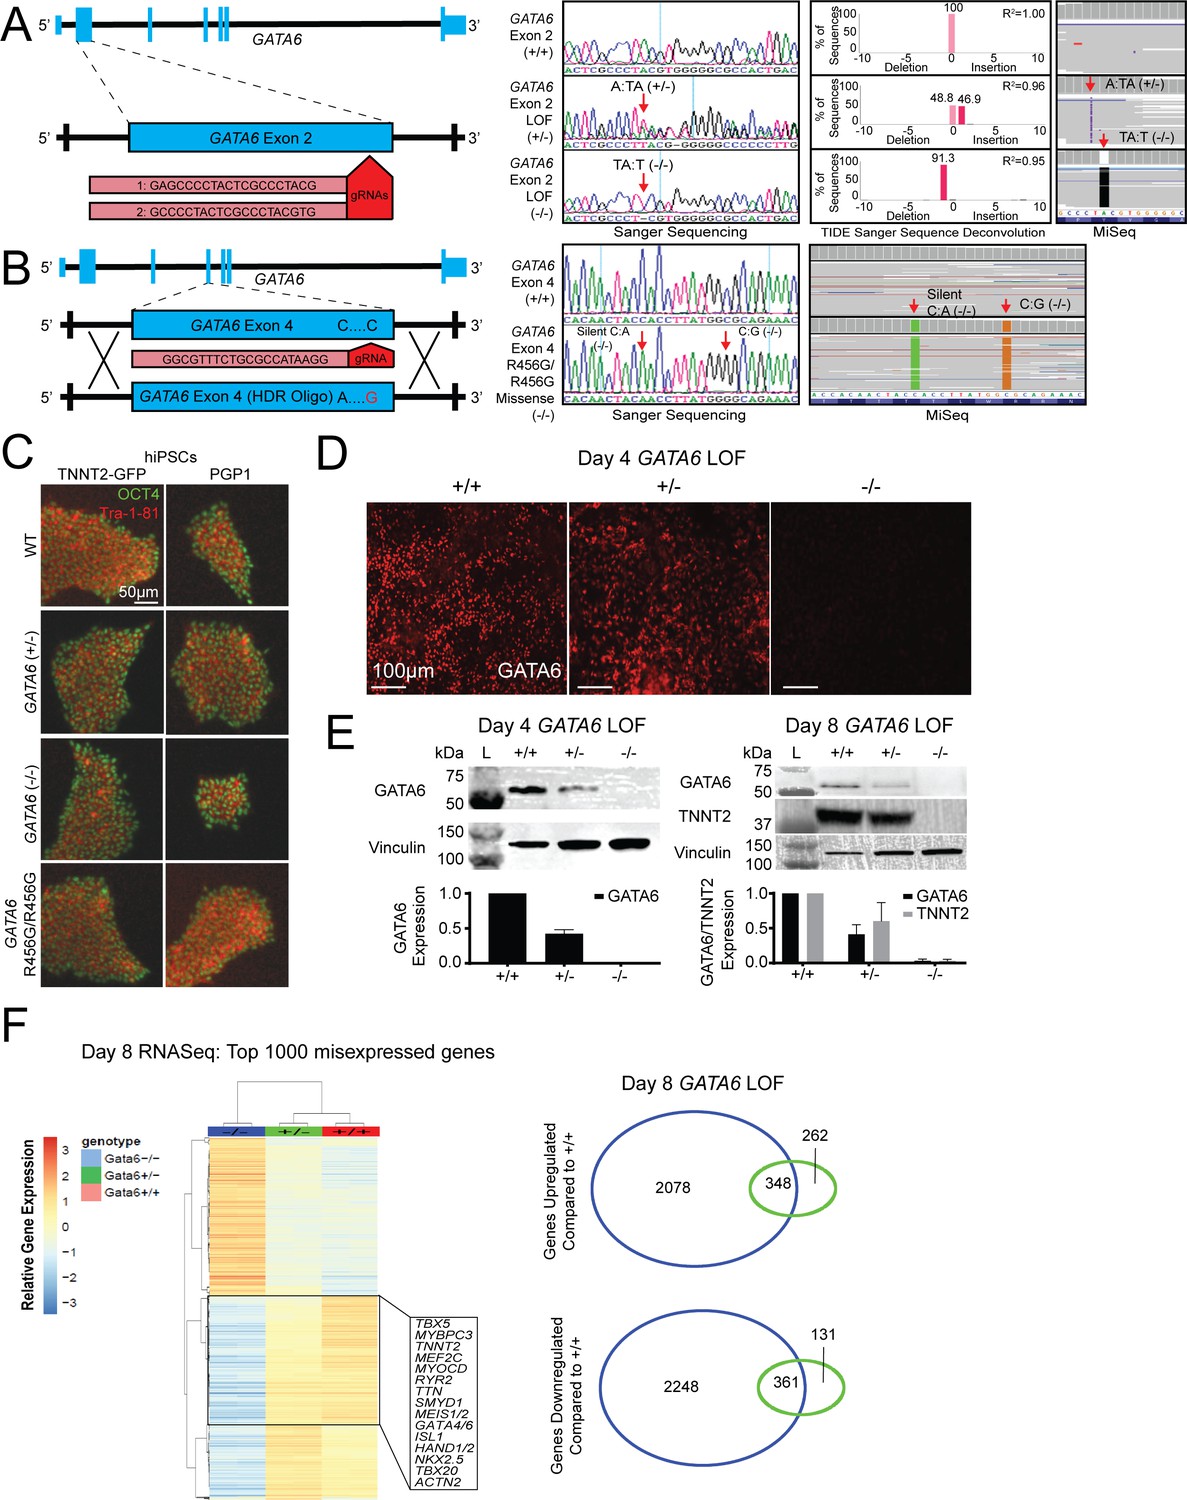
Sequence and phenotype characterization of GATA6 mutant hiPSCs.
(A) Sanger and next-generation sequencing (depicted by Integrated Genomics Viewer; IGV) analysis of GATA6+/- and GATA6-/- lines. GATA6+/- lines carry a 1 bp T insertion on one allele. GATA6-/- lines carry a 1 bp A deletion on both alleles. (B) GATA6R456G/R456G lines carry a silent C:A (PAM site mutation) and C:G missense, leading to the R456G missense mutation. (C) Pluripotency evaluation of hiPSC lines. Undifferentiated hiPSC cells were subjected to immunofluorescence for pluripotency markers OCT4 and TRA-1–81. Top row: CRISPR genome-edited cells generated in the PGP1 background. Bottom row: CRISPR genome-edited cells generated in the TNNT2-GFP background. (D) Immunofluorescence of day 4 confirms absence of GATA6 protein in GATA6-/- cells. (E) Western blots of extracts from GATA6+/- and GATA6-/- lines probed with TNNT2 and GATA6 antibodies. Vinculin levels provide a loading control for each blot. N = 3 independent experiments conducted for each western blot. (F) Gene expression analysis in day 8 GATA6+/- and GATA6-/- lines reveals differential expression of cardiac-specific genes. Using the pheatmap and Venn Diagram R scripts, these illustrations were generated for day 8.
Figure 3 with 1 supplement

GATA6 mutant cells exhibit downregulation of second heart field-related genes during hiPSC-CM differentiation.
A) Gene expression principal component analysis (PCA) of day 0–30 WT (GATA6+/+), GATA6+/-, GATA6-/-, and GATA6R456G/R456G hiPSC-CMs. RNA-Seq samples were harvested in duplicate for all time points. (B) Venn Diagrams (left) and heat map (right) of day 4 GATA6+/- and GATA6-/- cells. In the heatmap, red indicates upregulated genes whereas blue represents downregulated genes. Samples are in duplicate. Selected second heart field genes are shown. (C) Expression data in normalized counts for second heart field-related genes (top row), cardiac developmental transcription factors (middle row), sarcomere, and other selected genes (bottom row) during differentiation of GATA6 mutant hiPSC-CMs. Data represented as mean ± SD. Note that SMYD1 and HAND2 graphs are plotted with logarithmic scale. (D) Gene expression scatterplot illustrating downregulation of expression of HAND2 upstream and downstream gene network in day 4 GATA6+/- and GATA6-/- cells. X-axis, log2 fold-change of gene expression in GATA6-/- cells relative to WT. Y-axis, log2-fold-change of gene expression in GATA6+/- cells relative to WT. Canonical cardiac development and the second heart field genes are bolded.
Figure 3—figure supplement 1

GATA6 mutant cells exhibit an upregulation in epithelial-to-mesenchymal transition, neurodevelopmental, and neural crest-related genes.
(A) Expression of epithelial-to-mesenchymal transition markers in GATA6 mutant hiPSC-CMs during differentiation. (B) Expression of neurodevelopmental and neural crest-related genes in GATA6 mutant hiPSC-CMs during differentiation.
Figure 4 with 1 supplement
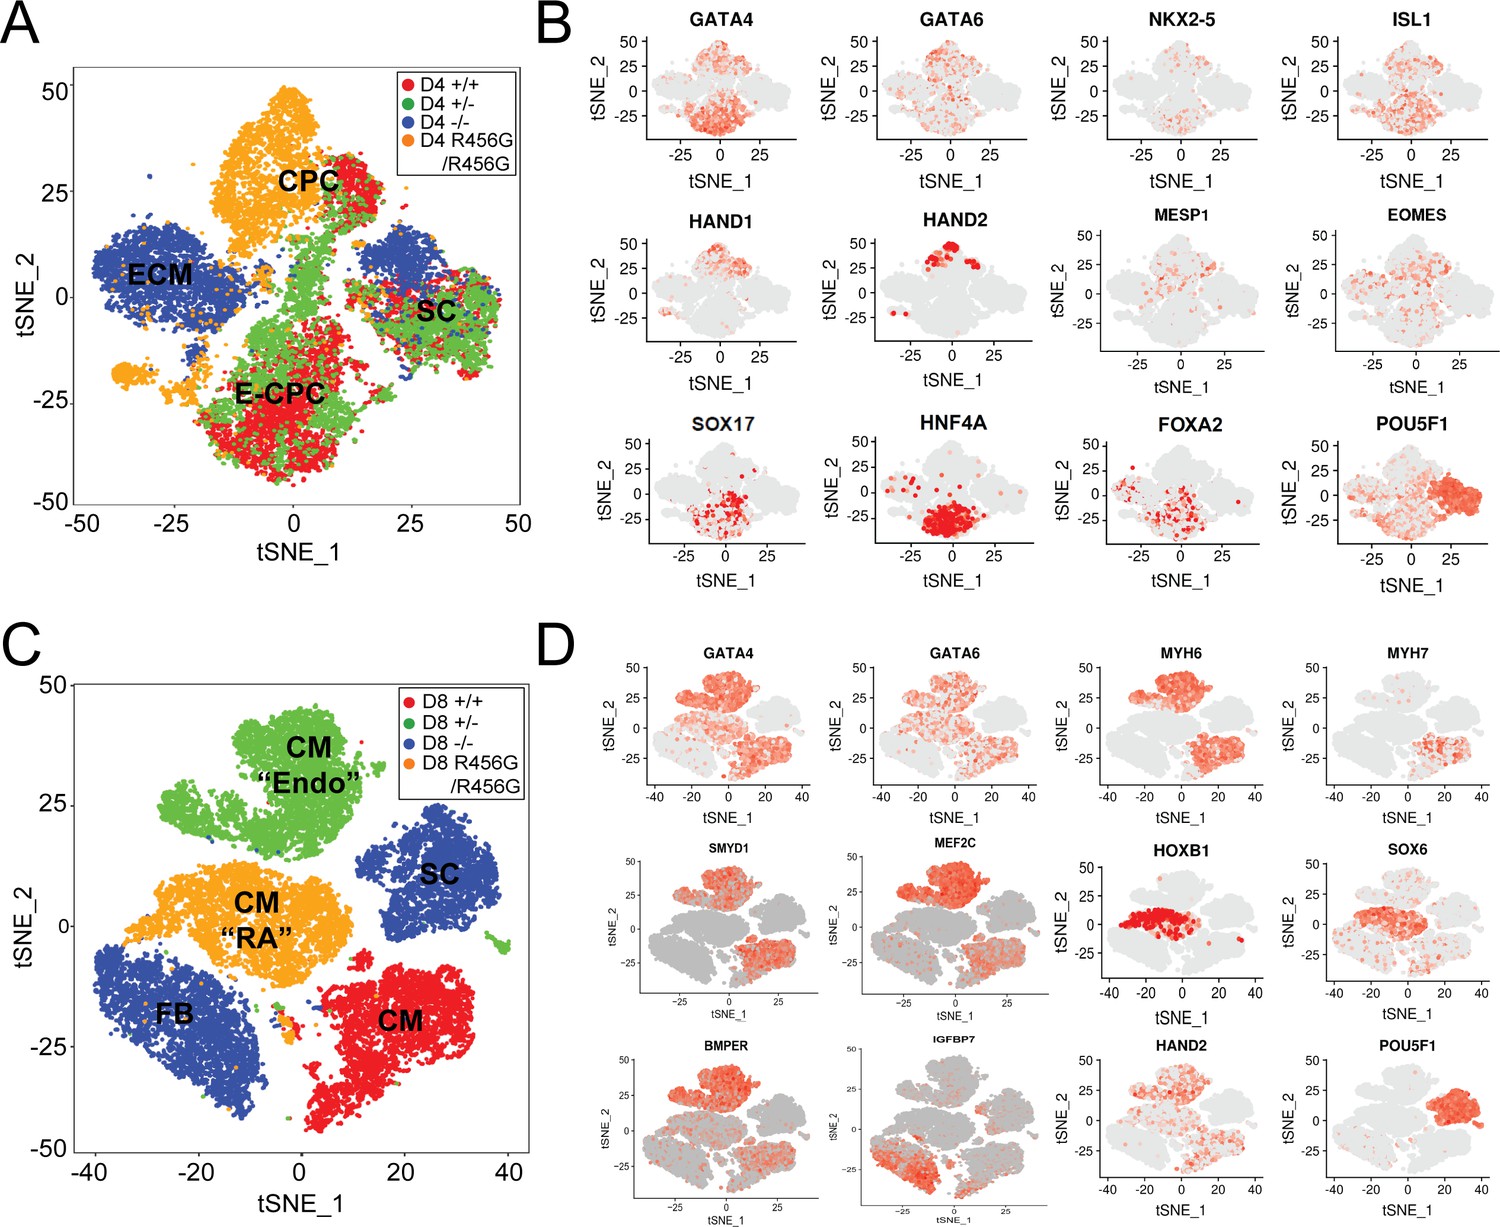
Single-cell transcriptional analysis of GATA6 mutant hiPSC-CMs during differentiation.
(A) tSNE of single-cell RNA-Seq of day 4 GATA6 mutant hiPSC-CMs identified four clusters. Labels reflect marker gene expression: SC, Stem cell; CPC, cardiac progenitor cells; E-CPC, cardiac progenitors enriched with endoderm markers; ECM, endodermal-like cells enriched for extracellular matrix proteins. (B) Examples of marker gene expression in clustered hiPSC-derived cells. CPC cells express mesodermal factors (MESP1, EOMES) as well as cardiac transcription factors (GATA6, GATA4, ISL1, NKX2.5, HAND1, and HAND2). SCs expressed OCT4 (POU5F1). E-CPCs expressed GATA6, SOX17, HNF4A, and FOXA2. (C) tSNE clustering of single-cell RNA-Seq of day 8 GATA6 mutant hiPSC-CMs identified five clusters. Labels reflect marker gene expression: CM, cardiomyocytes; CM (‘RA’), cardiomyocytes with increased RA-signaling pathway genes; SC, Stem Cell; CM (‘Endo’), cardiomyocytes with enrichment in endothelial genes; FB; fibroblast-like cells (D) Examples of marker gene expression in clustered cells. SC expressed OCT4 (POU5F1). CMs expressed sarcomere protein genes (MYH6, MYH7), SMYD1, a CM-specific histone methyl-transferase, and HAND2, a second heart field transcription factor. CMs (RA) also expressed retinoic acid pathway genes (SOX6, HOXB1). CMs (Endo) have upregulated endothelial cell gene expression (MEF2C, BMPER), while FB cells expressed ECM markers (IGFBP7).
Figure 4—figure supplement 1
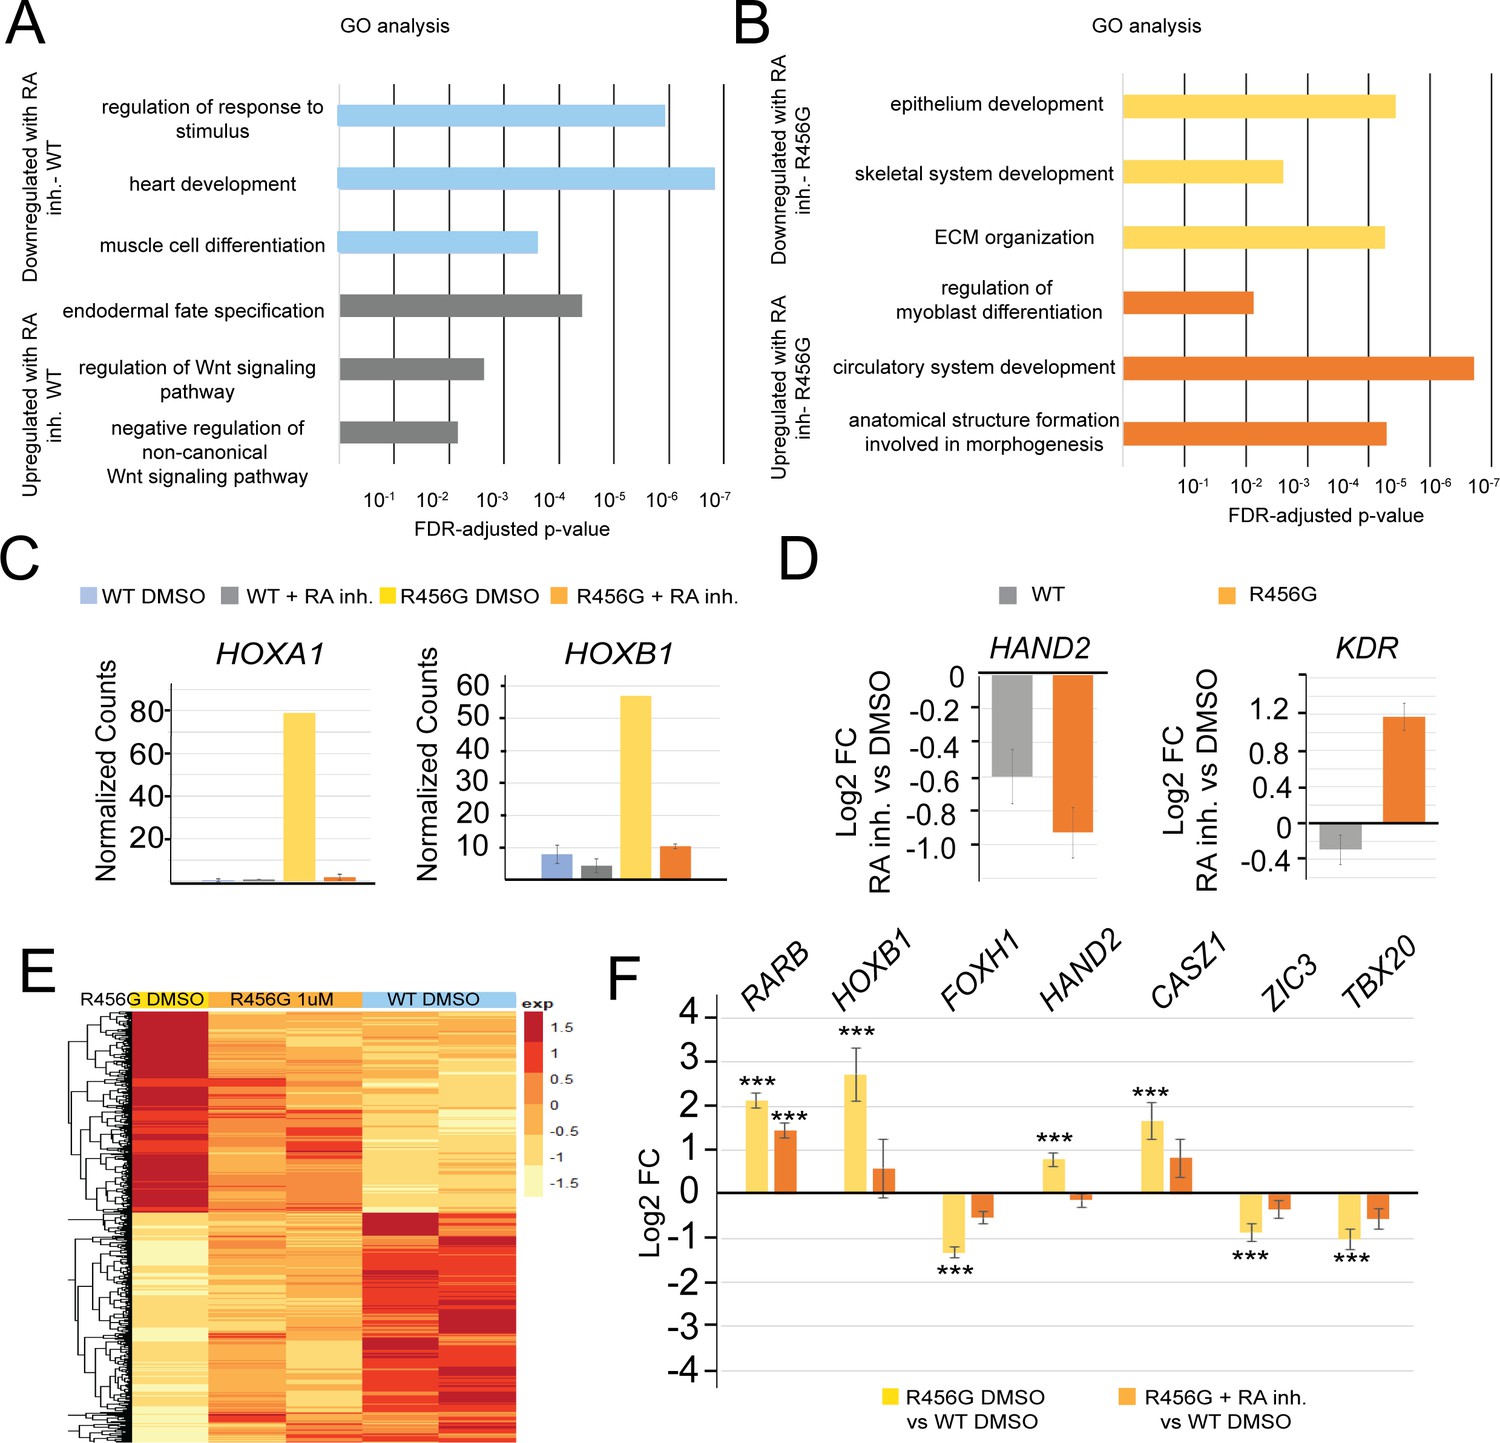
retinoic acid inhibitor (RA inh) treatment of GATA6R456G/R456G hiPSCs partially rescues cardiac progenitor gene expression.
(A) Gene Ontology analysis of genes differentially expressed (1.5-fold, p<0.05) in WT hiPSCs treated with 1 µM RA inhibitor at day 4 of differentiation for 24 hr (WIN 18446, Tocris) vs. DMSO treatment. (B) Gene Ontology analysis of genes differentially expressed (1.5-fold, p<0.05) in GATA6R456G/R456GhiPSCs treated with 1 µM RA inhibitor at day 4 of differentiation for 24 hr (WIN 18446, Tocris) vs. DMSO treatment. (C) Normalized RNA-seq counts for retinoic acid signaling genes HOXA1 and HOXB1 showing rescue of retinoic acid signaling in GATA6R456G/R456G day 5 cells. (D) Log2 fold-change for cardiac genes HAND2 and KDR demonstrates these more drastically affected in GATA6R456G/R456G cells (treated vs. untreated). (E) Heatmap of GATA6R456G/R456G genes that are rescued upon RA inhibitor treatment (1.5-fold, p<0.05). (F) Log2 fold-change of select genes from (E). Yellow bars represent the log2FC between DMSO-treated GATA6R456G/R456G cells and DMSO-treated WT cells, while orange bars represent the log2FC between RA inhibitor-treated GATA6R456G/R456G cells and DMSO-treated WT cells.
Figure 5 with 1 supplement
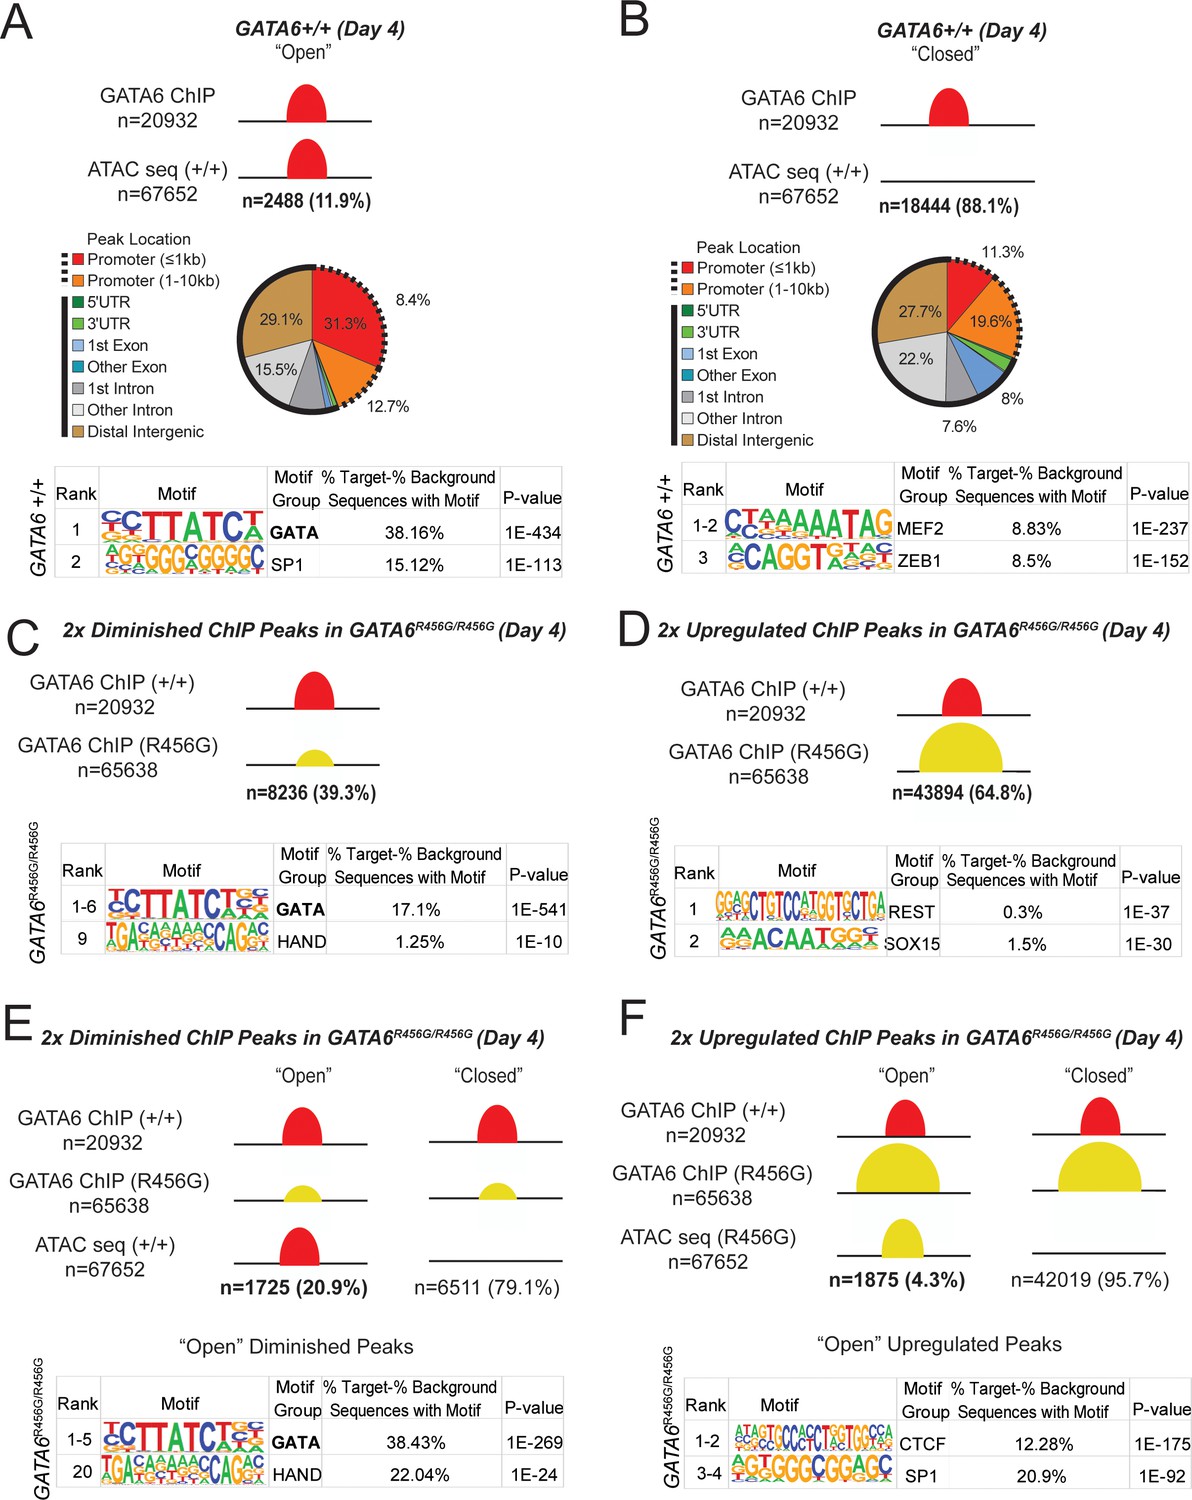
GATA6 is a pioneer factor for cardiac development.
ATAC-seq and GATA6 ChIP-seq were performed in WT and mutant day 4 hiPSCs and overlapped to assess GATA6 direct binding to open vs. closed chromatin. (A) Approximately 12% of GATA6 ChIP-seq peaks overlapped with an ATAC-seq peak and were characterized as ‘Open’. The genomic location of these ChIP-seq peaks in open chromatin were characterized with respect to gene bodies, and DNA-binding motif enrichment was performed using HOMER analysis (METHODS). When GATA6 binds to open regions of chromatin, peaks are enriched for the GATA motif. (B) The remaining 88% of GATA6 ChIP-seq peaks were characterized as ‘Closed’. The genomic location of these ChIP-seq peaks were characterized with respect to gene bodies, and DNA-binding motif enrichment was performed using HOMER analysis. When GATA6 binds to closed regions of chromatin, peaks are enriched for the MEF2 motif. (C) Of the 20932 WT GATA6 ChIP-seq peaks, 39.3% were reduced in GATA6R456G/R456G cells (adjusted p<1e-4, two fold). These peaks were enriched for the GATA and HAND2 binding motifs by HOMER analysis. (D) Of the 67652 GATA6R456G/R456G ChIP-seq peaks, 64.8% were upregulated in GATA6R456G/R456G cells (adjusted p<1e-4, two fold). These peaks were enriched for the REST and SOX binding motifs by HOMER analysis. (E) Peaks diminished in GATA6R456G/R456G cells were overlapped with WT ATAC-seq data to establish chromatin accessibility. Almost 21% of peaks diminished in GATA6R456G/R456G cells were in open chromatin regions; these peaks were enriched for the GATA and HAND motifs. (F) Peaks upregulated in GATA6R456G/R456G cells were overlapped with GATA6R456G/R456G ATAC-seq data to establish chromatin accessibility. Four percent of peaks enriched in GATA6R456G/R456G cells were in open chromatin regions; these peaks were enriched for the CTCF and SP1 motifs.
Figure 5—figure supplement 1
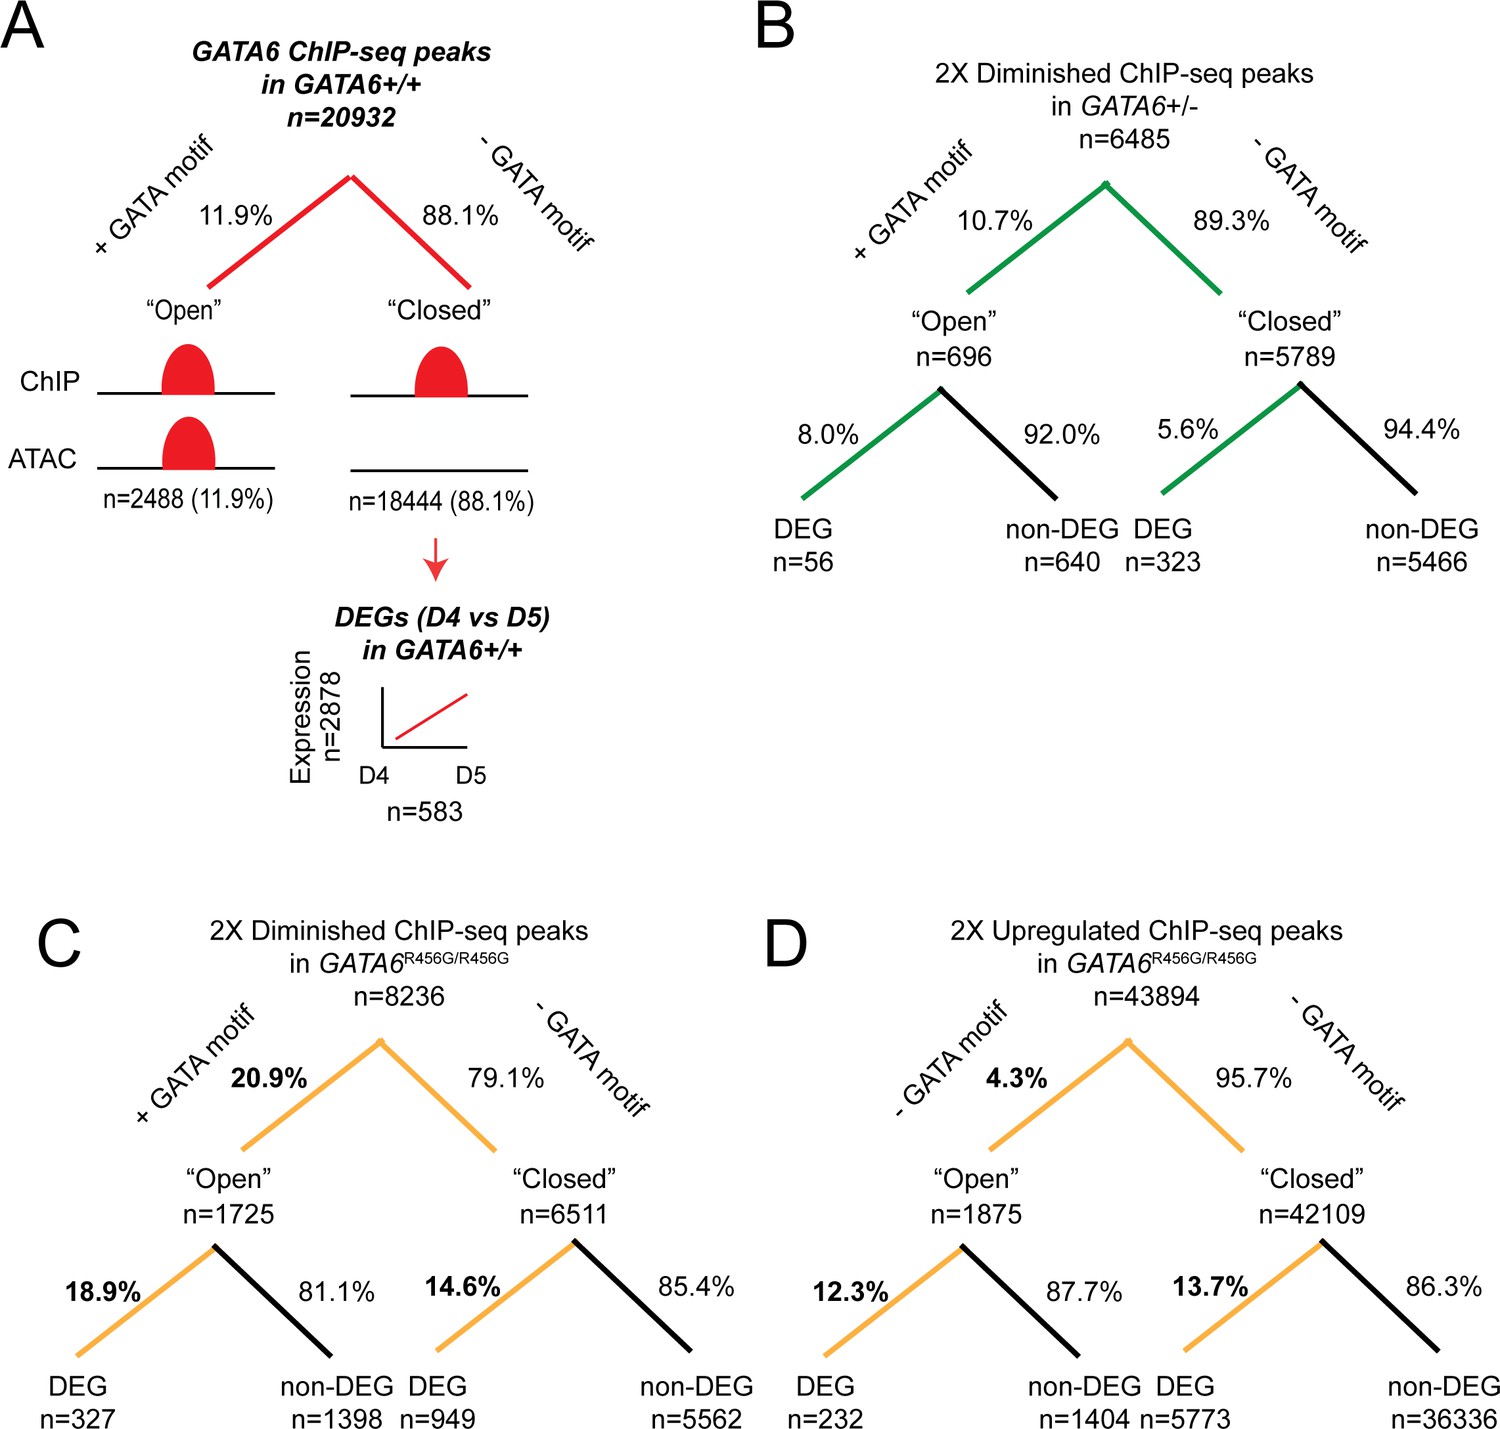
Differential gene expression analysis of GATA6-bound genes.
ChIP-seq peaks of interest were subset into regions that are ‘open’ (e.g. regions that overlapped with an ATAC-seq peak and are more likely to be associated with a GATA-binding motif) or ‘closed’ (e.g. regions that did not overlap with an ATAC-seq peak and are less likely to be associated with a GATA-binding motif). Next, each peak was associated with its nearest gene using the R package ChIP-Seeker, and differential expression of the gene sets was evaluated. Comparisons were performed using Fisher’s Exact test. (A) Overlap of GATA6 ChIP-seq peaks in WT day 4 hiPSCs with ATAC-seq data. Closed peaks were then analyzed for changes in gene expression (e.g. ‘pioneer peaks’). Of the 2878 genes that are activated between days 4 and 5, 583 genes are associated with a GATA6-bound closed peak. (B) GATA6 ChIP-seq peaks that were diminished (>2 fold, p<0.05) in GATA6+/- day 4 hiPSCs were analyzed for open chromatin overlap and differential gene expression. The majority of differential peaks were associated with closed chromatin (89.3% vs. 88.1%, p=0.011), but differential gene expression was significantly more associated with open chromatin (8.0% vs. 5.6%, p=0.013). (C) GATA6 ChIP-seq peaks that were diminished (>2 fold, p<0.05) in GATA6R456G/R456G day 4 hiPSCs were analyzed for open chromatin overlap and differential gene expression. Diminished peaks were significantly more likely to be associated with open chromatin (20.9% vs. 11.9%, p<2.2e-16), and differential ChIP-seq peaks were more likely to be associated with differential gene expression in both open and closed peaks than GATA6+/- differential ChIP-seq peaks (18.9% vs. 8.0%, p=3.4e-12 for open chromatin and 14.6% vs. 5.6%, p<2.2e-16). (D) GATA6 ChIP-seq peaks that were upregulated (>2 fold, p<0.05) in GATA6R456G/R456G day 4 hiPSCs were analyzed for open chromatin overlap and differential gene expression. Diminished peaks were significantly less likely to be associated with open chromatin (4.3% vs. 11.9%, p<2.2e-16), and differential ChIP-seq peaks were more likely to be associated with differential gene expression in both open and closed peaks than GATA6+/- differential ChIP-seq peaks (12.3% vs. 8.0%, p=1.9e-3 for open chromatin and 13.7% vs. 5.6%, p<2.2e-16).
Figure 6 with 2 supplements

Epigenetic abnormalities in GATA6+/- cells.
(A) Of the 20932 WT GATA6 ChIP-seq peaks, 39.3% were reduced in GATA6+/- cells (adjusted p<1e-4, two fold). These peaks were enriched for the GATA and EWS binding motifs by HOMER analysis. (B) Of the 17624 GATA6+/- ChIP-seq peaks, 47% were upregulated in GATA6+/- cells (adjusted p<1e-4, two fold). These peaks were enriched for the USF2 and GATA-binding motifs by HOMER analysis. (C) Peaks diminished in GATA6+/-cells were overlapped with WT ATAC-seq data to establish chromatin accessibility. Only 10.7% of peaks diminished in GATA6+/- cells were in open chromatin regions; these peaks were enriched for the GATA and SP1 motifs. (F) Peaks upregulated in GATA6R456G/R456G cells were overlapped with GATA6+/- ATAC-seq data to establish chromatin accessibility. Only 2.4% of peaks enriched in GATA6+/- cells were in open chromatin regions; these peaks were enriched for the SP1 and GATA motifs.
Figure 6—figure supplement 1
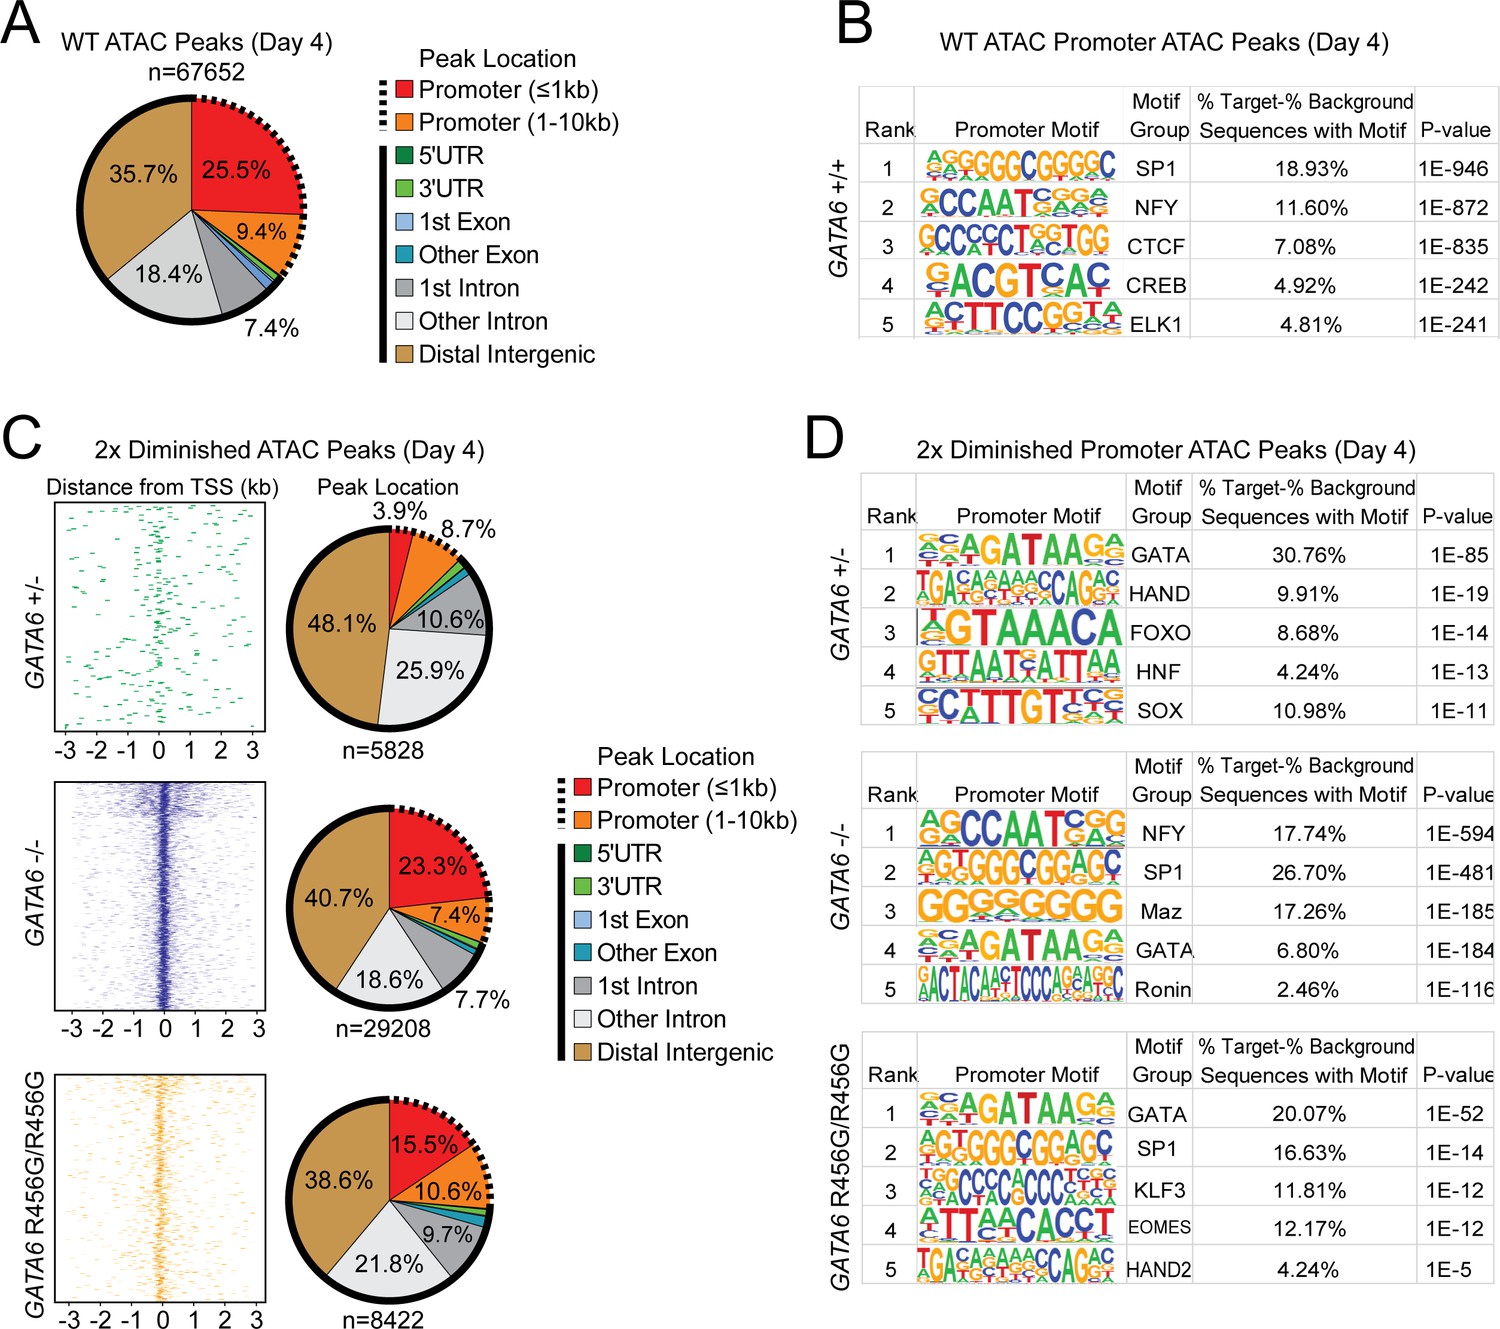
ATAC-seq analysis of cardiac genes in day 4 GATA6 LoF and GATA6R456G/R456G hiPSC-CMs.
(A) Genomic location of all WT ATAC peaks at day 4. (B) Top DNA-binding motifs as identified by HOMER found in ATAC peaks in gene promoters. (C) Genomic location of all diminished ATAC peaks (at least 2-fold reduction in peak height) in GATA6 mutants compared to WT. Solid lines indicate non-promoter peaks, dashed lines indicate promoter peaks. (D) Top DNA-binding motifs as identified by HOMER found in 2-fold diminished ATAC peaks in the promoters of downregulated genes.
Figure 6—figure supplement 2
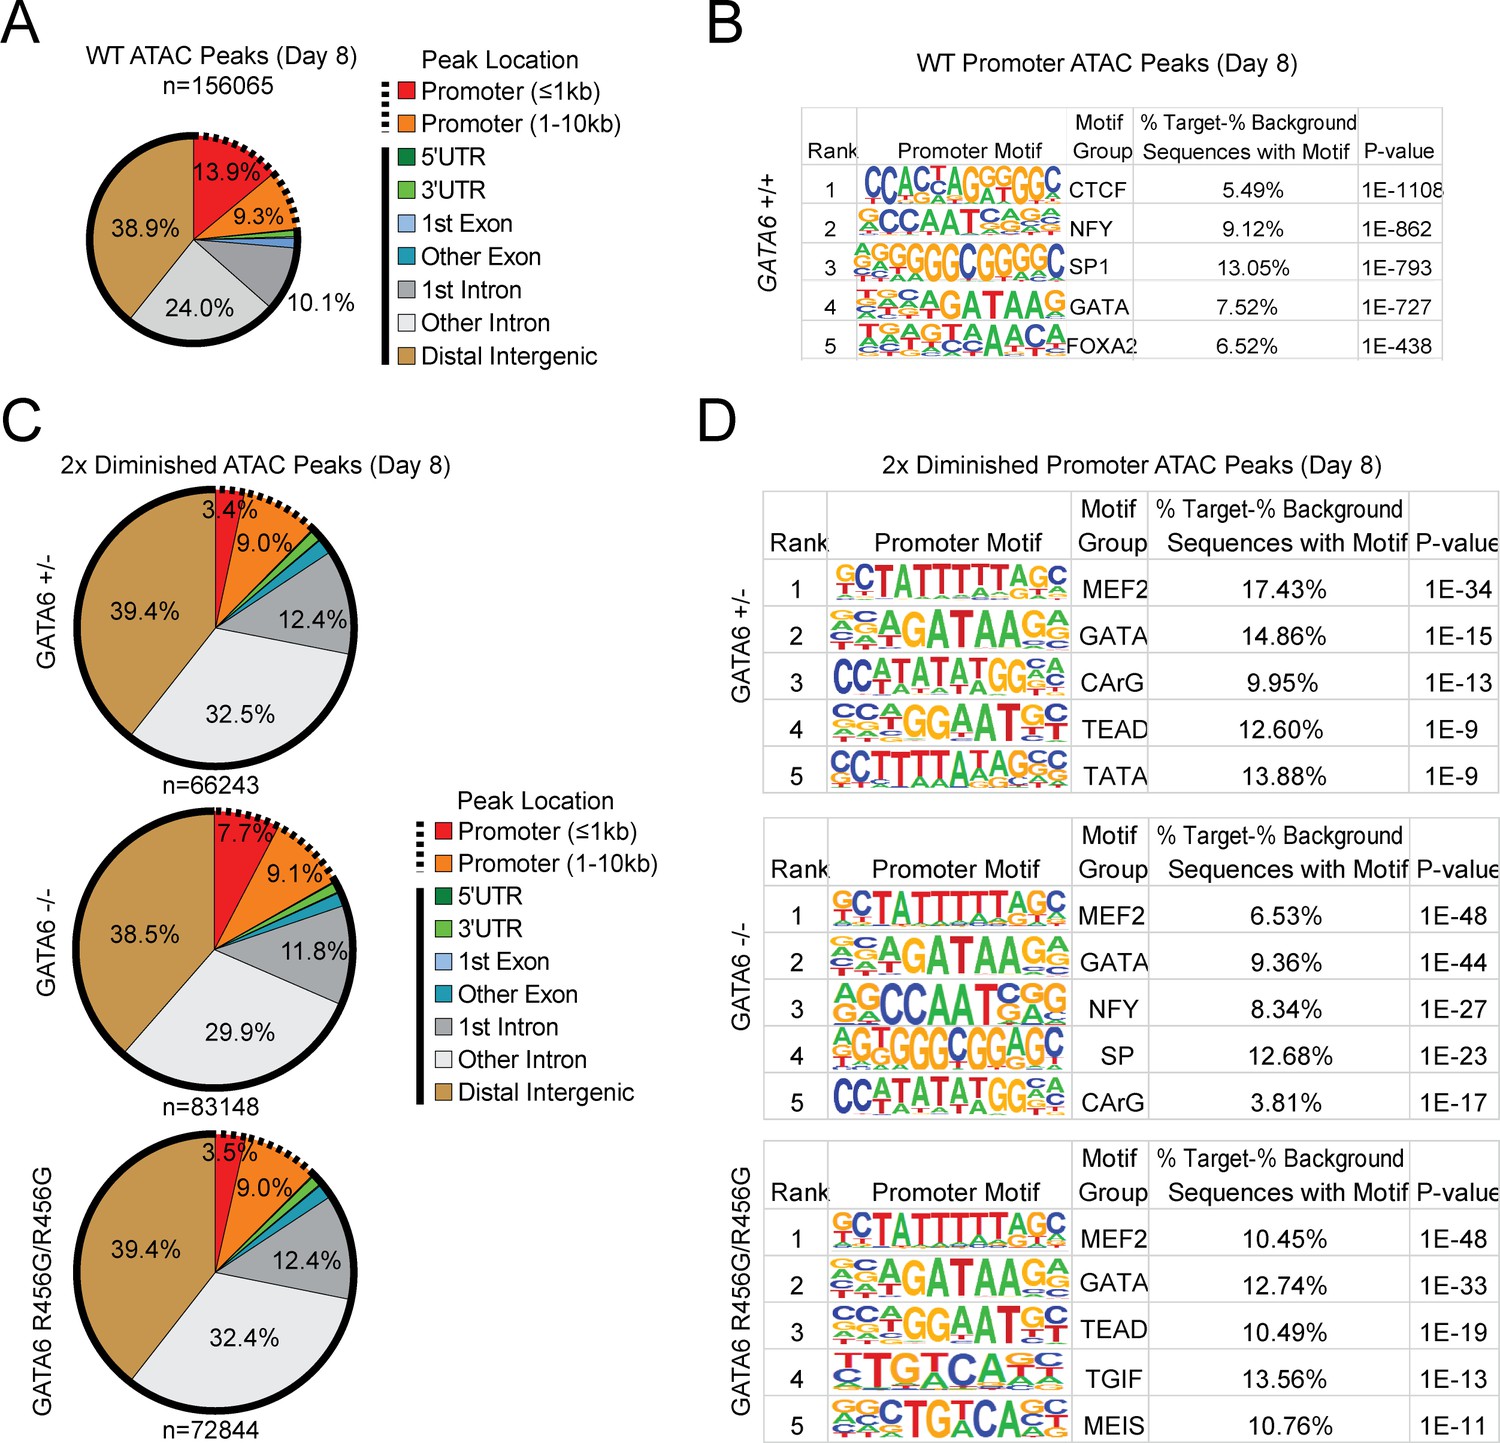
ATAC-seq analysis of cardiac genes in day 8 GATA6 LoF and GATA6R456G/R456G hiPSC-CMs.
(A) Genomic location of all WT ATAC peaks at day 4. (B) Top DNA-binding motifs as identified by HOMER found in ATAC peaks in gene promoters. (C) Genomic location of all diminished ATAC peaks (at least 2-fold reduction in peak height) in GATA6 mutants compared to WT. Solid lines indicate non-promoter peaks, dashed lines indicate promoter peaks. (D) Top DNA-binding motifs as identified by HOMER found in 2-fold diminished ATAC peaks in the promoters of downregulated genes.
Figure 7 with 2 supplements
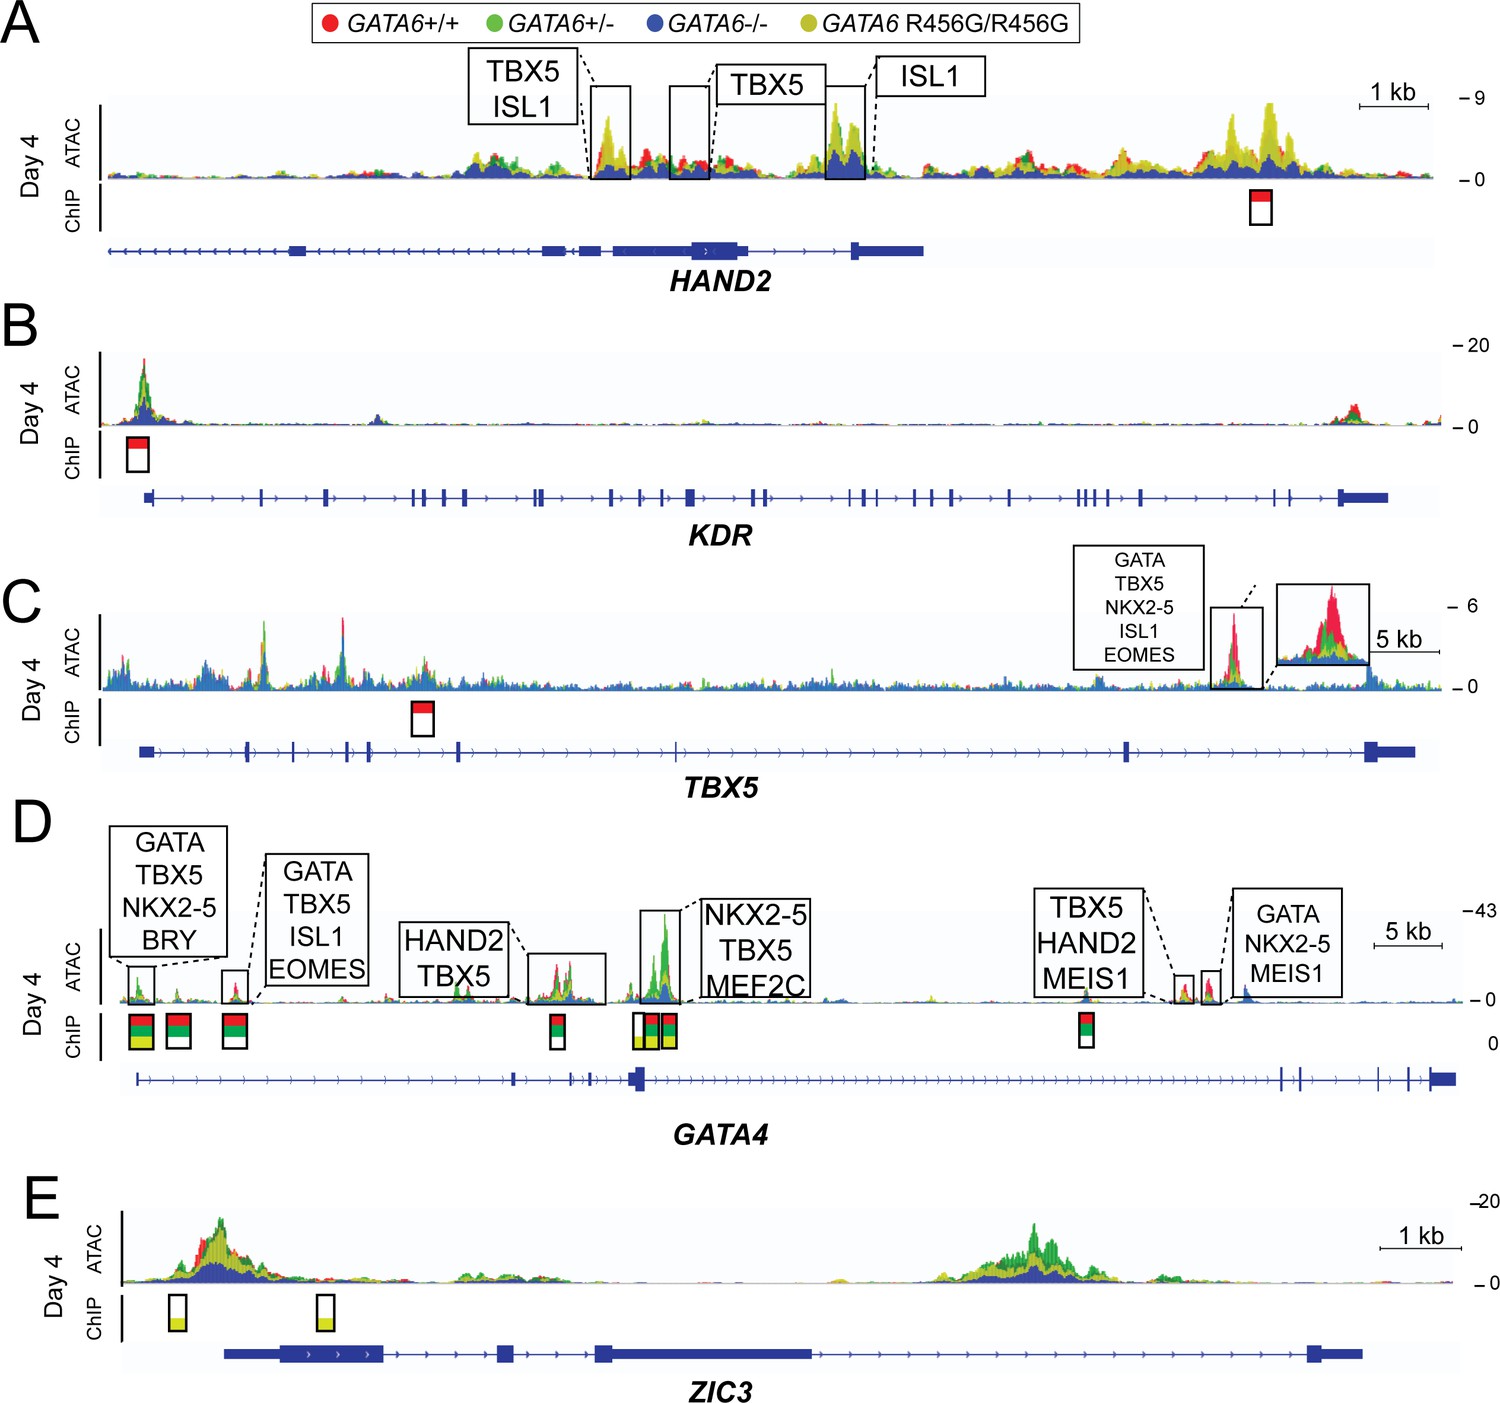
ATAC-seq and GATA6 ChIP-seq analysis of GATA6 variant hiPSC-CMs reveals aberrant binding to congenital heart disease genes.
ATAC peaks (upper), GATA6 ChIP peaks (lower) and DNA-binding motifs (upper, boxed) found in day 4 GATA6 LoF and GATA6R456G/R456G cells, visualized using the Integrative Genomics Viewer (IGV) (A) Lost GATA6 ChIP-seq peak in the HAND2 locus, with differential chromatin accessibility (ATAC-seq). (B) Lost GATA6 ChIP-seq peak at the KDR promoter, leading to reduced chromatin accessibility. (C) Lost GATA6 ChIP-seq peak in TBX5. (D) GATA6R456G does not bind the GATA4 locus in regions of open chromatin. (E) GATA6R456G ectopically binds the ZIC3 promoter.
Figure 7—figure supplement 1
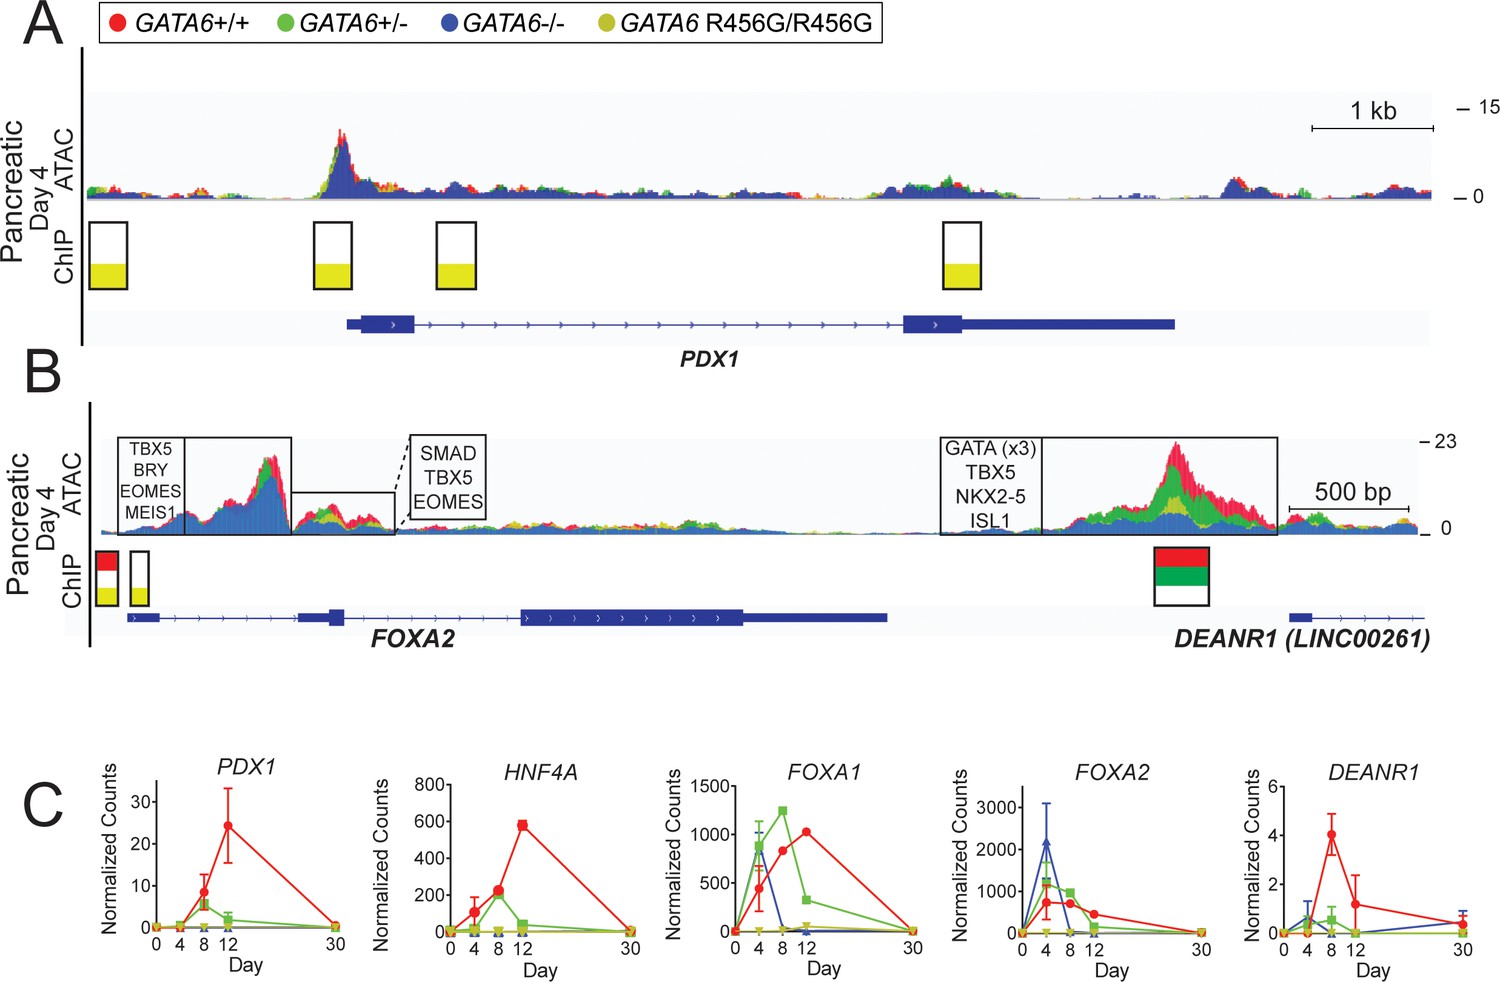
ATAC-seq and GATA6 ChIP-seq analysis of GATA6 variant hiPSC-CMs reveals misregulation of pancreatic genes.
(A) ATAC peaks (upper), GATA6 ChIP peaks (lower) found in PDX1 in day 4 GATA6 LoF and GATA6R456G/R456G hiPSC-CMs, visualized using the Integrative Genomics Viewer (IGV). (B) ATAC peaks (upper), GATA6 ChIP peaks (lower), and DNA-binding motifs (upper, boxed) found in FOXA2 in day 4 GATA6 LoF and GATA6R456G/R456G hiPSC-CMs, visualized using the Integrative Genomics Viewer (IGV). (C) Bulk RNA-seq expression of pancreatic genes in GATA6 cells throughout the course of cardiac differentiation. Data represented as mean ± SD.
Figure 7—figure supplement 2
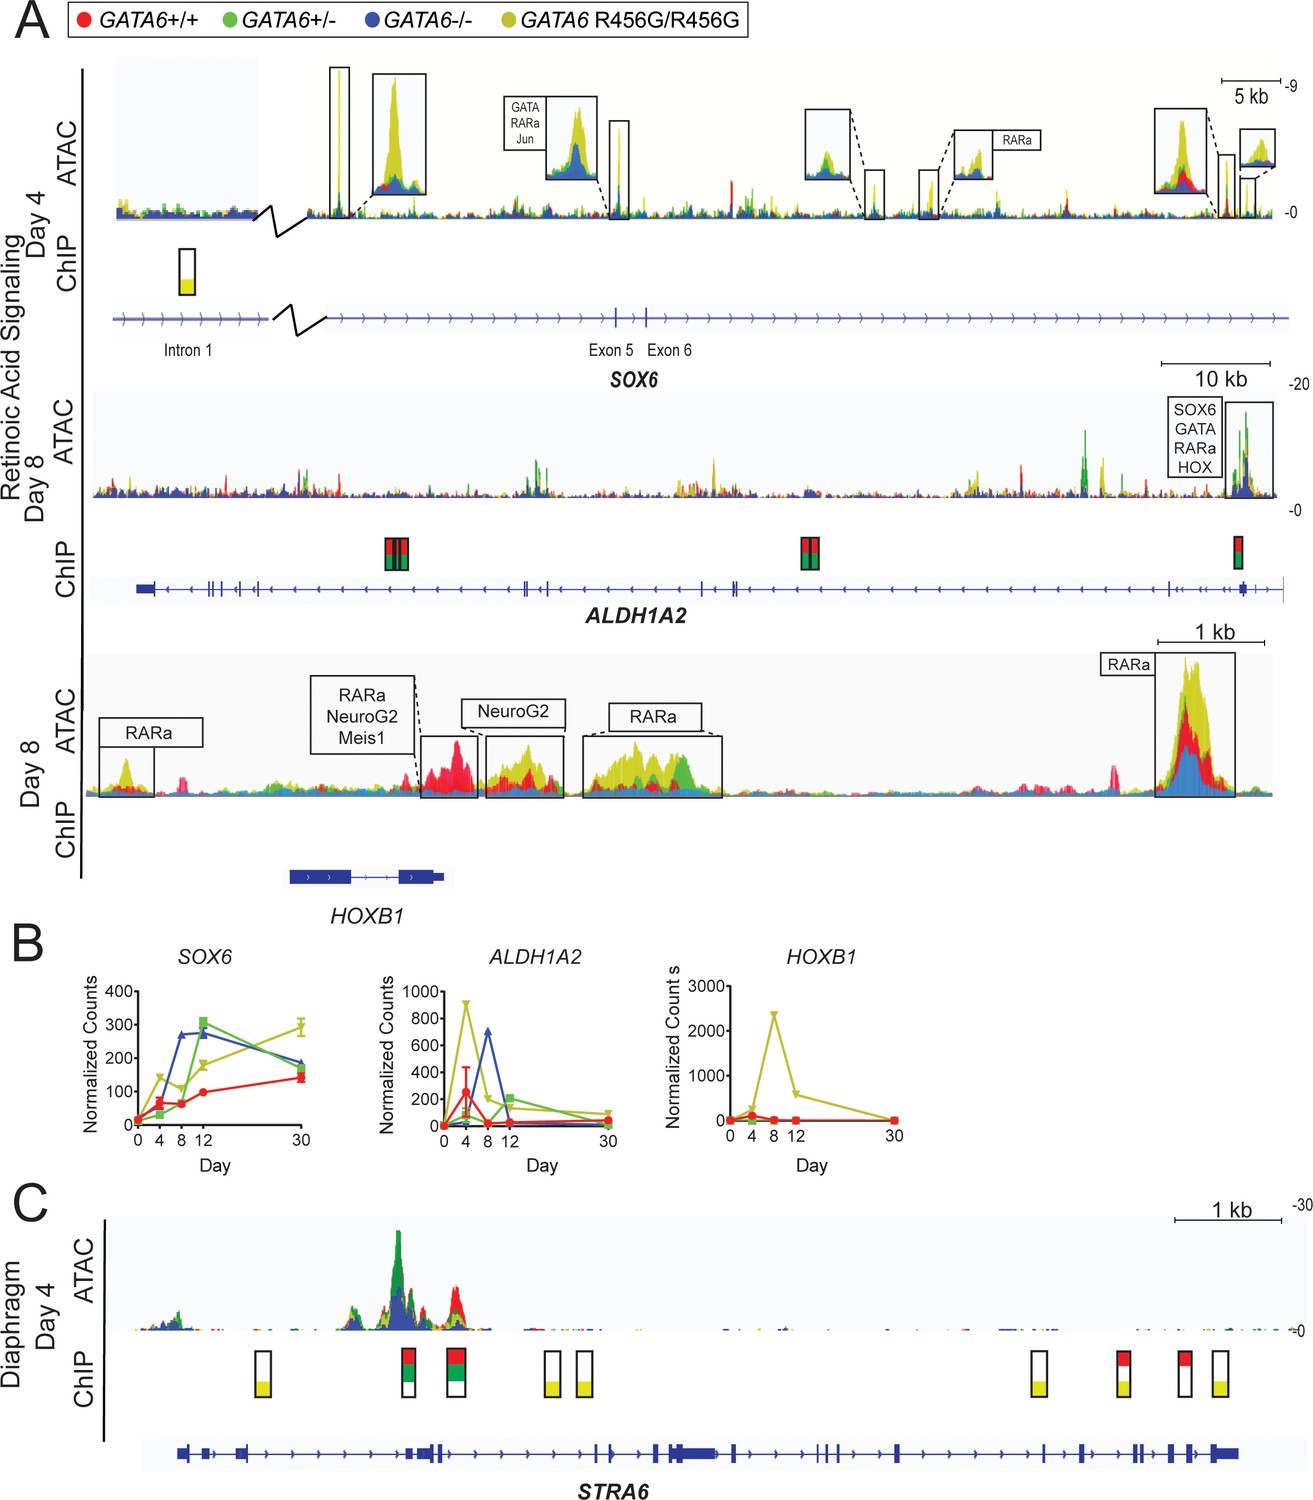
ATAC-seq and ChIP-seq of GATA6 variant hiPSC-CMs reveals altered expression and chromatin accessibility in retinoic acid signaling-related genes.
(A) Gene-level ATAC-seq and GATA6 ChIP-seq analysis of retinoic acid signaling-related and neural crest-related genes of interest at day 4 and day 8 of hiPSC-CM differentiation. Boxed regions harbor DNA-binding motifs of interest. (B) Expression of retinoic acid signaling-related and neural crest-related genes of interest via bulk RNA-Seq. Data represented as mean ± SD. (C) Gene-level ATAC-seq and GATA6 ChIP-seq analysis at diaphragm gene STRA6 at day 4 of hiPSC-CM differentiation.
Figure 8
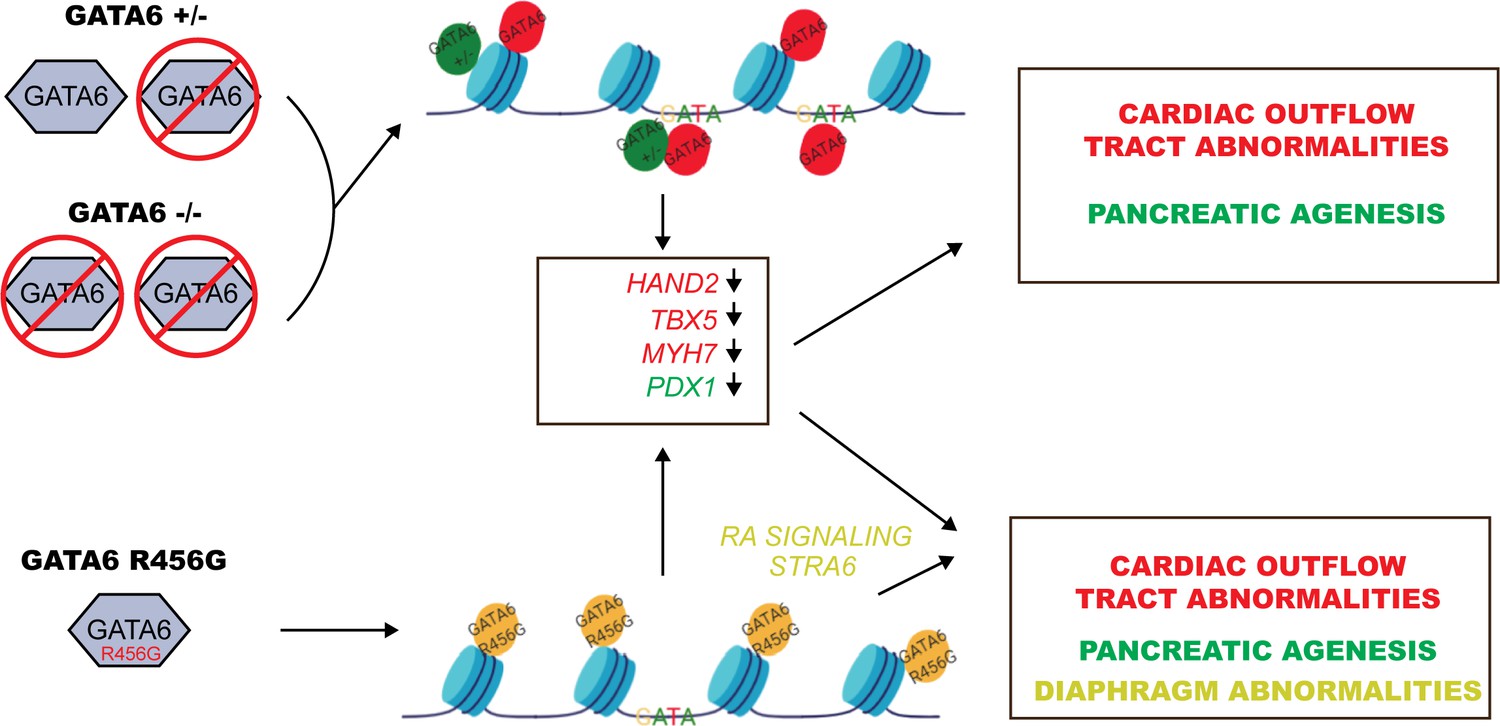
Model for GATA6 transcriptional regulation of cardiac and pancreatic gene expression (see Discussion).
ChIP-seq and ATAC-seq data of WT hiPSCs identified GATA6 bound to closed chromatin in intergenic regions without a GATA-binding motif. Moreover, GATA6 binding was associated with temporal activation of transcription in nearby genes that activate cardiomyocyte and endoderm gene network. These findings indicate that GATA6 engages chromatin and fosters a competent state for transcription factor binding and transcriptional activation, supporting the conclusion that GATA6 is a pioneer factor, as is suggested for other GATA proteins (Fisher et al., 2017). Notably, nonsense-mediated decay of GATA6+/- transcripts reduced GATA6 protein levels, altered chromatin accessibility and decreased gene transcription, implying that intergenic sites are sensitive to GATA6 dosage. In addition, GATA6 functions as a traditional transcription factor, binding GATA motifs in promoters and activating transcription. These functions were relatively insensitive to half normal GATA6 levels.
Author response image 1
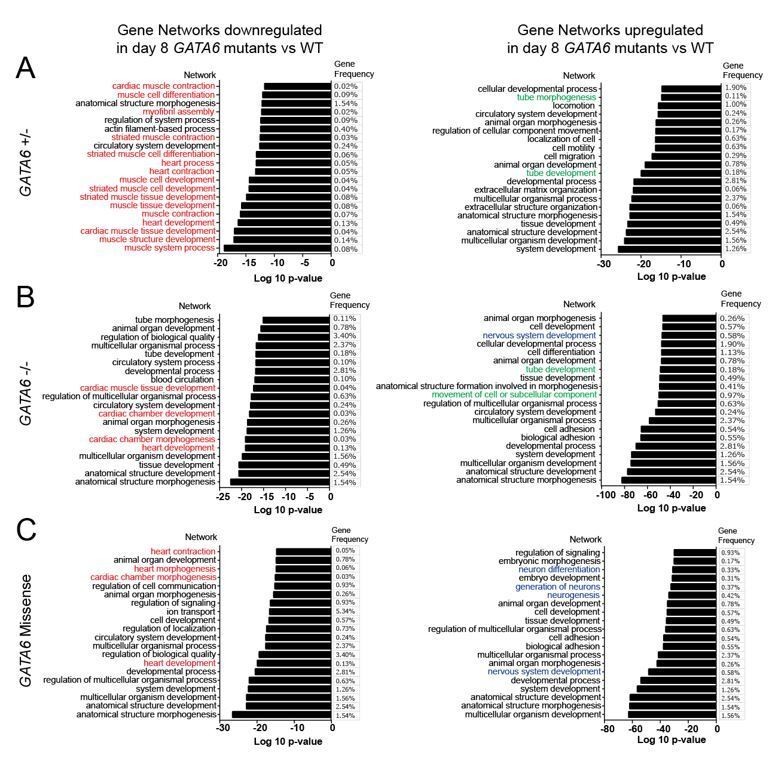
Gene ontology analysis of altered gene networks in day 8 GATA6 LoF and R456G missense cells.
Gene ontology analysis comparing wild type to GATA6 LoF or R456G cells. Downregulated cardiac gene networks of interest highlighted in red. Upregulated neurodevelopmental gene networks of interest highlighted in blue. Upregulated EMT gene networks of interest highlighted in green. Analysis conducted using gProfileR package in R and uploaded to REVIGO online software (http://revigo.irb.hr/) to generate plots of top 20 GO pathway terms by p value.
Tables
Key resources table
| Reagent type (species) or resource | Designation | Source or reference | Identifiers | Additional information |
|---|---|---|---|---|
| Cell line (human) | PGP1 | Lee et al., 2009 | GM23338 | Male; mycoplasma-free |
| Cell line (human) | TNNT2-GFP | This paper | Derived from PGP1 cell line GM23338, mycoplasma-free | |
| Commercial assay or kit | Zero Blunt TOPO PCR Cloning Kit | ThermoFisher | K280002 | |
| Commercial assay or kit | Human Stem Cell Nucleofector Kit | Lonza | VPH-5022 | |
| Commercial assay or kit | Nextera XT Sample Preparation Kit | Illumina | FC-131–1096 | |
| Commercial assay or kit | Nextera DNA Sample Kit (ATAC-seq) | Illumina | FC-121–1030 | |
| Commercial assay or kit | Tru ChIP Chromatin Shearing Hit | Covaris | 520154 | |
| Commercial assay or kit | Chromium i7 Multiplex Kit | 10X Genomics | 1000073 | |
| Commercial assay or kit | Chromium Chip B Single-Cell Kit | 10X Genomics | 1000075 | |
| Sequence-based reagent | Guide RNAs | This paper | GATA6 Exon 2 Guide 1: GAGCCCCTACTCGCCCTACG GATA6 Exon 2 Guide 2: GCCCCTACTCGCCCTACGTG GATA6 Exon 4 Guide 1: GGCGTTTCTGCGCCATAAGG | |
| Sequence-based reagent | GATA6 sequencing primers | This paper | PCR Primers | GATA6 Exon 2 Sequencing Primer Left/Forward GACGTACCACCACCACCA GATA6 Exon 2 Sequencing Primer Right/Reverse CTTACCTGCACTGGGACCC GATA6 Exon 4 Sequencing Primer Left/Forward TGAATTCACGGAGACAGGCT GATA6 Exon 4 Sequencing Primer Right/Reverse TACAAGTGAGCAGAATACATGGCA |
| Sequence-based reagent | ATAC-seq amplification oligos | Buenrostro et al., 2015 | ||
| Recombinant DNA reagent | Cas9 plasmid | Addgene | PX459v2 | |
| Chemical compound, drug | WIN 18446 | Tocris | ||
| Antibody | rabbit mono-clonal Gata6 | Cell Signaling Technology | 5851S | 10 ug/ChIP |
| Antibody | rabbit mono-clonal Gata6 | Abcam | Ab175927 | 1:1000 dilution |
| Software, algorithm | RNA-seq pipeline: bcbio-nextgen | Chapman et al., 2020 | v.1.2.3 | Hg19 |
| Software, algorithm | R Package: DESEQ2 | Love et al., 2014 | v. 2.1.18.1 | |
| Software, algorithm | R Package: Seurat | Stuart et al., 2019 | v.3.0.0 | |
| Software, algorithm | R Package: ChIP-seeker | Yu et al., 2015 | v.1.14.1 | |
| Software, algorithm | HOMER | Heinz et al., 2010 | v4.10.3 |
Additional files
-
Supplementary file 1
Damaging Variants in GATA6 and Second Heart Field Genes Associated with CHD and Extra-Cardiac Phenotypes.
- https://cdn.elifesciences.org/articles/53278/elife-53278-supp1-v2.xlsx
-
Supplementary file 2
Differential Genes Expressed in GATA6 Mutant iPSCs and iPSC-CMs.
- https://cdn.elifesciences.org/articles/53278/elife-53278-supp2-v2.xlsx
-
Supplementary file 3
RNA-Seq-based principal component analysis (PCA) for GATA6 LoF and R456G missense hiPSC-CMs during differentiation shows an enrichment for cardiac genes.
- https://cdn.elifesciences.org/articles/53278/elife-53278-supp3-v2.xlsx
-
Supplementary file 4
GATA6 ChIP-seq peaks in WT and GATA6 Mutant iPSCs and iPSC-CMs.
- https://cdn.elifesciences.org/articles/53278/elife-53278-supp4-v2.xlsx
-
Supplementary file 5
Differential Genes Expressed in WT iPSC-CMs between day 4 and day 5 of differentiation.
- https://cdn.elifesciences.org/articles/53278/elife-53278-supp5-v2.xlsx
-
Supplementary file 6
Diminished ATAC peaks (≥2 fold) in day 4 GATA6 LoF and missense cells.
- https://cdn.elifesciences.org/articles/53278/elife-53278-supp6-v2.xlsx
-
Supplementary file 7
DNA-binding motifs found in ≥2 fold diminished ATAC peaks in gene promoters (0–10 kb from TSS) of differentially expressed genes in day 4 GATA6 LoF and missense cells.
- https://cdn.elifesciences.org/articles/53278/elife-53278-supp7-v2.xlsx
-
Transparent reporting form
- https://cdn.elifesciences.org/articles/53278/elife-53278-transrepform-v2.al.docx
Download links
A two-part list of links to download the article, or parts of the article, in various formats.
Downloads (link to download the article as PDF)
Open citations (links to open the citations from this article in various online reference manager services)
Cite this article (links to download the citations from this article in formats compatible with various reference manager tools)
GATA6 mutations in hiPSCs inform mechanisms for maldevelopment of the heart, pancreas, and diaphragm
eLife 9:e53278.
https://doi.org/10.7554/eLife.53278


