Low FoxO expression in Drosophila somatosensory neurons protects dendrite growth under nutrient restriction
- Weill Institute for Cell and Molecular Biology and Department of Molecular Biology and Genetics, Cornell University, United States
Figures
Figure 1 with 3 supplements
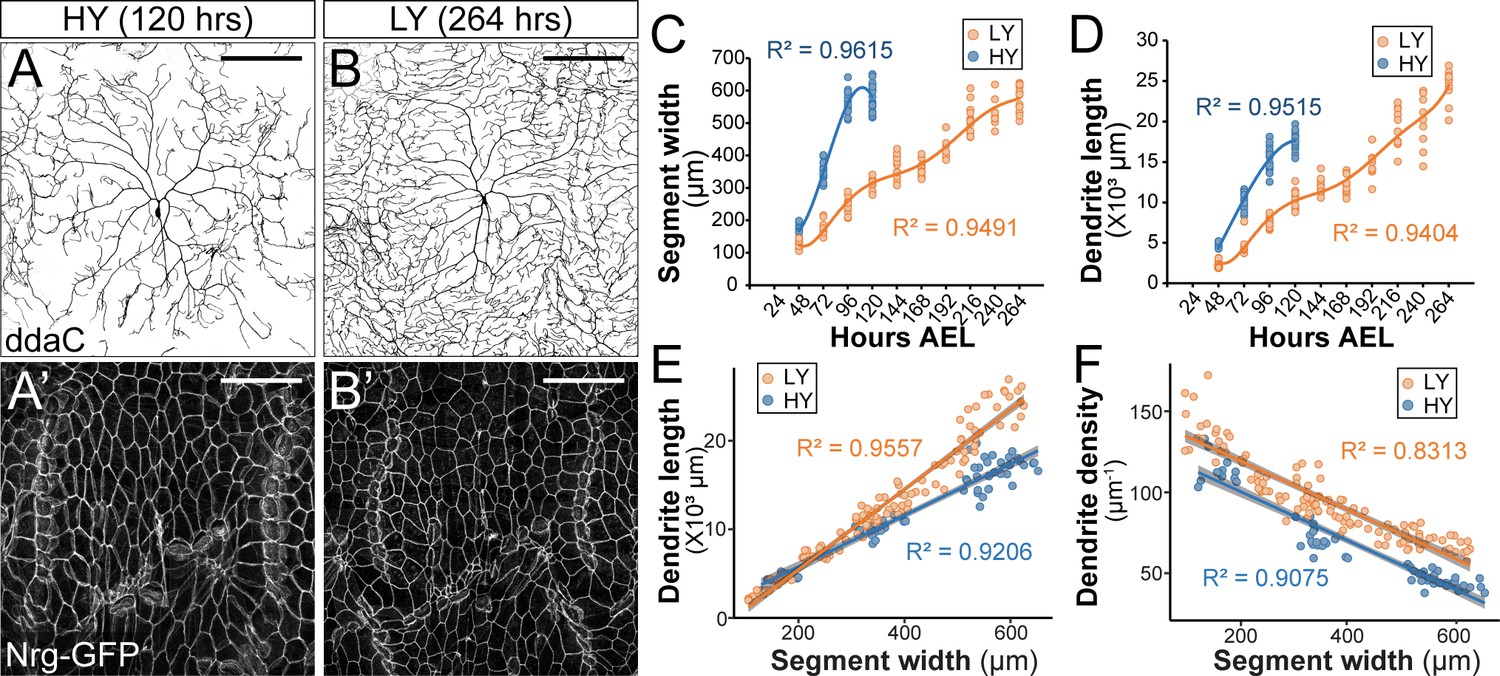
Nutrient restriction affects the growth of epidermal cells and C4da neurons differentially.
(A–B’) Double labeling of ddaC neurons by ppk-CD4-tdTom (A and B) and epidermal cells by the septate junction marker Nrg-GFP (A’ and B’) in the high yeast (HY, 8%) condition at 120 hr after egg laying (AEL) (A and A’) and in the low yeast (LY, 1%) condition at 264 hr AEL (B and B’). (C and D) Plots of segment width (C) and total dendrite length of ddaC neurons (D) versus time in HY and LY conditions. (E and F) Plots of total dendrite length (p≪0.05) (E) and dendrite density (total dendrite length/dendrite coverage area, p≪0.05) (F) with segment width in HY and LY conditions. Each circle represents a segment in (C) and a ddaC neuron in (D–F); n = 63 for HY; n = 115 for LY. Solid lines represent polynomial fits in (C) and (D) and linear fits in (E) and (F). R2 represents coefficient of determination of the linear regression. Gray shading in (E) and (F) represents a 0.95 confidence interval (CI) of the linear model. p-value represents the possibility that the slopes of two yeast conditions are the same. Scale bars, 100 μm.
-
Figure 1—source data 1
Larvae growth data for Figure 1 and Figure 1—figure supplement 1, 2, 3.
- https://cdn.elifesciences.org/articles/53351/elife-53351-fig1-data1-v2.xlsx
Figure 1—figure supplement 1
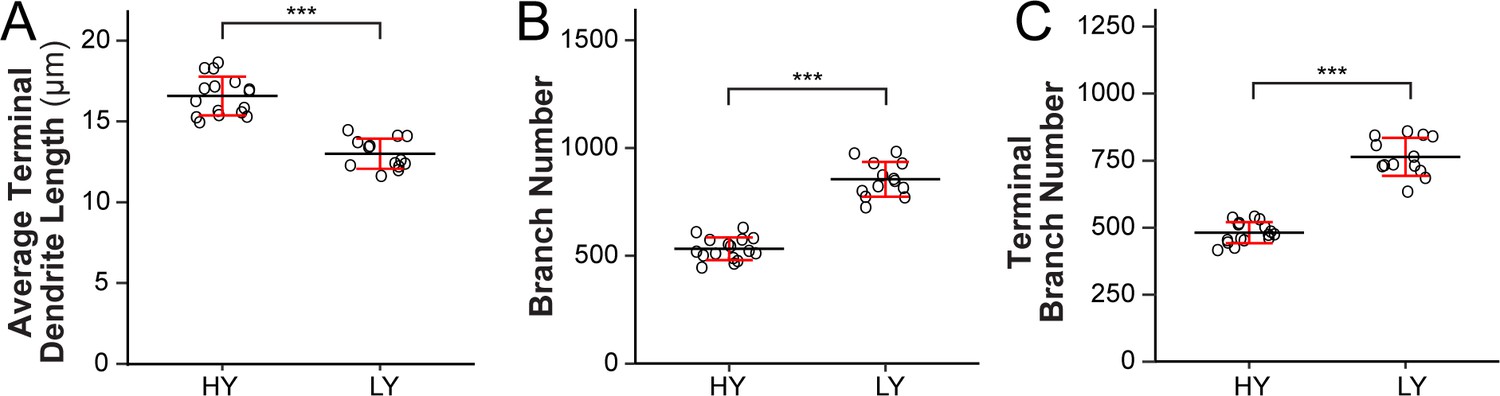
The effects of nutrient restriction on dendrite growth of C4da neurons.
(A–C) Quantification of average terminal dendrite length (A), branch number (B) and terminal branch number (C) of C4da neurons in HY at 120 hr AEL and in LY at 264 hr AEL. n = 16 for HY, n = 14 for LY. ***p<0.001, Student’s t test.
Figure 1—figure supplement 2
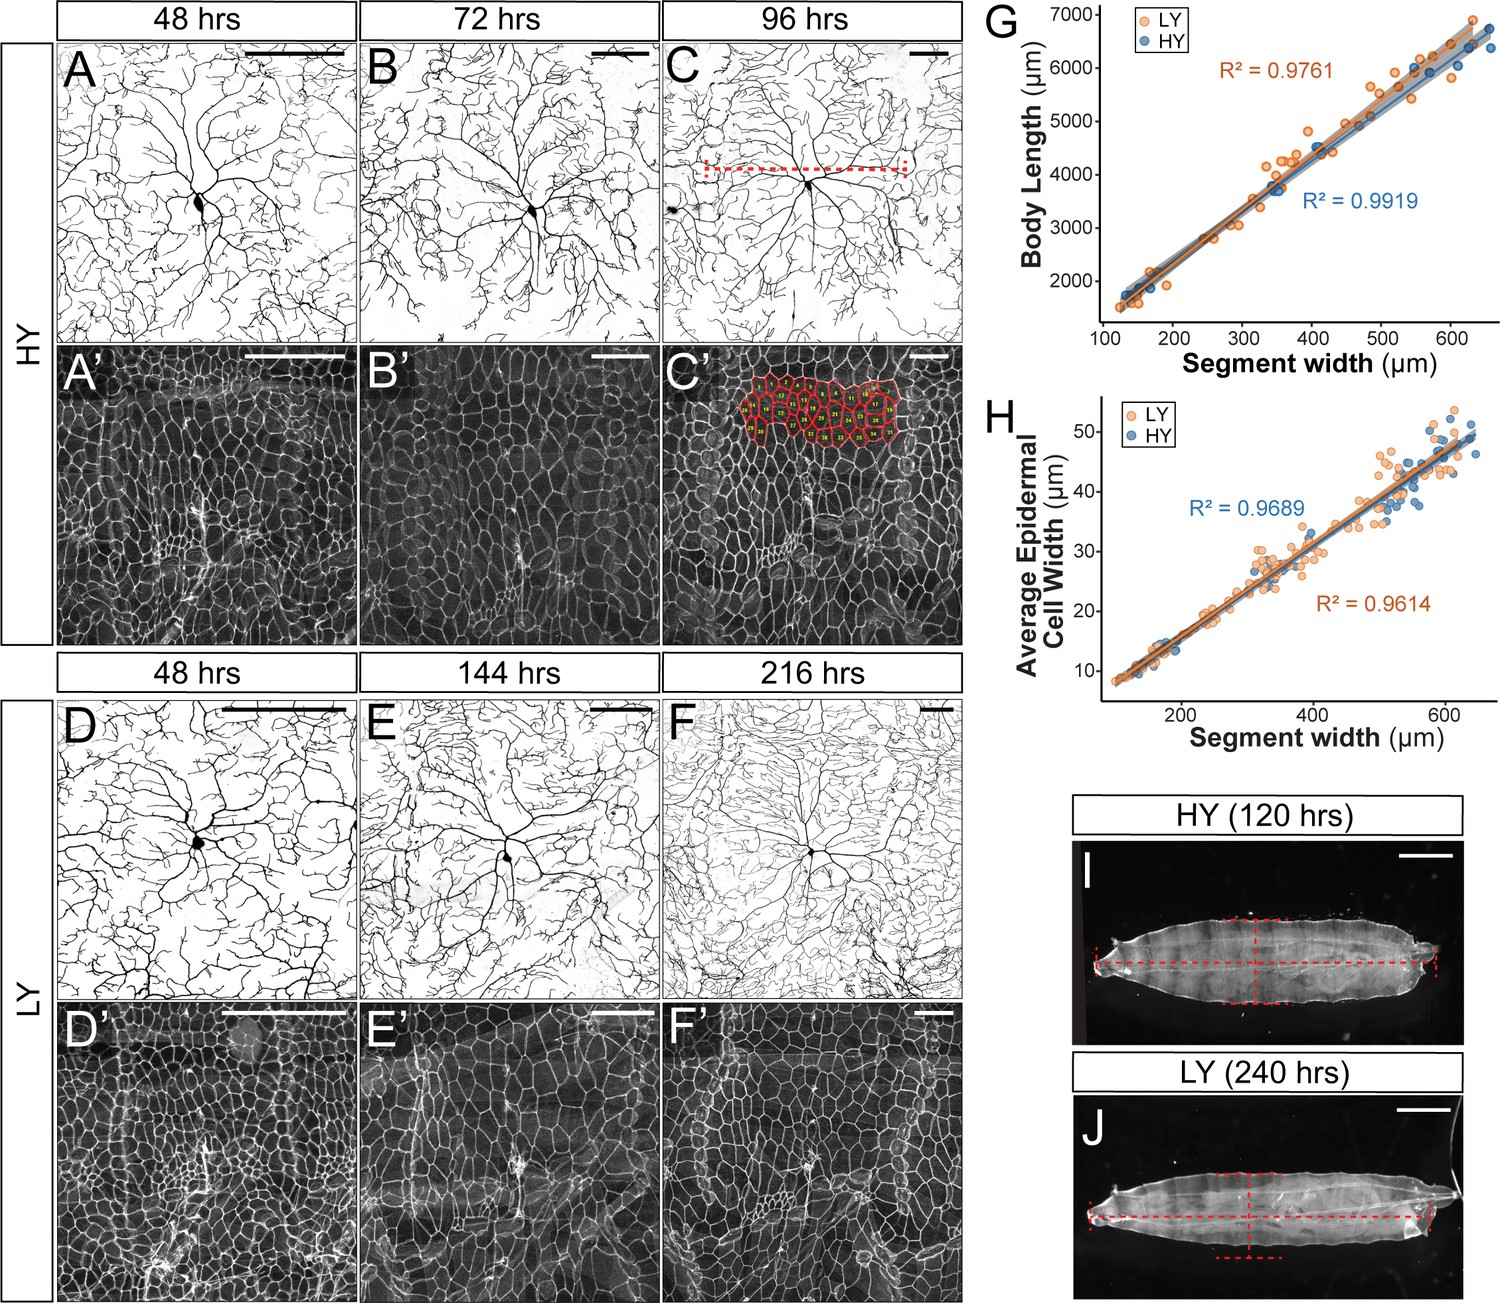
Development of C4da neurons and epidermal cells in high and low yeast.
(A–F’) Double labeling of ddaC neurons by ppk-CD4-tdTom (A–F) and epidermal cells by Nrg-GFP (A’–F’) in HY and LY conditions at times indicated. The red dotted line in (C) indicates how the segment width is measured. The measured epidermal cells are outlined in (C’). (G and H) Plots of body length (p>0.05) (G) and average epidermal cell width (p>0.05) (H) with segment width in HY and LY conditions. Each circle represents a segment; n = 63 for HY; n = 115 for LY. Solid lines represent linear fits. R2 represents coefficient of determination of the linear regression. Gray shading in (G) and (H) represents a 0.95 confidence interval (CI) of the linear model. p-value represents the possibility that the slopes of two yeast conditions are the same. (I and J) Representative animals at 120 hr AEL in HY condition (I) and at 240 hr AEL in LY condition (J). The red dotted lines match the body width and length of the larva in HY. Scale bars, 100 μm in (A–F’), 300 μm in (I) and (J).
Figure 1—figure supplement 3
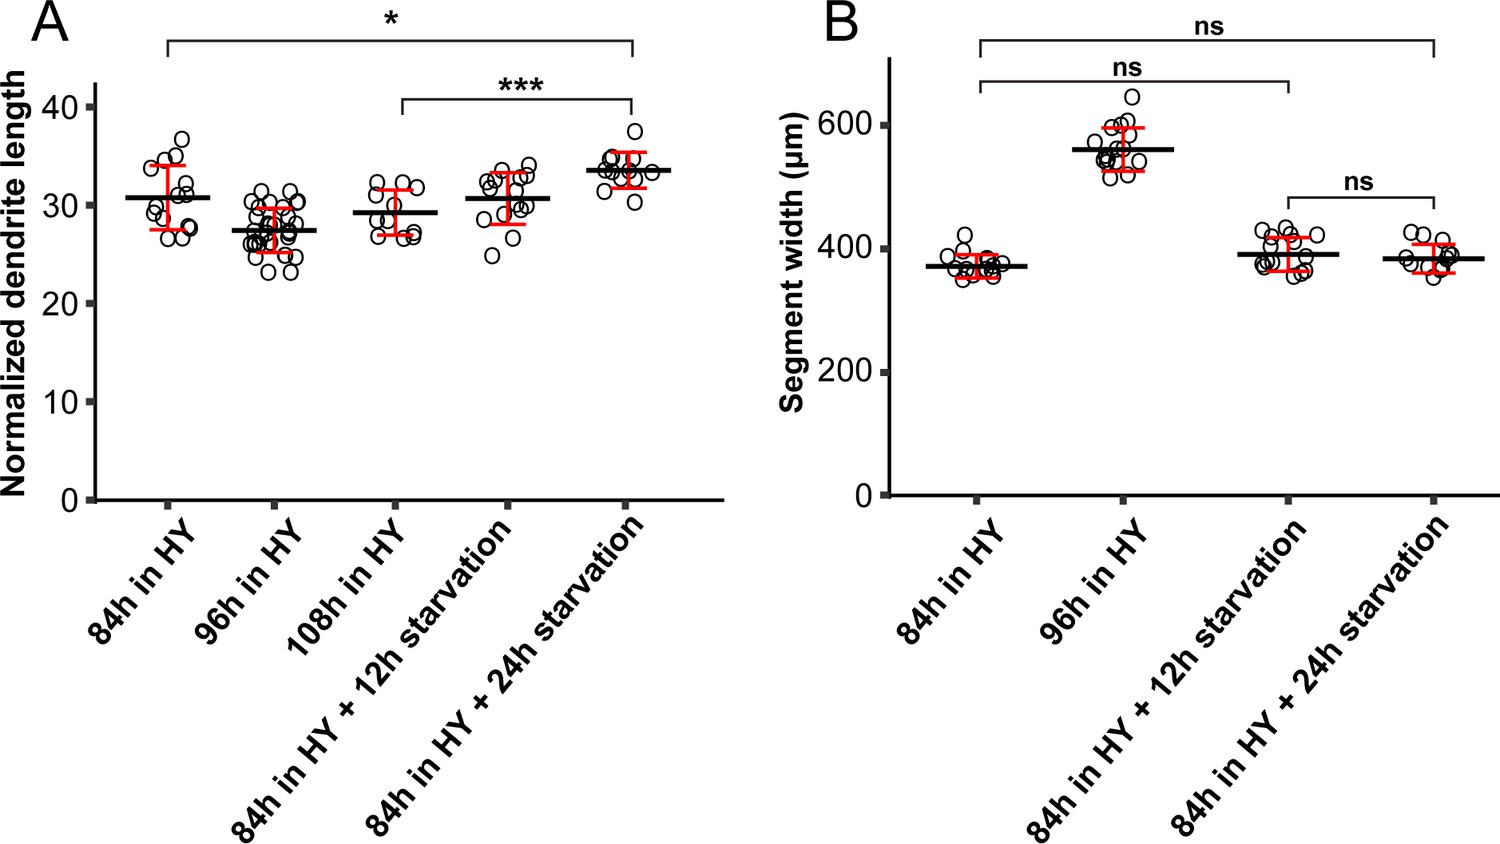
Growth of the larval body and C4da neurons under starvation.
(A) Quantification of normalized dendrite length before and after starvation. n = 14 for 84 hr AEL in HY; n = 31 for 96 hr AEL in HY; n = 11 for 108 hr AEL in HY; n = 15 for 84 hr AEL + 12 hr starvation; n = 12 for 84 hr AEL + 24 hr starvation. (B) Quantification of segment width before and after starvation. n = 14 for 84 hr AEL in HY; n = 31 for 96 hr AEL in HY; n = 15 for 84 hr AEL + 12 hr starvation; n = 12 for 84 hr AEL + 24 hr starvation. ***p<0.001; *p<0.05; ns, not significant. One-way ANOVA and Tukey’s HSD test. Each circle represents a neuron. Black bars, mean; red bars, SD.
Figure 2 with 1 supplement
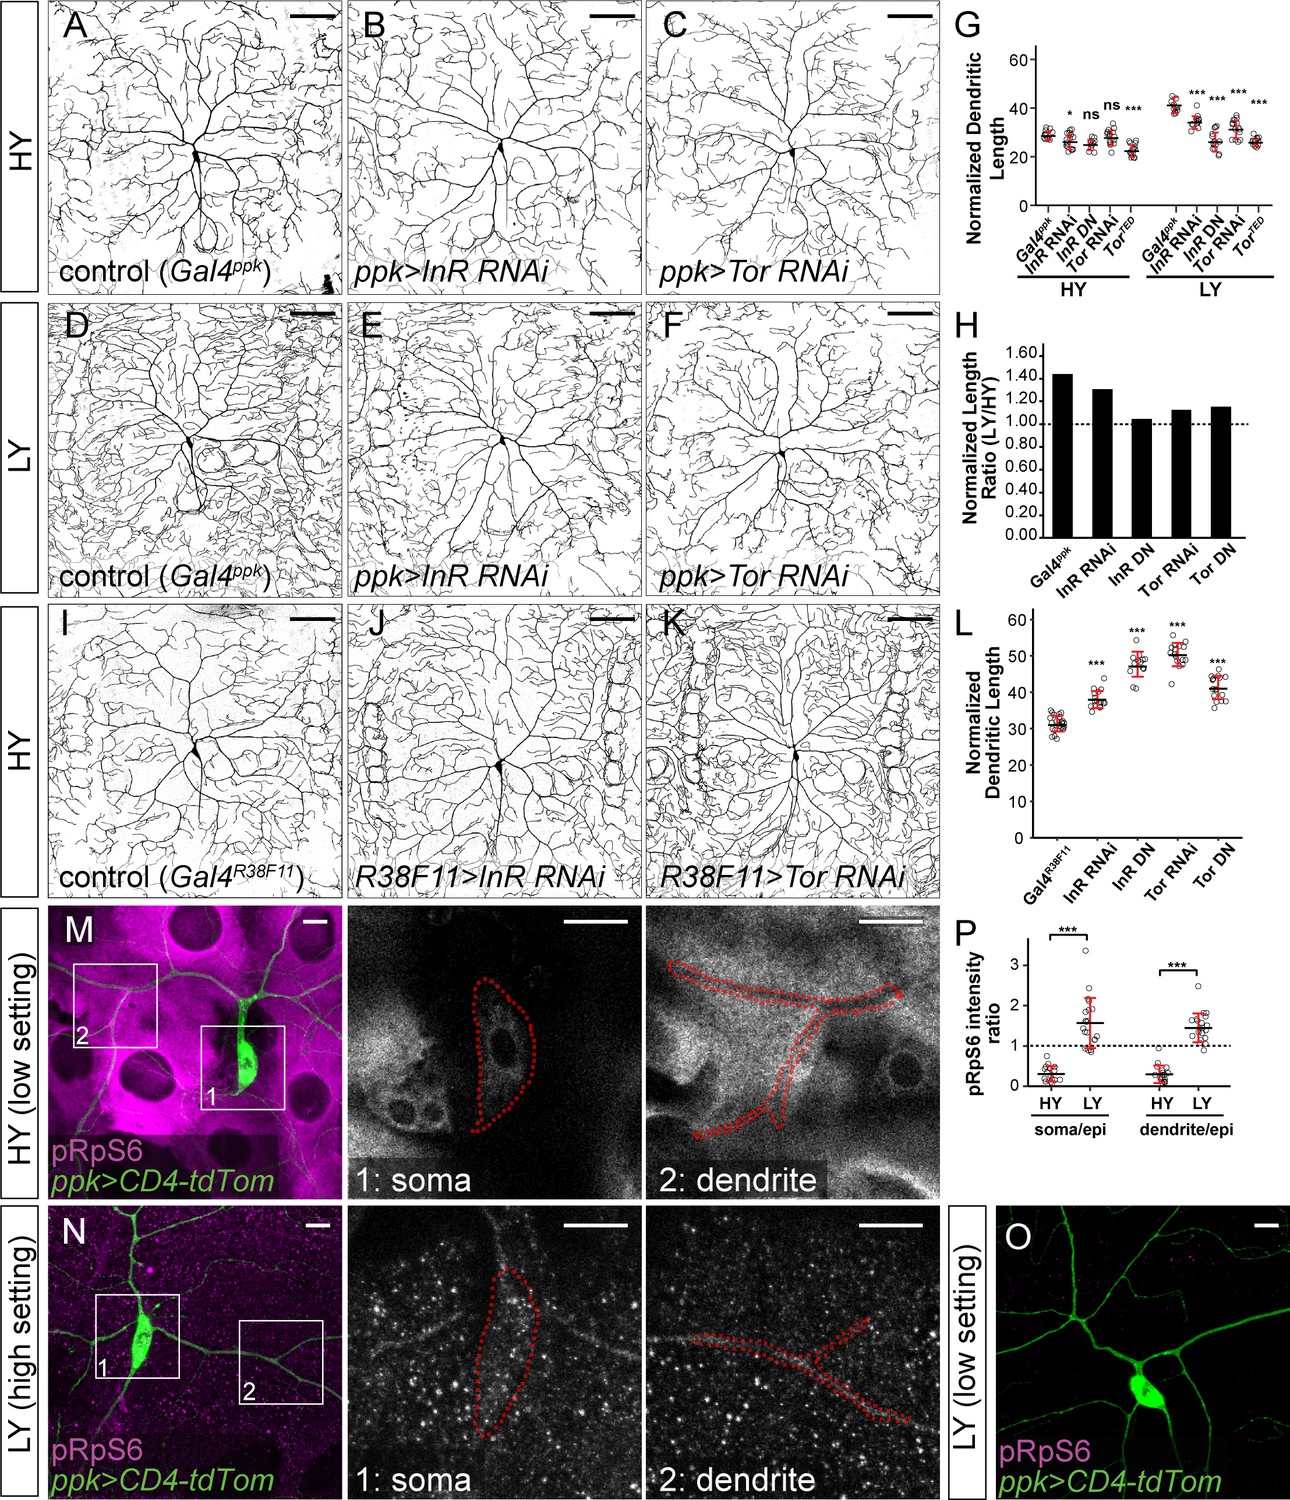
The InR-Tor pathway underlies the preferential neuronal growth under nutrient stress.
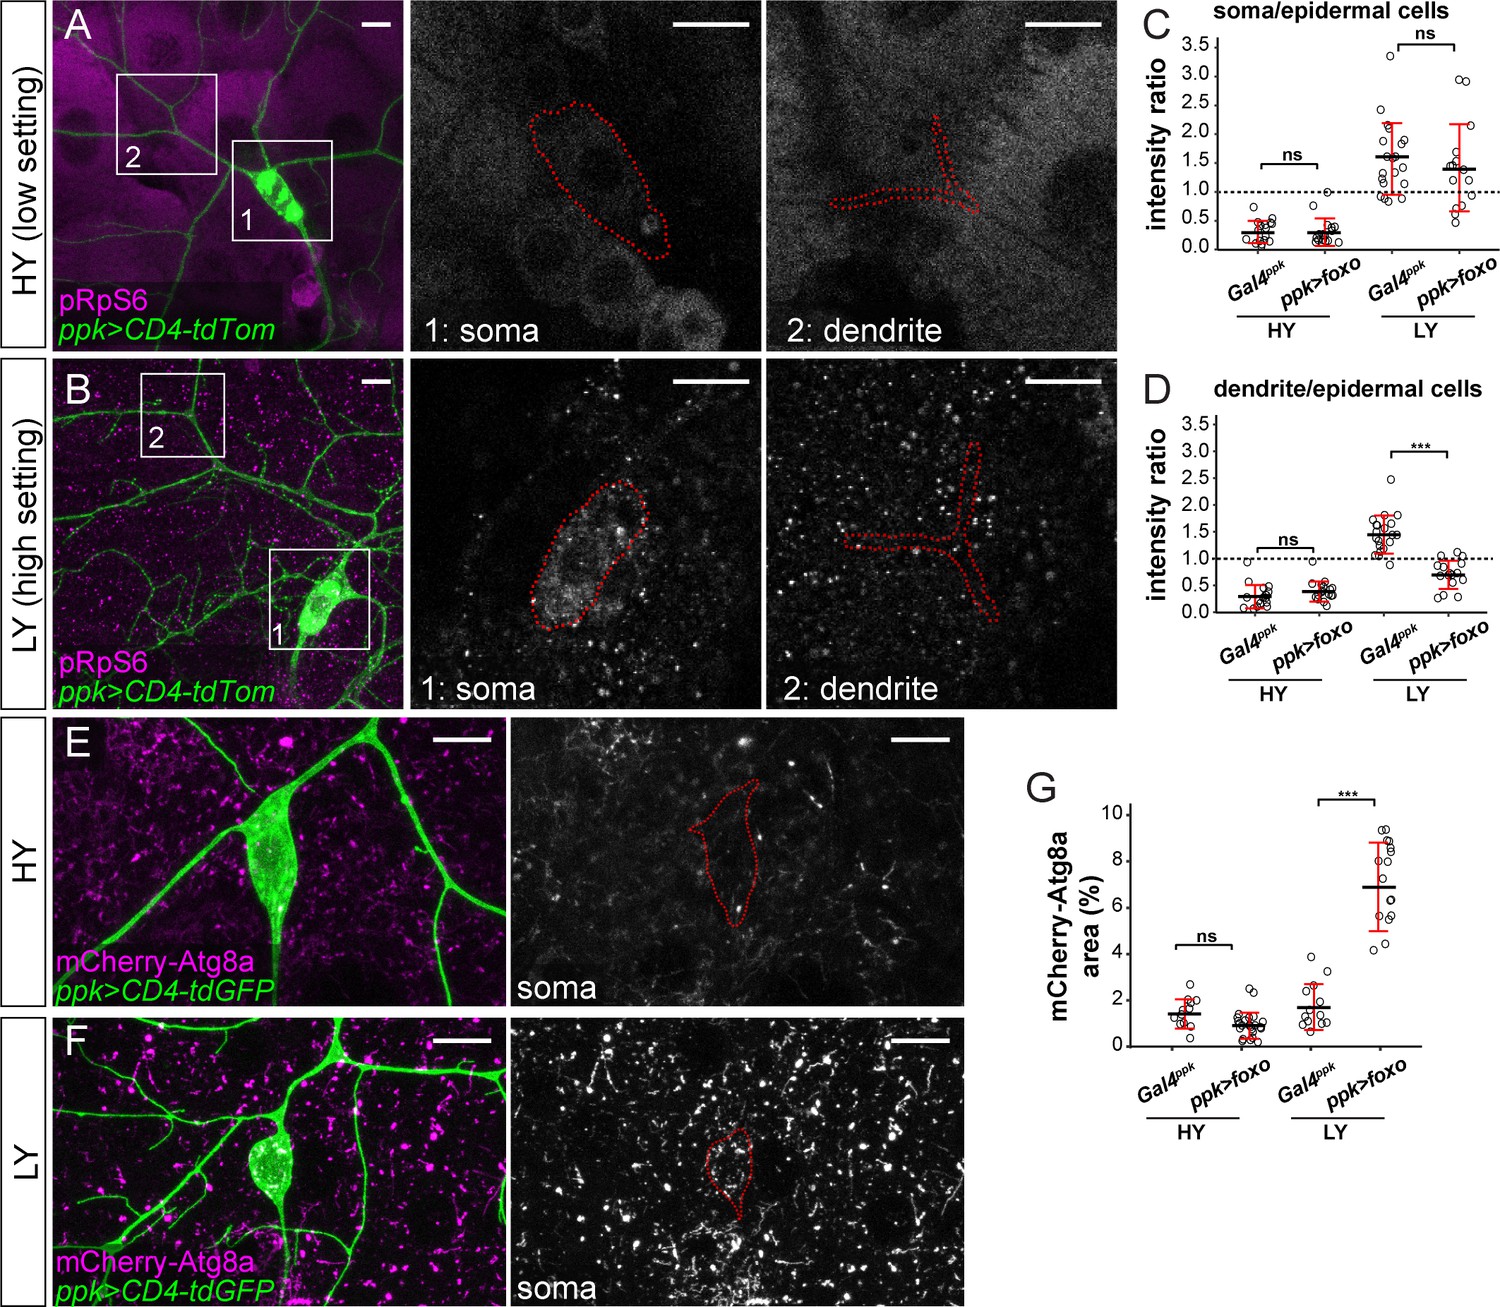
(A–F) ddaC neurons in the Gal4ppk control (A and D) and animals expressing Gal4ppk-driven InR RNAi (B and E) and Tor RNAi (C and F) in HY and LY conditions. (G) Quantification of normalized dendrite length (total dendrite length/segment width) in HY and LY conditions. HY: n = 14 for Gal4ppk, n = 15 for InR RNAi, n = 11 for InR DN, n = 15 for Tor RNAi, n = 15 for Tor DN; LY: n = 14 for Gal4ppk, n = 12 for InR RNAi, n = 14 for InR DN, n = 15 for Tor RNAi, n = 15 for Tor DN. Two-way ANOVA, Posthoc contrasts with a Dunnett correction. The differences between control and InR RNAi under HY and LY conditions are significantly different as indicated by a significant interaction term (p=0.003924), the same for InR DN (p=8.581e-09), Tor RNAi (p=5.876e-07) and Tor DN (p=1.062e-09). (H) The ratios of average normalized dendrite length between LY and HY. (I–K) ddaC neurons in the Gal4R38F11 control (I) and animals expressing Gal4R38F11-driven InR RNAi (J) and Tor RNAi (K) in HY condition. (L) Quantification of normalized dendrite length in e Gal4R38F11-driven knockdown and overexpression. n = 23 for Gal4R38F11, n = 17 for InR RNAi, n = 17 for InR DN, n = 16 for Tor RNAi, n = 17 for Tor DN. One-way ANOVA and Tukey’s HSD test. (M–O) pRpS6 staining (magenta) of ddaC neurons (Green) and epidermal cells in HY and LY conditions in 2-dimensional (2D) projections. The insets in (M) and (N) show pRpS6 staining at the soma (1) and primary dendrites (2) in single confocal sections, with the somas and dendrites outlined. High settings and low settings stand for high and low pRpS6 detection settings. (P) Quantification of pRpS6 intensity ratio (soma/epidermal cells and dendrites/epidermal cells) in HY and LY conditions. Soma/epi: n = 17 for HY, n = 20 for LY; dendrites/epi: n = 16 for HY, n = 20 for LY. Two-way ANOVA. The differences between HY and LY in soma and dendrites are not significantly different as indicated by a non-significant interaction term (p=0.5592). For all quantifications, ***p<0.001; *p<0.05; ns, not significant. each circle represents a neuron. Significance level is for comparison between the control and the genotype indicated under the same food condition. Black bars, mean; red bars, SD. Scale bars, 100 μm in (A–K); 10 μm in (M–O).
-
Figure 2—source data 1
InR-Tor pathway manipulation data for Figure 2 and Figure 2—figure supplement 1.
- https://cdn.elifesciences.org/articles/53351/elife-53351-fig2-data1-v2.xlsx
Figure 2—figure supplement 1
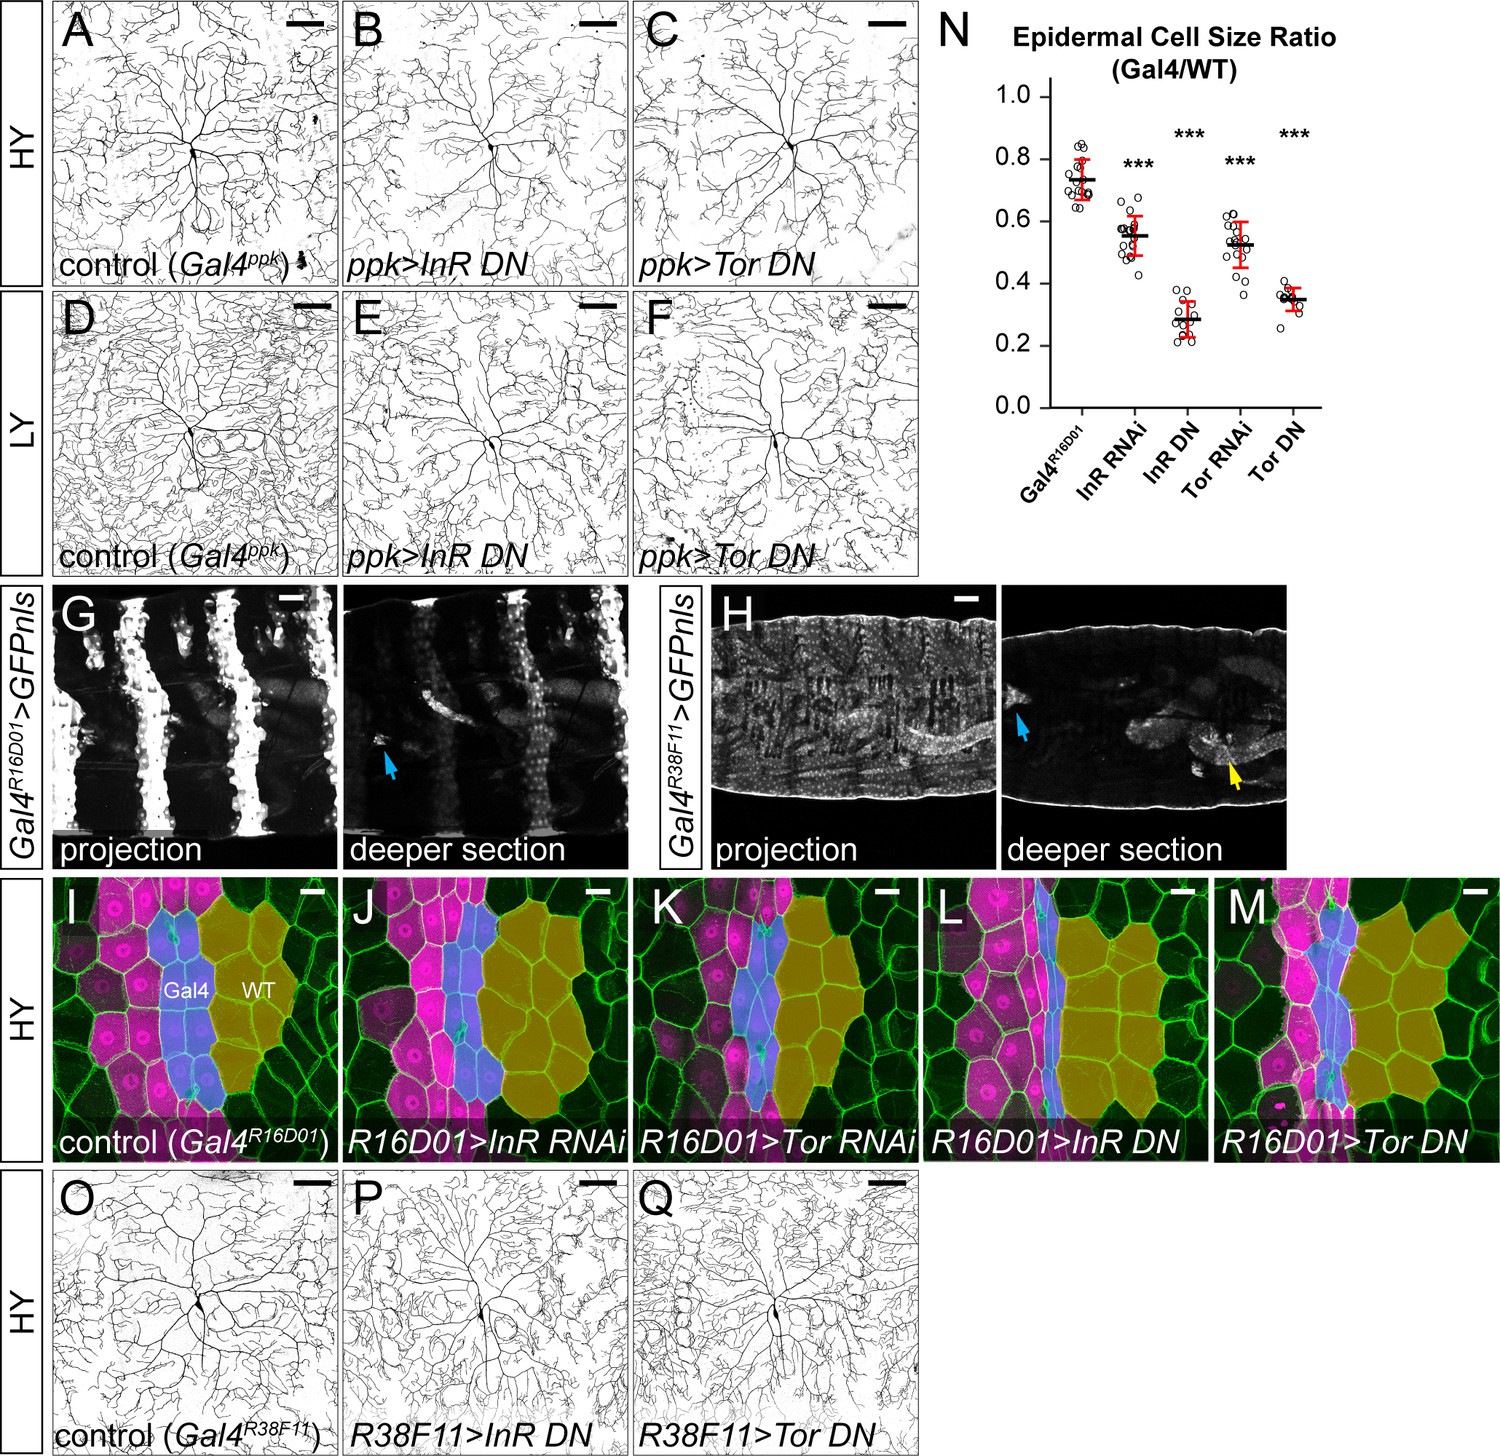
The effects of suppressing InR and Tor in ddaC neurons and epidermal cells in HY and LY conditions.
(A–F) ddaC neurons in the Gal4ppk control (A and D) and animals expressing Gal4ppk-driven InR DN (B and E) and Tor DN (C and F) in HY and LY conditions. (G) Larval body expression patterns of Gal4R16D01 > GFPnls in both maximum projection and a deeper section. The arrow indicates expression in an internal organ in the head region. Gal4R16D01 is also expressed in fewer than 20 neurons in the brain (FlyLight database). (H) Larval body expression patterns of Gal4R38F11 > GFPnls in both maximum projection and a deeper section. The cyan and yellow arrows indicate expression in an internal organ in the head region and in the hindgut, respectively. Gal4R38F11 is also expressed in a small number of sparse neurons in the brain (FlyLight database). (I–M) Epidermal cells in the Gal4R16D01 control (I) and animals expressing Gal4R16D01-driven InR RNAi (J), Tor RNAi (K), InR DN (L) and Tor DN (M) in the HY condition. Gal4R16D01 domain is labeled by mIFP expression (magenta). All epidermal cells are labeled by Nrg-GFP (green). The blue and yellow overlays indicate the measured Gal4-expressing and wildtype (WT) epidermal cells, respectively. (N) Quantification of epidermal cell size ratio (Gal4R16D01 cells/WT cells). Each circle represents a segment; n = 18 for GalR16D01, n = 20 for InR RNAi, n = 14 for InR DN, n = 18 for Tor RNAi, n = 14 for Tor DN. ***p<0.001; One-way ANOVA and Tukey’s HSD test. Significance level is for comparison between the control and the genotype indicated under the same food condition. Black bars, mean; red bars, SD. (O–Q) ddaC neurons in the Gal4R38F11 control (O) and animals expressing Gal4R38F11-driven InR DN (P) and Tor DN (Q) in the HY condition. (A), (D), (O) are the same as Figures 2A, D and I, respectively. Scale bars, 100 μm in (A–F) and (O–Q), 50 μm in (G–M).
Figure 3 with 2 supplements
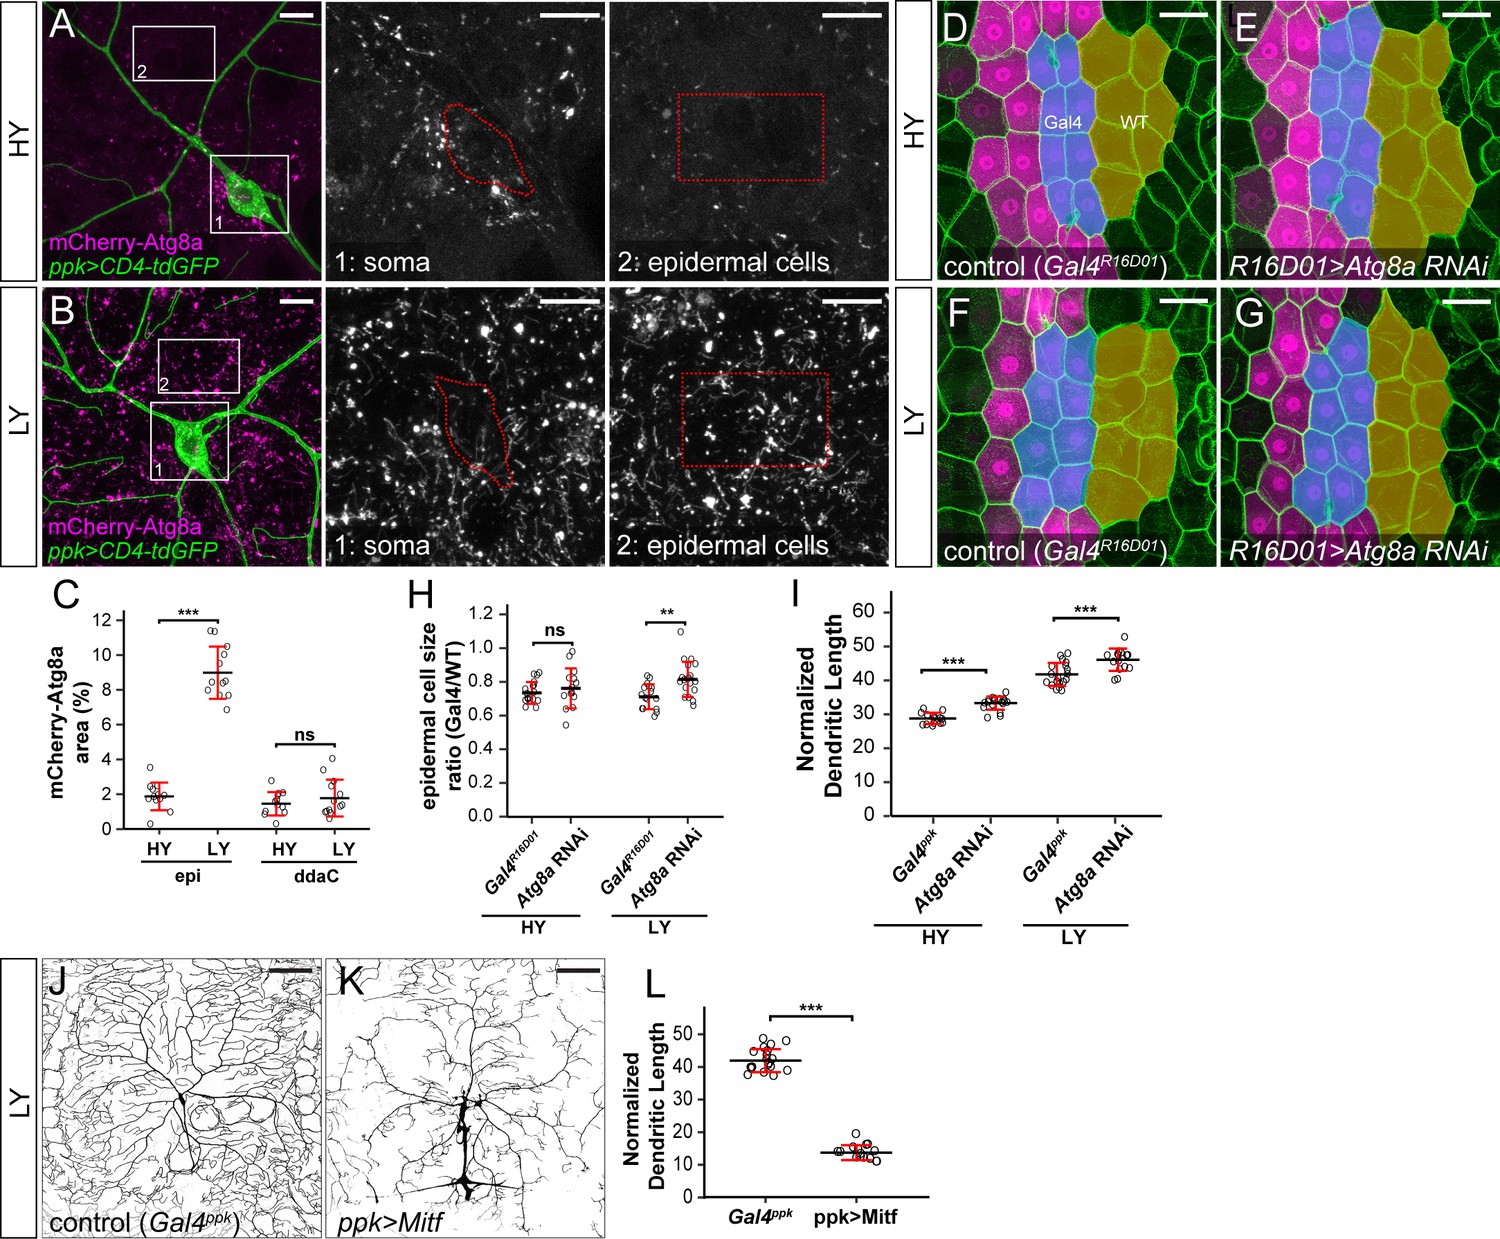
The lack of autophagy induction protects ddaC neuron growth under nutrient stress.
(A and B) mCherry-Atg8a (magenta) in ddaC soma (green) and epidermal cells in HY and LY conditions. The insets show mCherry-Atg8a at the soma of ddaC (1) and epidermal cells (2). The dotted lines indicate the somas (1) and measured epidermal regions (2). All images are 2D projections. (C) Quantification of mCherry-Atg8a levels in ddaC soma and epidermal cells in HY and LY conditions, measured by the area percentage of mCherry-Atg8a-positive vesicles. Epi: n = 12 for HY, n = 13 for LY; ddaC: n = 12 for HY, n = 13 for LY. Two-way ANOVA. The differences between HY and LY in epidermal cells and ddaC are significantly different as indicated by a significant interaction term (p=2.416e-14). (D–G) Epidermal cells in the Gal4R16D01 control and animals expressing Gal4R16D01-driven Atg8a RNAi in HY and LY conditions. Gal4R16D01 domain is labeled by mIFP expression (magenta). All epidermal cells are labeled by Nrg-GFP (green). The blue and yellow overlays indicate the measured Gal4-expressing and wildtype (WT) epidermal cells, respectively. (D) is the same as Figure 2—figure supplement 1I. (H) Quantification of epidermal cell size ratio (Gal4R16D01 cells/WT cells) in HY and LY conditions. Each circle represents a segment; HY: n = 18 for control, n = 14 for Atg8a RNAi; LY: n = 16 for control, n = 19 for Atg8a RNAi. Two-way ANOVA. (I) Quantification of normalized dendritic length in control and Atg8a RNAi animals in HY and LY conditions. Each circle represents a neuron; HY: n = 14 for Gal4ppk, n = 16 for Atg8a RNAi; LY: n = 14 for Gal4ppk, n = 12 for Atg8a RNAi. Gal4ppk is the same dataset as in Figure 2G. Two-way ANOVA. The differences between control and Atg8a RNAi under HY and LY are not significantly different as indicated by a non-significant interaction term (p=0.648) (J and K) DdaC neurons in the Gal4ppk control (J) and animals expressing Gal4ppk-driven Mitf (K) in LY condition. (J) is the same as Figure 2D. (L) Quantification of normalized dendritic length in control and Mitf overexpression animals in LY condition. Each circle represents a neuron; n = 14 for Gal4ppk, n = 15 for ppk >Mitf. Gal4ppk is the same dataset as in Figure 2G. Student’s t-test. For all quantifications, ***p<0.001; **p<0.01; ns, not significant. Black bars, mean; red bars, SD. Scale bars, 10 μm in (A) and (B); 50 μm in (D–G); 100 μm in (J) and (K).
-
Figure 3—source data 1
Autophagy data for Figure 3 and Figure 3—figure supplements 1, 2.
- https://cdn.elifesciences.org/articles/53351/elife-53351-fig3-data1-v2.xlsx
Figure 3—figure supplement 1
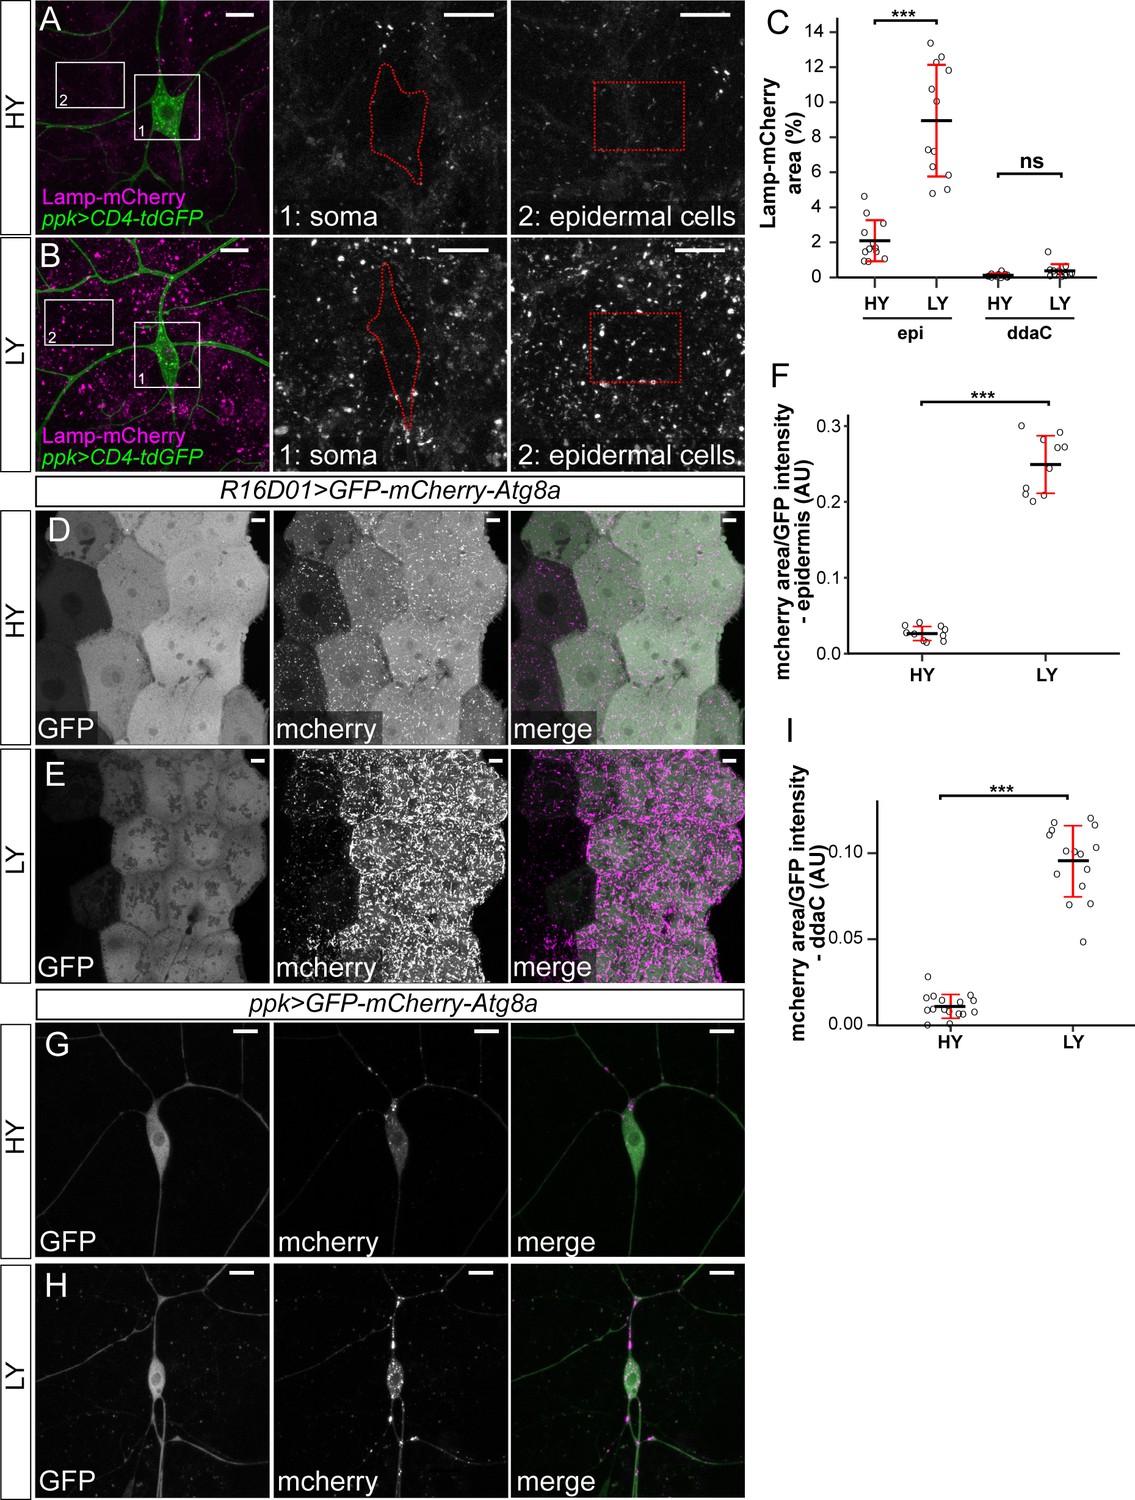
Autophagy flux in C4da neurons and epidermal cells.
(A and B) Lamp-mCherry (magenta) in ddaC soma (green) and epidermal cells in HY and LY conditions. The insets in (A) and (B) show Lamp-mCherry at ddaC soma (1) and epidermal cells (2). All images are 2D projections. (C) Quantification of mChery-Atg8a levels in ddaC soma and epidermal cells in HY and LY conditions, measured by the area percentage of Lamp-mCherry-positive vesicles. Each circle represents a segment. Epi: n = 11 for HY, n = 10 for LY; ddaC: n = 11 for HY, n = 10 for LY. Two-way ANOVA. The differences between HY and LY in epidermal cells and ddaC are significantly different as indicated by a significant interaction term (p=3.286e-08). (D and E) Gal4R16D01-driven GFP-mcherry-Atg8a in epidermal cells in HY and LY conditions. (F) Quantification of autophagic flux (area of mCherry-Atg8a-positive vesicles/GFP intensity) in epidermal cells in HY and LY conditions. Each circle represents a segment; n = 10 for HY, n = 10 for LY. student’s t-test. (G and H) Gal4ppk-driven GFP-mcherry-Atg8a in ddaC neurons in HY and LY conditions. (I) Quantification of autophagic flux in ddaC neurons. Each circle represents a neuron; n = 16 for HY, n = 15 for LY. student’s t-test. For all quantifications, ***p<0.001; *p<0.05. Black bars, mean; red bars, SD. Scale bars, 10 μm in (A), (B), (D), (E), (G) and (H).
Figure 3—figure supplement 2
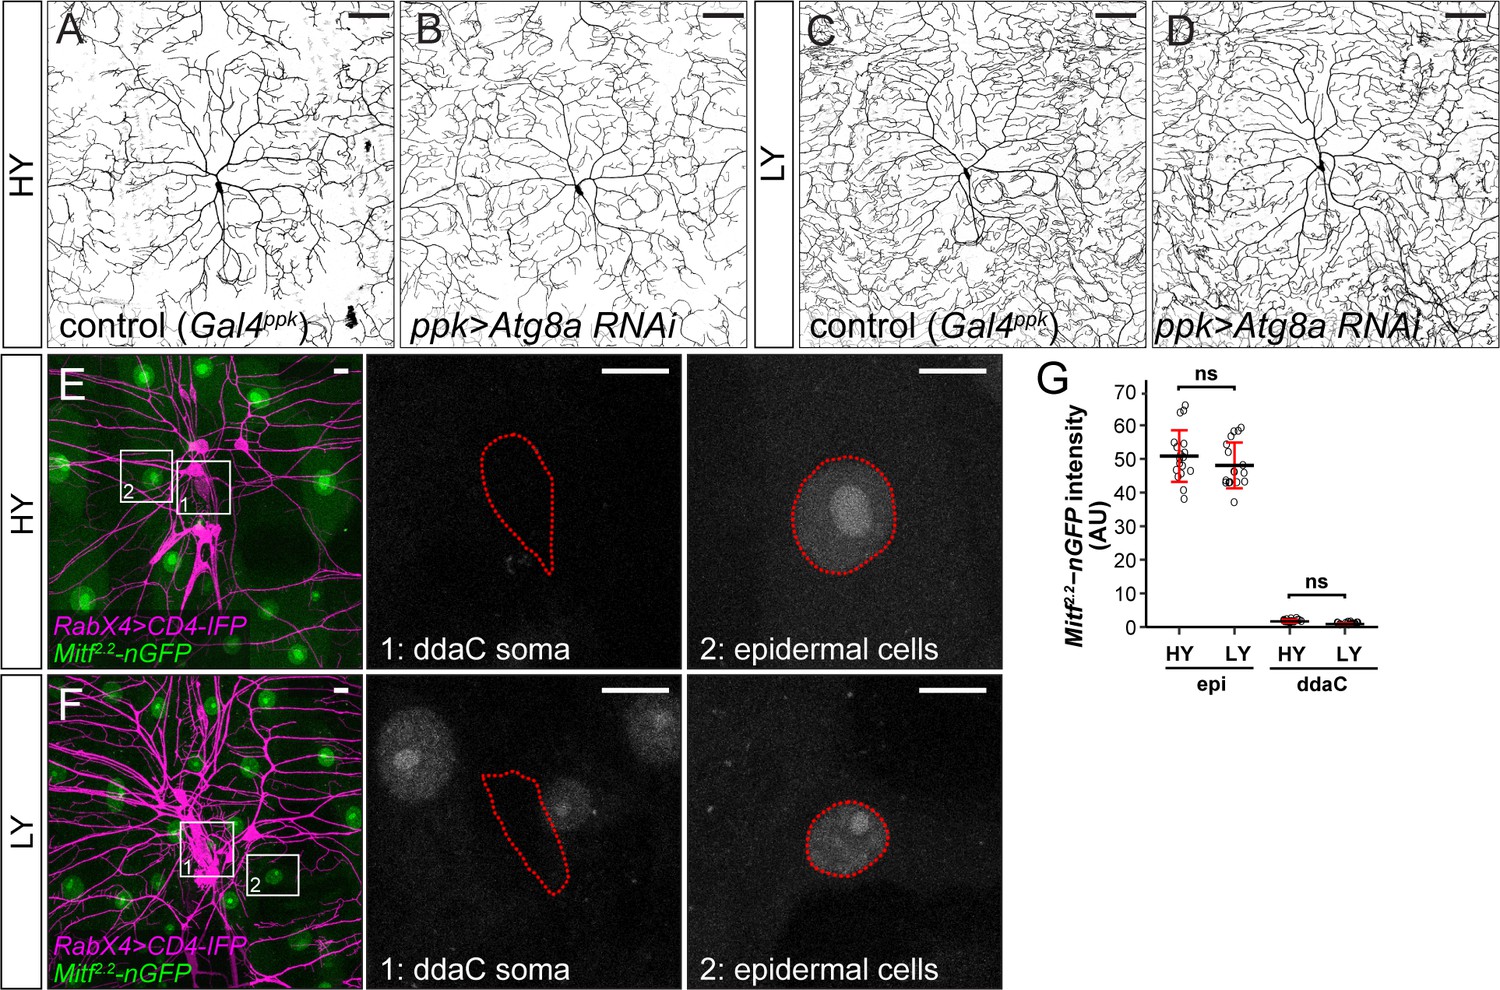
Effects of Atg8a knockdown in C4da neurons and Mitf-nGFP expression pattern.
(A–D) ddaC neurons in the Gal4ppk control (A and C) and animals expressing Gal4ppk-driven Atg8a RNAi (B and D) in HY and LY conditions. (A) and (C) are the same as Figure 2A and D, respectively. (E and F) Mitf2.2-nGFP expression (green) in ddaC neurons (magenta) and epidermal cells in HY and LY conditions. The insets in (E) and (F) show Mitf2.2-nGFP at ddaC somas (1) and epidermal cells (2), with the somas and epidermal cell nuclei outlined. All images are 2D projections. (G) Quantification of Mitf2.2-nGFP intensity in ddaC neuron somas and epidermal cells in HY and LY conditions. epi: n = 18 for HY, n = 17 for LY; ddaC: n = 17 for HY, n = 17 for LY. Two-way ANOVA. The differences between HY and LY in epidermal cells and ddaC are not significantly different as indicated by a non-significant interaction term (p=0.419). Black bars, mean; red bars, SD. Scale bars, 100 μm in (A–D), 10 μm in (E) and (F).
Figure 4 with 3 supplements

FoxO is differentially expressed in C4da neurons and epidermal cells to regulate their distinct responses to nutrient stress.
(A and B) FoxO-GFP (green) in da neurons (magenta) and epidermal cells in HY and LY conditions in 2D projections. The insets for (A) and (B) show FoxO-GFP levels at ddaC somas (1) and epidermal cells (2) in single confocal sections. (C) Quantification of FoxO-GFP intensity in ddaC neuron soma and epidermal cells in HY and LY conditions. Two-way ANOVA. The differences between HY and LY in epidermal cells and ddaC are not significantly different as indicated by a non-significant interaction term (p=0.0901). Each circle represents a segment; epi: n = 18 for HY, n = 14 for LY; ddaC: n = 17 for HY and n = 14 for LY. (D) Quantification of FoxO staining in ddaC neuron soma and epidermal cells in HY and LY conditions. Each circle represents a segment; epi: n = 17 for HY, n = 13 for LY; ddaC: n = 17 for HY and n = 13 for LY. Two-way ANOVA. The differences between HY and LY in epidermal cells and ddaC are not significantly different as indicated by a non-significant interaction term (p=0.0897). (E and F) Gal4foxo-driven tdTom (magenta) in da neurons (green) and epidermal cells in HY and LY conditions in 2D projections. The insets in (E) and (F) show Gal4foxo-driven tdTom expression levels at ddaC somas (1) and epidermal cells (2) in single confocal sections. (G) Quantification of Gal4foxo-driven tdTom intensity in ddaC neuron soma and epidermal cells in HY and LY conditions. Each circle represents a segment; epi: n = 19 for HY, n = 19 for LY; ddaC: n = 18 for HY, n = 18 for LY. (H–M) ddaC neurons in the Gal4ppk control (H and K) and animals expressing Gal4ppk-driven foxo RNAi (I and L) and foxo (J and M) in HY and LY conditions. (H) and (K) are the same as Figure 2A and D, respectively. (N) Quantification of normalized dendritic length in control, foxo RNAi and foxo overexpression animals in HY and LY conditions. Two-way ANOVA, Posthoc contrasts with a Dunnett correction. The differences between control and foxo RNAi under HY and LY are not significantly different as indicated by a non-significant interaction term (p=0.5090), but it is significant between control and ppk >foxo as indicated by a significant interaction term (p=2e-16). Each circle represents a neuron; HY: n = 14 for Gal4ppk, n = 11 for foxo RNAi, n = 12 for foxo OE; LY: n = 14 for Gal4ppk, n = 13 for foxo RNAi, n = 12 for foxo OE. Gal4ppk is the same dataset as in Figure 2G. (O–R) Epidermal cells in the Gal4R16D01 control and animals expressing Gal4R16D01-driven Atg8a RNAi in HY and LY conditions. (O) and (Q) are the same as Figure 3D and F, respectively. (S) Quantification of epidermal cell size ratio (Gal4R16D01 cells/WT cells) in HY and LY conditions. Two-way ANOVA. The differences between control and foxo RNAi under HY and LY are significantly different as indicated by a significant interaction term (p=0.00023), Each circle represents a segment; HY: n = 18 for control, n = 10 for foxo RNAi; LY: n = 16 for control, n = 18 for foxo RNAi. For all quantifications, ***p<0.001; **p<0.01; *p<0.05; ns, not significant. Black bars, mean; red bars, SD. Scale bars, 10 μm in (A), (B), (E) and (F); 100 μm in (H–M); 50 μm in (O–R).
-
Figure 4—source data 1
foxo analyses data for Figure 4 and Figure 4—figure supplements 1, 2, 3.
- https://cdn.elifesciences.org/articles/53351/elife-53351-fig4-data1-v2.xlsx
Figure 4—figure supplement 1
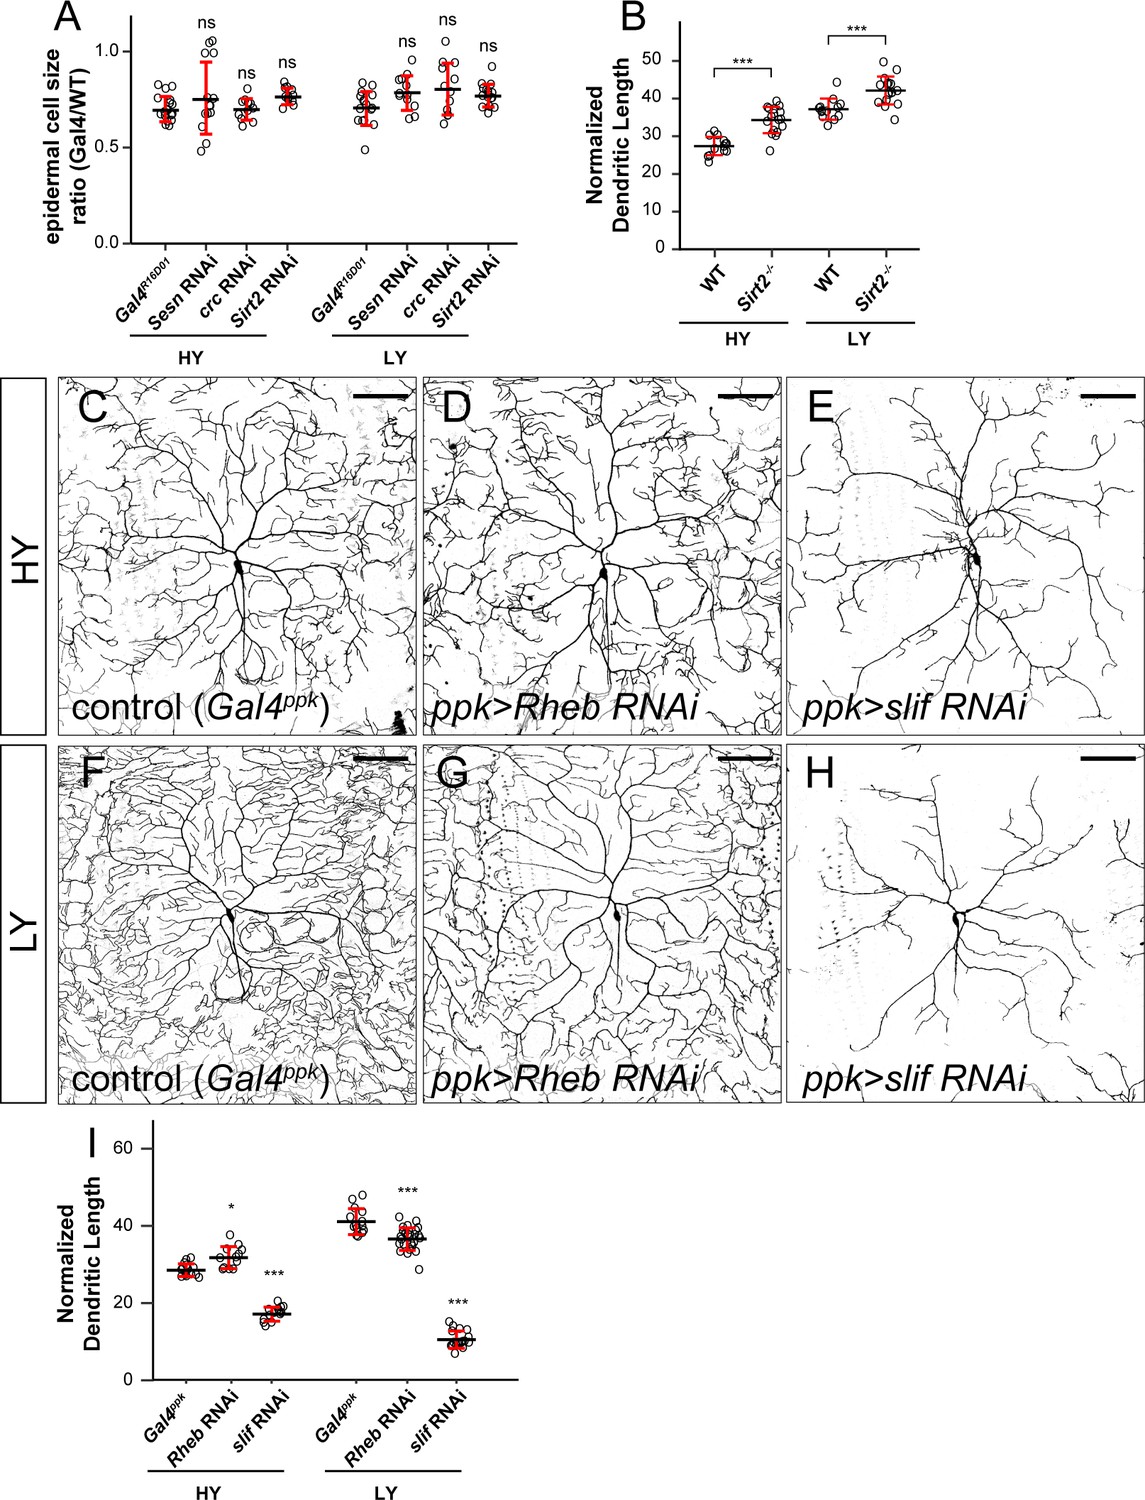
The effects of LOF of Sesn, crc, Sirt2, Rheb, and slif on C4da dendrite growth.
(A) Quantification of epidermal cell size ratio (Gal4R16D01 cells/WT cells) in HY and LY conditions for genotypes indicated. Two-way ANOVA, Posthoc contrasts with a Dunnett correction. The differences between control and sesn RNAi under HY and LY conditions are not significantly different as indicated by a non-significant interaction term (p=0.1674), the same for crc RNAi (p=0.0777) and sirt2 RNAi (p=0.0597). Each circle represents a segment; HY: n = 18 for control, n = 14 for Sesn RNAi, n = 12 for crc RNAi, n = 11 for Sirt2 RNAi; LY: n = 16 for control, n = 12 for Sesn RNAi, n = 12 for crc RNAi, n = 16 for Sirt2 RNAi. (B) Quantification of normalized dendritic length in HY and LY conditions for WT animals and Sirt2 mutants. Two-way ANOVA. The differences between control and sirt2 mutants are not significantly different between the HY and LY, as indicated by a non-significant interaction term (p value=0.2471). Each circle represents a neuron; n = 13 for control, n = 18 for Sirt2 mutant in both conditions. (C–H) ddaC neurons in the Gal4ppk control (C and F) and animals expressing Gal4ppk-driven Rheb RNAi (D and G) and slif RNAi (E and H) in HY and LY conditions. (C) and (F) are the same as Figure 2A and D, respectively. (I) Quantification of normalized dendritic length in control, Rheb RNAi and slif RNAi animals in HY and LY conditions. Two-way ANOVA, Posthoc contrasts with a Dunnett correction. The differences between control and Rheb RNAi under HY and LY conditions are significantly different as indicated by a significant interaction term (p=8.37e-08), the same for slif RNAi (p=2e-16). Each circle represents a neuron; HY: n = 14 for Gal4ppk, n = 12 for Rheb RNAi, n = 14 for slif RNAi; LY: n = 14 for Gal4ppk, n = 26 for Rheb RNAi, n = 17 for slif RNAi. Gal4ppk is the same dataset as in Figure 2G. ***p<0.001. Significance level is for comparison between the control and the genotype indicated under the same food condition in (A) and (I). Black bars, mean; red bars, SD. Scale bars, 100 μm in (C–H).
Figure 4—figure supplement 2
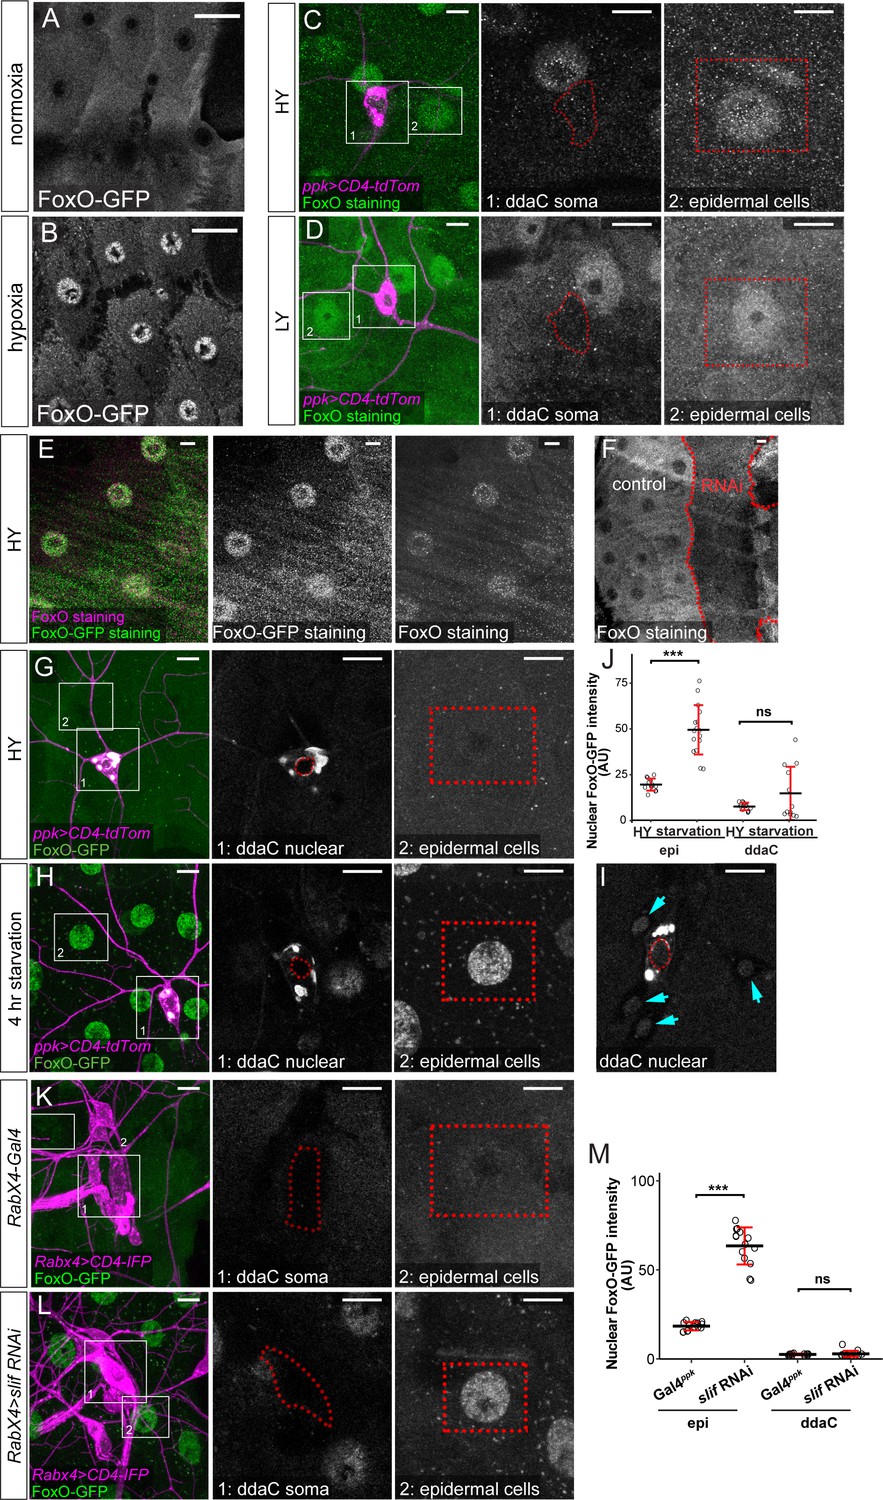
FoxO expression.
(A and B) FoxO-GFP distribution in epidermal cells under normoxia (A) and hypoxia (B). (C and D) FoxO staining (green) in da neurons (magenta) and epidermal cells in HY and LY conditions in 2D projections. The insets for (C) and (D) show FoxO-GFP levels at ddaC somas (1) and epidermal cells (2) in single confocal sections. (E) FoxO and GFP staining in a foxo-GFP larva in HY. The nuclear localization of FoxO in (C–E) was likely caused by stress introduced during animal dissection. (F) FoxO staining in Gal4R16D01 > foxo RNAi animals. Gal4R16D01 domain is outlined by red dots. (G–H) FoxO-GFP (green) in C4da neurons (magenta) and epidermal cells in HY (G) and after 4 hr under starvation (H). The insets for (G) and (H) show FoxO-GFP levels at ddaC nuclei outlined by red dots (1) and epidermal cells (2) in single confocal sections. (I) FoxO-GFP in da neuron nuclei in another larva after 4 hr under starvation. The ddaC nucleus is outlined by red dots. The arrows point to nuclei of other da neurons. In (G–I), tdTom signals bled through the GFP channel in intracellular vesicles of ddaC neurons. (J) Quantification of nuclear FoxO-GFP levels in animals reared in HY and those subjected to starvation. Two-way ANOVA. The differences between HY and starvation in epi and ddaC are significantly different as indicated by a significant interaction term (p=0.000171). Each circle represents a segment; n = 13 for HY and n = 12 for starvation in both epi and ddaC. (K and L) FoxO-GFP (green) in da neurons (magenta) and epidermal cells in control (K) and slif RNAi (L) animals in HY condition in 2D projections. The insets for (K) and (L) show FoxO-GFP levels at ddaC somas (1) and epidermal cells (2) in single confocal sections. (M) Quantification of nuclear FoxO-GFP levels in control and slif RNAi animals in HY condition. Two-way ANOVA. The differences between control and slif RNAi in epi and ddaC are significantly different as indicated by a significant interaction term (p=2e-16). Each circle represents a segment; n = 13 for control and n = 15 for slif RNAi for both epi and ddaC. For both quantifications, ***p<0.001, ns, not significant. Black bars, mean; red bars, SD. Scale bars, 20 μm in (A) and (B), 10 μm in (C–I) and (K–L).
Figure 4—figure supplement 3
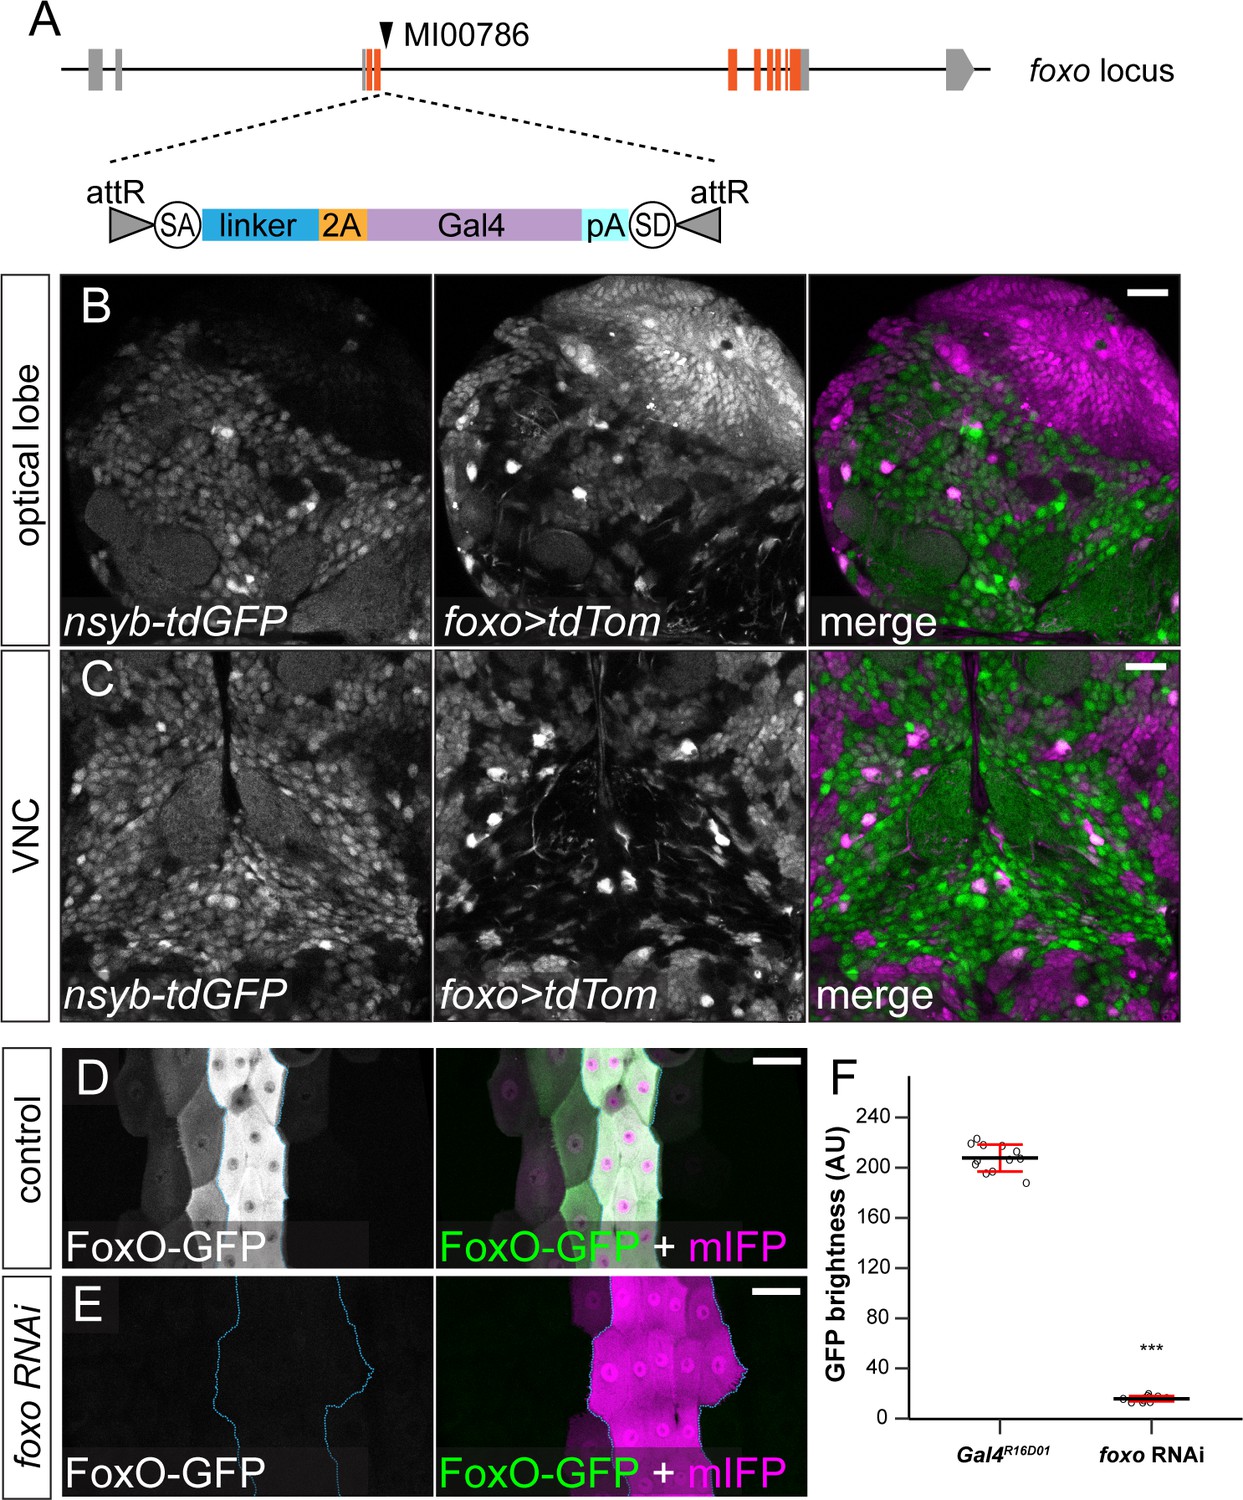
foxO-Gal4 and effectiveness of foxo RNAi.
(A) Diagram of foxO-Gal4. (B and C) Gal4foxo-driven tdTom expression in optical lobe (B) and VNC (C) in LY condition. (D and E) UAS-FoxO-GFP in Gal4R16D01 control (D) and animals co-expressing foxo RNAi (E). The Gal4R16D01 domain is outlined. (F) Quantification of FoxO-GFP levels in control and foxo RNAi animals. Each circle represents a segment; n = 12 for control and foxo RNAi. ***p<0.001; Student's t-test. Black bars, mean; red bars, SD. Scale bars, 20 μm in (B) and (C), 50 μm in (D) and (E).
Figure 5
FoxO exerts its effects through modulating Tor signaling and autophagy.
(A and B) pRpS6 staining (magenta) of ddaC neurons (green) and epidermal cells in Gal4ppk-driven UAS-foxo animals in HY and LY conditions in 2D projections. The insets for (A) and (B) show pRpS6 staining at the soma (1) and primary dendrites (2) in single confocal sections, with the somas and dendrites outlined. (C and D) Quantification of pRpS6 intensity ratios in control and foxo OE animals in HY and LY conditions. For both, Two-way ANOVA. The differences between control and ppk >foxo are not significant between the HY and LY in soma, as indicated by a non-significant interaction term (p=0.9584), but are significant for dendrite, as indicated by a significant interaction term (p=9.66e-09). Each circle represents a segment; HY: n = 17 for control, n = 17 for foxo RNAi; LY: n = 20 for control, n = 16 for foxo RNAi. The control datasets are the same as in Figure 2P. (E and F) mCherry-Atg8a (magenta) in ddaC soma (green) of Gal4ppk-driven UAS-foxo animals in HY and LY. The soma images are projections from thinner volumes only containing the soma. (G) Quantification of mCherry-Atg8a levels in ddaC somas measured by the area percentage of mCherry-Atg8a-positive vesicles. Two-way ANOVA. The differences between control and ppk >foxo are significantly different between the HY and LY, as indicated by a significant interaction term (p=5.51e-09). Each circle represents a neuron; HY: n = 12 for control, n = 23 for foxo OE; LY: n = 13 for control, n = 19 for foxo OE. For all quantifications, ***p<0.001; ns, not significant. Black bars, mean; red bars, SD. Scale bars, 10 μm.
-
Figure 5—source data 1
FoxO OE data for Figure 5.
- https://cdn.elifesciences.org/articles/53351/elife-53351-fig5-data1-v2.xlsx
Figure 6
Nutrient stress-induced dendrite overgrowth sensitizes neurons.
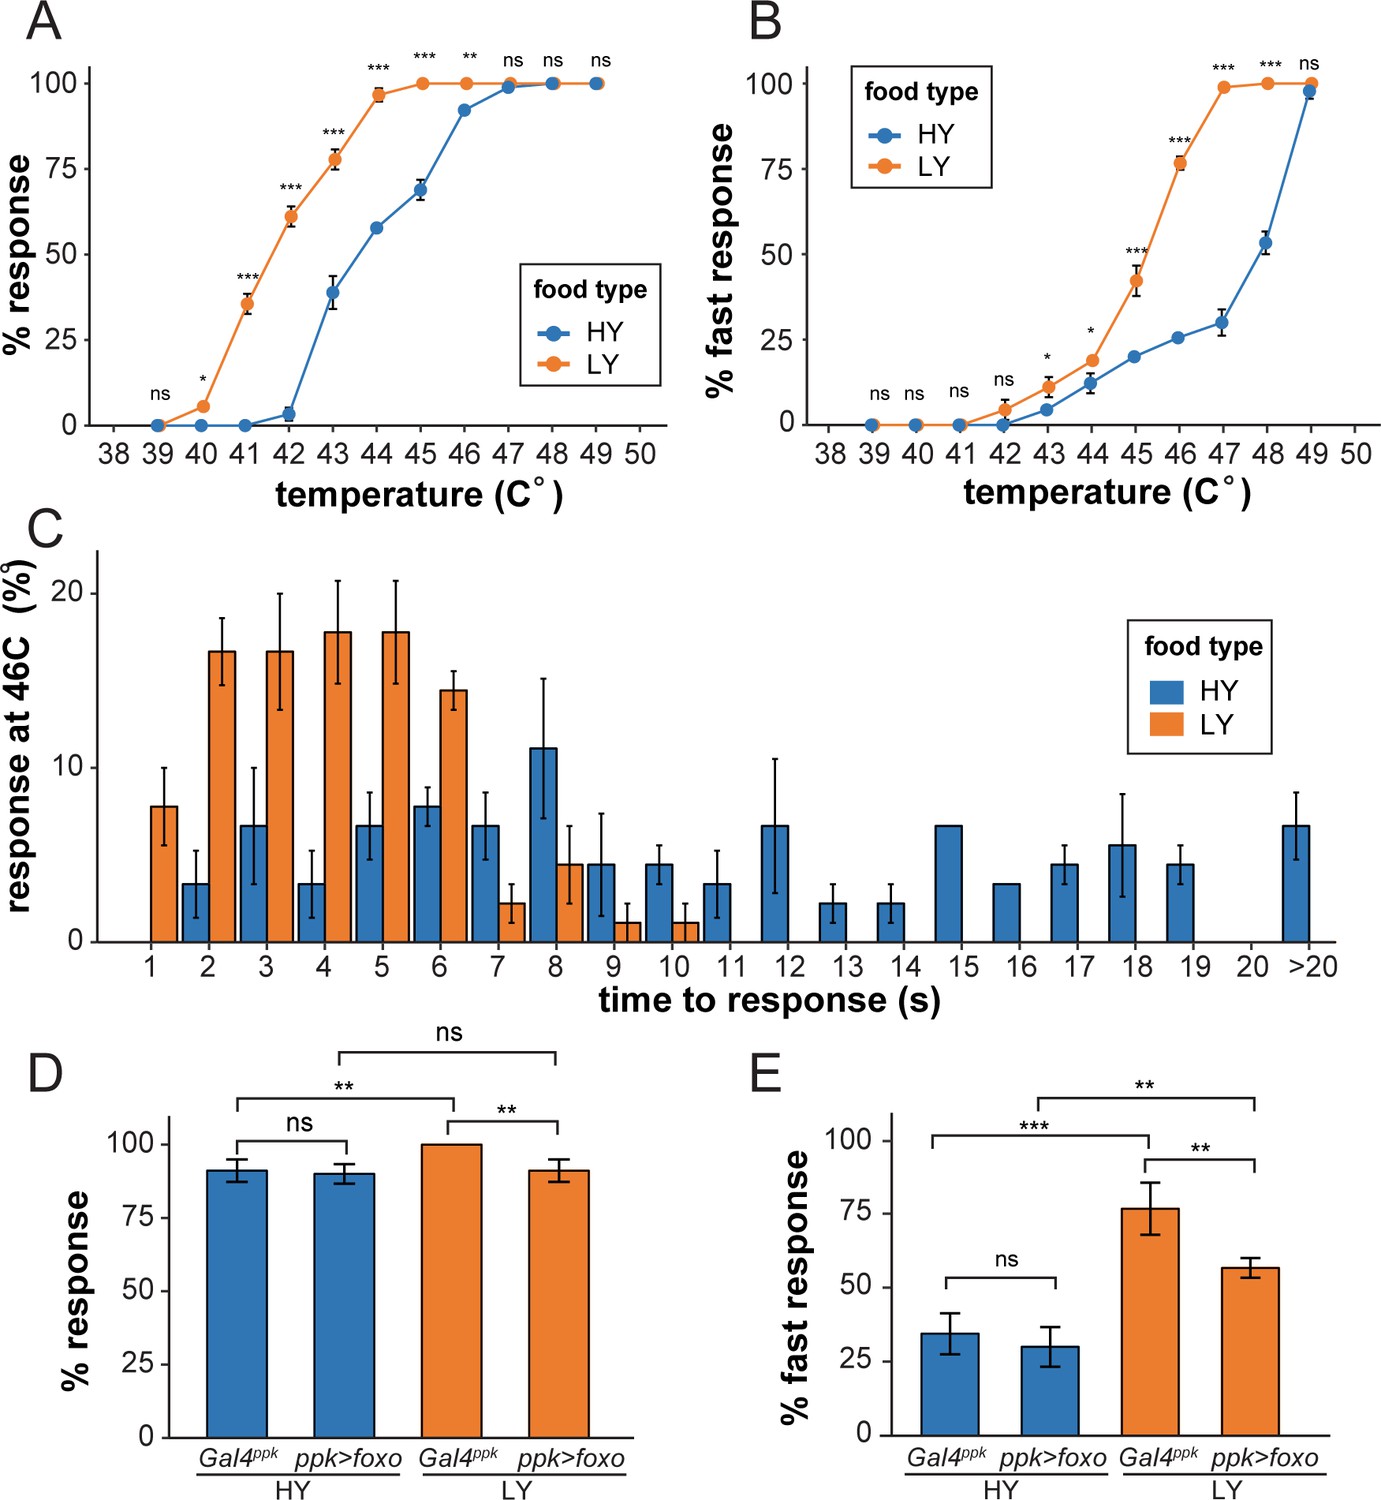
(A) A plot showing the percent of responders (respond within 20 s) versus temperature. n = number of larvae; n = 90 for HY and LY at each temperature. (B) A plot showing the percent of fast responders (respond within 5 s) versus temperature. n = number of larvae; n = 90 for HY and LY at each temperature. (C) A plot showing the percent of responders at 46°C versus the response time. n = number of larvae; n = 90 for HY and LY. (D) A plot showing the percent of responders versus temperature for Gal4ppk and FoxO OE animals in HY and LY conditions at 46°C. n = number of larvae; n = 120 for each group. Two-way ANOVA; interaction term between genotype and nutrient, p=0.0678. (E) A plot showing the percent of fast responders versus temperature for Gal4ppk and FoxO OE animals in HY and LY conditions at 46°C. n = number of larvae; n = 120 for each group. Two-way ANOVA; interaction term between genotype and nutrient, p=0.08052. In all panels, error bars indicate the standard error from three repeats (SE). For all quantifications, ***p<0.001; **p<0.01; *p<0.05: ns, not significant; Two-way ANOVA.
-
Figure 6—source data 1
Behavior analyses data for Figure 6.
- https://cdn.elifesciences.org/articles/53351/elife-53351-fig6-data1-v2.xlsx
Figure 7
Different types of somatosensory neurons respond to nutrient stress differentially.
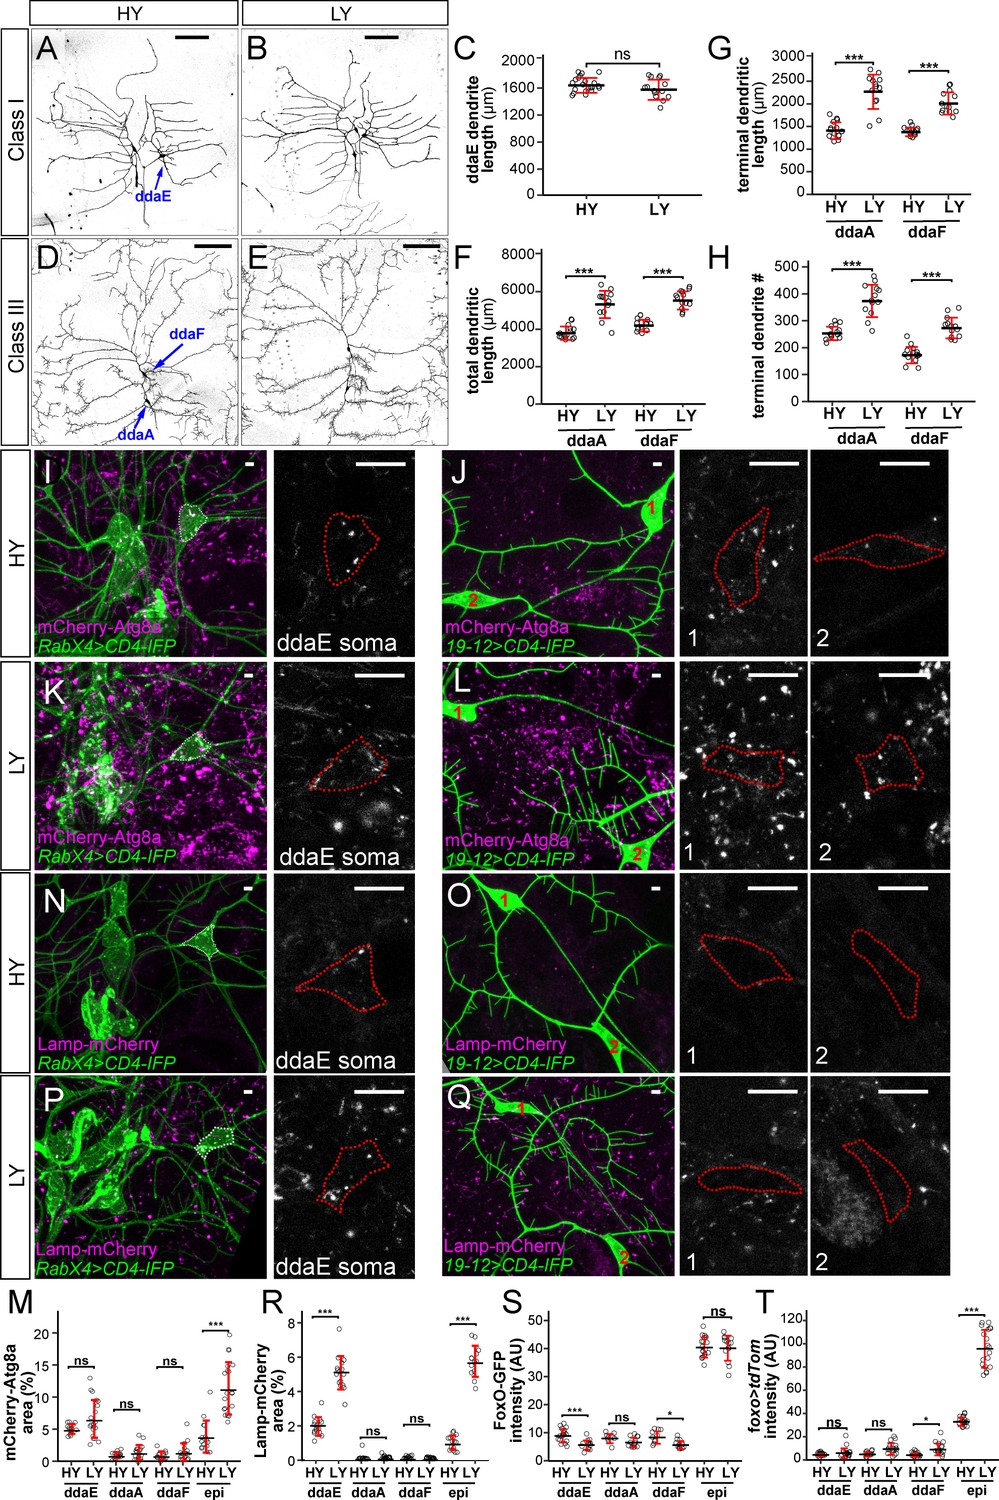
(A and B) C1da neurons in HY and LY conditions. (C) Quantification of ddaE dendrite length in HY and LY conditions. Each circle represents a neuron; n = 20 for HY, n = 14 for LY. student’s t-test. (D and E) C3da neurons in HY and LY conditions. (F–H) Quantification of total dendritic length (F), terminal dendritic length (G) and terminal dendrite number (H) of ddaF and ddaA neurons in HY and LY conditions. Each circle represents a neuron; ddaA: n = 14 for HY, n = 13 for LY; ddaF: n = 14 for HY, n = 13 for LY. (I–L) mCherry-Atg8a (magenta) in da neuron somas (green) in HY and LY conditions. (I) and (K) show ddaE. (J) and (L) show ddaF (1) and ddaA (2). The soma images are projections from thinner volumes only containing the soma. The somas are outlined. (M) Quantification of mCherry-Atg8a levels in da neuron somas and epidermal cells in HY and LY conditions, measured by the area percentage of mCherry-Atg8a-positive vesicles. Each circle represents a segment; HY: n = 15 for ddaE, n = 15 for ddaA, n = 15 for ddaF, n = 14 for epi; LY: n = 20 for ddaE, n = 18 for ddaA, n = 18 for ddaF, n = 20 for epi. (N–Q) Lamp-mCherry (magenta) in da neuron somas (green) in HY and LY conditions. (N) and (P) show ddaE. (O) and (Q) show ddaF (1) and ddaA (2). The soma images are projections from thinner volumes only containing the soma. The somas are outlined. (R) Quantification of Lamp-mCherry levels in da neuron somas and epidermal cells in HY and LY conditions, measured by the area percentage of Lamp-mCherry-positive vesicles. Each circle represents a segment; HY: n = 15 for ddaE, n = 12 for ddaA, n = 15 for ddaF, n = 15 for epi; LY: n = 16 for ddaE, n = 16 for ddaA, n = 16 for ddaF, n = 16 for epi. (S) Quantification of FoxO expression level in da neuron soma in HY and LY conditions. Each circle represents a segment; LY: n = 14 for ddaE, n = 13 for ddaA, n = 13 for ddaF, n = 14 for epi; HY: n = 17 for ddaE, n = 9 for ddaA, n = 11 for ddaF, n = 18 for epi. (T) Quantification of Gal4foxo-driven tdTom expression levels in da neuron somas in HY and LY conditions. Each circle represents a segment; HY: n = 19 for ddaE, n = 13 for ddaA, n = 18 for ddaF, n = 19 for epi; LY: n = 17 for ddaE, n = 16 for ddaA, n = 17 for ddaF, n = 17 for epi. For all quantifications, ***p<0.001; **p<0.01; *p<0.05; ns, not significant. Student’s t-test. Black bars, mean; red bars, SD. Scale bars, 100 μm in (A), (B), (D) and (E); 10 μm in (I–L) and (N–Q). Epi datasets in (S) and (T) are the same as the ones in Figure 4C and G, respectively.
-
Figure 7—source data 1
Other da neuron classes data for Figure 7.
- https://cdn.elifesciences.org/articles/53351/elife-53351-fig7-data1-v2.xlsx
Figure 8

Model of nutrient-regulated da neuron and epidermal cell growth.
See discussion for details. Supplementary file - Key Resources Table.
Additional files
-
Supplementary file 1
Key Resources Table.
- https://cdn.elifesciences.org/articles/53351/elife-53351-supp1-v2.xlsx
-
Transparent reporting form
- https://cdn.elifesciences.org/articles/53351/elife-53351-transrepform-v2.docx
Download links
A two-part list of links to download the article, or parts of the article, in various formats.
Downloads (link to download the article as PDF)
Open citations (links to open the citations from this article in various online reference manager services)
Cite this article (links to download the citations from this article in formats compatible with various reference manager tools)
Low FoxO expression in Drosophila somatosensory neurons protects dendrite growth under nutrient restriction
eLife 9:e53351.
https://doi.org/10.7554/eLife.53351


