Super-resolution microscopy reveals coupling between mammalian centriole subdistal appendages and distal appendages
- Institute of Atomic and Molecular Sciences, Academia Sinica, Taiwan
- Institute of Biochemistry and Molecular Biology, National Yang Ming University, Taiwan
- Division of Cancer Therapeutics, The Institute of Cancer Research, United Kingdom
- Dermatology Service, Department of Medicine, Memorial Sloan Kettering Cancer Center, United States
- Cell Biology Program, Memorial Sloan-Kettering Cancer Center, United States
- Institute of Plant and Microbial Biology, Academia Sinica, Taiwan
- Graduate Institute of Biomedical Electronics and Bioinformatics, National Taiwan University, Taiwan
- Department of Electrical Engineering, National Taiwan University, Taiwan
Figures
Figure 1 with 1 supplement
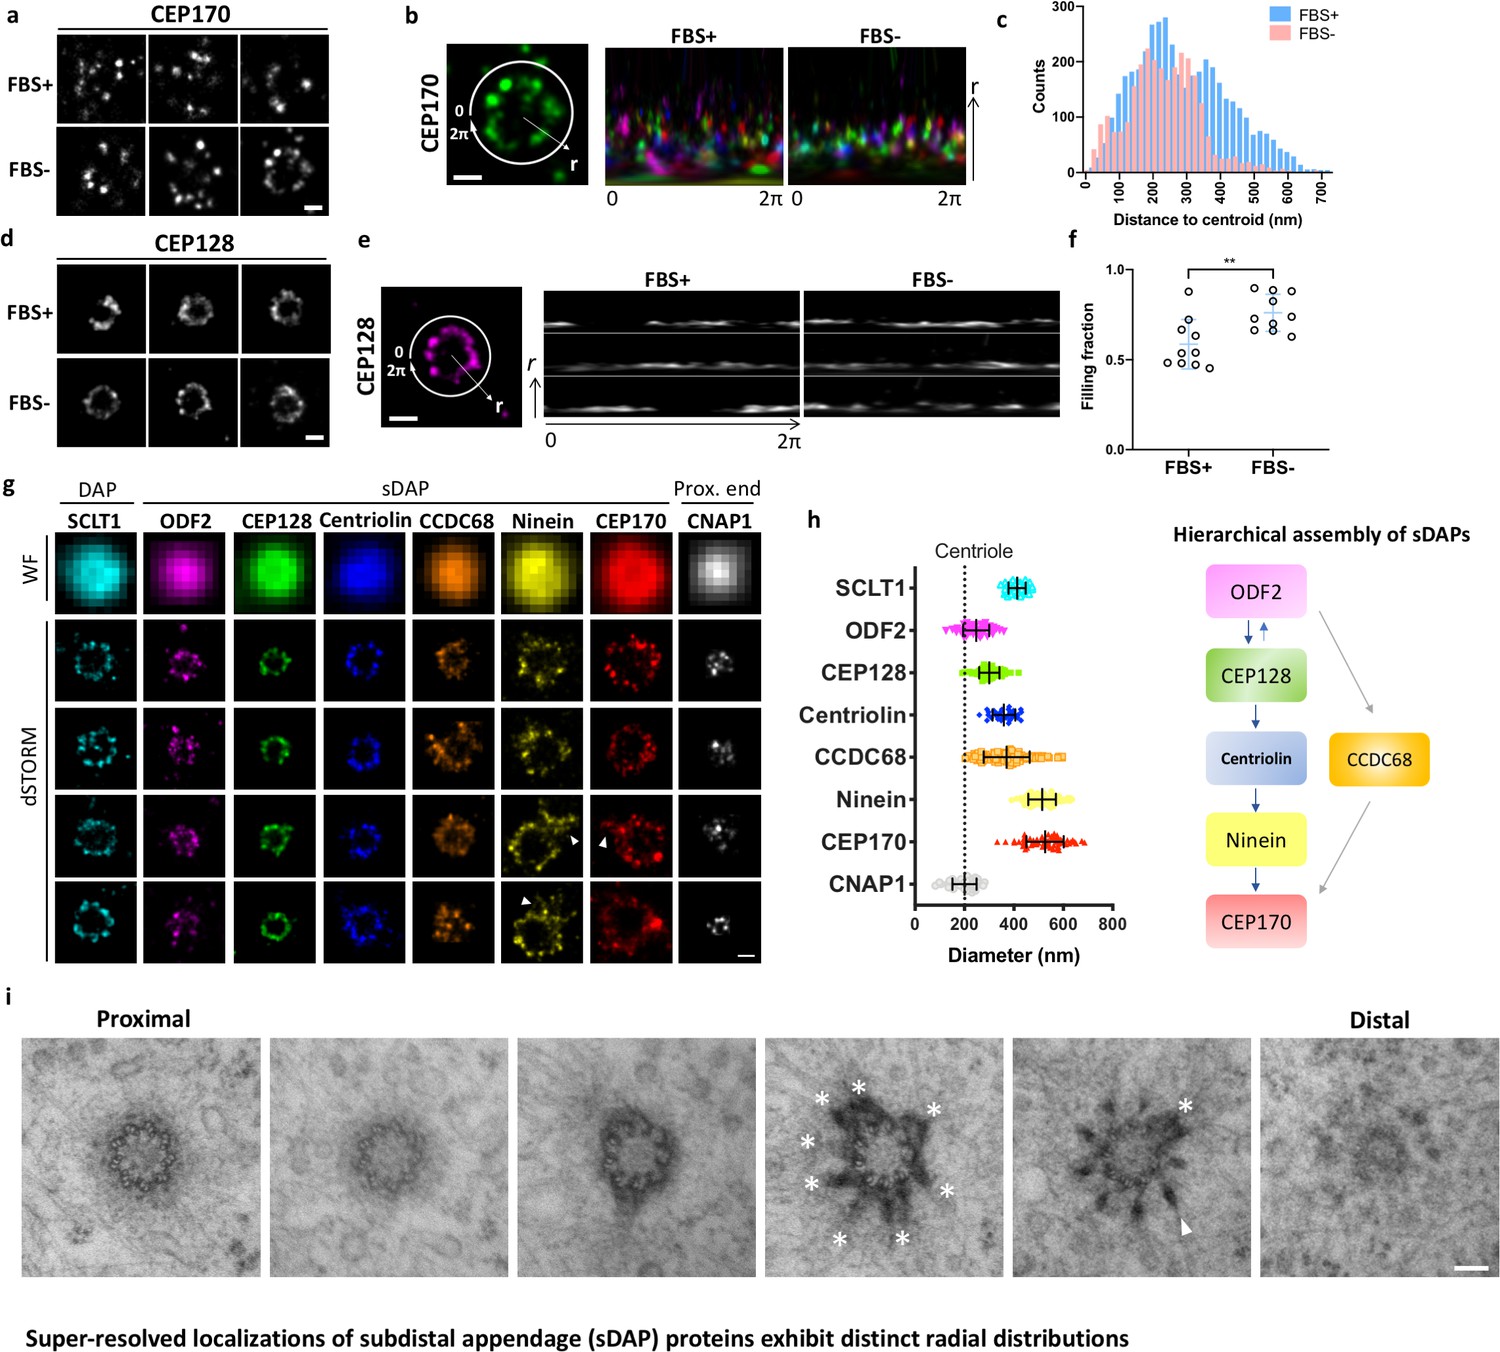
Super-resolved localizations of subdistal appendage (sDAP) proteins exhibit distinct radial distributions.
(a) Axial-view direct stochastic optical reconstruction microscopy (dSTORM) images of CEP170 under serum-supplied (FBS+) and serum-starved (FBS–) conditions. (b) Image analysis revealing that, under the proliferating condition (FBS+), CEP170 exhibits a relatively random radial distribution compared to that under the resting (FBS–) G0 phase. Each color represents a data value for different centrioles. (c) Statistical analysis of the radial distribution of CEP170 under FBS+ and FBS– conditions. n = 10 centrioles for both conditions, p<0.05. (d) Axial-view dSTORM images of CEP128 under serum-supplied (FBS+) and serum-starved (FBS–) conditions. (e) Image analysis revealing that CEP128 rings are less organized under the proliferating condition (FBS+) than under the resting phase (FBS–). (f) Statistical analysis showing the completeness of the ring-shaped occupancy of CEP128 under FBS+ and FBS– conditions. **p<0.01. (g) Representative dSTORM super-resolution images of axial-view centrioles showing the radial distribution of the distal appendage (DAP) protein SCLT1, various sDAP proteins, and the centriole proximal-end (Prox. end) protein CNAP1, which were not resolvable under wide-field (WF) imaging. ‘Overhang structures’ (arrowheads) were sometimes observed in the ninein and CEP170 rings. (h) (Left) Mean diameter analysis revealing size differences among the proteins in panel (g). Supplementary file 1 lists the dimensional details. The diameters of ODF2 and CNAP1 were similar to that of the centriole wall measured from the electron microscopy (EM) images (dotted line). (Right) A schematic figure summarizing previous studies on the hierarchical assembly of sDAPs. (i) Serial transmission EM (TEM) sections of an RPE-1 mother centriole. The centriole, reconstituted by TEM analysis with serial sectioning, reveals an approximately nine-fold distribution of sDAP in RPE-1 cells. Asterisks and the arrowhead indicate sDAPs and DAP, respectively. Bars: panels (a, b, d, e, g) = 200 nm; panel (i) = 100 nm.
Figure 1—figure supplement 1
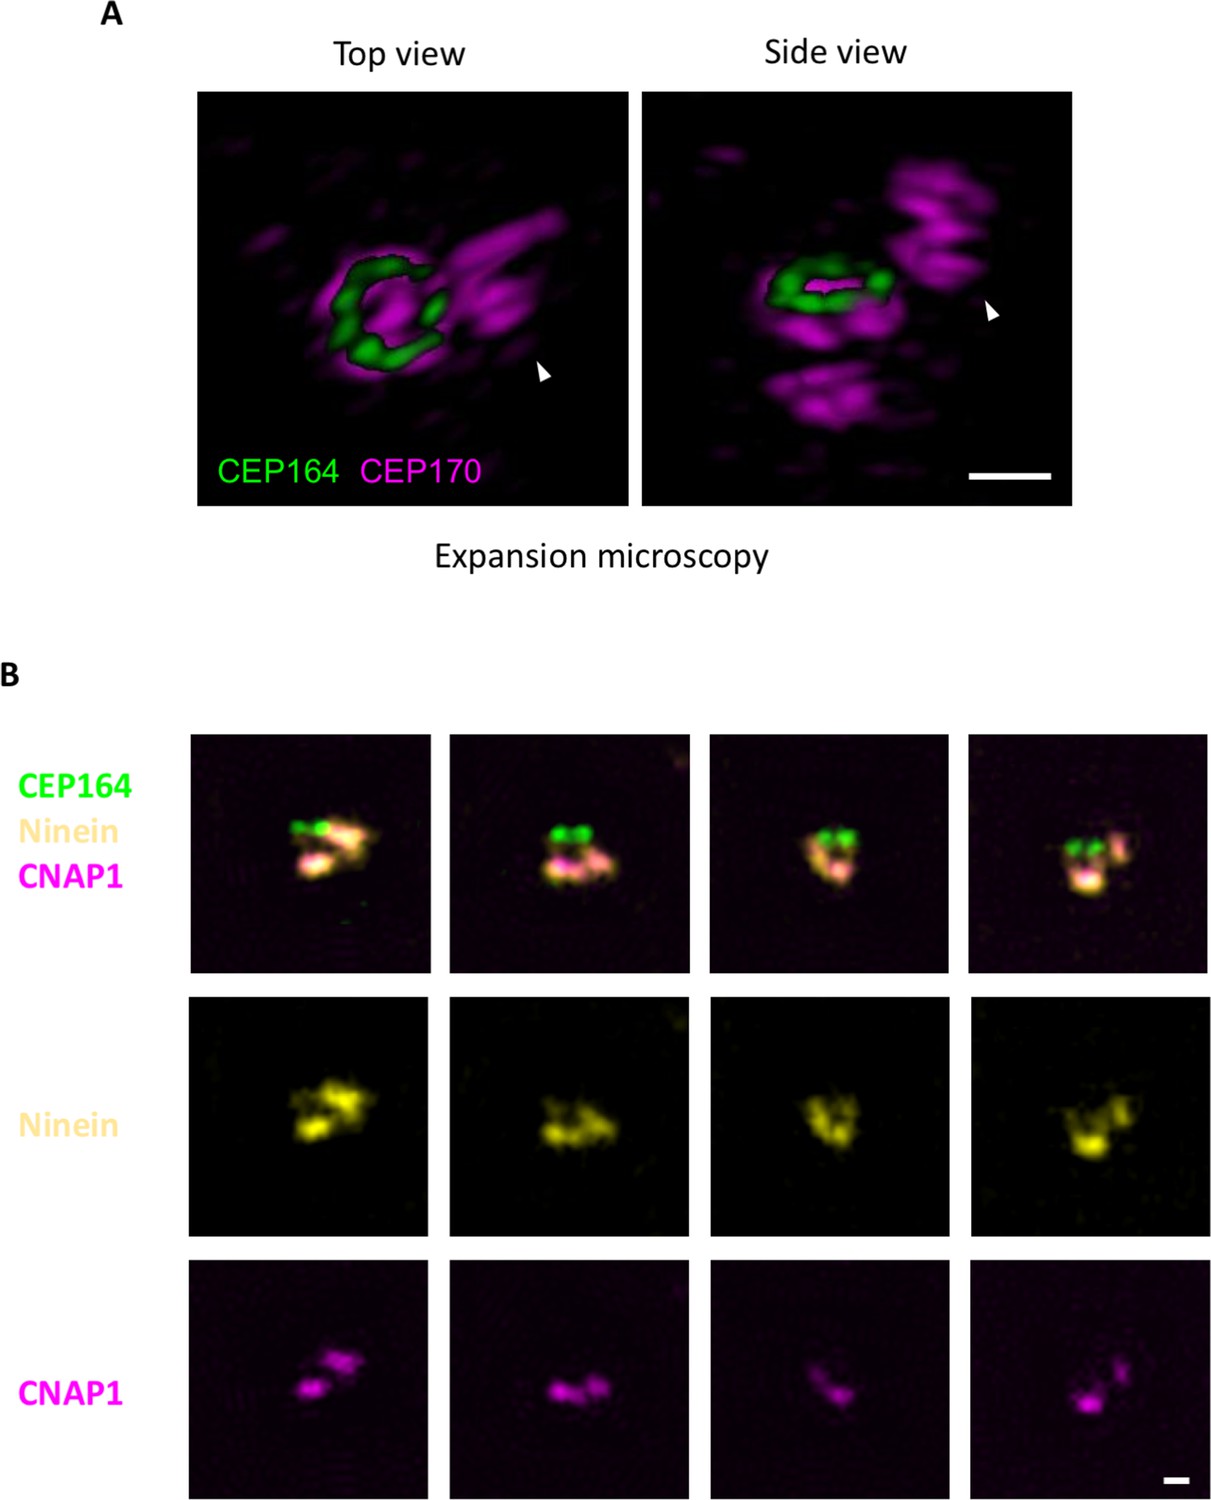
Localization of CEP170 using 3D expansion microscopy.
(A) The overhang-like structures observed in the axial CEP170 dSTORM images were studied using 3D expansion microscopy. CEP164 was co-stained as the mother centriole distal end marker. (Left) Top view of CEP170 showing an overhang structure (arrowhead) in close proximity to the CEP170 ring at the sDAP region. (Right) Side view of CEP170 revealing that the overhang structure is not derived from the CEP170 ring; it is probably CEP170 localized at the daughter centriole. (B) Epifluorescence imaging of ninein, CNAP1, and CEP164 showing that the overhang signal of ninein is caused by the daughter centriole. Bar = 400 nm.
Figure 2
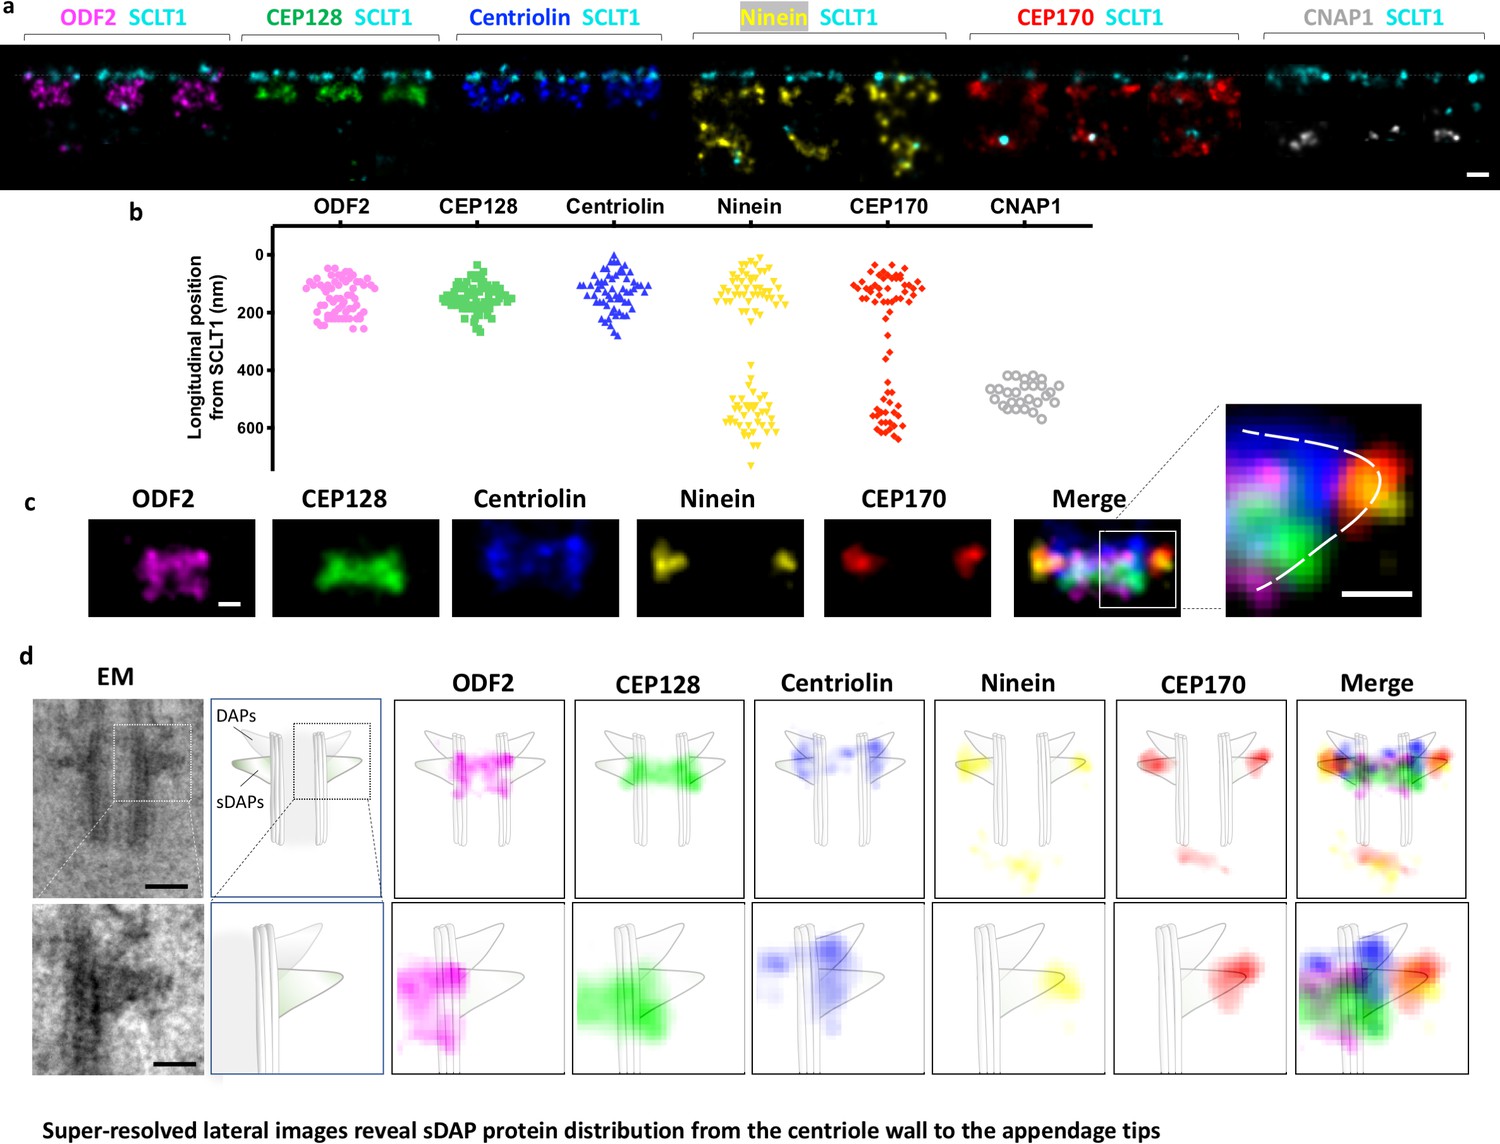
Super-resolved lateral images reveal sDAP protein distribution from the centriole wall to the appendage tips.
(a) Representative lateral-view two-color dSTORM images of sDAP–SCLT1 pairs revealing the longitudinal positions of various sDAP proteins relative to SCLT1. (b) A scatter plot describing the longitudinal positions of sDAP proteins relative to SCLT1. (c) dSTORM images of each sDAP protein were aligned using SCLT1 as a reference and combined into a composite image (n > 7 centrioles each). The composite images were then aligned and merged according to their average longitudinal position. (Inset) A magnified image showing the triangular-like arrangement of the sDAP structure (dashed line). (d) (Top panel) Composite dSTORM images of each sDAP protein in panel (c) overlaid with a mother centriole cartoon model, which is depicted from the TEM image of RPE-1 cells (left) to illustrate the potential localization of sDAPs on the sDAP stems. (Bottom panel) Magnified view of the inset in panel (d). Bars: panels (a, d) (top) = 200 nm; panel (c) (inset), (d) (bottom) = 100 nm.
Figure 3

3D molecular architecture of DAPs and sDAPs.
(a) Relative localization of DAP and sDAP proteins in radial and lateral directions revealing the slanted arrangement of a DAP (dotted line) and the triangular structure of an sDAP (dashed line). (b) A 3D model of a mother centriole, illustrating the localization of various sDAP and DAP proteins for one of the possible arrangements when all nine sDAPs are present. (c) An axial view of the 3D model in panel (b) viewed from the distal end of the centriole, illustrating the radial positions of CEP89 and various sDAP proteins. (d) Lateral view of the model in panel (c). (e) Close view of the sDAP and the DAP in panel (d). ODF2 localizes at both ends of the sDAP and close to the centriole wall; CEP89 localizes on the DAP as well as in the sDAP region.
Figure 4 with 1 supplement
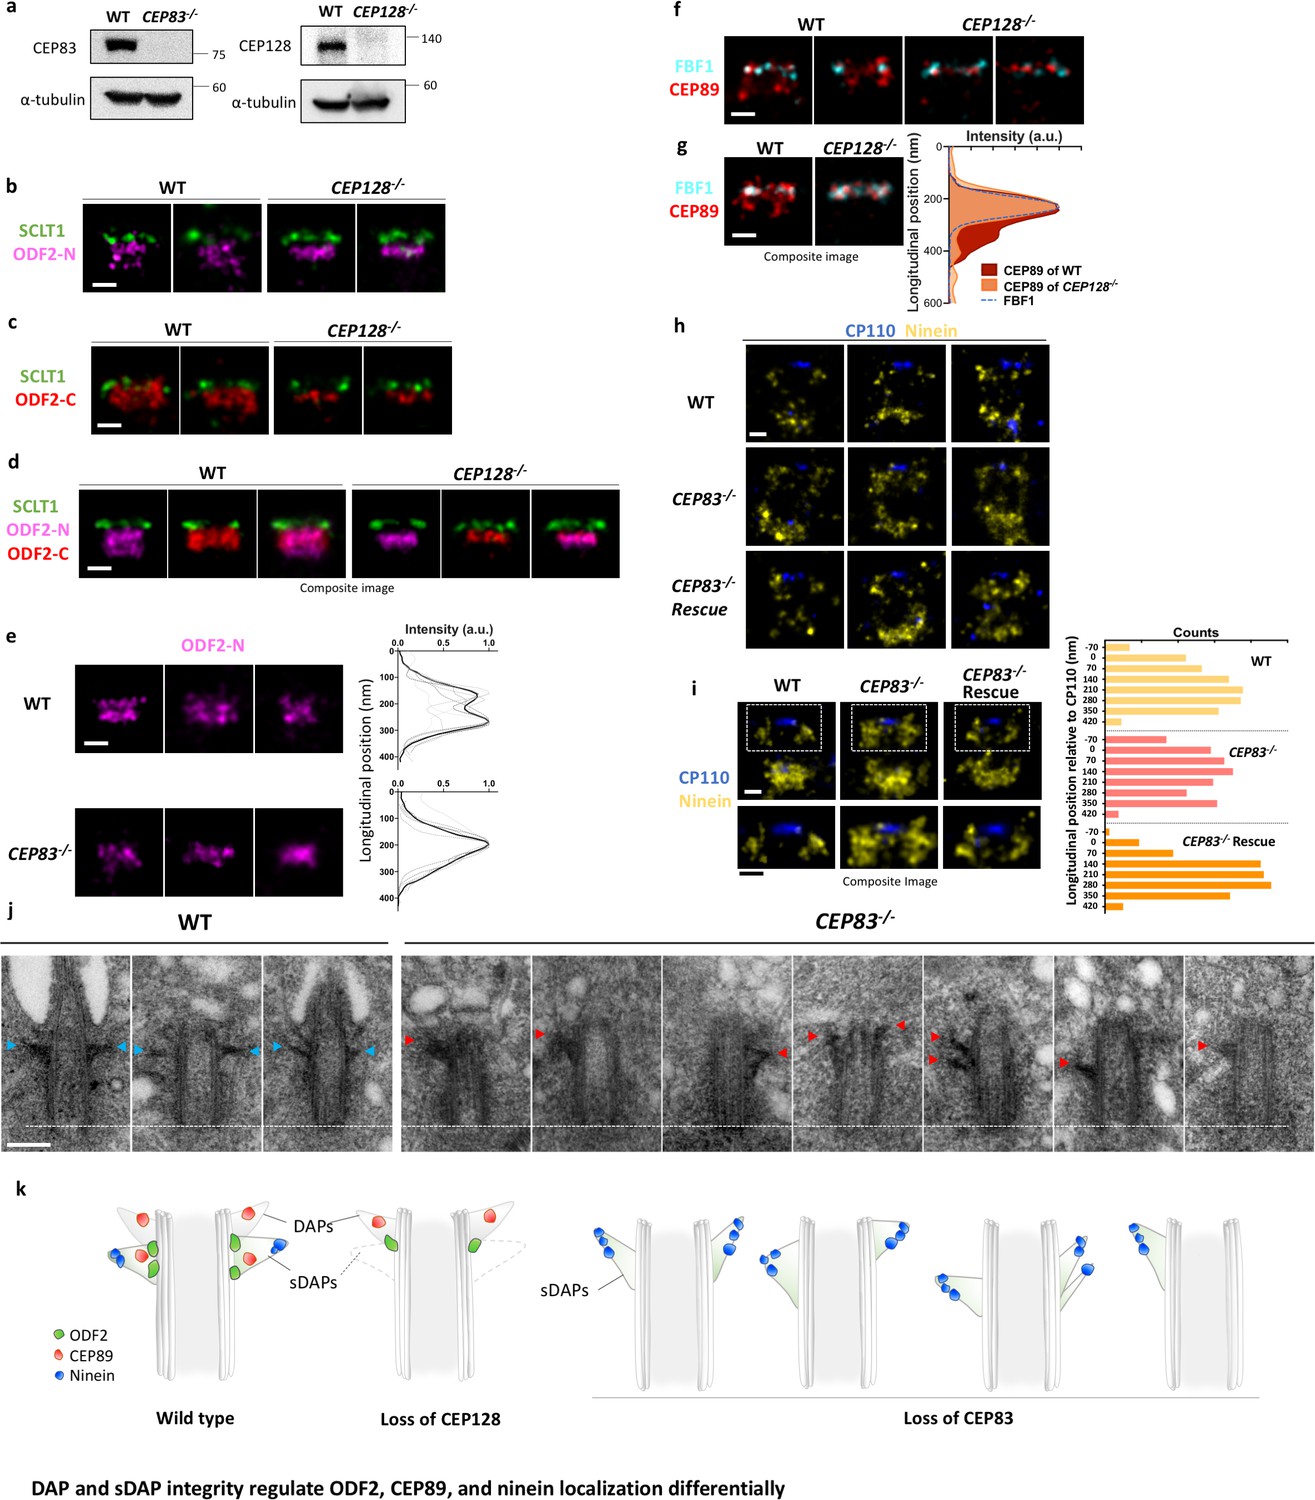
DAP and sDAP integrity regulates ODF2, CEP89, and ninein localization differentially.
(a) Immunoblotting confirming knockout of CEP83 or CEP128 in RPE-1 cells. WT, wild-type RPE-1 cells; CEP128–/–, CEP128 knockout RPE-1 cells. (b, c) Representative two-color dSTORM images of (b) the N-terminus of ODF2 and (c) the C-terminus of ODF2 with SCLT1 in WT cells and CEP128–/– cells. (d) Two-color dSTORM images in panels (b) and (c) aligned and combined according to their longitudinal positions relative to SCLT1 (n = 5 centrioles per group). (e) (Left) Representative dSTORM images of ODF2 in WT and CEP83 knockout RPE-1 cells (CEP83–/–). (Right) Intensity profile of WT and CEP83–/– cells (WT, n = 7 centrioles; CEP83–/–, n = 6 centrioles) showing that ODF2 becomes a single-layer structure when CEP83 is depleted. (f) Representative two-color dSTORM images of CEP89 and FBF1 in WT and CEP128–/–cells. (g) (Left) Two-color dSTORM images in panel (e) aligned and combined according to their longitudinal positions relative to FBF1 (WT, n = 5 centrioles; CEP128–/–, n = 6 centrioles). (Right) Intensity profile of the images in the left panel showing that the lower layer of CEP89 is absent in the CEP128–/– cells. (h) Representative two-color dSTORM images of ninein and CP110 in WT, CEP83–/–, and CEP83–/– cells stably expressing wild-type CEP83 protein (CEP83–/–Rescue). (i) (Left, top) Two-color dSTORM images in panel (g) aligned and combined according to their longitudinal positions relative to CP110 (WT, n = 5 centrioles; CEP83–/–, n = 6 centrioles; CEP83–/–Rescue, n = 5 centrioles). (Left, bottom) Magnified images of the insets in the top row. (Right) Histograms for the images on the left revealing that ninein is distributed towards the centriole distal end in CEP83–/– cells as compared to that in WT and CEP83–/–Rescue cells. (j) TEM of the mother centriole of WT and CEP83–/–RPE-1 cells. sDAPs in the WT and CEP83–/–cells are marked by blue and red arrowheads, respectively. (k) Cartoon model illustrating the changes in sDAP protein localization upon CEP128 depletion and the variations of sDAP structure upon CEP83 depletion. Bars = 200 nm.
Figure 4—figure supplement 1
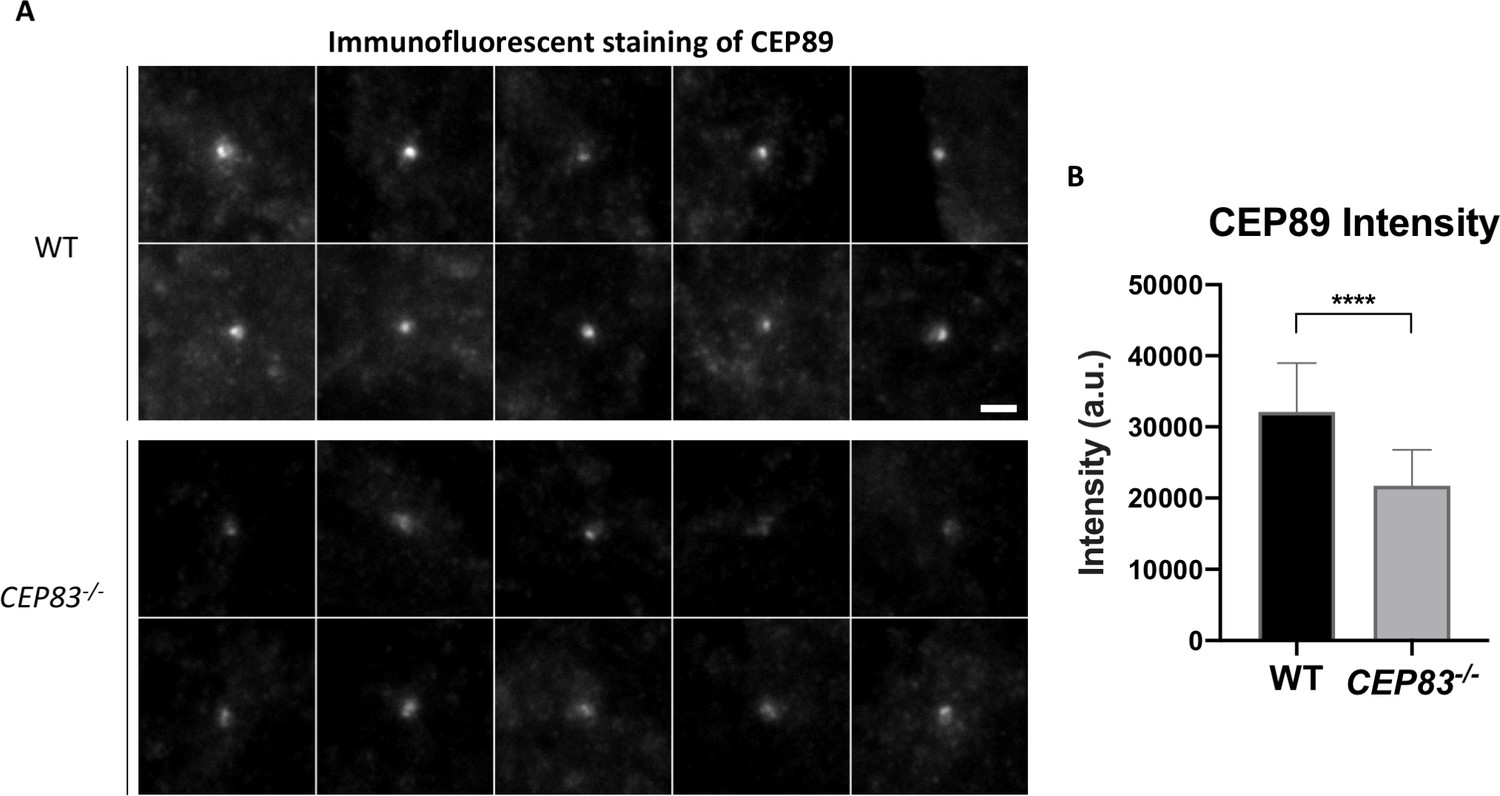
CEP89 intensity is significantly reduced upon CEP83 knockout.
(A) Representative epifluorescence images revealing that CEP89 intensity at the centriole is highly reduced upon DAP depletion in CEP83–/–cells (WT, n = 41 centrioles; CEP83–/–, n = 38 centrioles). Bar = 2 μm. (B) Statistical analysis showing a significant reduction in CEP89 intensity in CEP83–/–cells as compared to WT cells. ****, p<0.0001.
Figure 5 with 2 supplements
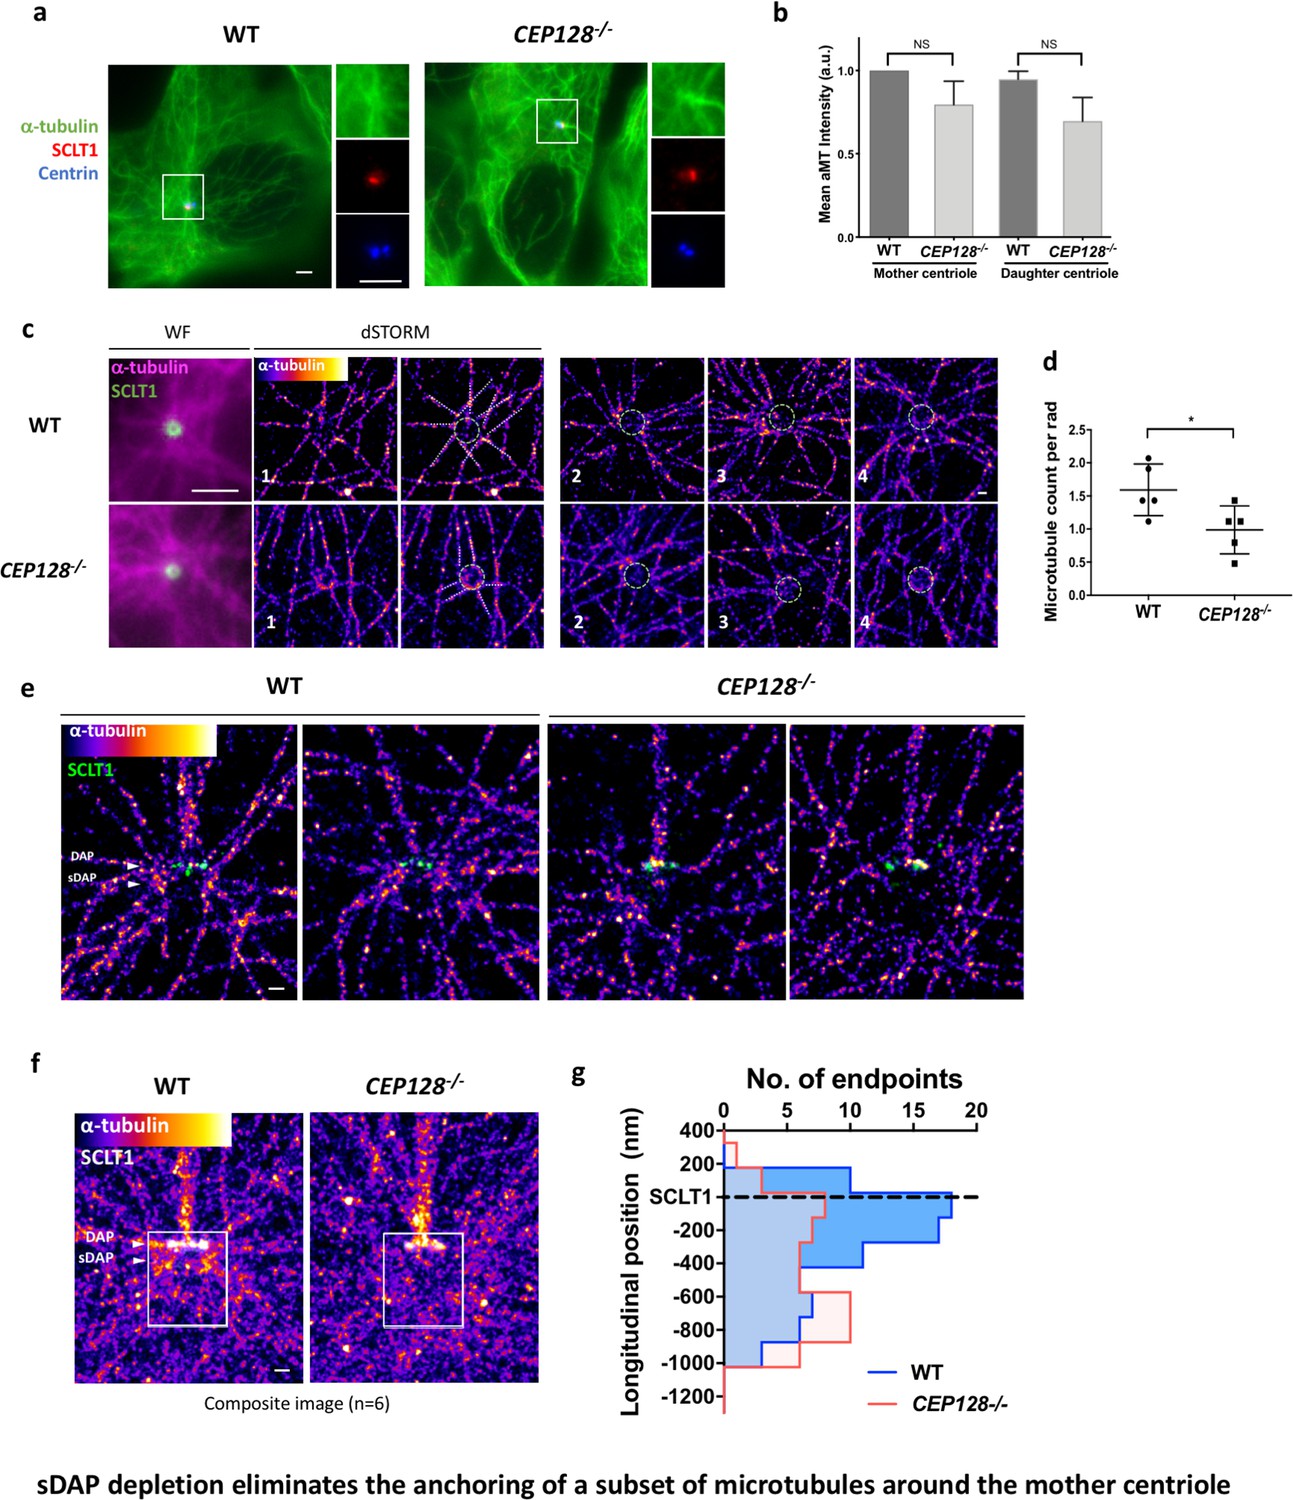
sDAP depletion eliminates the anchoring of a subset of microtubules around the mother centriole.
(a) Representative immunofluorescence images of α-tubulins in WT and CEP128–/– RPE-1 cells. Centrin was the centriole marker whereas SCLT1 was the mother-centriole-specific marker. (Inset) Magnified images showing the organization of α-tubulin fibers around the centriole. (b) Analysis of mean α-tubulin intensity around mother and daughter centrioles in WT and CEP128–/– cells. NS, not significant. (c) (Left) dSTORM images revealing fewer α-tubulin fibers arranged around the CEP128–/– centriole (white dotted line) as compared to the WT centriole. (Right) Representative dSTORM images of α-tubulin fibers in WT and CEP128–/–centrioles. SCLT1 is co-stained as a marker for the axial centriole view (green dashed line). (d) Statistical analysis counting the number of α-tubulin fibers per radian (rad) around the WT and CEP128–/–centrioles (n = 5 centrioles each), *p<0.05. Figure 5—figure supplement 1 details the analysis approach. (e) Representative lateral dSTORM images revealing the organization of centrosomal α-tubulin fibers around the WT and CEP128–/–centrioles in the longitudinal direction. (f) dSTORM images in panel (e) aligned and combined using SCLT1 as a position reference. (g) Statistical analysis counting the number of α-tubulin fibers at various longitudinal positions around the WT and CEP128–/–centrioles (WT, n = 78 data points; CEP128–/–, n = 57 data points, p<0.01). Figure 5—figure supplement 2 shows the analysis strategy. Bars: (a, c) (WF images) = 2 μm; (c, e, f) = 200 nm.
Figure 5—figure supplement 1
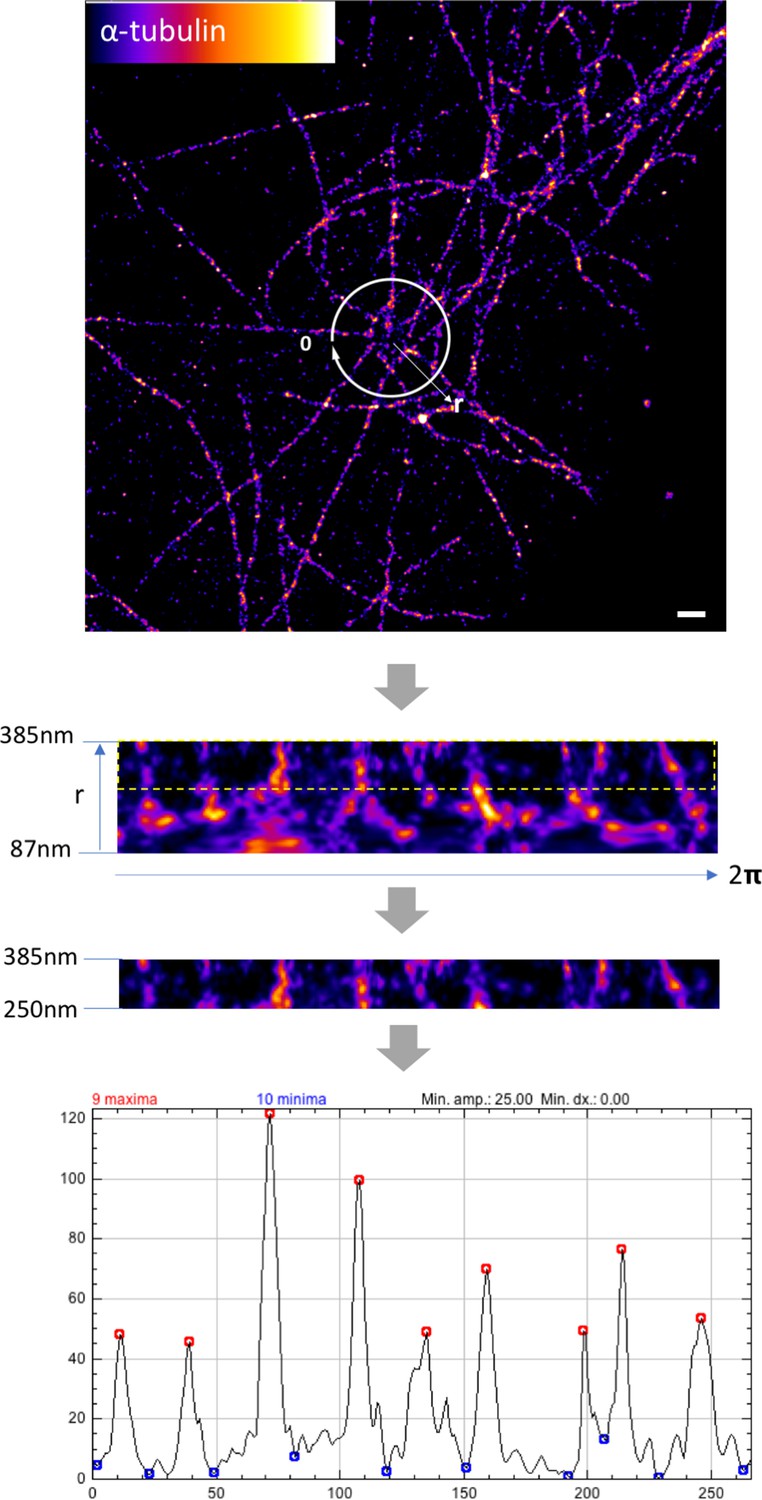
Measuring the number of microtubules around sDAPs in axial view.
Representative dSTORM image of an axial-view WT centriole showing the organization of α-tubulin fibers around the centriole. To measure the number of microtubules around the centriole systematically, an area radially enclosing 87–385 nm from the centriole center was first selected (both WT and CEP128–/–cells, n = 5 centrioles). The upper part of the area from 250 nm to 385 nm, which denotes the radial localization of the outer sDAP proteins (i.e., CEP170, ninein; 250–350 nm radial distribution radius from the centriole center), was selected for analysis. The number of peaks in the intensity profile, which represents the number of microtubules, was measured using the Find Peaks plugin in ImageJ. Bar = 500 nm.
Figure 5—figure supplement 2

Measuring the longitudinal position of the microtubule fiber endpoints.
Representative dSTORM image of α-tubulin fiber organization in a lateral-view WT centriole (outlined). The (x,y) coordinates of microtubule fibers ending around the centriole (asterisks) were measured (WT, n = 78 data points; CEP128–/–, n = 57 data points) using ImageJ, and then organized into a histogram for statistical analysis (Figure 5g). Bar = 400 nm.
Figure 6
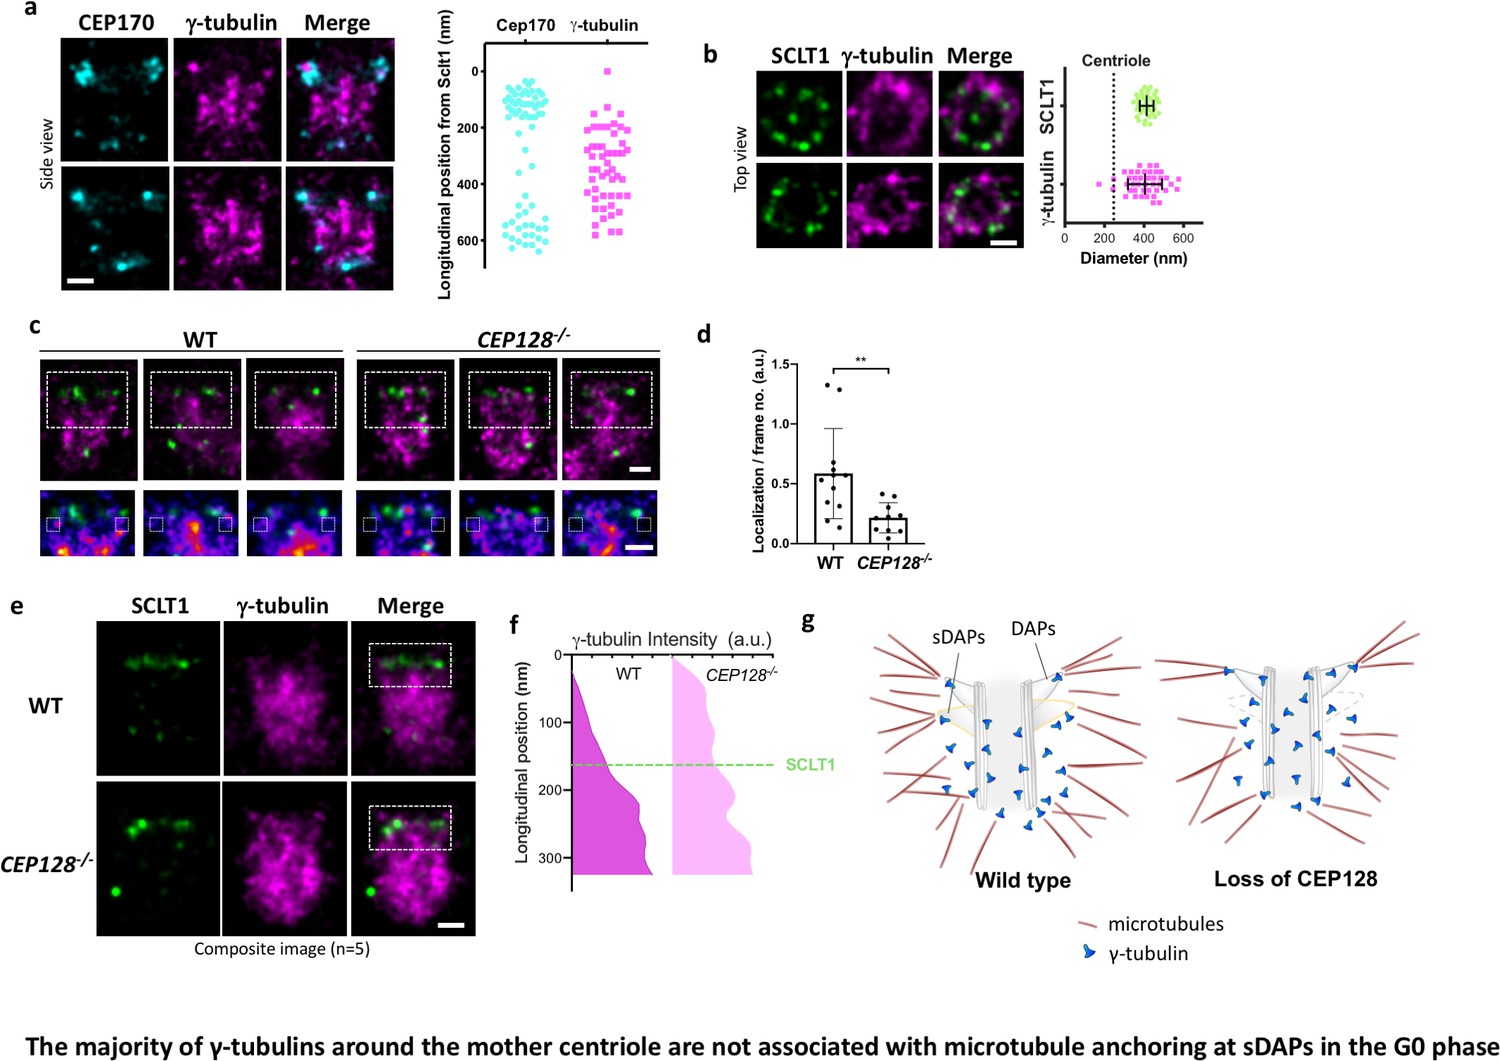
The majority of γ-tubulins around the mother centriole are not associated with microtubule anchoring at sDAPs in the G0 phase.
(a) (Left) Representative dSTORM images revealing the longitudinal positions of γ-tubulins with respect to CEP170. (Right) Scatter plot comparing the longitudinal positions of γ-tubulin with that of CEP170 (n > 7 centrioles); the longitudinal position of SCLT1 is set as zero. (b) (Left) Representative dSTORM images revealing the radial distribution of γ-tubulins. SCLT1 is the marker for an axial centriole view. (Right) Mean diameter analysis revealing that the radial distribution of γ-tubulins is similar to that of SCLT1. The dotted line indicates the diameter of the centriole wall measured in EM images. (c) (Top) Representative lateral two-color dSTORM images revealing the organization of centrosomal γ-tubulin in the WT and CEP128–/– centrioles. (Bottom) Magnified images of the inset in the top row. (d) Statistical analysis measuring γ-tubulin intensity around sDAPs (insets in panel [c]) in the WT and CEP128–/– centrioles (both WT and CEP128–/–, n = 5 centrioles), **, p<0.01. (e) Two-color dSTORM images in panel (c) aligned and combined according to the longitudinal position of γ-tubulin relative to SCLT1 (n = 5 centrioles). (f) Statistical analysis of γ-tubulin intensity in the insets in panel (e) revealing that γ-tubulins are distributed towards the centriole distal end upon CEP128 depletion. (g) A model speculating on the role of sDAPs in microtubule anchoring. The loss of CEP128 relaxes the distribution of γ-tubulins toward the centriole distal end, whereas microtubules fail attach to the centriole at sDAPs upon CEP128 depletion. Bars = 200 nm.
Author response image 1

Representative dSTORM images revealing the radial distribution of γ-tubulins.
SCLT1 serves as a marker for an axial centriole view. (Left Panel) Figure 6b in the manuscript in which SCLT1 is marked by Cy3b dye and γ-tubulin by AF647. (Right panel) Staining of the SCLT1/γ-tubulin pair in a reverse manner, i.e. marking SCLT1 with AF647 dye and γ-tubulin with Cy3b. Bar = 200nm.
Author response image 2

A bar graph comparing the percentage of ciliated RPE-1 cells after serum starvation (SF) for 24 hour (1 day) and 48 hours (2 days).
Figure excerpted from figure 1C of our previous work (PMID31455668).
Author response image 3
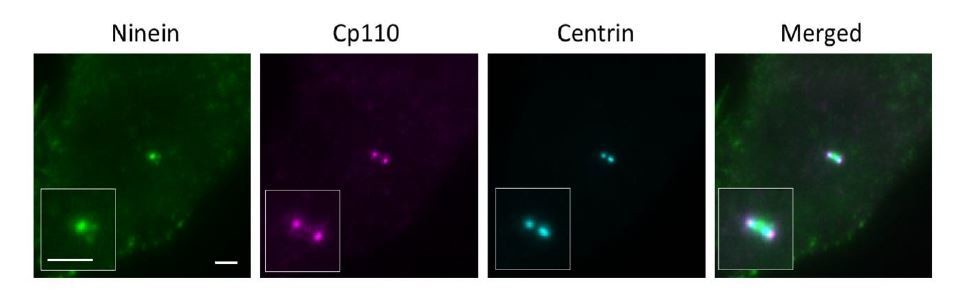
Wide field imaging of centriole in the lateral view.
Bar = 2um.
Author response image 4
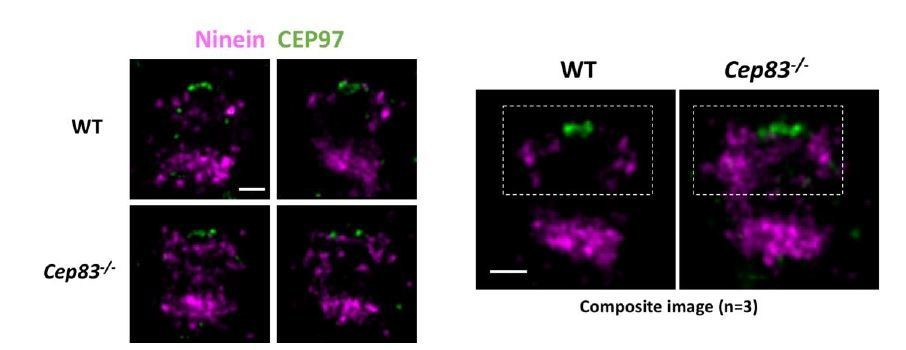
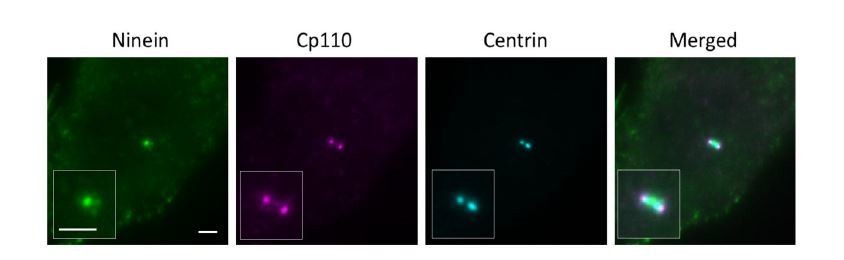
Dual Color dSTORM imaging of Ninein and CEP97.
Bars = 200nm.
Author response image 5
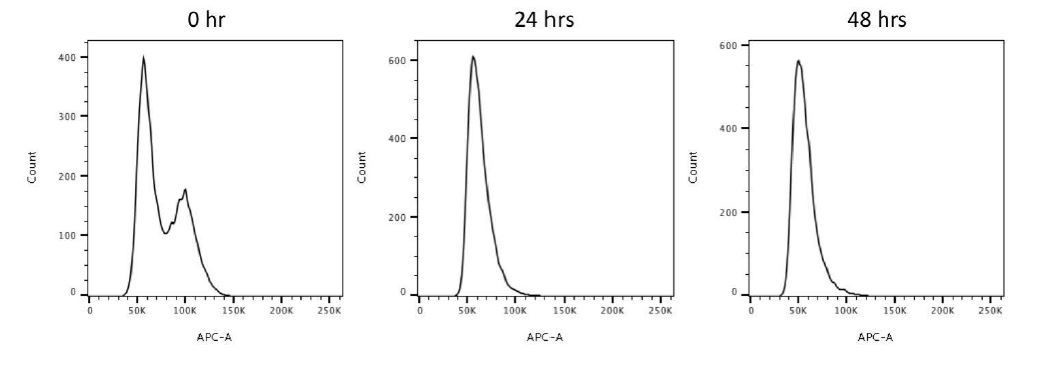
Flow cytometry analysis of 0, 24, 48-hour serum starved RPE-1 cells.
This data reveals that 24-hour and 48-hour serum starvations drive most cells to the G0/G1 population.
Author response image 6
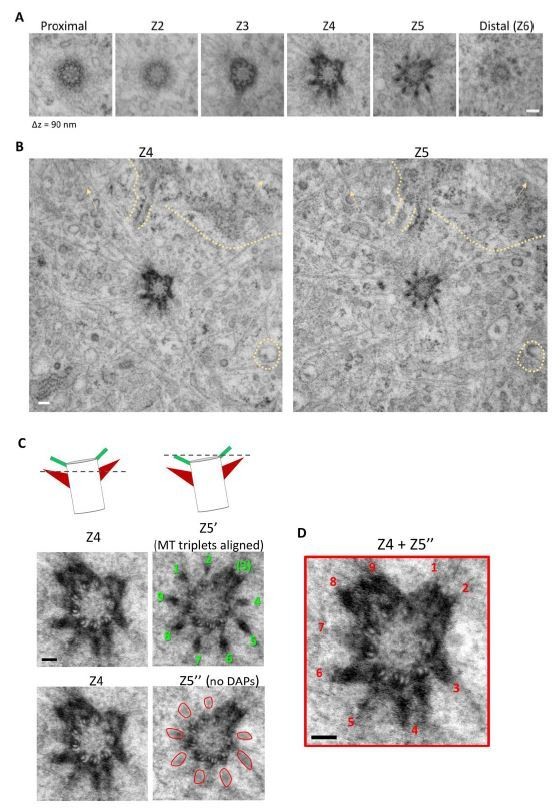
Serial TEM imaging of a mother centriole in a wild type RPE-1 cell from Figure 1I.
(A) The serial TEM sections from Figure 1I. Longitudinal difference between each plane is around 90 nm (B) TEM images of the Z4 and Z5 planes assuring alignment of the images. Similarity in background signals between the two planes are indicated by dashed line and arrows. (C) (Left top panel) A cartoon illustrating the orientation of the Z4 and Z5 planes of the centriole; a dashed line represents the z position of the TEM section. (Left middle panel) Rotational alignment of MT triplets in Z5 plane to that of the Z4 plane; the nine DAPs are indicated by numbers in green. (Left bottom panel) Removal of DAP signal (marked by red circular shapes) in the Z5' image. (Right) Stacking of Z4 and Z5'' images to reveal the position of the nine sDAP stems as indicated by numbers in red. Bars = 100 nm.
Author response image 7

Serial TEM imaging of a mother centriole in a wild type RPE-1 cell.
The cartoon in the upper panel illustrates the orientation of the centriole; a dashed line represents the z position of each TEM section (Z1-Z6, from proximal to centriole distal end) with a longitudinal difference of around 90 nm each. The Z4' image is derived from Z4 with the DAP signal removed. The composite image composed of Z2, Z3 and Z4' reveals the presence of nine sDAP stems. Bar = 100 nm.
Author response image 8
Widefield imaging of a centriole in the lateral view.
Bar = 2um.
Videos
Video 1
3D view of a mother centriole model containing (i) DAP and sDAP proteins, (ii) a 3D molecular model of a mother centriole with reference to the centriole, sDAP, and DAP from previous centriole, and (iii) TEM results (Anderson, 1972; Paintrand et al., 1992) and our sDAP TEM results (Figure 1i), together with sDAP results from axial and lateral dSTORM images (Figure 3a).
Tables
Key resources table
| Reagent type (species) or resource | Designation | Source or reference | Identifiers | Additional information |
|---|---|---|---|---|
| Cell line (Homo-sapiens) | hTERT RPE-1 | ATCC | CRL-4000 | Identity authenticated with STR Profiling by ATCC |
| Transfected construct (Homo-sapiens) | CEP83-Myc | Lo et al., 2019 | ||
| Antibody | FBF1 (rabbit polyclonal) | Proteintech, Rosemont, IL, USA | 11531–1-AP | 1/200 |
| Antibody | SCLT1 (rat polyclonal) | Tanos et al., 2013 | – | 1/250 |
| Antibody | CEP89 (rat polycloncal) | Tanos et al., 2013 | – | 1/500 |
| Antibody | ODF2-N (rabbit polyclonal) | Sigma-Aldrich | HPA001874 | 1/200 |
| Antibody | ODF2-C (rabbit polyclonal) | Abcam | ab43840 | 1/200 |
| Antibody | CEP128 (rabbit polyclonal) | Abcam | ab118797 | 1/200 |
| Antibody | CENTRIOLIN (mouse monoclonal) | Santa Cruz | sc-365521 | 1/200 |
| Antibody | NINEIN (rabbit polyclonal) | Bethyl | A301-504 | 1/1000 |
| Antibody | NINEIN (mouse monoclonal) | Santa Cruz | sc-376420 | 1/500 |
| Antibody | CEP170 (rabbit polyclonal) | Abcam | ab72505 | 1/400 |
| Antibody | CCDC68 | Proteintech | 26301–1-AP | 1/400 |
| Antibody | C-NAP1 | Santa Cruz | sc-390540 | 1/200 |
| Antibody | γ-tubulin | Sigma-Aldrich | T6557 | 1/500 |
| Antibody | α-tubulin | Santa Cruz | sc-32293 | 1/500 |
| Antibody | Centrin (mouse monoclonal) | Millipore | 04–1624 | 1/400 |
| Recombinant DNA reagent | gRNA cloning vector | Addgene | #41824 | |
| Recombinant DNA reagent | CEP128 gRNA | (Mazo et al., 2016) | gRNA2 (5′-GCTGCCAGATCAACGCACAGGG-3′), gRNA4 (5′-GAGTCAGCTCTGAGATCTGAAGG-3′), gRNA5 (5′ GCAGCTGAACTTCAGCGCAATGG-3′) | |
| Recombinant DNA reagent | CEP83 gRNA | (Mazo et al., 2016) | gRNA1 (5′-GGTGGAGACAGTGGATTGACAGG-3′), gRNA2 (5′-GATATTAACTCCACAAAAATTGG-3′) | |
| Software, algorithm | Metamorph | Molecular Device | ||
| Software, algorithm | ImageJ | NIH |
Additional files
-
Supplementary file 1
Supplementary table 1.
Radial and longitudinal positions of DAP and sDAP proteins. The positions of DAP and sDAP proteins from dSTORM images (relative to the DAP protein SCLT1) in the present study and our previous work (Yang et al., 2018). Supplementary table 2. Primary antibodies used in immunofluorescent staining. Summarized information on the sources, immunogens, and conditions of the primary antibodies used in the present study.
- https://cdn.elifesciences.org/articles/53580/elife-53580-supp1-v2.docx
-
Transparent reporting form
- https://cdn.elifesciences.org/articles/53580/elife-53580-transrepform-v2.pdf
Download links
A two-part list of links to download the article, or parts of the article, in various formats.
Downloads (link to download the article as PDF)
Open citations (links to open the citations from this article in various online reference manager services)
Cite this article (links to download the citations from this article in formats compatible with various reference manager tools)
Super-resolution microscopy reveals coupling between mammalian centriole subdistal appendages and distal appendages
eLife 9:e53580.
https://doi.org/10.7554/eLife.53580


