Comprehensive fitness maps of Hsp90 show widespread environmental dependence
- Department of Biochemistry and Molecular Pharmacology, University of Massachusetts Medical School, United States
- Instituto Gulbenkian de Ciência, Portugal
Figures
Figure 1 with 5 supplements
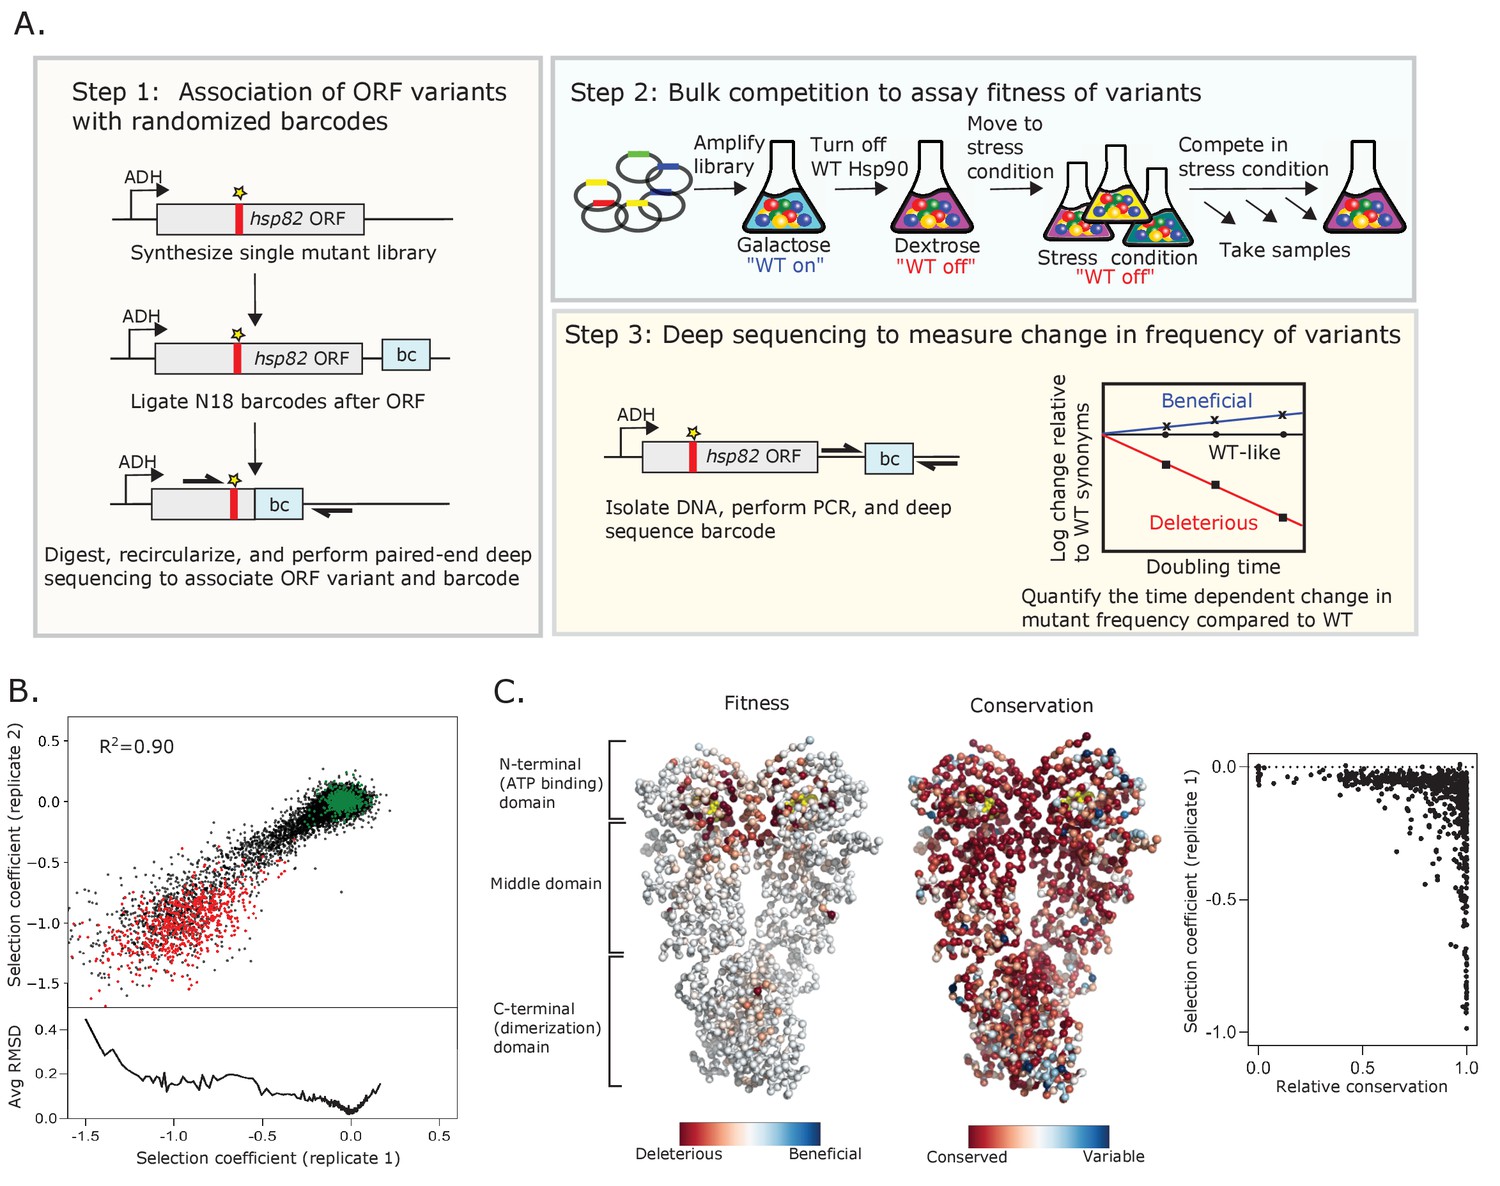
Approach to determine protein fitness maps of Hsp90.
(A) Barcoded competition strategy to analyze the growth effects of all single codon variants of Hsp90 in a single bulk culture. Hsp82 is the stress-inducible gene that encodes for Hsp90 (B) Measurements of selection coefficients of amino acid variants are reproducible in replicate growth competitions (see Figure 1—source data 1). Wild-type amino acids are shown in green and stop codons are shown in red. The bottom panel shows the Root-mean-square deviation (RMSD) averaged for a running window of 40 data points. (C) Average selection coefficients at each position in standard conditions mapped onto a homodimeric structure of Hsp90 (PDB 2cg9, Ali et al., 2006) and compared to patterns of evolutionary conservation (see Figure 1—source data 2). ATP is shown in yellow. The graph on the right compares relative conservation at each position of Hsp90 to the average selection coefficient at that position.
-
Figure 1—source data 1
Sequencing counts and selection coefficients for each individual amino acid change across amino acids 2–709 of Hsp90 in both replicates of standard conditions.
- https://cdn.elifesciences.org/articles/53810/elife-53810-fig1-data1-v2.xlsx
-
Figure 1—source data 2
Average selection coefficient (excluding stops) at each position of Hsp90 in Standard replicate 1.
- https://cdn.elifesciences.org/articles/53810/elife-53810-fig1-data2-v2.xlsx
Figure 1—figure supplement 1
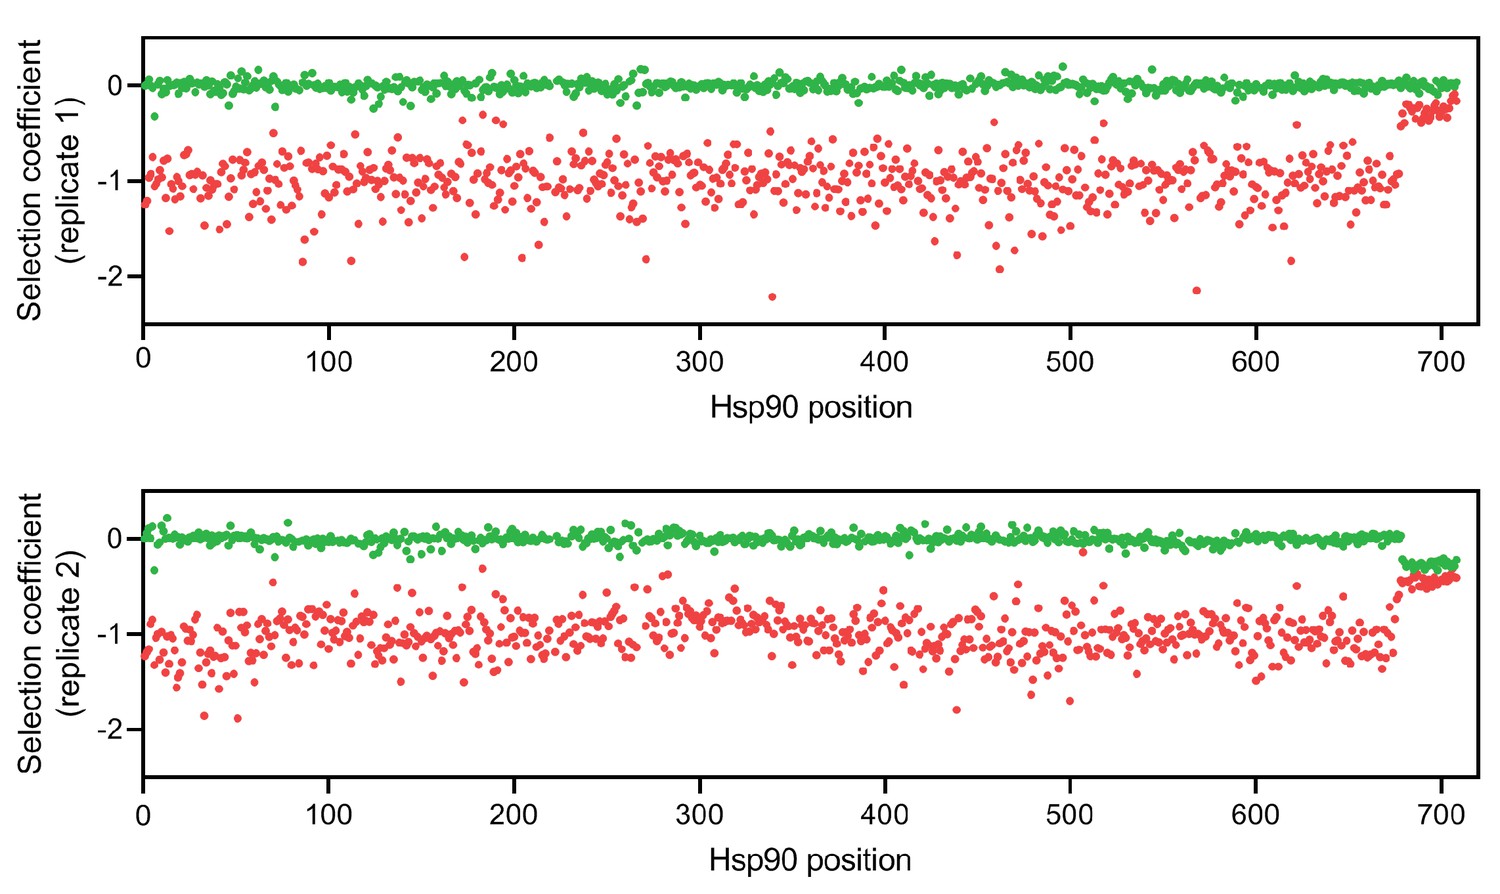
Selection coefficients for wild-type synonyms (green) and stops (red) at each position of Hsp90 for both replicates of standard conditions.
Figure 1—figure supplement 2
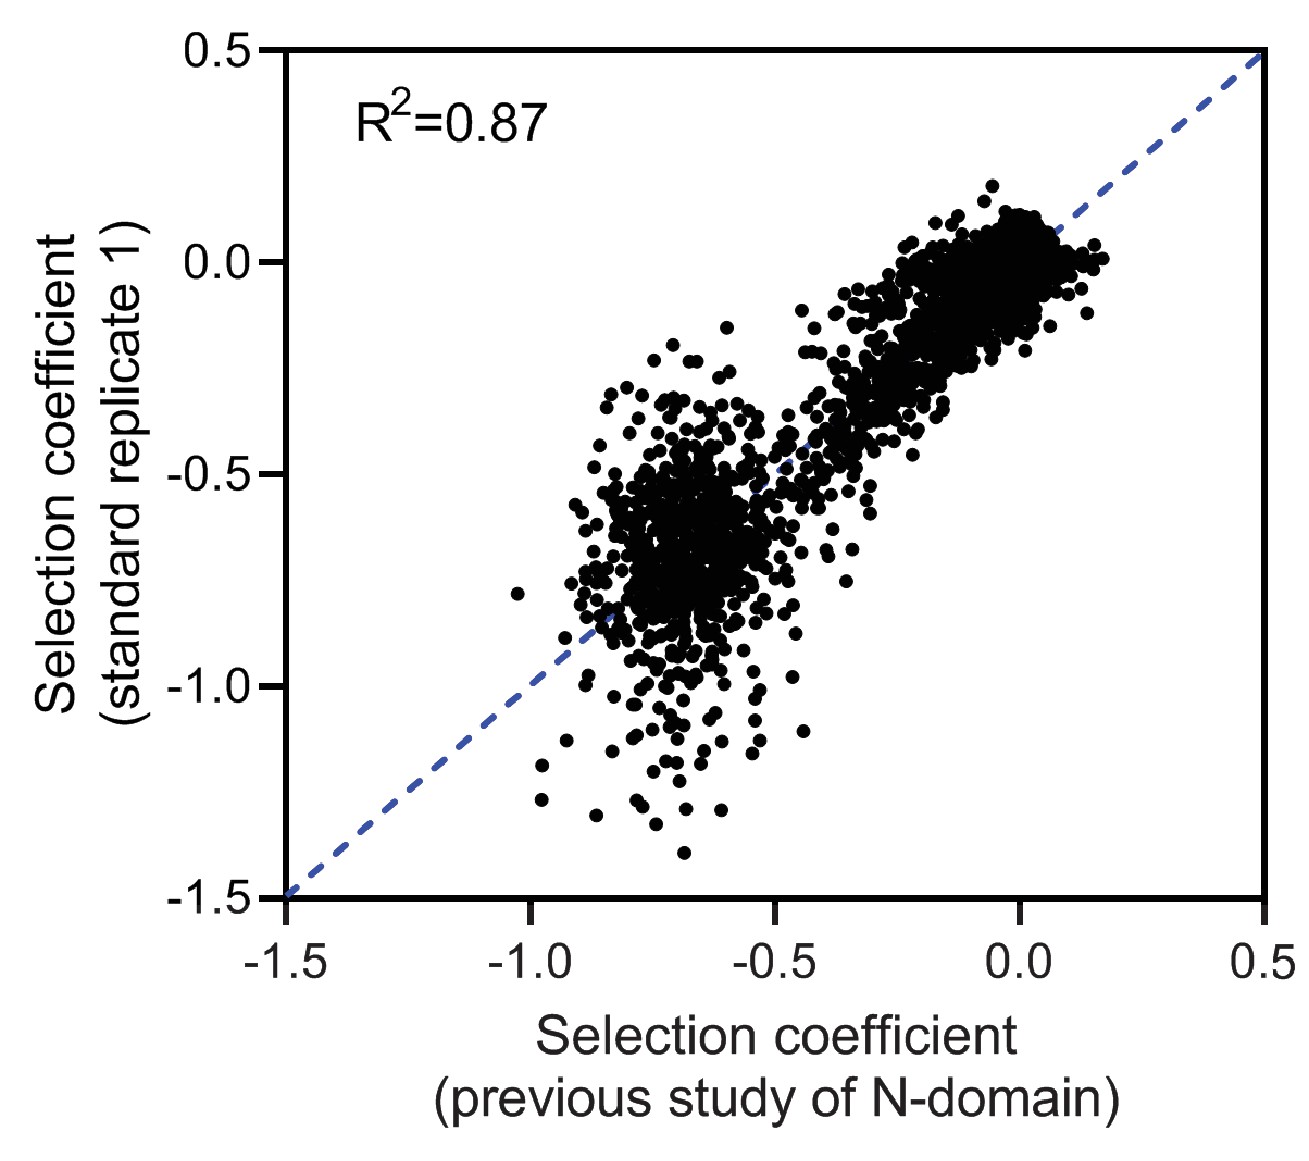
Measurement of selection coefficients for positions 2–220 in this study correlated strongly (R2 = 0.87) with estimates of the Hsp90 N-domain in a previous study (Mishra et al., 2016), indicating that biological replicates show high reproducibility.
The blue dashed line indicates the line of best fit.
Figure 1—figure supplement 3
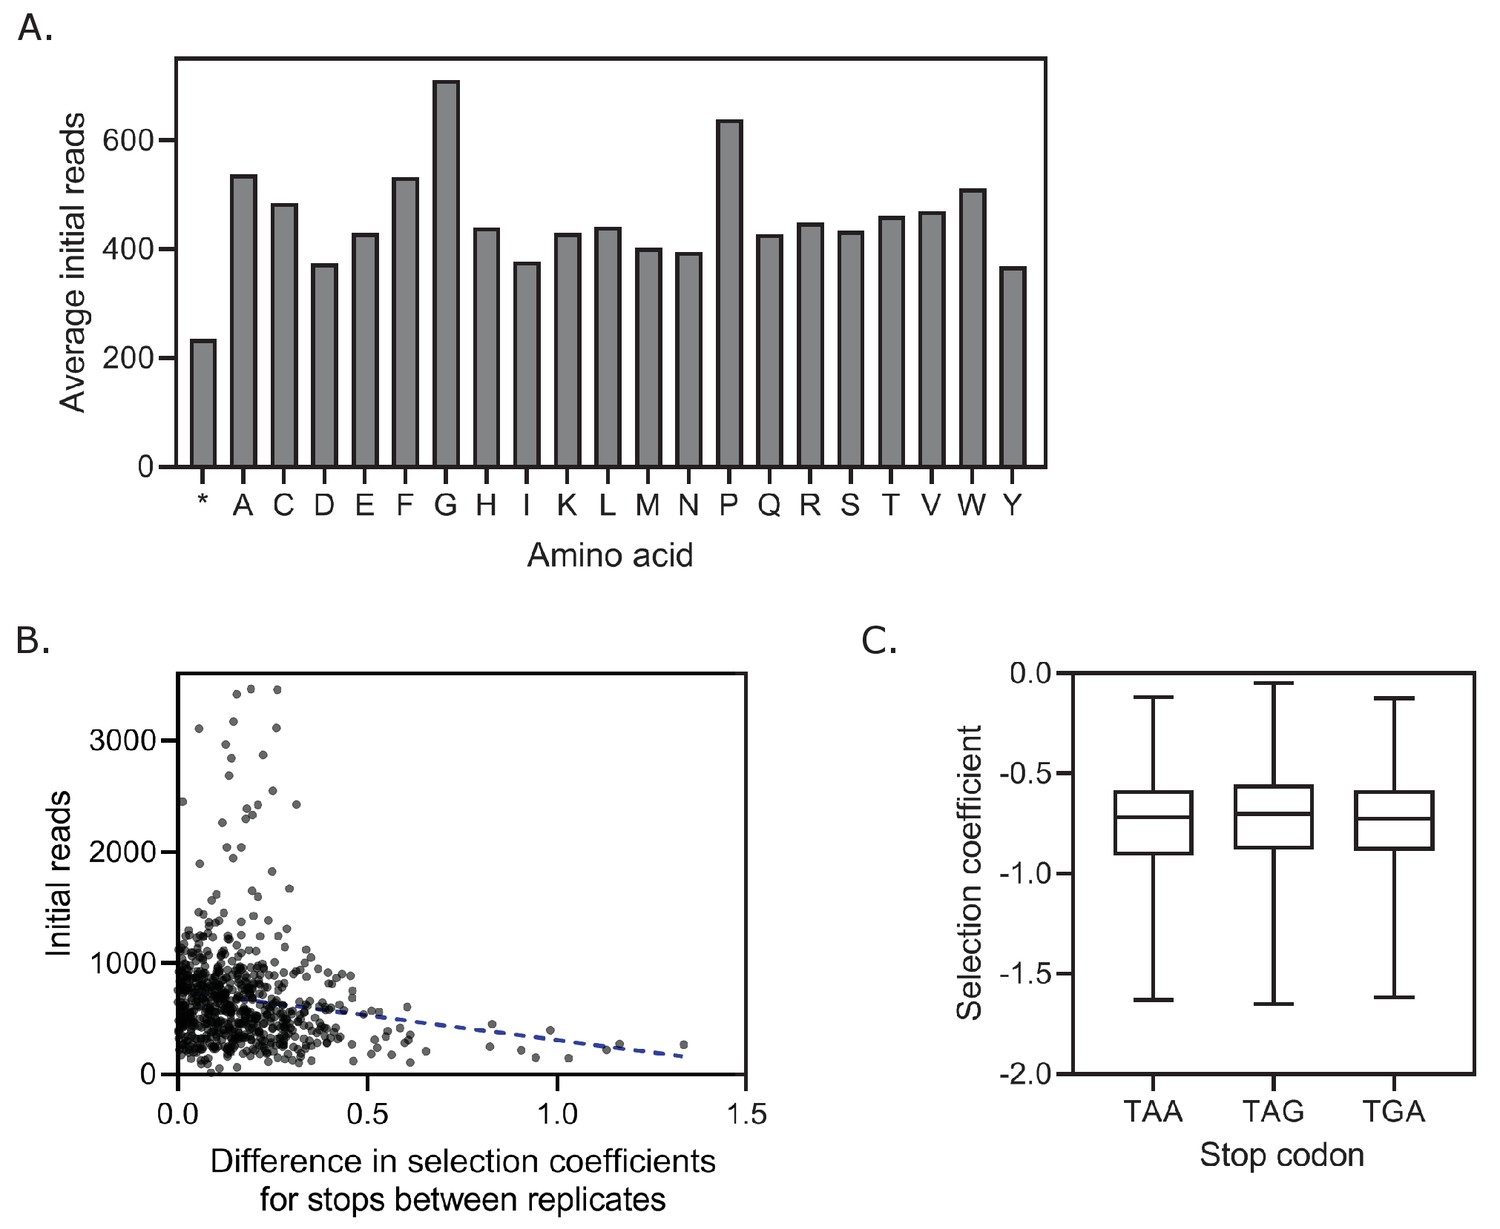
Analysis of variation in stop codon selection coefficients.
(A) The average initial reads measured per codon for each amino acid. (B) The difference in the selection coefficients between stops in the two standard replicates compared to the initial reads for the corresponding stop in replicate 1. The blue dashed line indicates the line of best fit. R2 = 0.022, p<0.0001. (C) The distribution of selection coefficients for each stop codon in standard replicate 1.
Figure 1—figure supplement 4
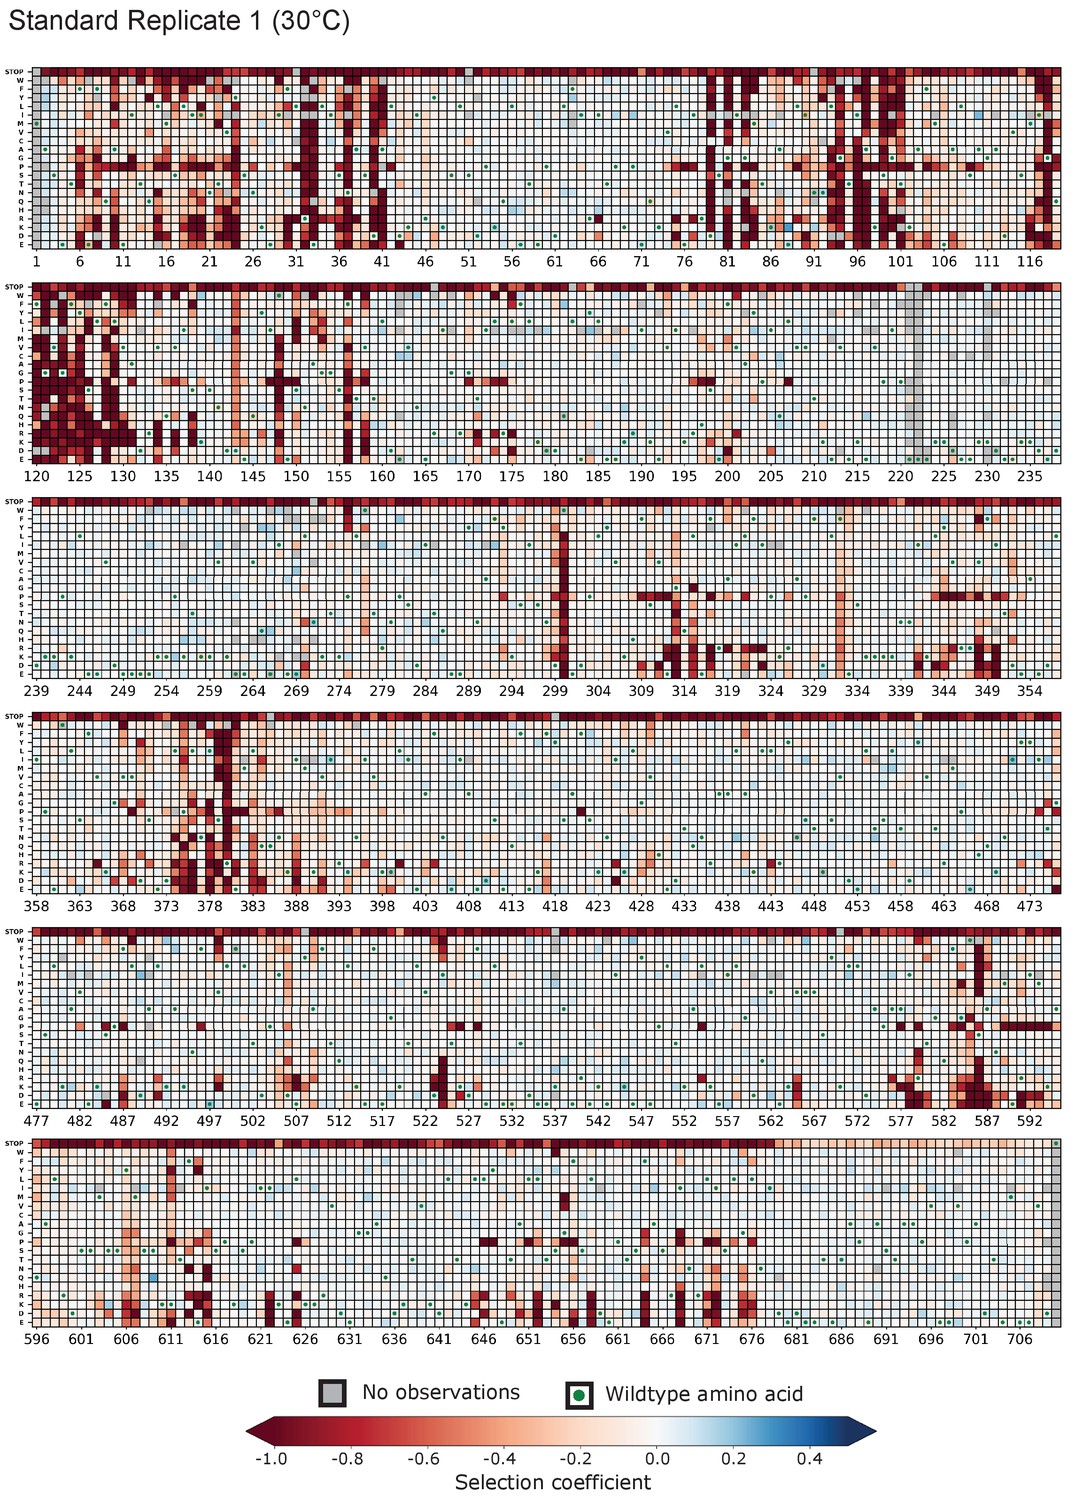
Heatmap representation of the selection coefficients observed for single amino acid changes across amino acids 2–709 of Hsp90 in standard (30°C) conditions in replicate 1.
Figure 1—figure supplement 5
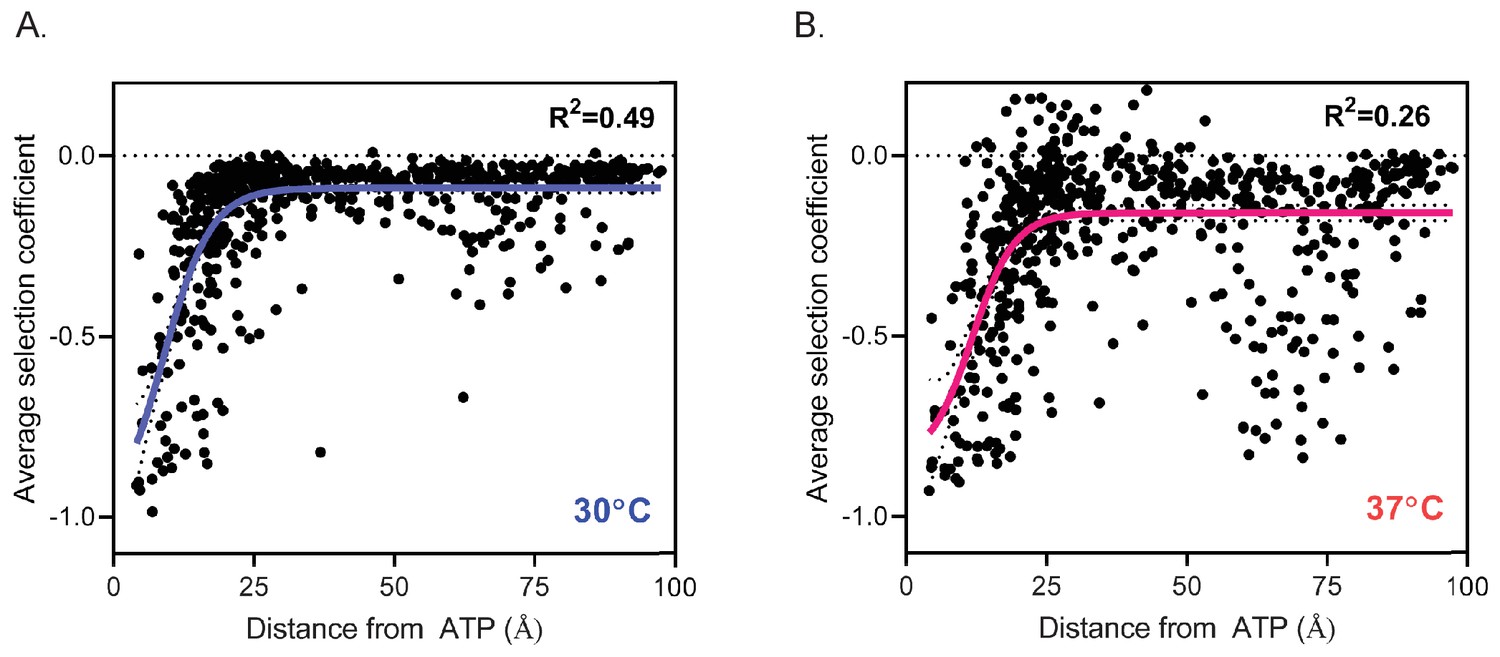
Correlation of mutational sensitivity with distance to ATP.
(A) The average selection coefficient at each position in standard (30°C) conditions correlates with distance to ATP (R2 = 0.49). (B) The average selection coefficient at each position at 37°C does not correlate as well with distance to ATP as in standard conditions (R2 = 0.26). The data points were fit to a sigmoid function.
Figure 2 with 9 supplements
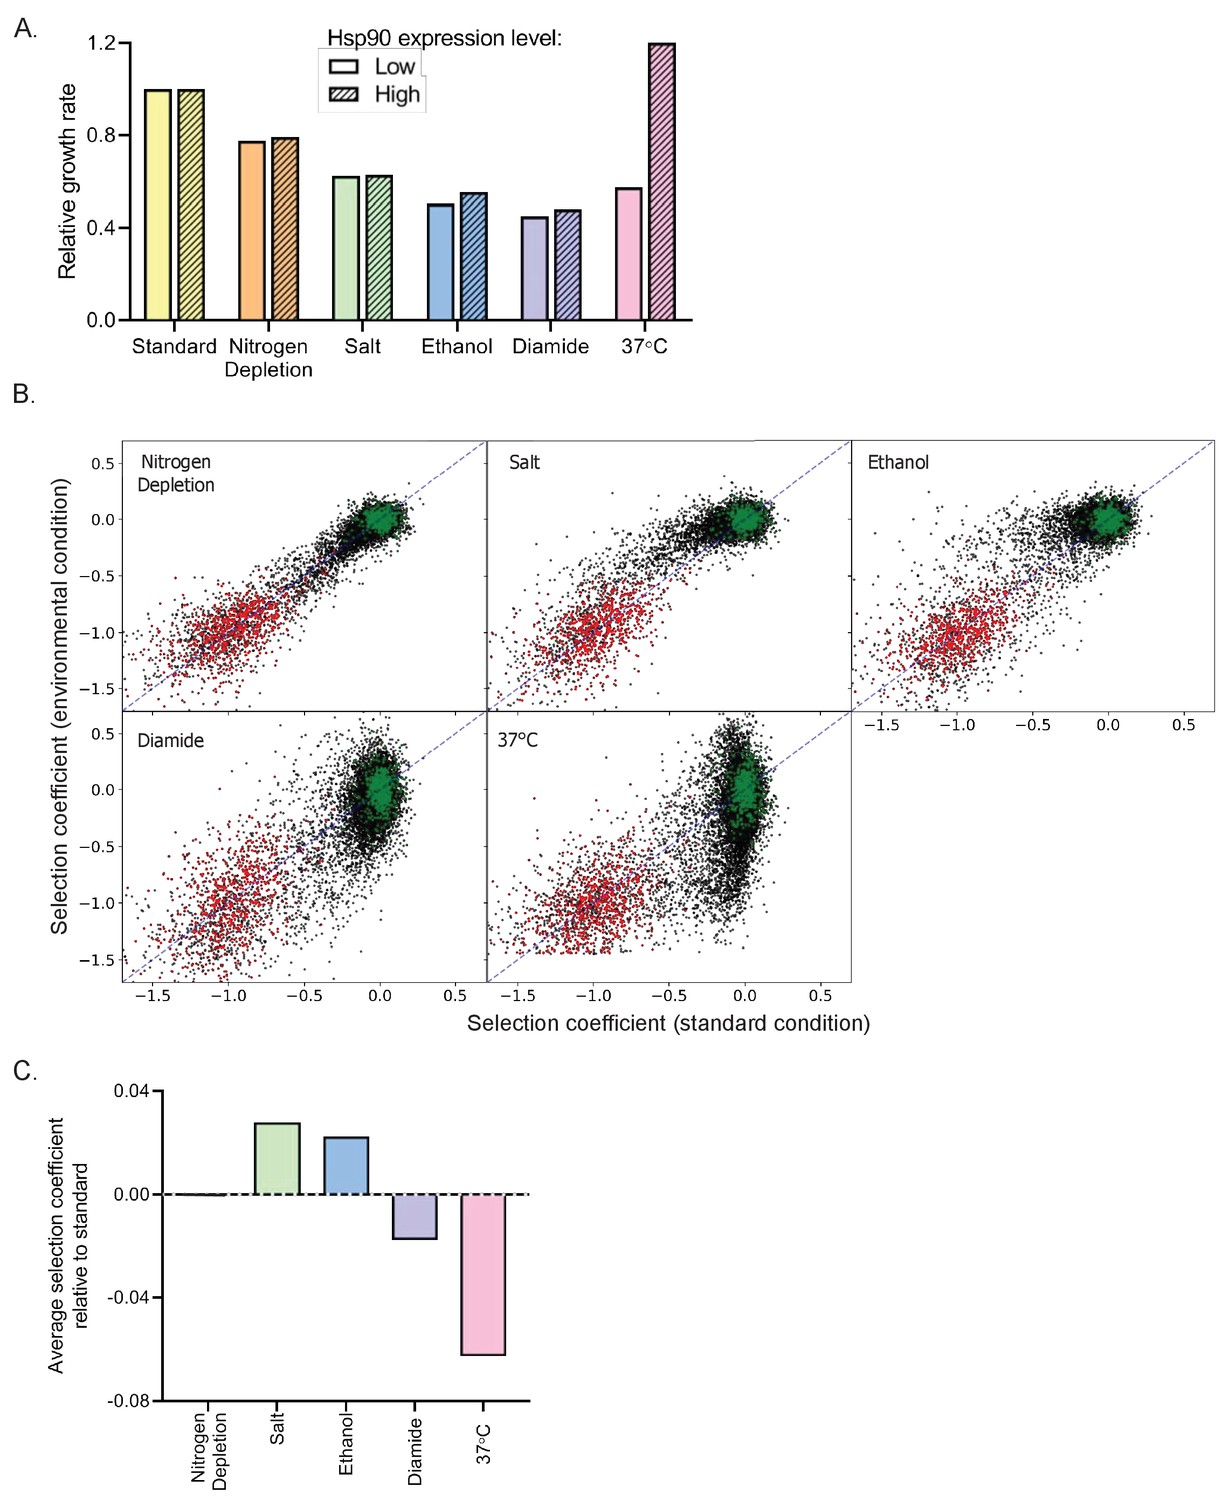
Impact of environmental stresses on yeast growth rates and selection on Hsp90 sequence.
(A) Growth rate of yeast with normal and reduced expression of Hsp90 protein in standard and stress conditions based on individual growth curves. Growth rates are normalized to growth in standard conditions with reduced Hsp90 expression. (B) Selection coefficients of all Hsp90 amino acid variants in stress conditions compared to standard conditions (see Figure 2—source data 1). Wild-type synonyms are shown in green and stop codons are shown in red. Selection coefficients were scaled to null (s = −1) for the average stop codon and neutral (s = 0) for the average wild type. The diagonal is indicated by the blue dashed line. (C) The average selection coefficient of all mutations relative to standard conditions, a metric of the strength of selection acting on Hsp90 sequence, in each stress condition.
-
Figure 2—source data 1
Sequencing counts and selection coefficients for each individual amino acid change across amino acids 2–709 of Hsp90 in Nitrogen Depletion, Salt, Ethanol, Diamide and 37°C.
- https://cdn.elifesciences.org/articles/53810/elife-53810-fig2-data1-v2.xlsx
Figure 2—figure supplement 1
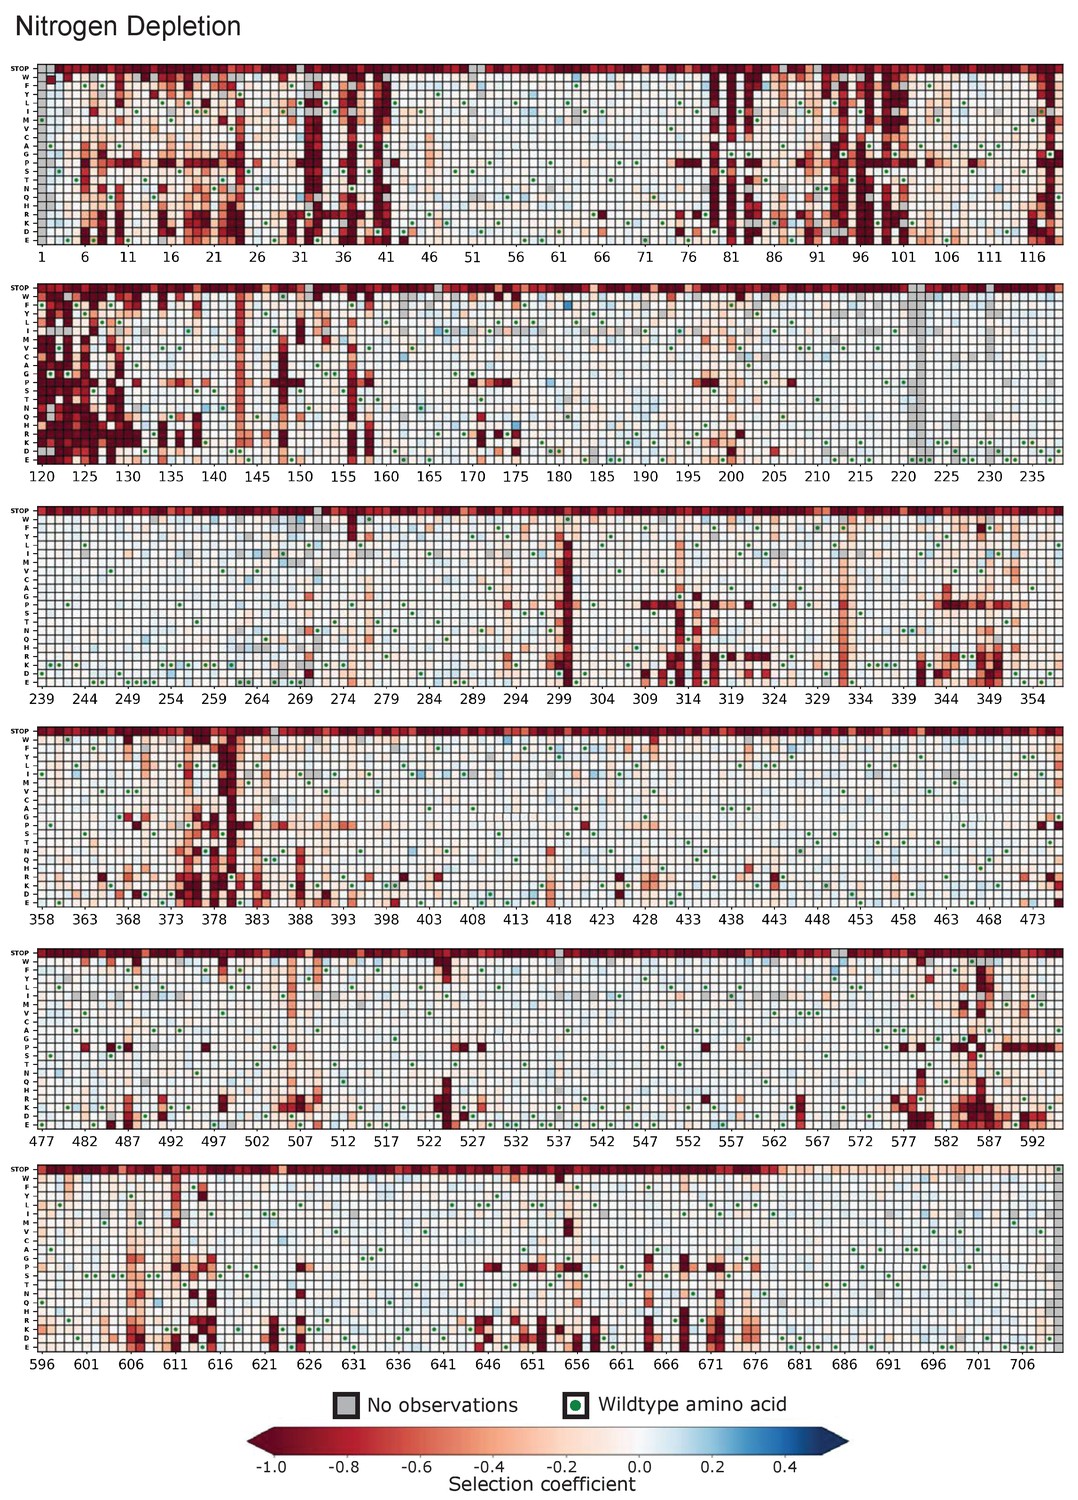
Heatmap representation of the fitness map observed for single amino acid changes of Hsp90 in nitrogen depletion.
Figure 2—figure supplement 2
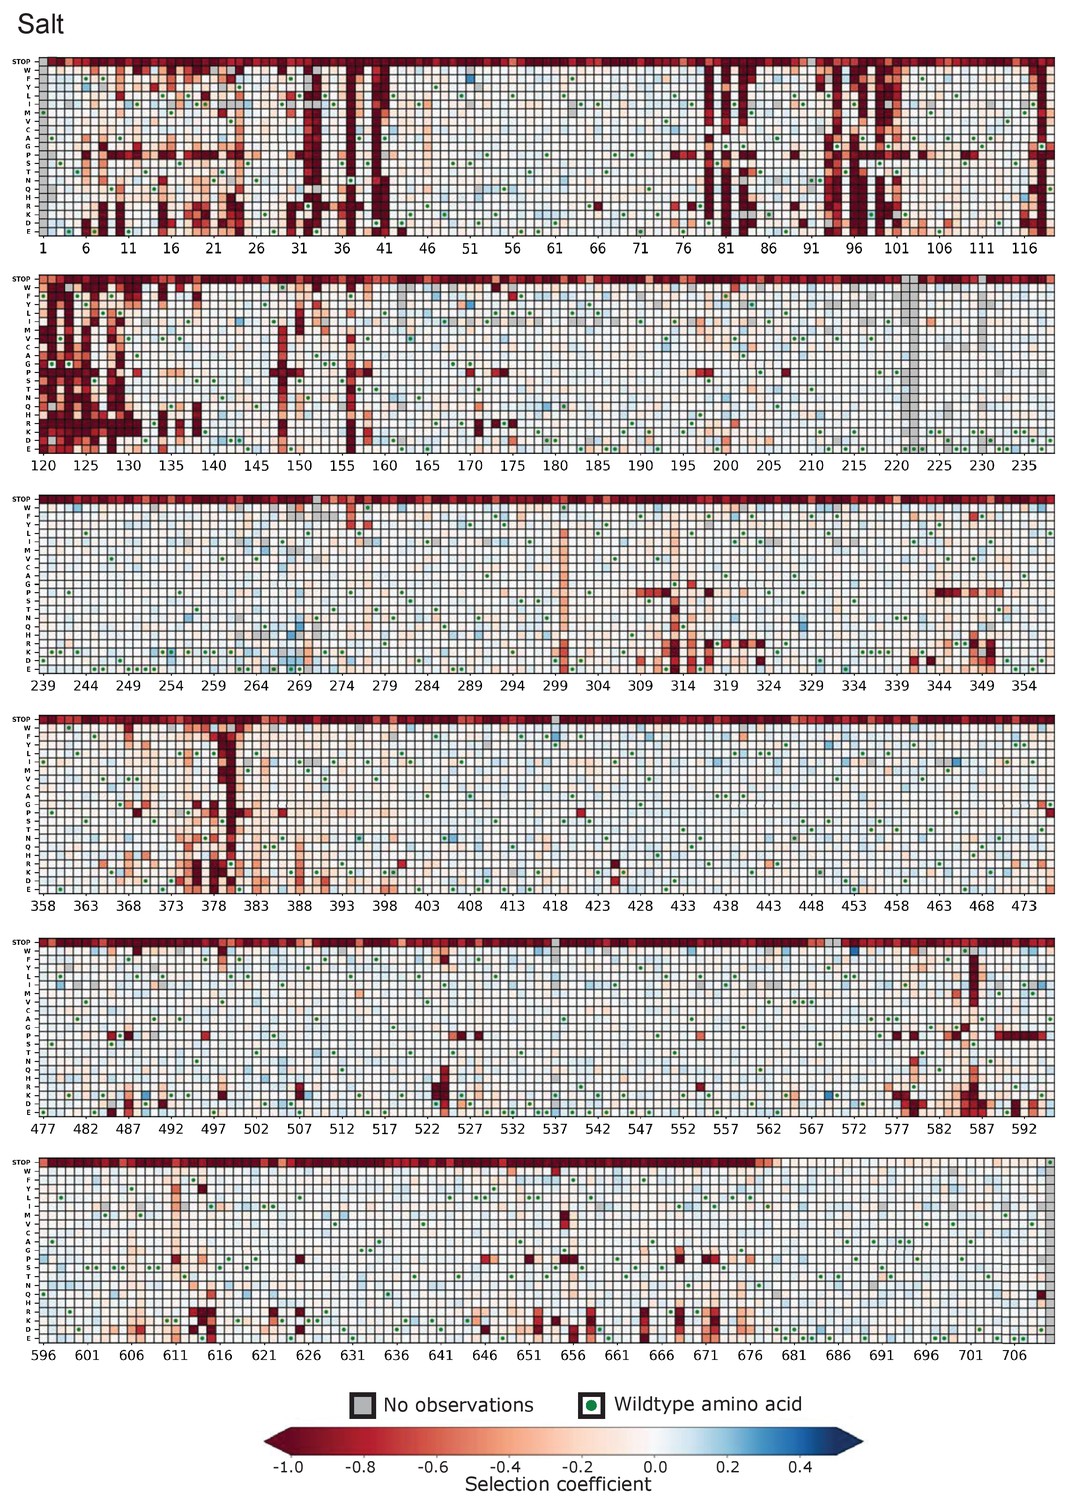
Heatmap representation of the fitness map observed for single amino acid changes of Hsp90 in salt.
Figure 2—figure supplement 3
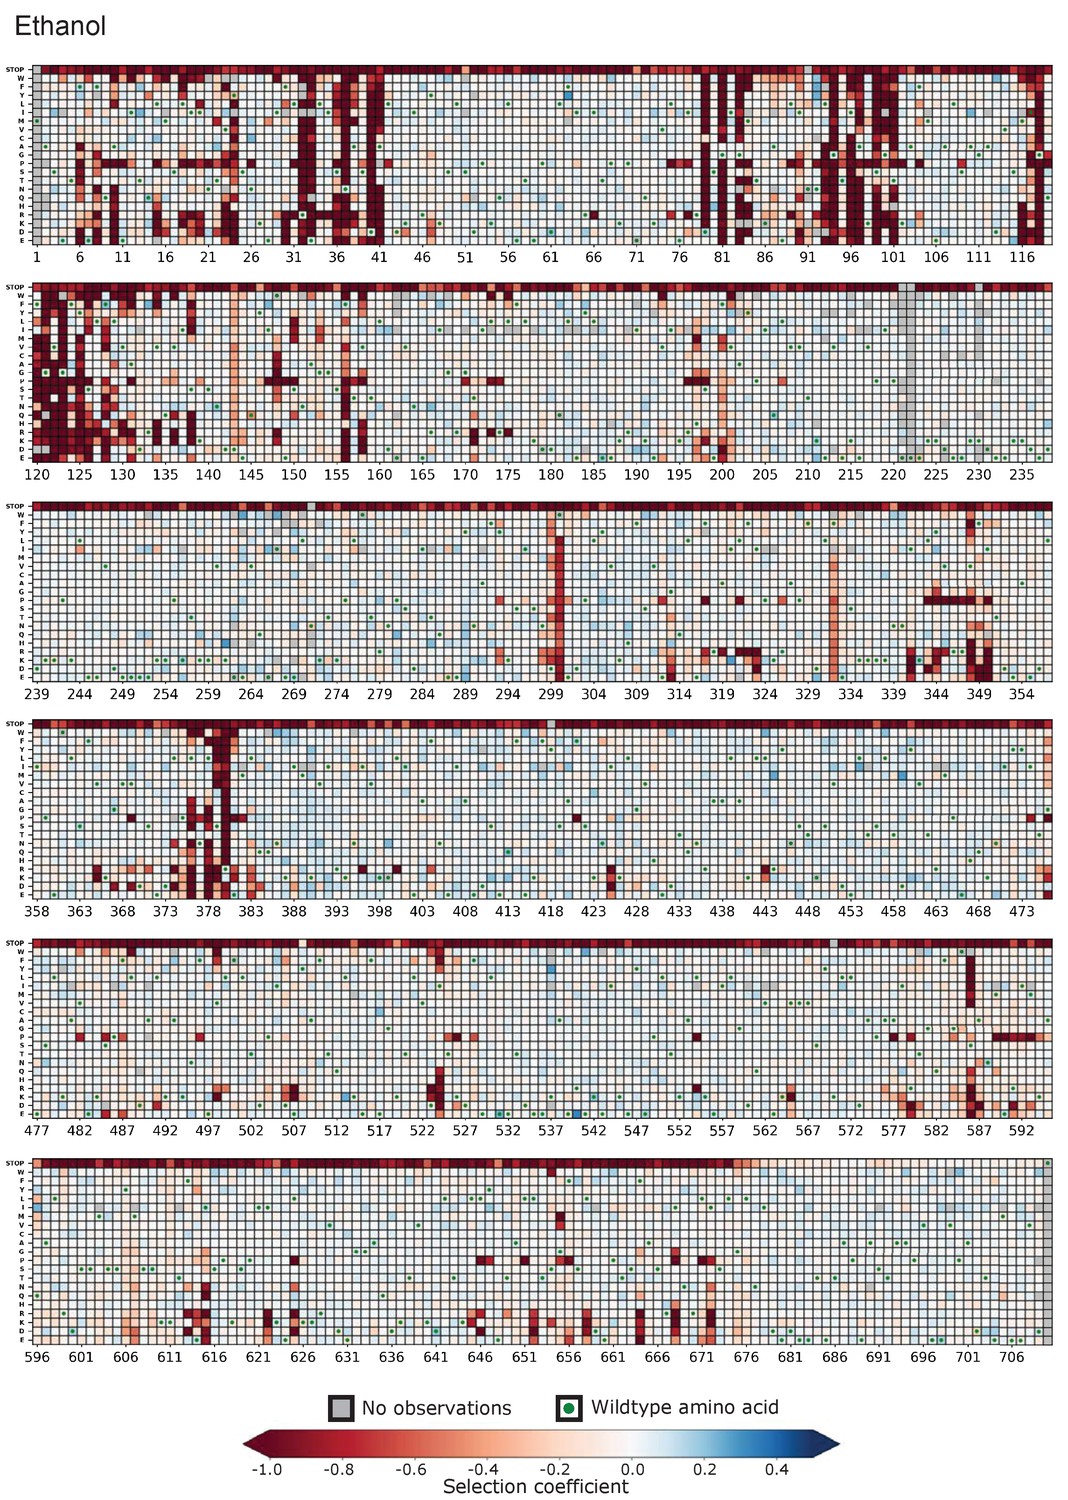
Heatmap representation of the fitness map observed for single amino acid changes of Hsp90 in ethanol.
Figure 2—figure supplement 4
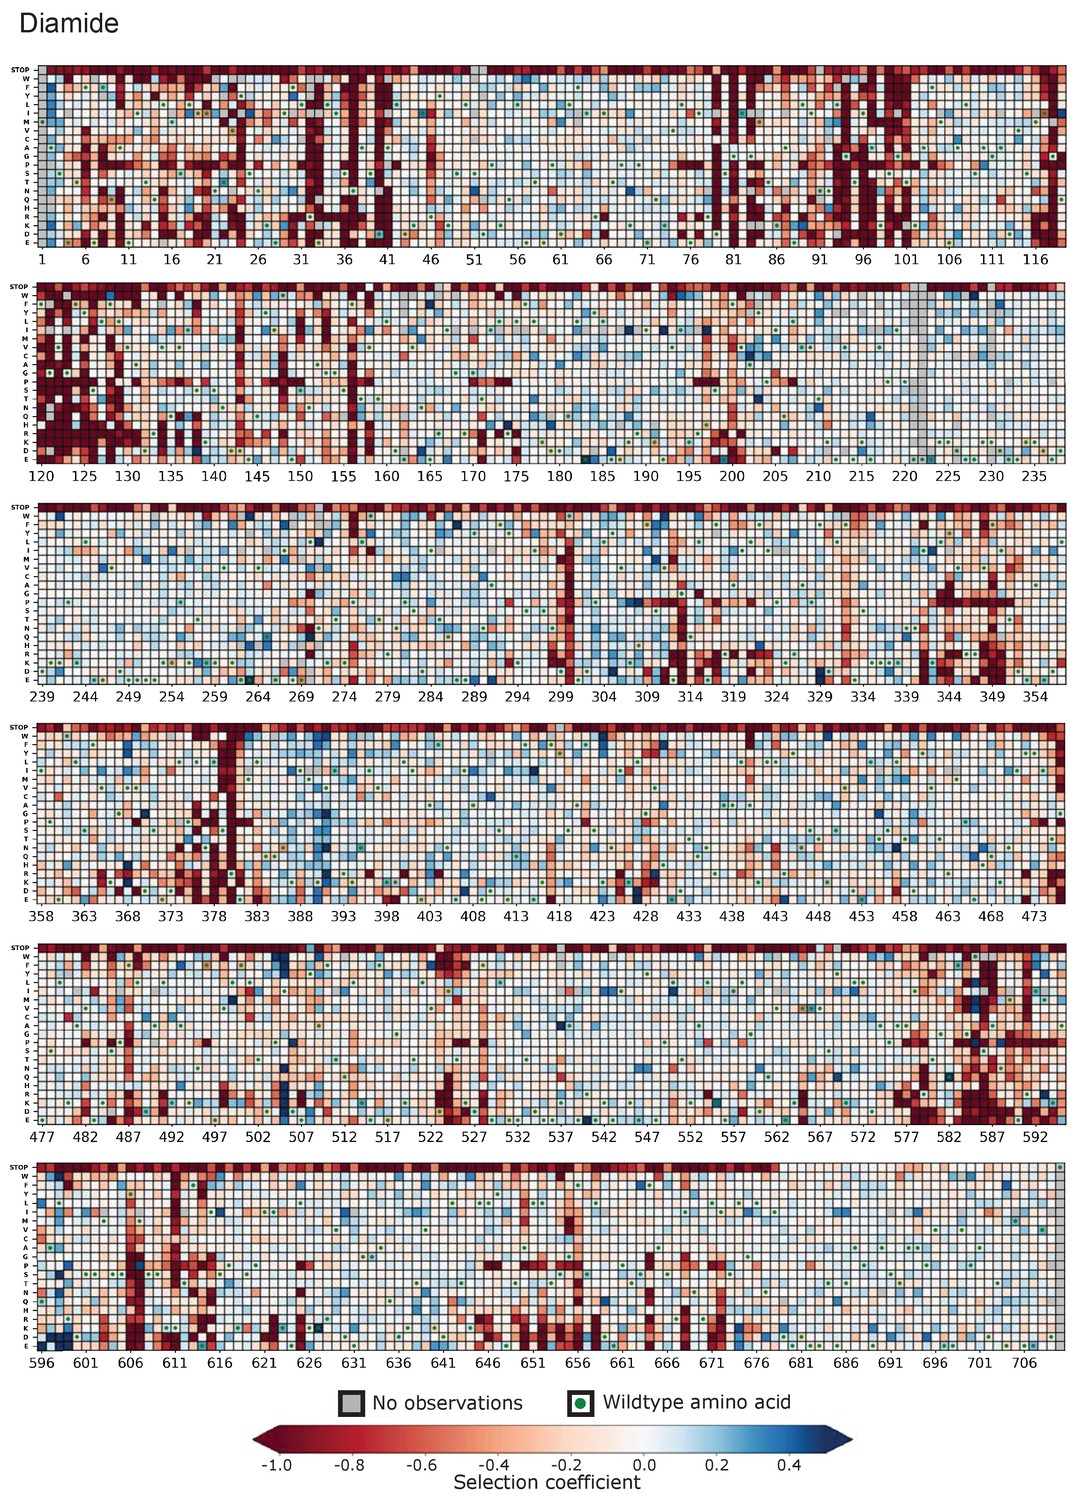
Heatmap representation of the fitness map observed for single amino acid changes of Hsp90 in diamide.
Figure 2—figure supplement 5
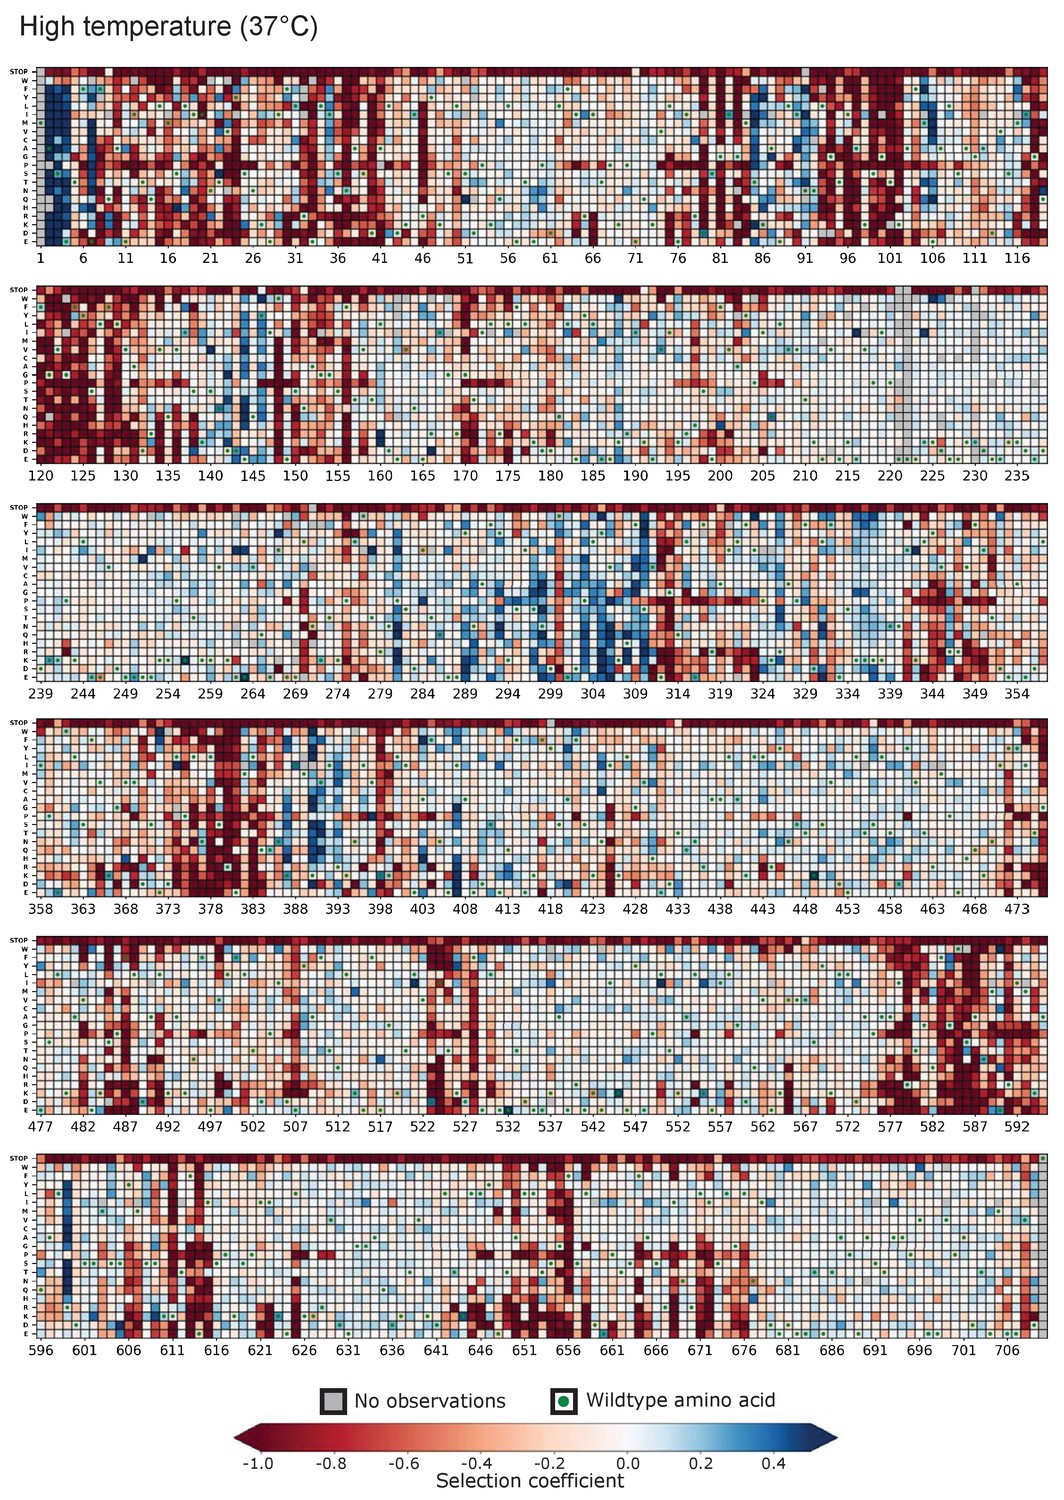
Heatmap representation of the fitness map observed for single amino acid changes of Hsp90 at 37°C.
Figure 2—figure supplement 6
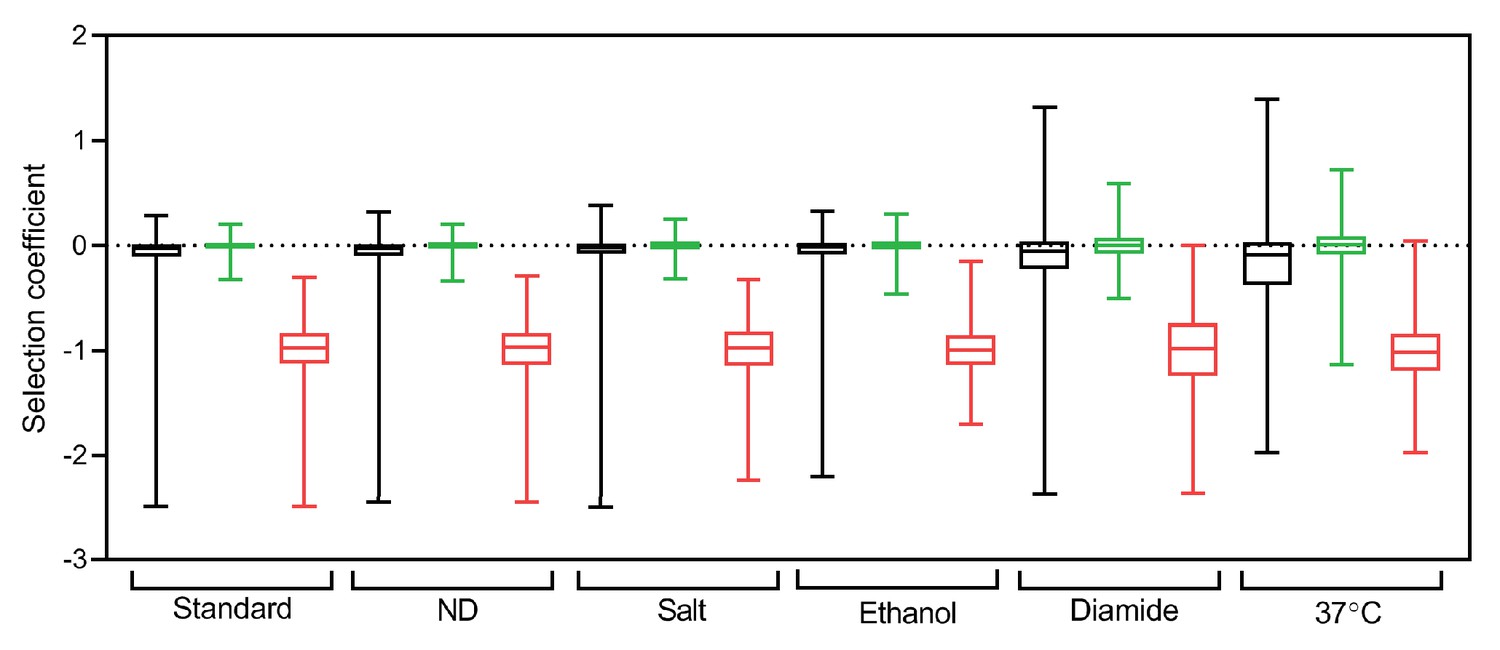
Distribution of selection coefficients for non-synonymous mutations (black), wild-type synonyms (green), and stops (red) in each environmental condition.
Figure 2—figure supplement 7
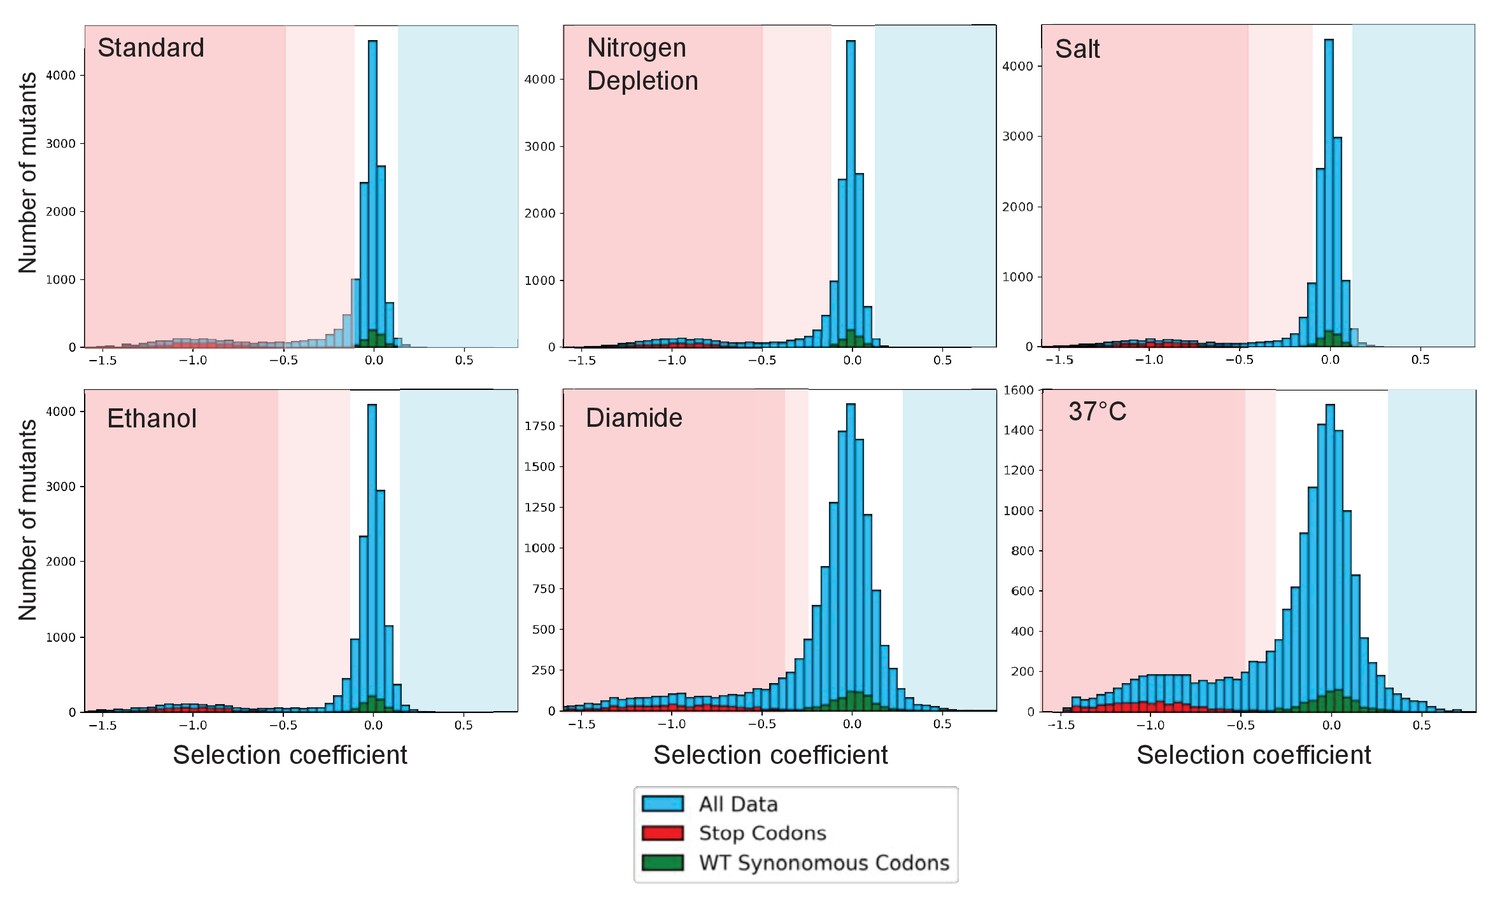
Distribution of selection coefficients in each environmental condition.
Mutations were categorized as beneficial (light blue shading), wild-type-like (white shading), intermediate (light pink shading) or deleterious (dark pink shading) based on the distribution of wild-type synonyms and stop codons in each condition.
Figure 2—figure supplement 8
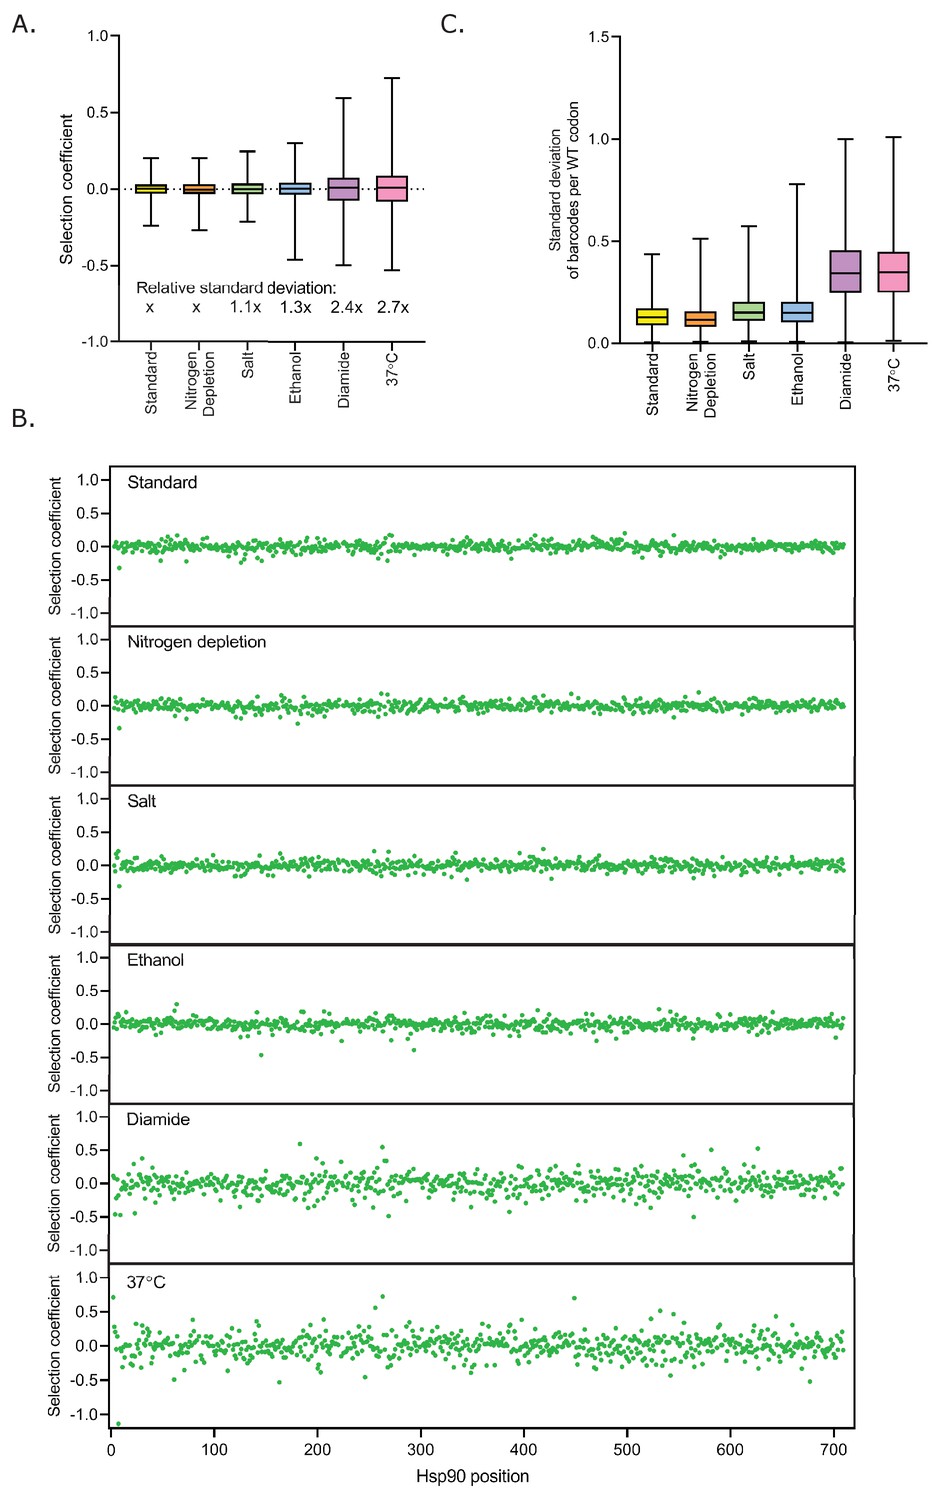
Analysis of variation in wild-type synonym selection coefficients.
(A) Distribution of selection coefficients for the wild-type synonyms in each condition. The standard of deviation of wild-type synonyms in each condition relative to standard conditions (x) is specified under the corresponding box. (B) The selection coefficient for wild-type synonyms at each position of Hsp90 in each condition. (C) The variation of selection coefficients for barcodes with greater than 50 initial reads for each wild-type codon in each condition.
Figure 2—figure supplement 9
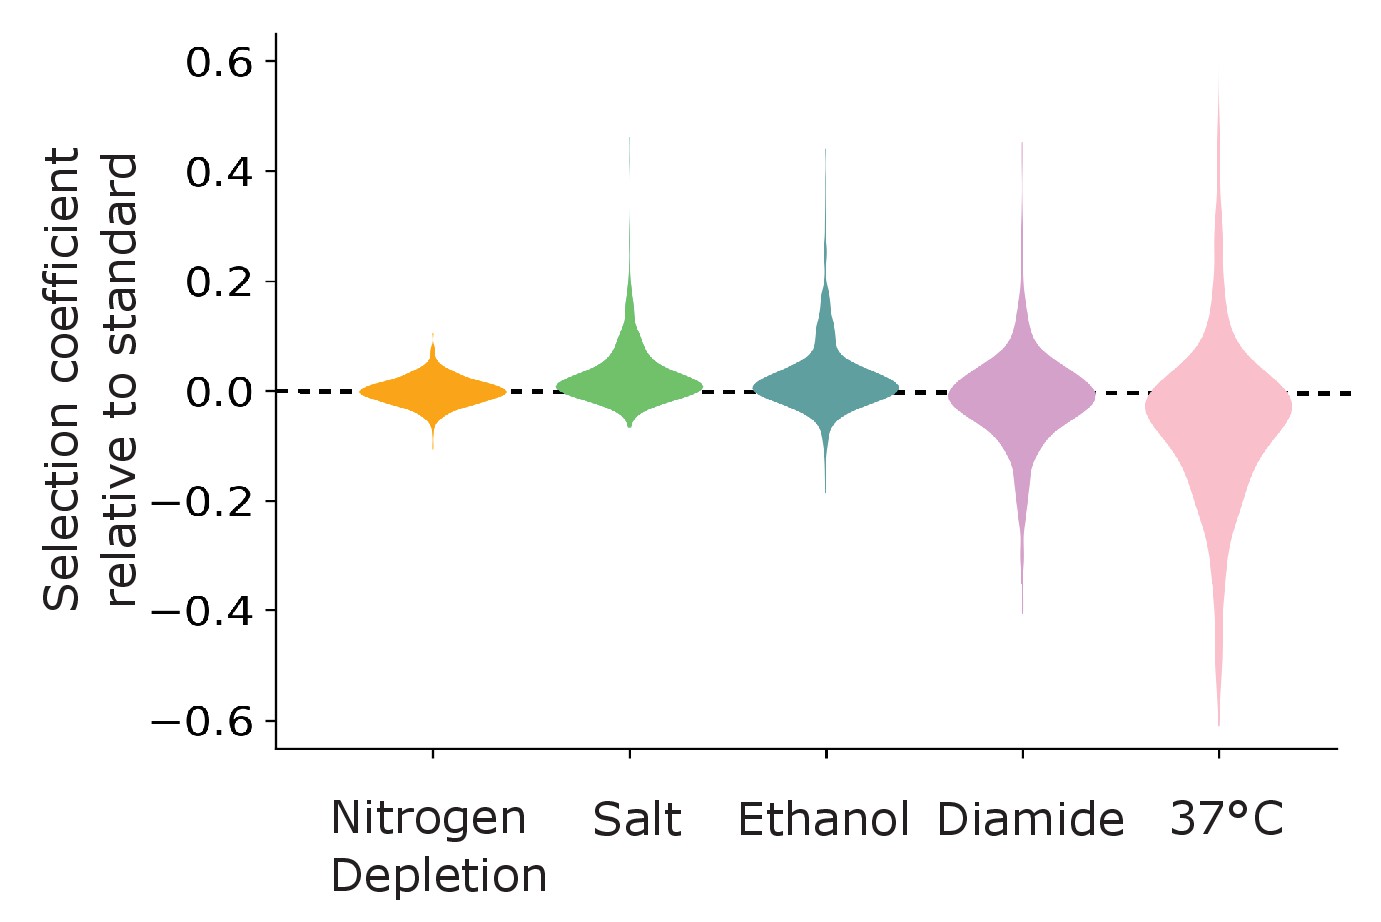
Distribution of the difference between selection coefficients of each mutation in each stress condition and the same mutation in standard conditions.
Figure 3 with 2 supplements
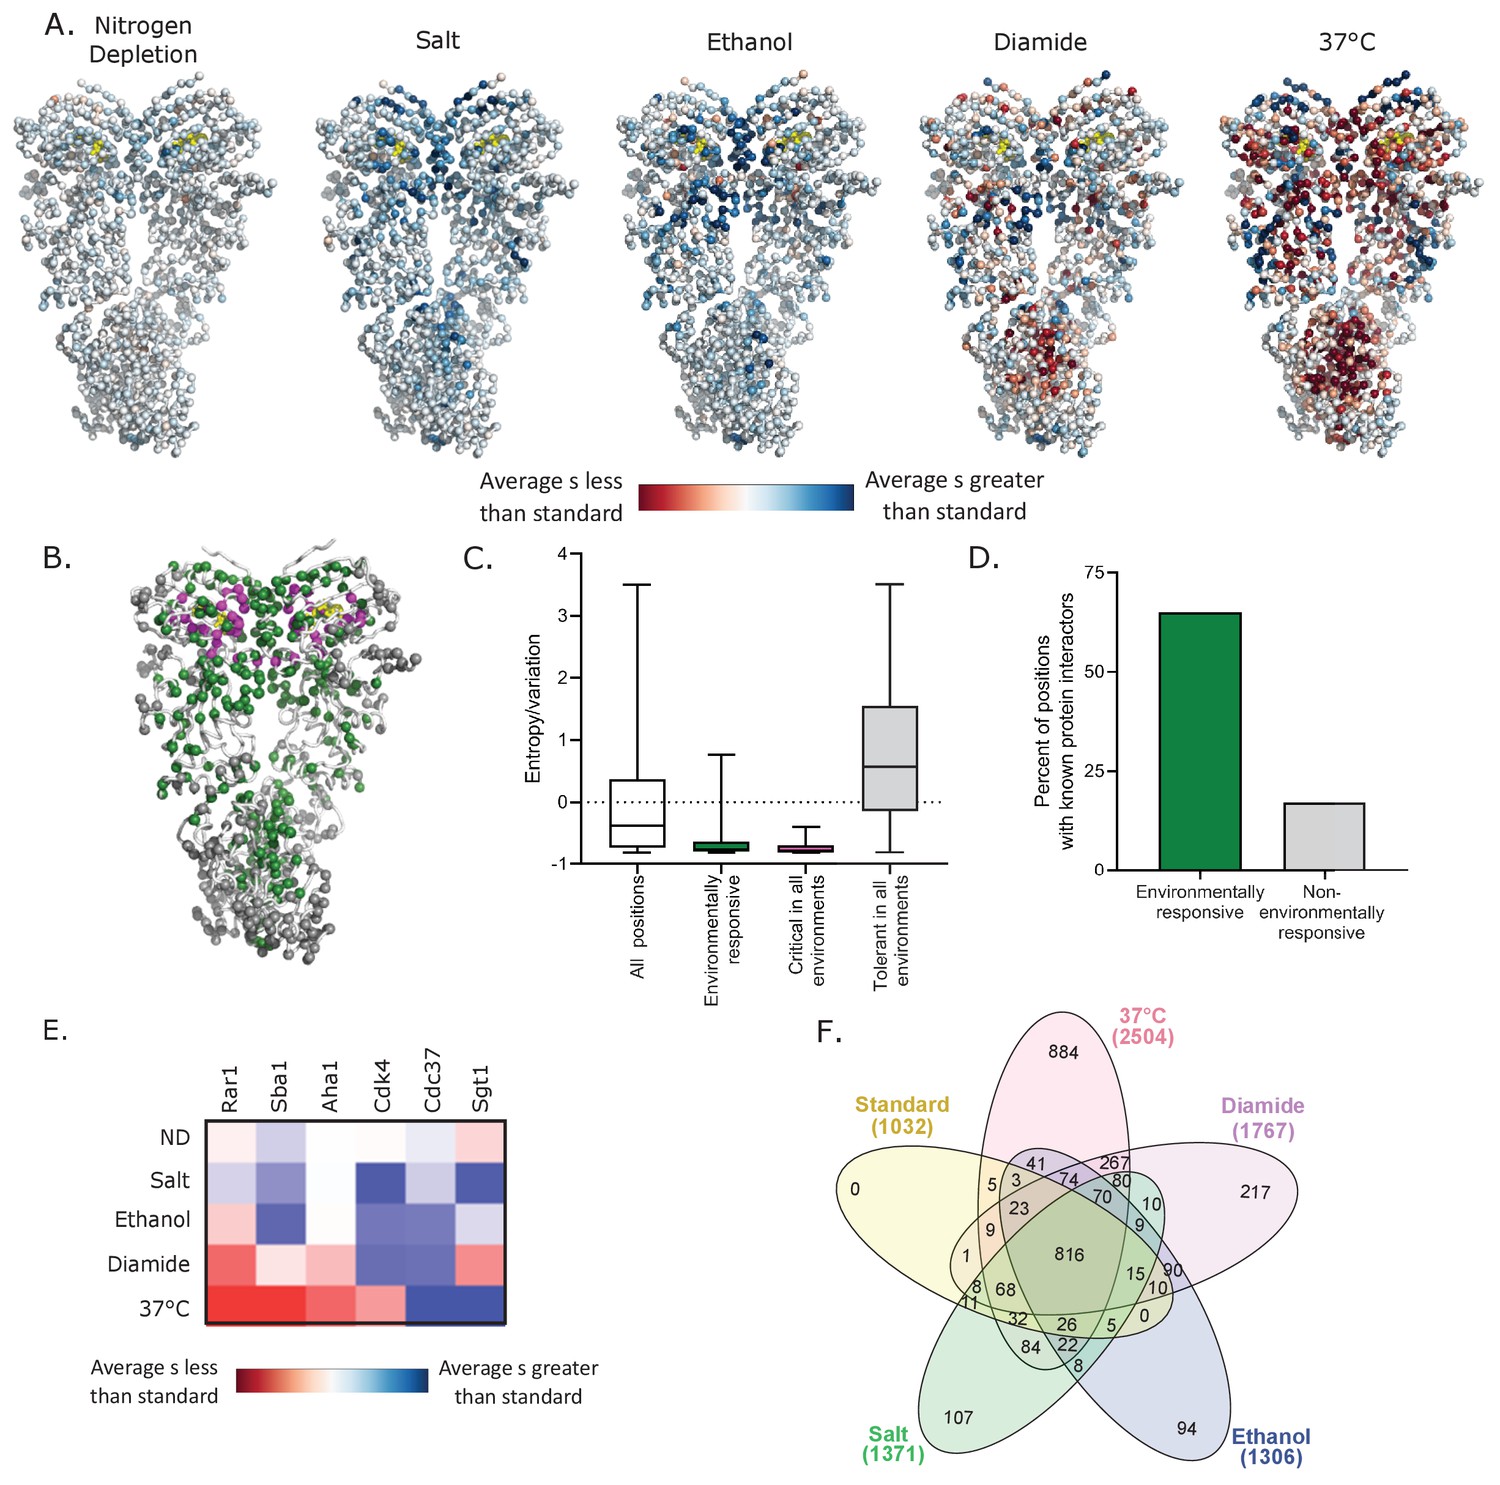
Environmental stresses place distinct selection pressures on Hsp90.
(A) The average selection coefficient (s) at each position relative to standard conditions was mapped onto Hsp90 structure (Ali et al., 2006) (See Figure 3—source data 1). (B) Structural images indicating the location of positions that are critical for Hsp90 function in all conditions (magenta), positions that are environmentally responsive (ER) (green), and positions that are tolerant in all environments (gray). Critical residues have mean selection coefficients that are null-like in all environments. ER positions have mean selection coefficients that differed from standard in three or more environments by an amount greater than one standard deviation of wild-type synonyms. Tolerant residues are not shifted more than this cutoff in any environment. (C) For different classes of positions, evolutionary variation was calculated as amino acid entropy at each position in Hsp90 sequences from diverse eukaryotes. Distributions are significantly different as measured by a two-sample Kolmogorov-Smirnov (KS) (All positions vs. ER: N = 678, 137, p<0.0001, D = 0.39; All positions vs. critical: N = 678, 27, p<0.0001, D = 0.57; All positions vs. tolerant: N = 678, 136, p<0.0001, D = 0.38) (D) Fraction of different classes of mutations located at contact sites with binding partners. p<0.0001 (E) A heatmap of the average selection coefficient for all positions at the stated interfaces relative to standard conditions in each environment. (F) Venn diagram of deleterious mutations in different environmental conditions (Heberle et al., 2015). Total number of deleterious mutants in each condition are stated in parentheses.
-
Figure 3—source data 1
Average selection coefficient (excluding stops) at each position of Hsp90 in each environmental condition relative to the average selection coefficient in standard conditions.
- https://cdn.elifesciences.org/articles/53810/elife-53810-fig3-data1-v2.xlsx
Figure 3—figure supplement 1
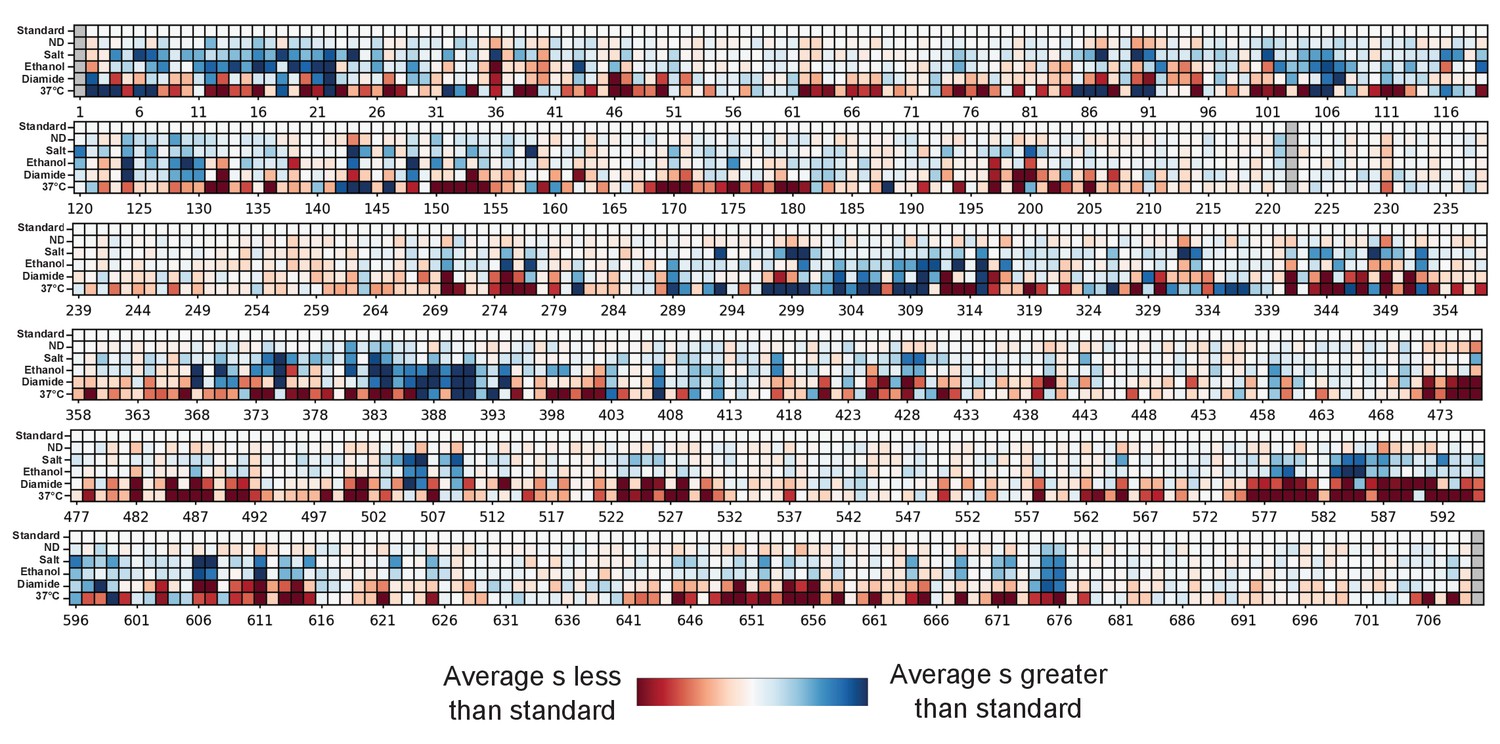
Heatmap representation of the average selection coefficient (s) at each position in each environmental condition relative to the average selection coefficient at the same position in standard conditions.
Figure 3—figure supplement 2
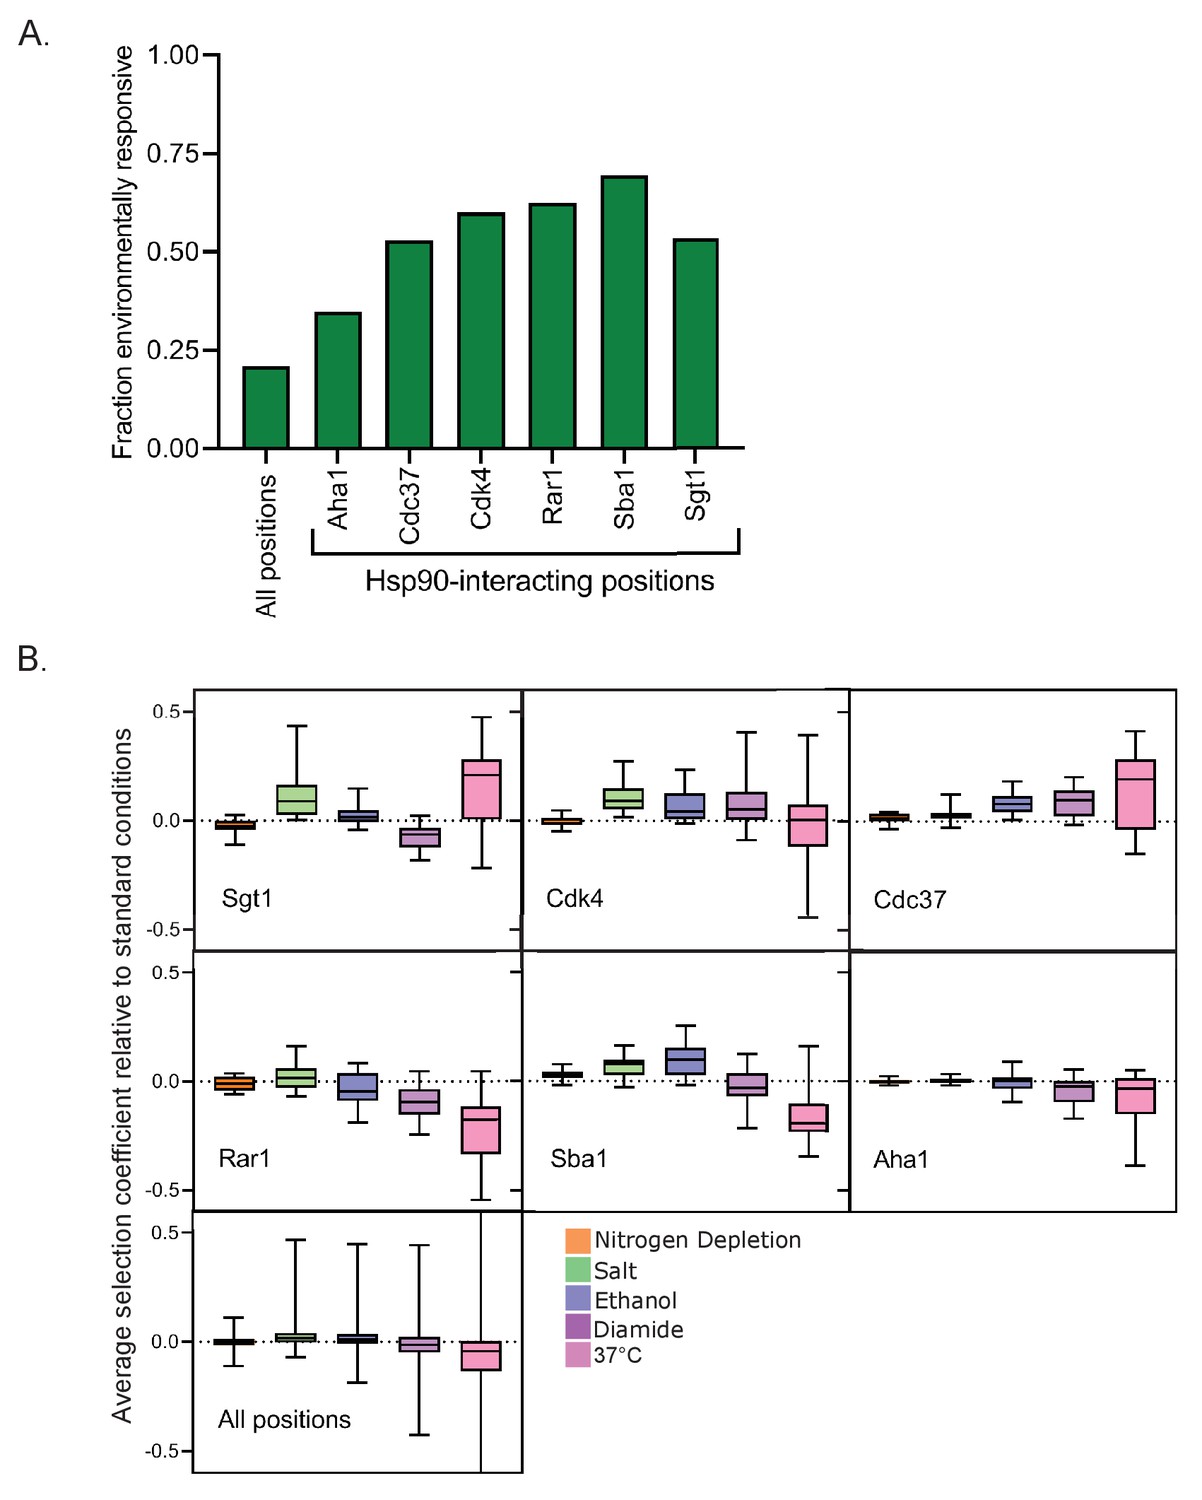
Environmentally responsive Hsp90 positions are enriched in binding contacts.
(A) The fraction of Hsp90 positions at interfaces that were categorized as environmentally responsive. (B) The average selection coefficient in each environment relative to standard at all the Hsp90 positions at each stated interface.
Figure 4
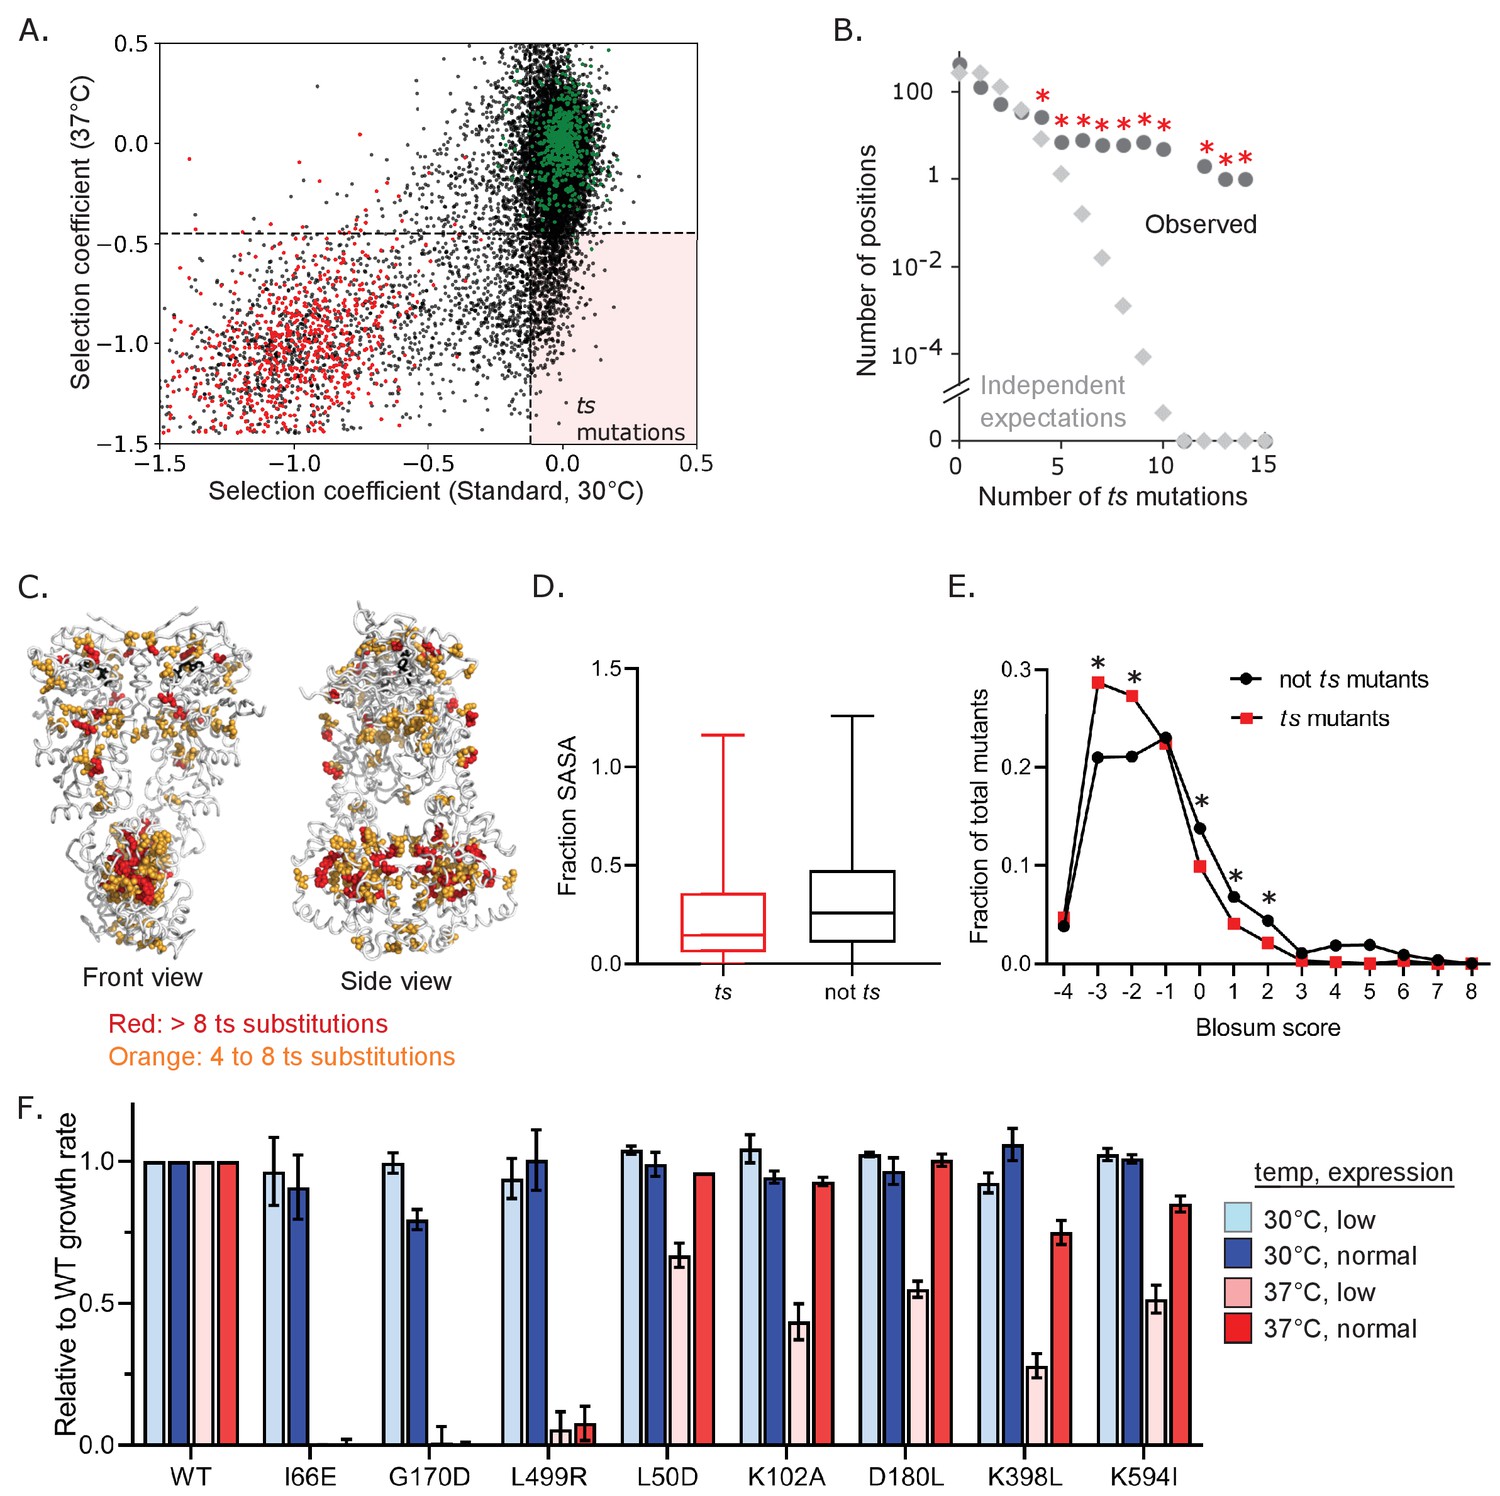
Abundance and mechanism of temperature-sensitive (ts) mutations in Hsp90.
(A) Ts variants were identified that supported WT-like growth at 30°C, but were null-like at 37°C in bulk competitions. WT synonyms are shown in green and stops in red. The horizonal dashed line corresponds to y = −0.47, the upper limit of stops at 37°C and the vertical dashed line corresponds to x = −0.11, the lower limit of WT synonyms in standard conditions. The pink-shaded quadrant highlights ts mutations. All ts mutants are listed in Figure 4—source data 1. (B) Distribution of the number of observed ts mutations at the same positions of Hsp90 (●) is much greater than expected if they had occurred independently (◊). Independent expectations were calculated as the probability of the stated number of mutations occurring at the same position by chance. * Indicates observations that were significantly (p<0.01) greater than independent expectations based on random simulations and one-tailed t-tests. (C) Mapping positions with multiple ts variants onto Hsp90 structure. ATP is shown in black. (D) Solvent accessible surface area (SASA) of ts mutants compared to non-ts mutants. A two sample KS test showed significant differences in distributions (N = 663, 11762, p<0.0001, D = 0.1735) (E) Amino acid similarity to the wild type was estimated as the Blosum score (Henikoff and Henikoff, 1992) for ts and non-ts variants. A two-proportion z-test was performed on each pair for each Blosum score and their p-values were adjusted using Benjamini-Hochberg adaptive step-up procedure. * Indicates p<0.05 F. Growth rate of a panel of individual Hsp90 ts variants analyzed in isolation.
-
Figure 4—source data 1
List of all temperature-sensitive mutants and associated selection coefficients.
Ts mutants were defined as variants with selection coefficients within the distribution of wild-type synonyms in standard conditions and that of stop codons at 37°C.
- https://cdn.elifesciences.org/articles/53810/elife-53810-fig4-data1-v2.xlsx
Figure 5 with 4 supplements

Beneficial variants in diamide and elevated temperature conditions.
(A) Number of beneficial mutations identified in each condition based on selection coefficients more than two standard deviations greater than wild-type synonyms. Beneficial mutants at 37°C and in diamide are listed in Figure 5—source data 1. (B) Distribution of the number of beneficial mutations at the same position in both 37°C (left) and diamide (right) conditions (●) is greater than expected if they had occurred independently (◊). Independent expectations were calculated as the probability of the stated number of mutations occurring at the same position by chance. * Indicates observations that were significantly (p<0.01) greater than independent expectations based on random simulations and one-tailed t-tests. (C) Location of positions with four or more beneficial mutations. Positions that are unique to diamide or 37°C are shown in cyan and two shared positions are shown in magenta. (D) The solvent accessible surface area (SASA) of beneficial mutations at 37°C and in diamide compared to all mutations. Distributions are significantly different as measured by a two-sample KS test (37°C vs. all data, N = 270, 12393, p<0.0001, D = 0.2851; Diamide vs. all data, N = 60,12393, p<0.0001, D = 0.3465) (E) The fraction of Hsp90 positions at interfaces that were beneficial in 37°C and diamide conditions. (F) Selection coefficients in standard conditions for beneficial mutations at 37°C and in diamide compared to wild-type synonyms. (KS test; 37°C vs. WT synonyms: N = 463, 660, p<0.0001, D = 0.3281; Diamide vs. WT synonyms: N = 353, 660, p<0.0001, D = 0.3809).
-
Figure 5—source data 1
List of all beneficial mutants and associated selection coefficients at 37°C and in diamide.
Beneficial mutants were defined as variants with selection coefficients two standard deviations greater than wild-type synonyms.
- https://cdn.elifesciences.org/articles/53810/elife-53810-fig5-data1-v2.xlsx
Figure 5—figure supplement 1
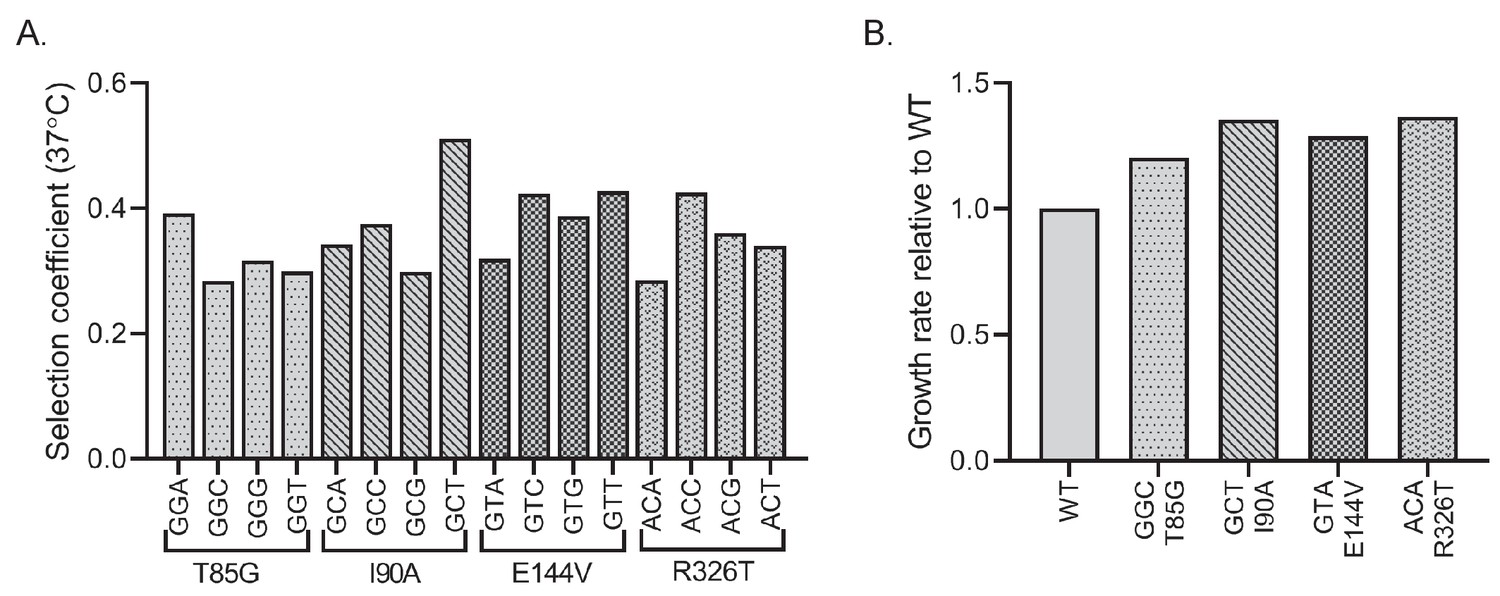
Validation of beneficial mutants at37°C.
(A) Selection coefficients of synonymous codon variants for four amino acid mutants with beneficial selection coefficients at 37°C show high correlation. (B) The same individual variants analyzed in isolation exhibit increased growth rates.
Figure 5—figure supplement 2
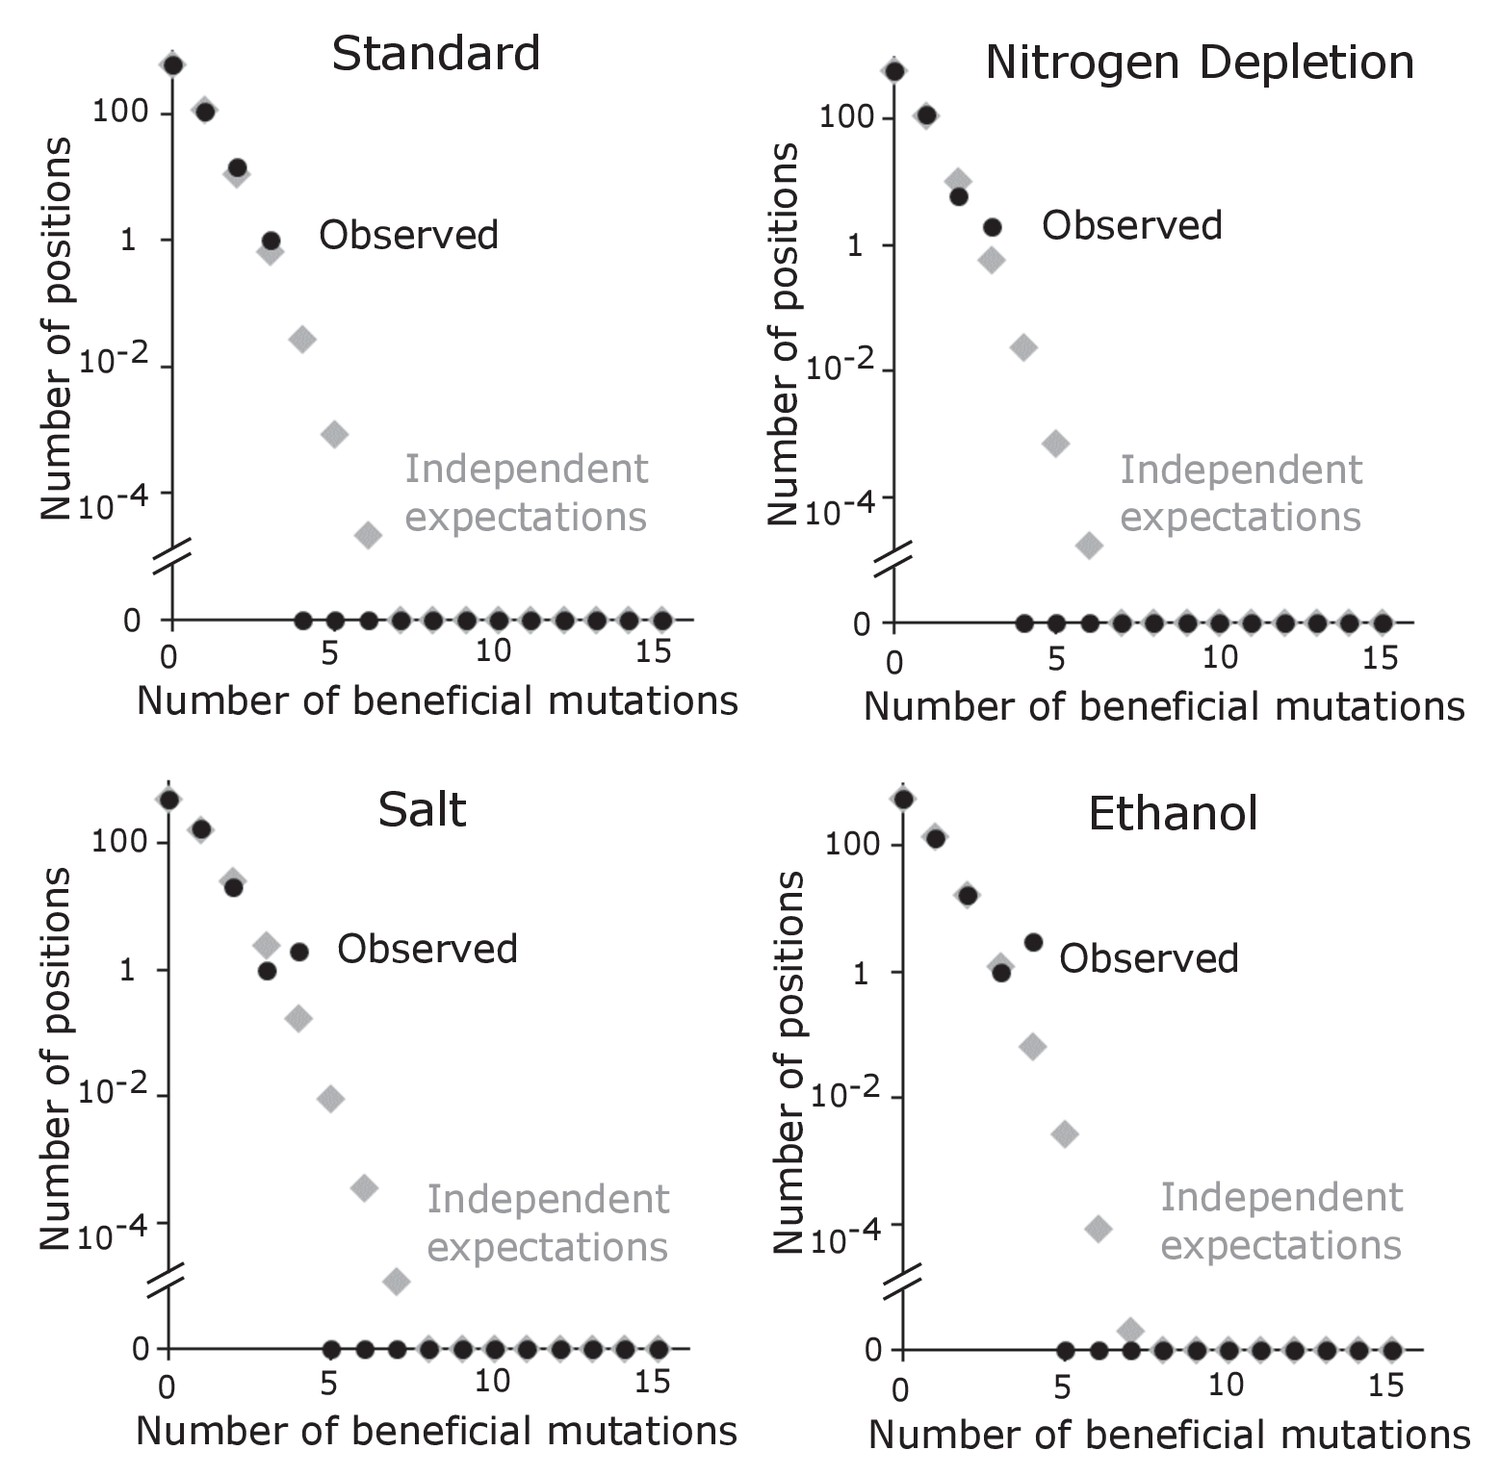
Distribution of the number of beneficial mutations at the same position in standard, nitrogen depletion, salt, and ethanol conditions.
Independent expectations were calculated as the probability of the stated number of mutations occurring at the same position by chance.
Figure 5—figure supplement 3
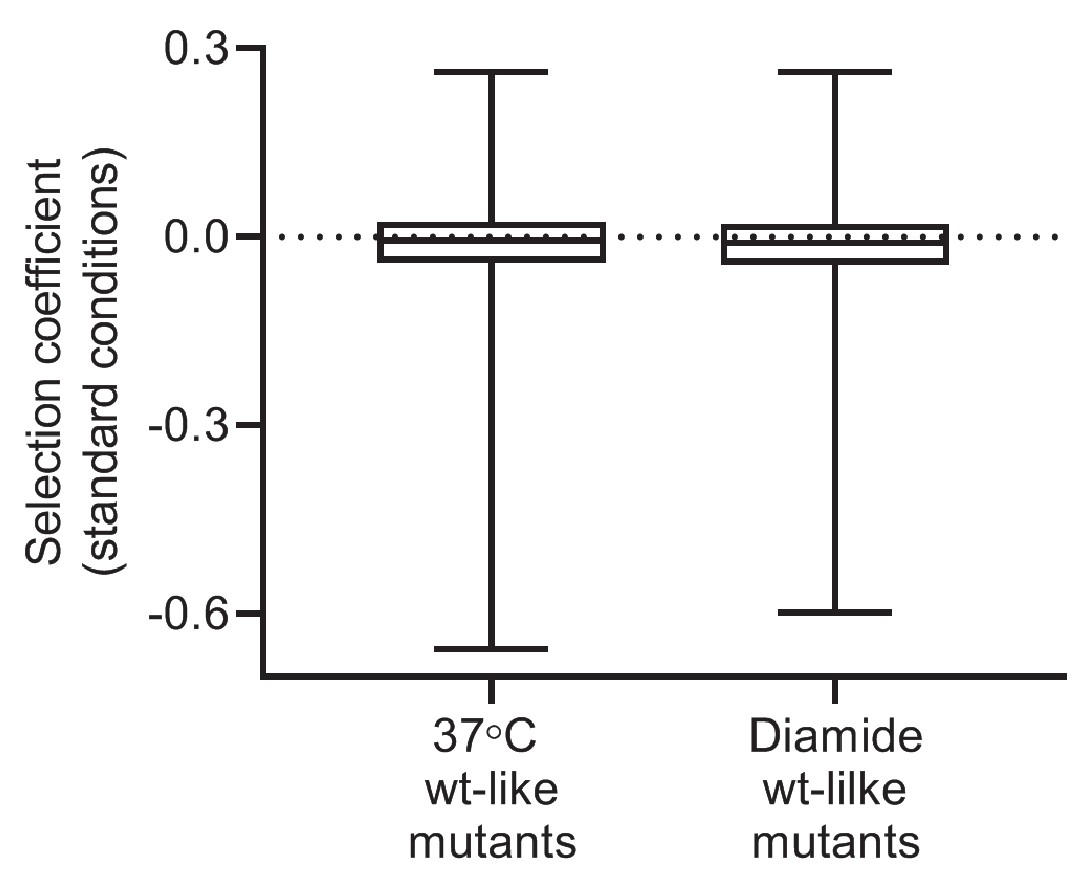
Selection coefficients in standard conditions for all wild-type-like mutations at 37°C and in diamide.
Figure 5—figure supplement 4
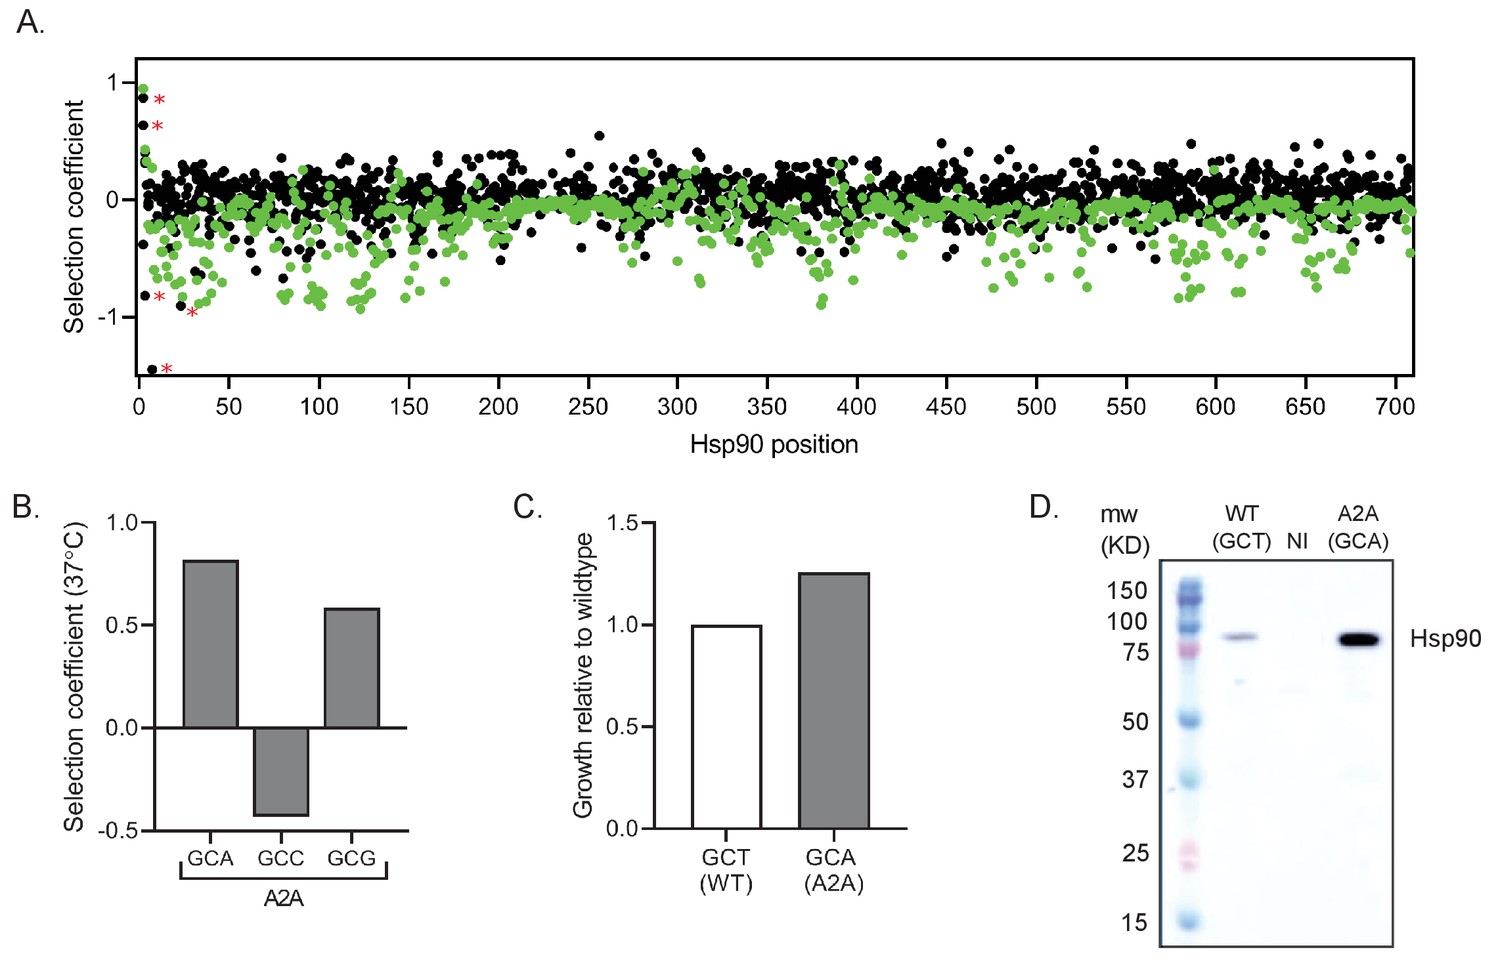
Synonymous mutations at the beginning of Hsp90 have strong beneficial growth effects.
(A) Selection coefficients for all codon variants of synonymous mutations at each position of Hsp90 (black) at 37°C compared to the average selection coefficient of all mutations at each position (green) at 37°C. Synonymous mutations that were deemed beneficial or deleterious after a Bonferroni correction are noted with a red asterisk. (B) Selection coefficients for codon variants of synonymous mutants at position Ala2 show high variation. (C) The individual Hsp90 variant containing the synonymous codon mutation GCT to GCA at position 2 exhibited an increased growth rate 37°C. (D) The individual synonymous mutant variant GCA at position two exhibited higher cellular expression levels at 37°C. WT: wild-type Hsp90 (GCT at 2nd position), NI: No insert, A2A: Hsp90 with the GCT to GCA codon mutation.
Figure 6 with 3 supplements

Experimental growth effects of natural amino acid variants of Hsp90.
(A) The distribution of selection coefficients of natural variants compared to all variants in each environmental condition (see Figure 6—source data 1). (B) Across all environments, the fraction of natural variants compared to all variants that were beneficial, wild-type-like, or deleterious. (C) The fraction of natural variants compared to all variants that were environmentally responsive or tolerant in all environments. Categories were defined as in Figure 3B. (D) Landscape model indicating that natural variants of Hsp90 tend to support robust growth under a variety of stress conditions.
-
Figure 6—source data 1
List of selection coefficients of all natural variants of Hsp90 in all environmental conditions.
- https://cdn.elifesciences.org/articles/53810/elife-53810-fig6-data1-v2.xlsx
Figure 6—figure supplement 1
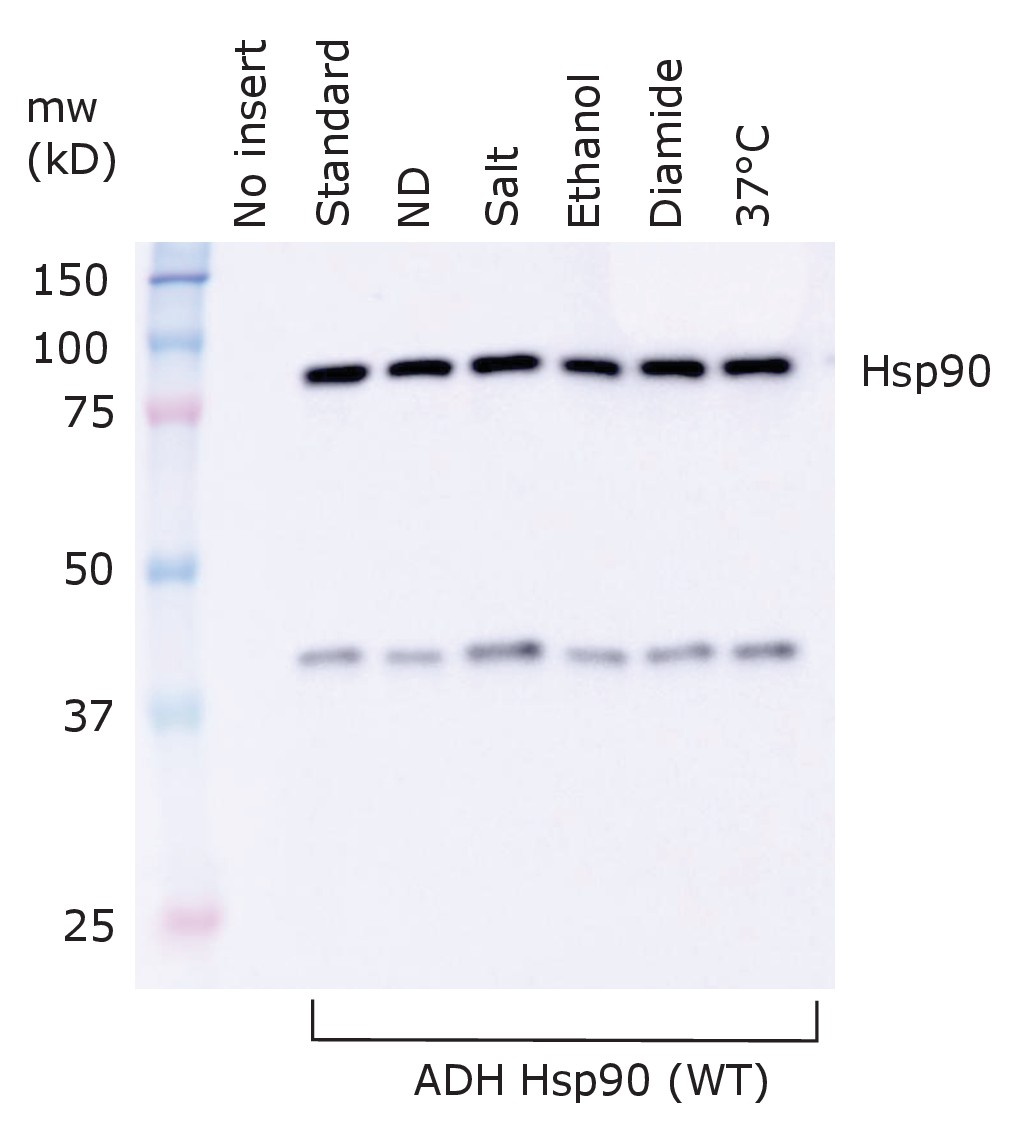
Hsp90 expression in the Hsp90 shutoff yeast strain harboring either wild-type Hsp90 under the constitutive ADH promoter or a null plasmid (no insert).
Cells were grown for 12 hr in dextrose media at 30°C and then were transferred into the individual environmental conditions and grown for eight additional hours. Hsp90 levels were monitored by western blotting.
Figure 6—figure supplement 2
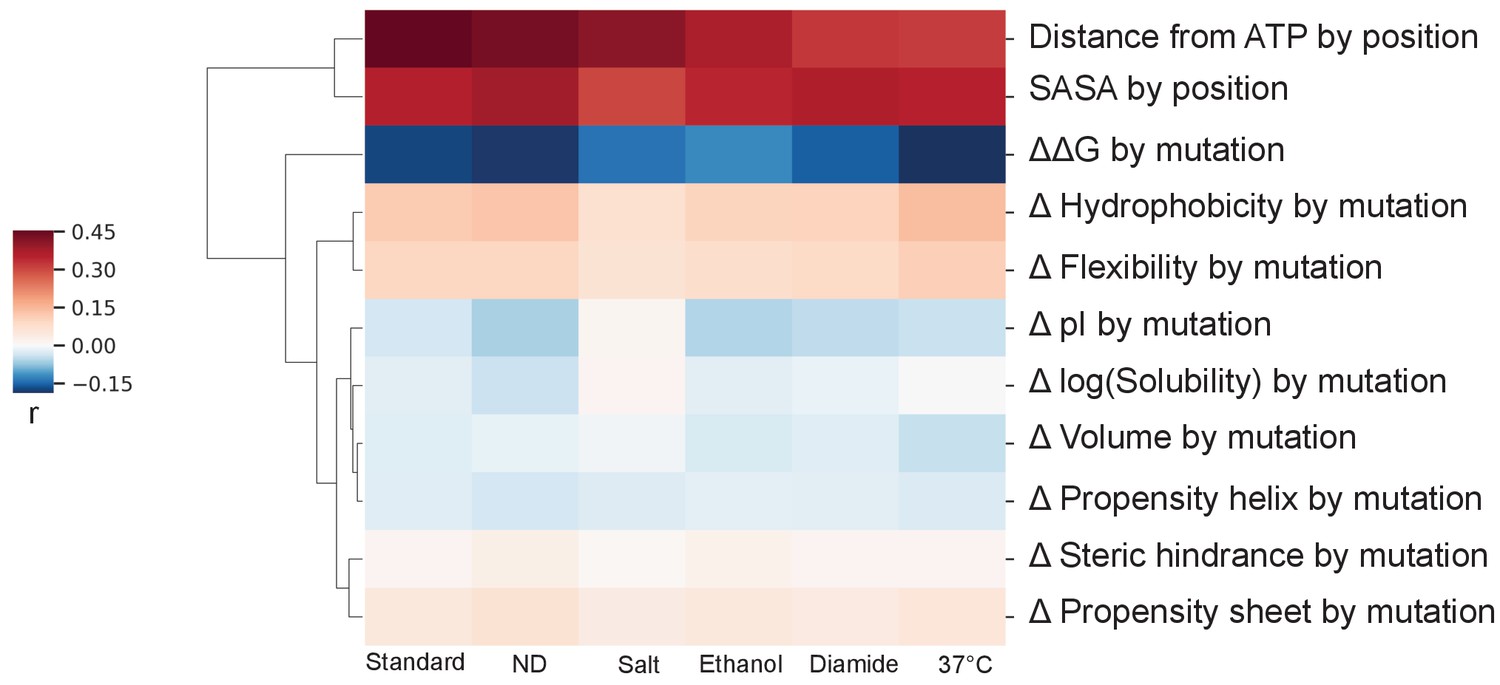
Heatmap of Spearman’s rank correlation coefficients (r) between molecular features (rows) and selection coefficients per mutation or per position (average selection coefficient for all amino acids at the position) for each environment (columns).
Euclidean clustering along rows is based on the Spearman’s rank correlation coefficients. See Figure 6—figure supplement 2—source data 1.
-
Figure 6—figure supplement 2—source data 1
The Spearman’s rank correlation coefficients (r) and associated p-values between molecular features and selection coefficients for each environment.
- https://cdn.elifesciences.org/articles/53810/elife-53810-fig6-figsupp2-data1-v2.docx
Figure 6—figure supplement 3
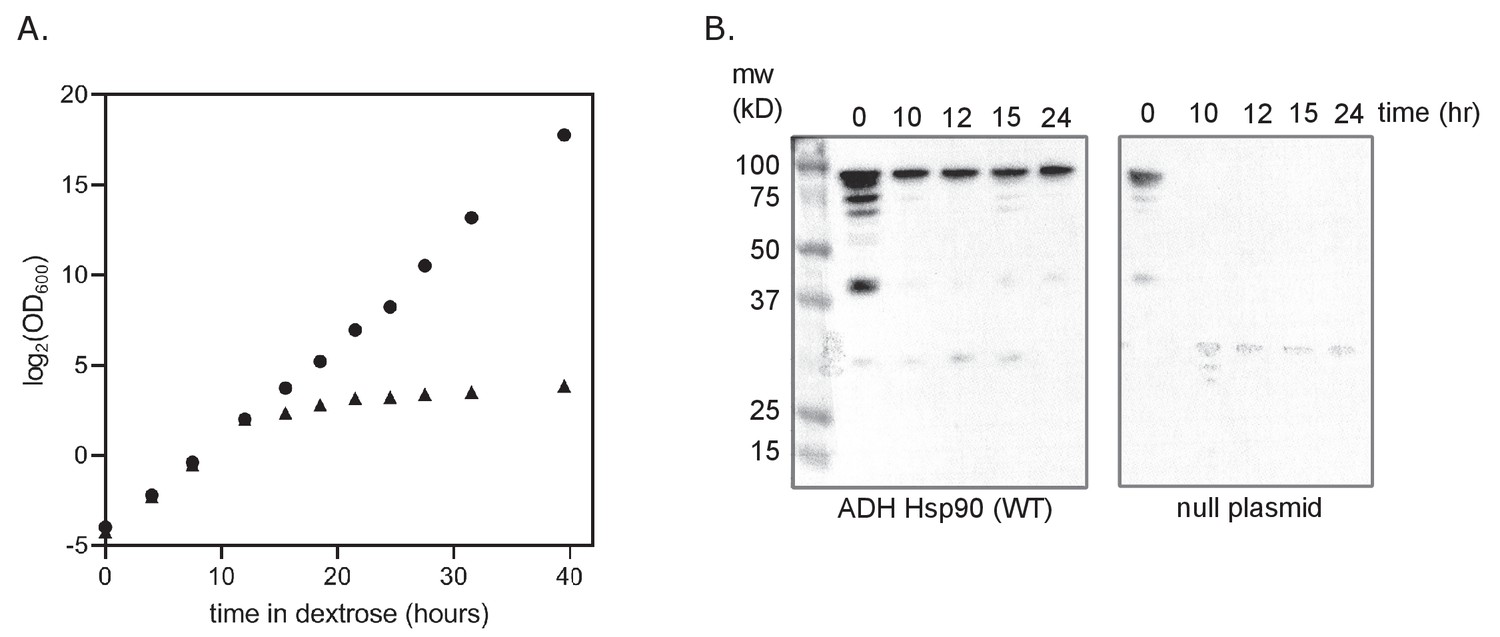
Validation of yeast Hsp90-shutoff strain.
(A) Growth of Hsp90 shutoff yeast harboring either wild-type (WT) Hsp90 under the ADH promoter (●) or a null plasmid (▲). Growth was monitored by optical density (OD) at 600 nm. (B) Hsp90 expression in cells harboring the same plasmids grown in dextose for the stated number of hours. Hsp90 protein levels were monitored by western blotting.
Tables
Key resources table
| Reagent type (species) or resource | Designation | Source or reference | Identifiers | Additional information |
|---|---|---|---|---|
| Gene (Saccharomyces cerevisiae) | hsp82 | Saccharomyces Genome Database | SGD: S000006161 | Hsp90 chaperone |
| Antibody | anti-Hsp90 α/β (Mouse monoclonal) | Cayman chemical; Cat# 10011439 | RRID:AB_10349777 | WB (1:3000) |
| Recombinant DNA reagent | Barcoded Hsp90 plasmid library | This paper | See Materials and methods for library construction | |
| Recombinant DNA reagent | p414ADH Δter plasmid | PMID: 23825969 | ||
| Recombinant DNA reagent | p414GPD plasmid | PMID: 23825969 | ||
| Commercial assay or kit | BCA Protein Assay Kit | Pierce | Cat #23227 | |
| Commercial assay or kit | KAPA SYBR FAST qPCR Master Mix | Kapa Biosystems | KK4600 | |
| Chemical compound, drug | Diamide | Sigma Aldrich | D3648 | |
| Software, algorithm | Barcode – Hsp90 ORF assembly | This paper | https://github.com/JuliaFlynn/Barcode_ORF_assembly | Associates barcodes with open reading frame mutations from paired end sequencing data (Flynn, 2020a; copy archived at https://github.com/elifesciences-publications/Barcode_ORF_assembly) |
| Software, algorithm | Tabulate Hsp90 counts | This paper | https://github.com/JuliaFlynn/Tabulate_counts | Counts Hsp90 alleles from raw fastq files and barcode_orf assembly file (Flynn, 2020b; copy archived at https://github.com/JuliaFlynn/Tabulate_counts) |
| Software, algorithm | EmpiricIST | PMID: 30127529 | https://github.com/Matu2083/empiricIST | Estimates selection coefficients based on the MCMC approach |
| Sequenced-based reagent | Sequencing primers | This paper | See Supplementary file 1 | |
| Sequenced-based reagent | Site-directed mutagenesis primers | This paper | See Supplementary file 1 | |
| Sequenced-based reagent | Library construction oligomers | This paper | Available upon request |
Additional files
-
Supplementary file 1
List of oligomers used in this study.
- https://cdn.elifesciences.org/articles/53810/elife-53810-supp1-v2.xlsx
-
Transparent reporting form
- https://cdn.elifesciences.org/articles/53810/elife-53810-transrepform-v2.docx
Download links
A two-part list of links to download the article, or parts of the article, in various formats.
Downloads (link to download the article as PDF)
Open citations (links to open the citations from this article in various online reference manager services)
Cite this article (links to download the citations from this article in formats compatible with various reference manager tools)
Comprehensive fitness maps of Hsp90 show widespread environmental dependence
eLife 9:e53810.
https://doi.org/10.7554/eLife.53810


