R-spondin signalling is essential for the maintenance and differentiation of mouse nephron progenitors
- Université Côte d’Azur, Inserm, CNRS, Institut de Biologie Valrose, France
- Institute of Medical Biology, A*STAR, Singapore
Figures
Figure 1 with 3 supplements

Rspo1 and Rspo3 are expressed in embryonic kidneys and are required for normal development.
(A) RNA-Scope analysis demonstrates Rspo1 (i) and Rspo3 (iii) expression in the nephrogenic zone of developing (E14.5) kidneys. (B) RNA-Scope analysis followed by immunostaining for the progenitor marker SIX2 reveals a switch from strong Rspo3 expression within progenitors at E14.5 (i) to almost exclusively stromal progenitor expression at E18.5 (ii). In addition, strong staining was found within medullary stromal cells (iii). Hoechst stains nuclei in blue (C) Schematic outline of tamoxifen induction for CAGG:CreERTM-mediated deletion leading to a complete loss of R-spondin expression in the Rspo1/Rspo3 double mutant (DM). Colour legend: Purple for Rspo1+, pink for Rspo3+, dark red for Rspo1/Rspo3+ cells. Rspo depleted cells are dark grey, light grey highlights ureteric cells. (D) Macroscopic view of the urogenital system of Control and CAGG:CreERTM-DM embryos dissected at E18.5, (E). Hematoxylin and Eosin (Hand E) staining of E14.5 sections reveals smaller kidneys virtually lacking nephrons. A: adrenal gland, B: bladder, K: kidney, O: ovary, T: testis. CAGG:CreERTM-DM stands for (CAGG:CreERTM, Rspo1-/-, Rspo3fl/fl), Ctrl: Control.
Figure 1—figure supplement 1
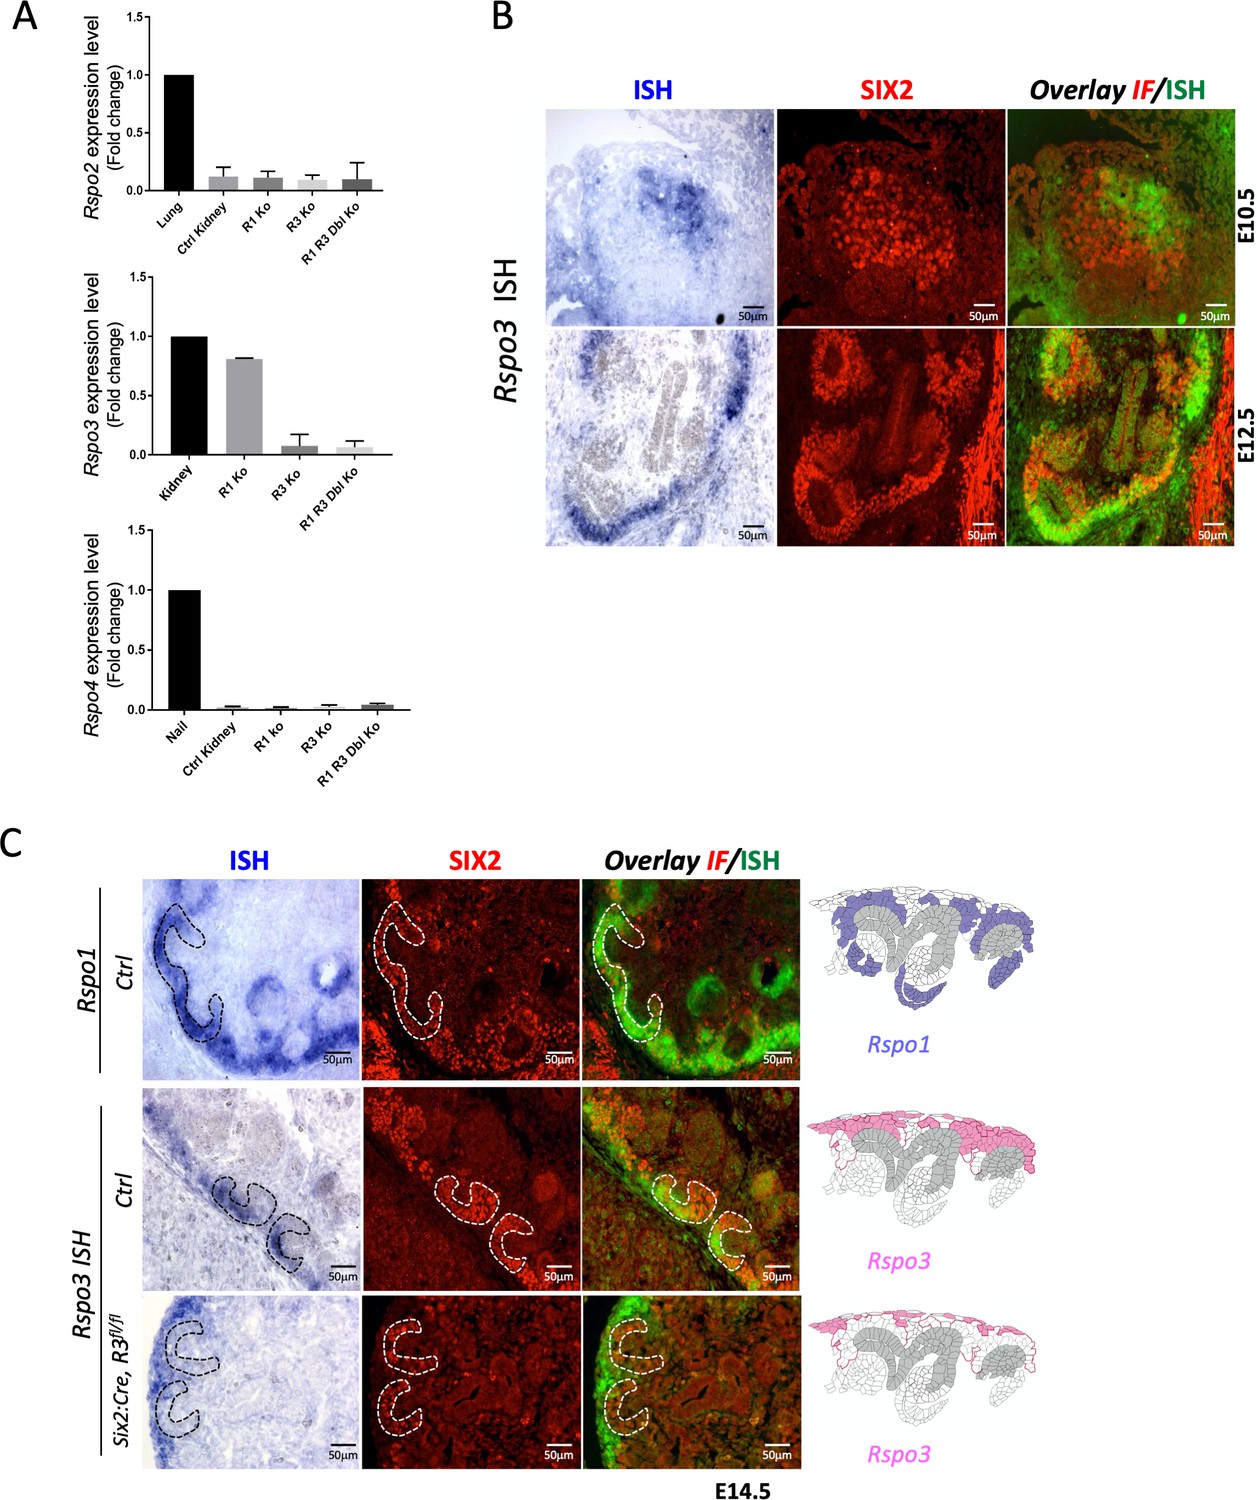
R-spondin expression analysis during kidney development.
(A) qPCR analysis on wildtype (Ctrl Kidney), Rspo1-/- (R1 Ko), CAGG:CreERTM; Rspo3fl/fl (R3 Ko) and on CAGG:CreERTM, Rspo1-/-, Rspo3fl/fl (R1 R3 Dbl Ko). For the conditional Rspo3 allele, Tam induction was performed at E11.5 and kidneys were collected at E14.5. Data are expressed as fold change to highly expressing tissues (lung for Rspo2, kidney for Rspo3 and nail for Rspo4). In wildtype kidneys, strong Rspo3 expression was detected. By contrast, Rspo2 and Rspo4 showed little or no amplification, respectively. Tamoxifen-induced activation efficiently deleted Rspo3. No compensatory upregulation of family members was observed. A one-way ANOVA test was performed. Analysis was performed on kidney pairs isolated from three mouse embryos (n = 3) for all samples except for (R1 R3 Dbl Ko) n = 2. See Figure 1—figure supplement 1—source data 1. (B) Rspo3 is expressed in a subset of SIX2+ nephron progenitors. In situ hybridisation (ISH) analysis carried out on wildtype embryonic kidneys followed by immunofluorescent analysis. (C) In situ hybridisation (ISH) on E14.5 kidney sections prepared from control (Ctrl) and Six2:Cre, Rspo3fl/fl animals. Immunofluorescence (IF) staining with anti-SIX2 antibodies was achieved on same sections to identify renal progenitors (red). ISH and IF signals were overlaid (green and red, respectively). Expression patterns within the nephrogenic niche are schematized to the right of the panel. Note the persistence of Rspo3 expression in stromal cells upon progenitor-specific deletion (Six2-Cre, Rspo3fl/fl animals).
-
Figure 1—figure supplement 1—source data 1
Quantitative analysis of all R-spondin genes expression inRspo1andRspo3mutant kidneys.
Worksheet 1 : Quantification of Rspo2 expression in controls and Rspo1 and Rspo3 mutants kidneys.
Worksheet 2: Quantification of Rspo3 expression in controls and Rspo1 and Rspo3 mutants kidneys.
Worksheet 3: Quantification of Rspo4 expression in controls and Rspo1 and Rspo3 mutants kidneys.
- https://cdn.elifesciences.org/articles/53895/elife-53895-fig1-figsupp1-data1-v3.xls
Figure 1—figure supplement 2
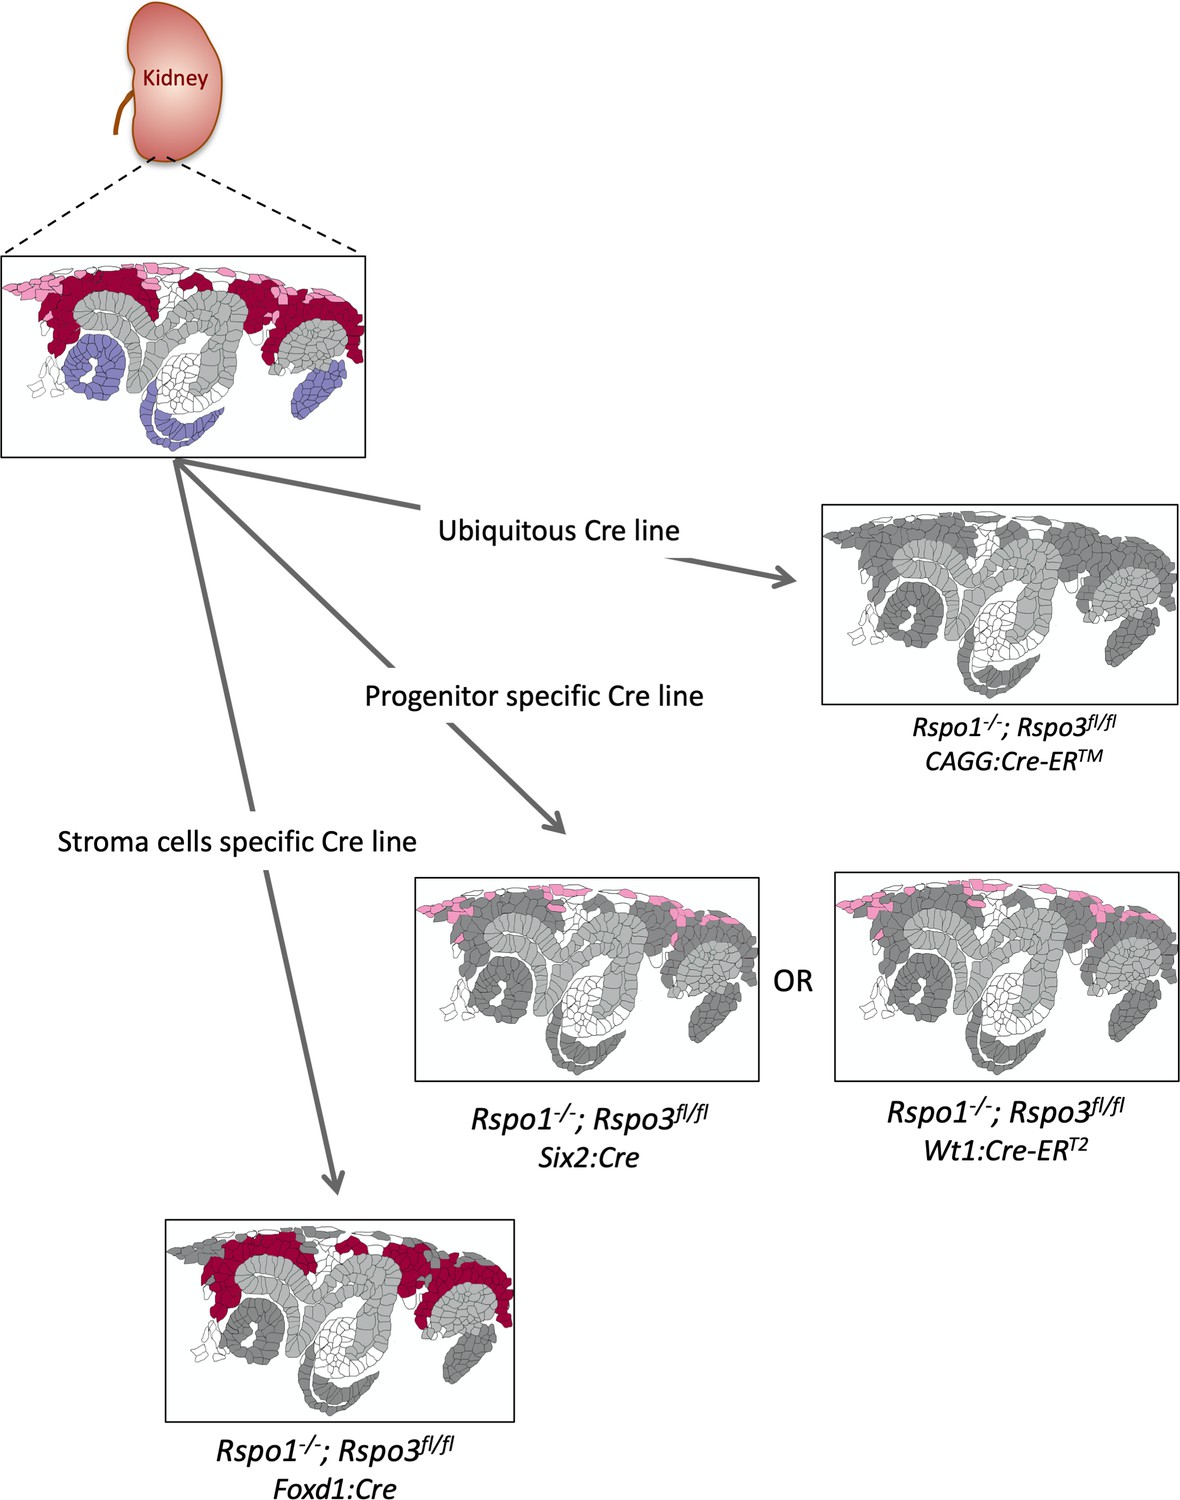
Schematic outline of the different genetic approaches used in this study.
Expression patterns are labeled as follows. Rspo1 (only) = violet; stromal progenitor specific Rspo3 = light pink; nephron progenitor specific Rspo3 = dark red. Structures in dark grey represent cells that are depleted for Rspo1 and/or Rspo3. The branching collecting duct is depicted in light grey.
Figure 1—figure supplement 3
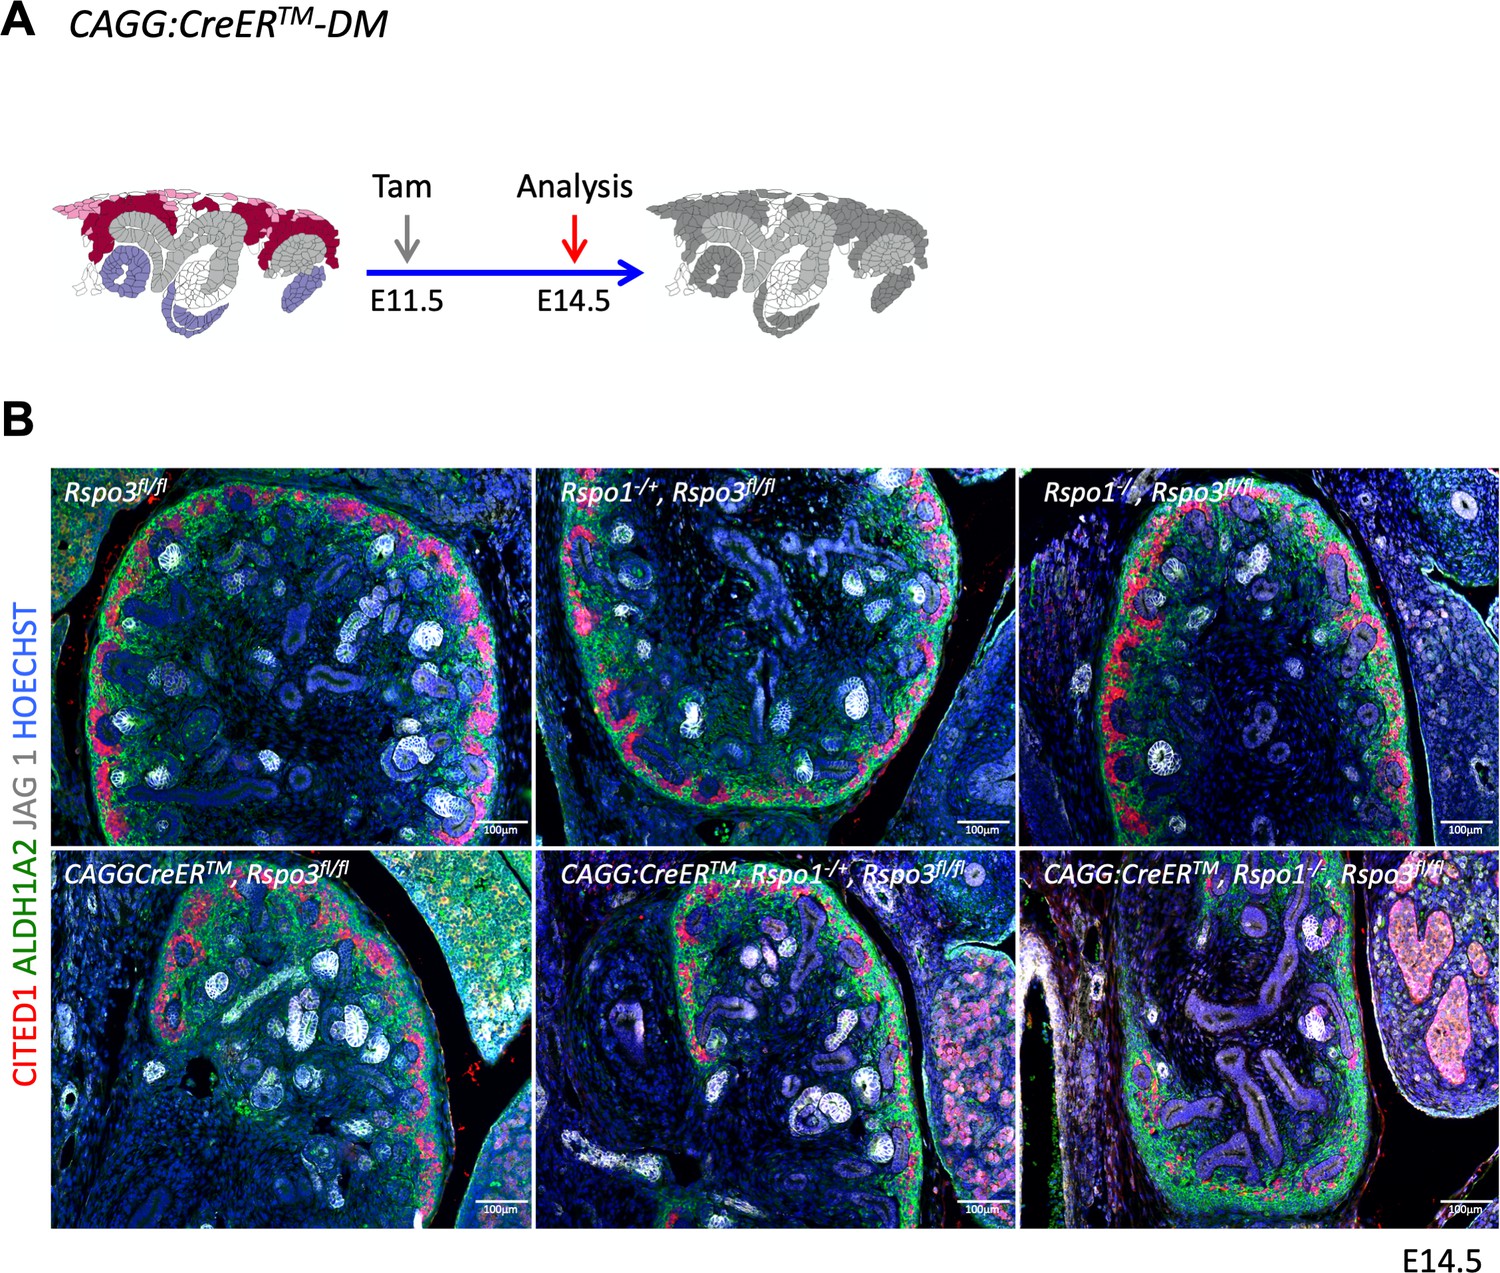
Rspo1 and Rspo3 are functionally redundant.
(A) Schematic outline of the experimental strategy. CAGG:CreERTM was activated by Tam at E11.5 and kidneys analyzed at E14.5. (B) Analysis of compound knockouts indicates that single gene deletion has only mild effects on progenitor survival and kidney formation. Dramatic loss of progenitors occurs when both genes are lost. Immunolabelling for RALDH1A2 (stromal cells in green), CITED1 (progenitors in red) and JAG1 (median segment of RV), comma/S-shaped bodies = white). Nuclei were counterstained with Hoechst (blue).
Figure 2 with 1 supplement
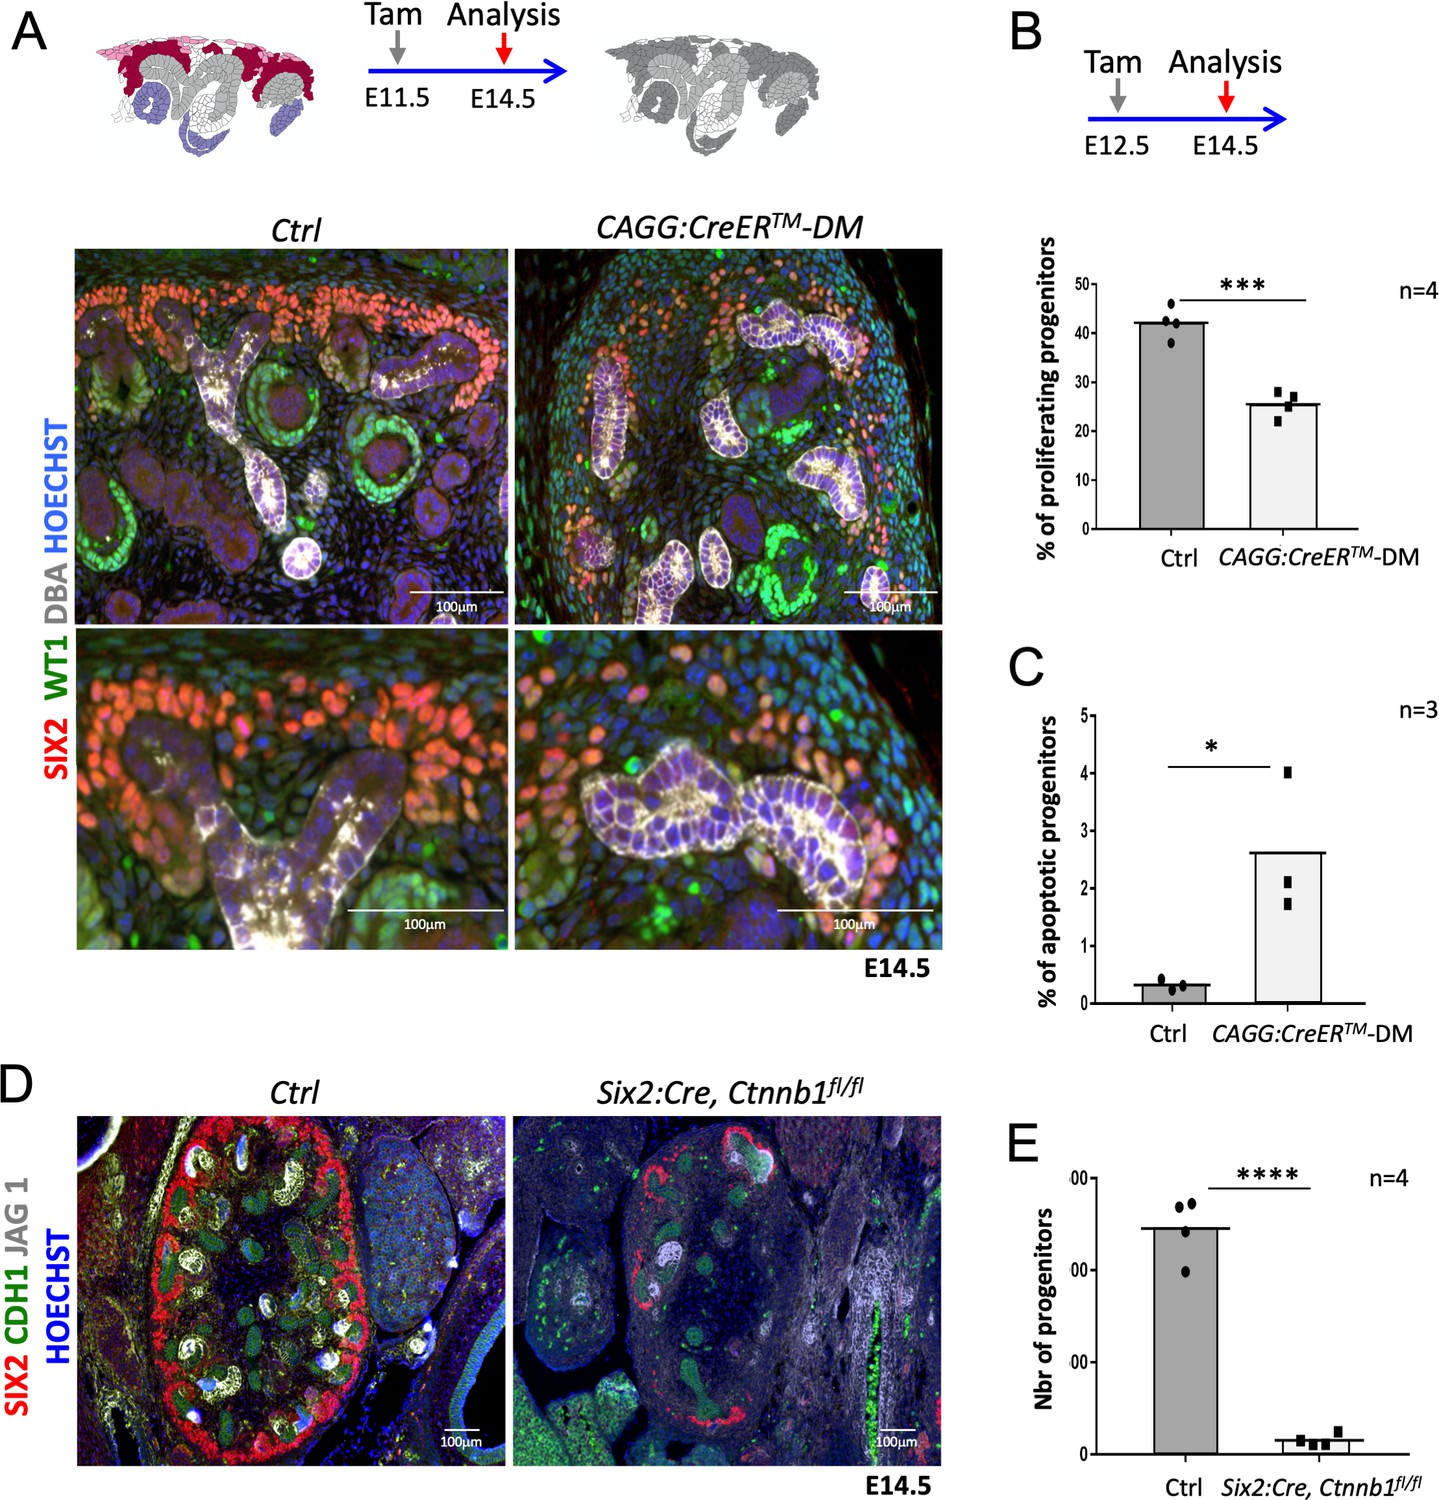
R-spondins are required for renal progenitor maintenance.
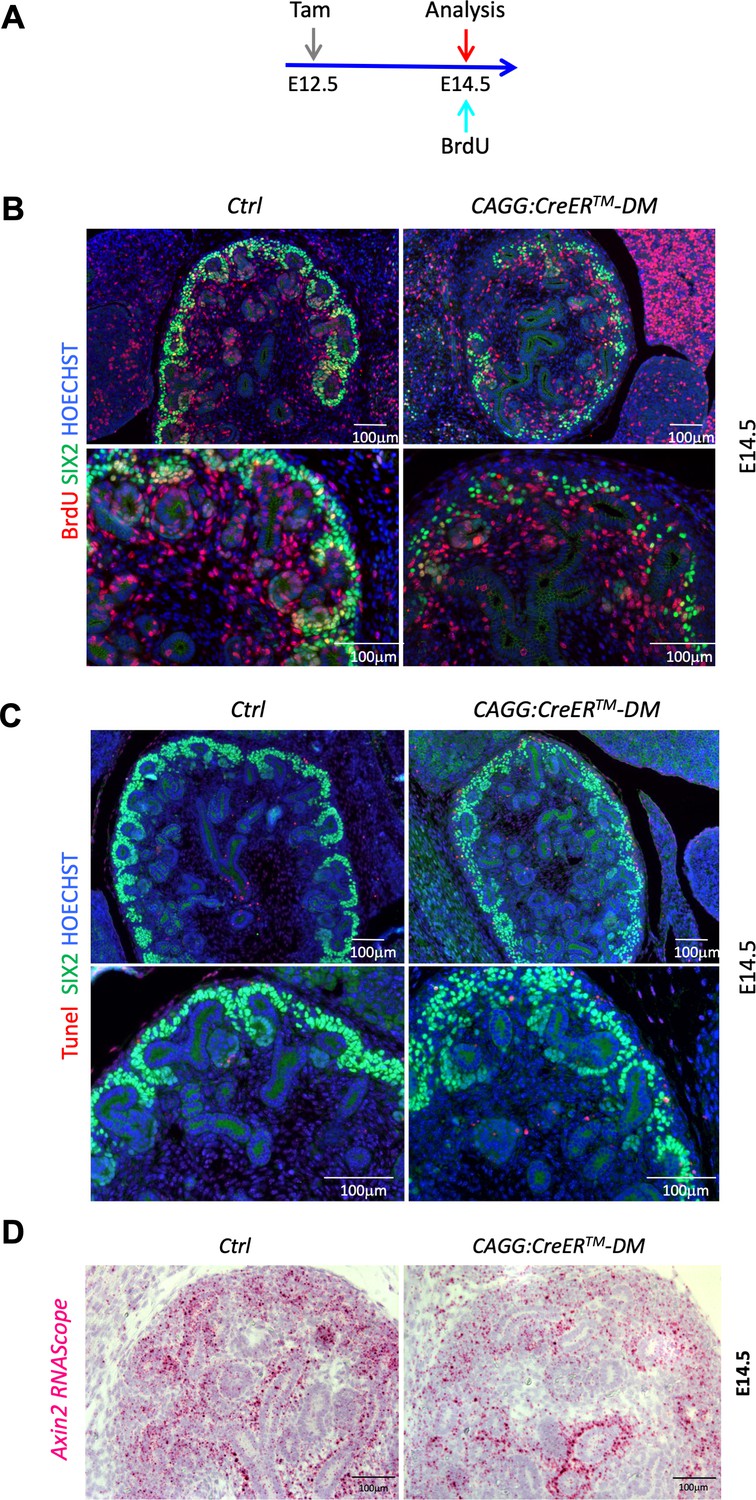
(A) Immunofluorescent analysis at E14.5 (induced at E11.5) reveals loss of SIX2+ progenitor cells and nascent nephrons (comma or S-shaped bodies) in CAGG:CreERTM-DM embryos. (WT1 = green; SIX2 = red; DBA = white; Hoechst = blue). Colour legend for the cartoon: Purple label Rspo1+, pink Rspo3+, dark red Rspo1/Rspo3+ cells. Rspo depleted cells are dark grey, light grey highlights ureteric cells. (B) Quantification of BrdU-labelled SIX2+ progenitors performed on four embryos (n = 4) demonstrates a significant reduction of proliferation 2 days after Rspo3 deletion. See Figure 2—source data 1 (C) TUNEL analysis reveals a dramatic increase in apoptosis (n = 3 embryos for each genotype, two litters). (D) Progenitor specific deletion of β-catenin (Six2:Cre; Ctnnb1fl/fl) results in the loss of progenitor cells at E14.5 (SIX2 = red; CDH1 = green; JAG1 = white). (E). Quantification of SIX2+ progenitors (n = 4 embryos for each genotype isolated from two litters). See Figure 2—source data 1. Columns are means ± SEM with p<0.05 (*), p<0.01 (**), p<0.001 (***), p<0.0001 (****). One black dot = average value for one control embryo, one black square = average value for one CAGG:CreERTM-DM embryo.
-
Figure 2—source data 1
Progenitors quantification inCAGG:CreERTM-DMand (Six2:Cre;Ctnnb1fl/fl) mutant kidneys.
Worksheet 1 - source data for Figure 2B: Quantification of proliferating (BrdU+) progenitor cells (SIX2+) in controls and CAGGCreERTM-DM.
Worksheet 2 - source data for Figure 2C: Quantification of apoptotic (TUNEL+) progenitor cells (SIX2+) in controls and CAGGCreERTM-DM.
Worksheet 3 - source data for Figure 2E: Quantification of progenitor cells (SIX2+) in controls and mutant (Six2:Cre, Ctnnb1 fl/fl) samples.
- https://cdn.elifesciences.org/articles/53895/elife-53895-fig2-data1-v3.xls
Figure 2—figure supplement 1
Proliferation and apoptosis analysis.
(A) Schematic outline of the experimental strategy. To detect early events the CAGG:CreERTM was activated by Tam induction at E12.5, pregnant female received a BrdU injection and were sacrificed 2 hr later at E14.5. B) Representative images for the BrdU labelling quantification used in Figure 2B. Proliferating progenitors were immunodetected with SIX2 (green) and BrdU (red) antibodies. Nuclei were counter stained with Hoechst (blue). (C) Representative images for the TUNEL labelling quantification used in Figure 2C. Cells undergoing apoptosis were labeled with TUNEL assay (red), progenitors were stained with anti-SIX2 (green) antibodies. (D) RNAScope analysis demonstrates reduced Axin2 expression (pink and red signal) in the nephrogenic zone of developing kidney CAGG:CreERTM-DM mutants (E14.5). Cell nuclei were counterstained with Hematoxylin.
Figure 3
Stromal RSPO3 maintains the pool of renal progenitors at late stages of kidney development.
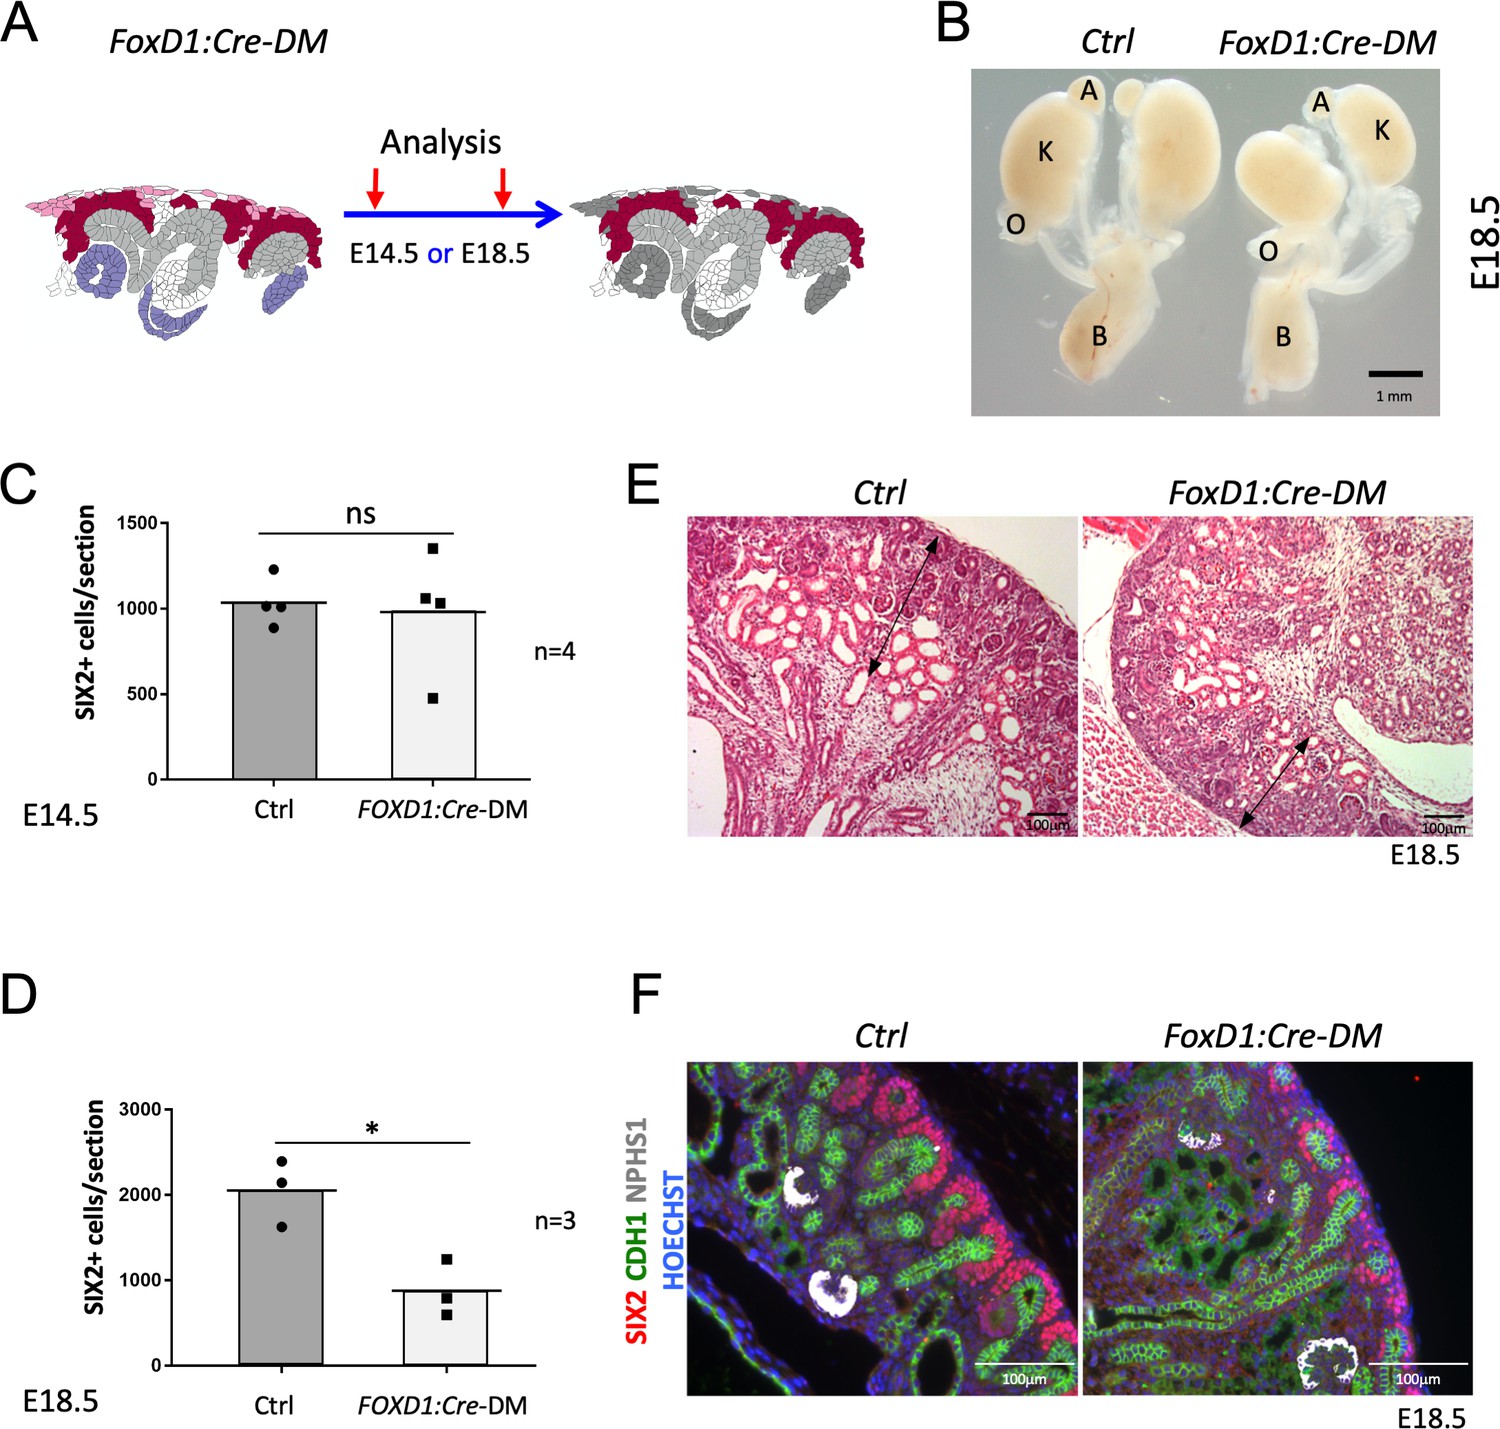
(A) Schematic outline of the strategy used for stromal-specific deletion of Rspo3 in the absence of Rspo1. (B) Macroscopic view of urogenital systems at E18.5 reveals smaller kidneys in Foxd1:Cre-DM mutants when compared to control littermates. (C) Quantification of SIX2+ progenitors reveals no significant difference in the number of progenitors between mutant and control kidneys at E14.5 (n = 4 embryos for each genotype, one litter), see Figure 3—source data 1 (D) but a more than 50% decrease by E18.5 (n = 3 embryos for each genotype, two litters), see Figure 3—source data 1. (E) H and E staining of kidney sections at E18.5 shows a reduction of the nephrogenic zone (double arrowed black lines). (F) IF analysis using anti-CDH1 (green) anti-SIX2 (red), and anti-NPHS1 (marks podocytes in white) antibody reveals a loss of progenitors. Nuclei were counterstained with Hoechst (blue). A: adrenal gland, B: bladder, K: kidney, O: ovary. Columns are means ± SEM with p<0.05 (*), p<0.01 (**), p<0.001 (***), p<0.0001 (****). Foxd1:Cre-DM stands for (Foxd1:Cre, Rspo1-/-, Rspo3fl/fl) double mutant, Ctrl: Control.
-
Figure 3—source data 1
Progenitors quantification inFoxd1:Cre-DMat E14.5 and E18.5.
- https://cdn.elifesciences.org/articles/53895/elife-53895-fig3-data1-v3.xls
Figure 4 with 1 supplement
Absence of R-spondins from progenitors causes lack of MET and downregulation of β-catenin target genes.
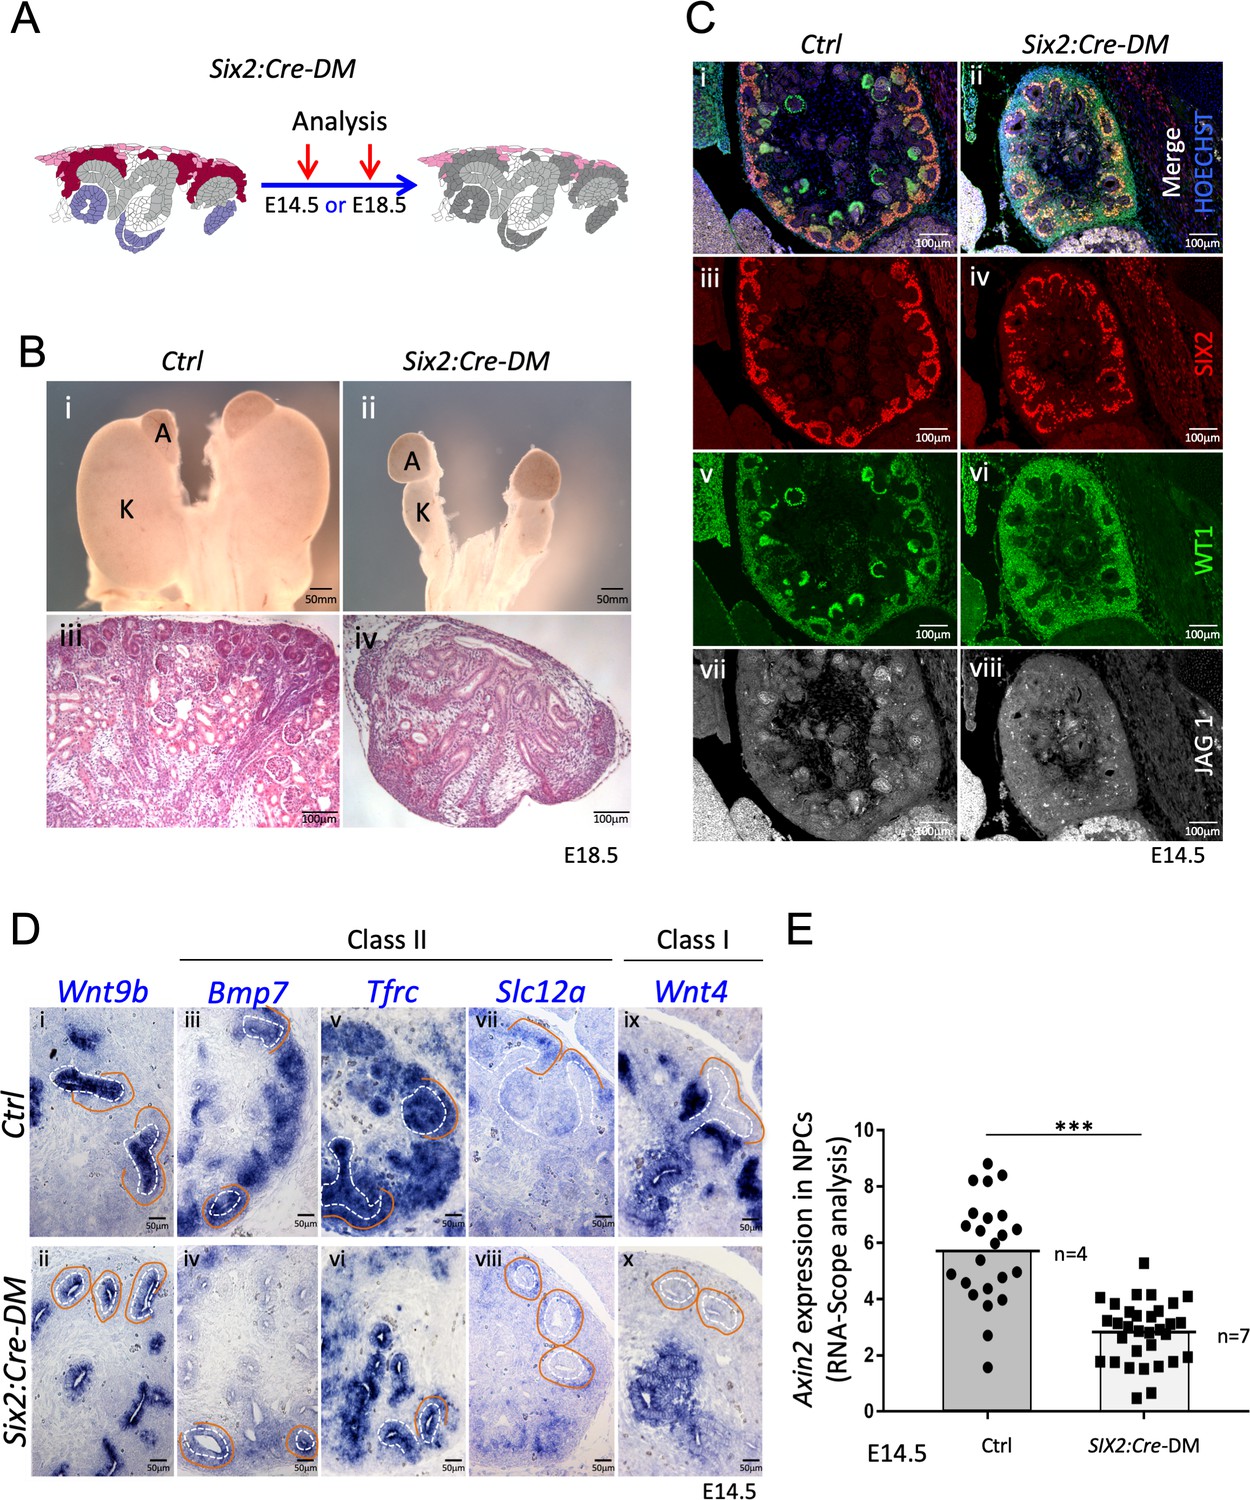
(A) Schematic outline of the strategy used for progenitor-specific deletion of Rspo3. Six2:Cre-DM stands for (Six2:Cre, Rspo1-/-, Rspo3fl/fl). (B) Macroscopic view reveals smaller kidneys (K) in mutant E18.5 embryos. H and E staining reveals a complete absence of glomeruli (compare iii and iv). (C) Immunolabelling for SIX2 (red), WT1 (green) and JAG1 (white) revealed a mild reduction of progenitors and confirmed the lack of nephrons on the molecular level (D). In situ hybridization performed on E14.5 embryos revealed persistence of Wnt9b expression, but dramatic reduction of class I (Wnt4) and class II (Bmp7, Tfrc, Slc12a) β-catenin target genes in the nephrogenic lineage. Dotted white lines highlight the ureter and orange lines outline the CM compartment. (E) Quantification with RNA-Scope technology combined with Halo software analysis shows a reduction of Axin2 expression by 51% in the nephrogenic zone of mutant kidneys compared to control (p<0.0001). (n = 4 embryos isolated from four litters for control genotype, and n = 7 embryos isolated from six litters for mutant genotype). Each dot or square represents the total RNAScope signal detected per nephrogenic area normalised to the total number of cells present in this field. See Figure 4—source data 1. Columns are means ± SEM with p<0.05 (*), p<0.01 (**), p<0.001 (***), p<0.0001 (****).
-
Figure 4—source data 1
Source data for Figure 4E: Quantification of Axin2 RNA-Scope signal.
- https://cdn.elifesciences.org/articles/53895/elife-53895-fig4-data1-v3.xls
Figure 4—figure supplement 1
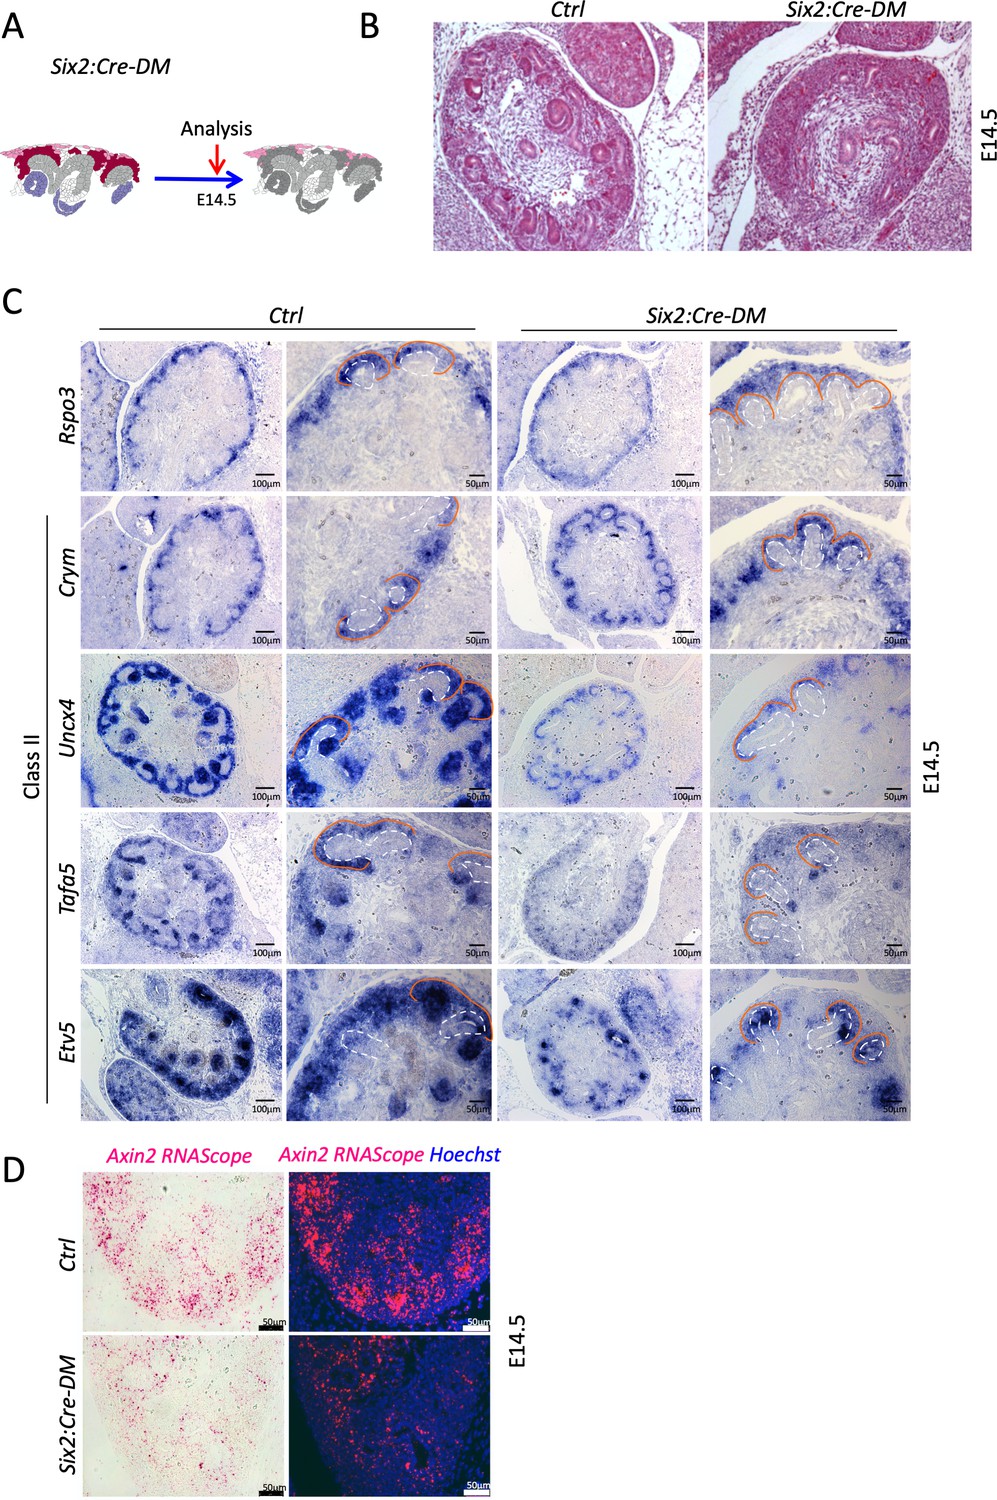
Analysis of progenitor-specific deletion reveals a requirement of R-Spondins for MET.
(A) Schematic outline of the experimental strategy. (B) H and E staining of E14.5 kidney sections reveals an absence of forming nephrons. (C) Wnt9b Class II target genes are reduced upon nephron progenitor specific depletion of Rspo3. Ureteric tips are outlined with a dashed white line, the cap mesenchyme with an orange line. (D) RNA-Scope analysis demonstrates reduced Axin2 expression in the nephrogenic zone of developing kidney Six2:Cre-DM mutants (E14.5). Axin2 probe was detected with a chromogenic substrate (pink colour) that fluorescences (red signal). Nuclei were counterstained with Hematoxylin and with Hoechst (blue).
Figure 5 with 1 supplement
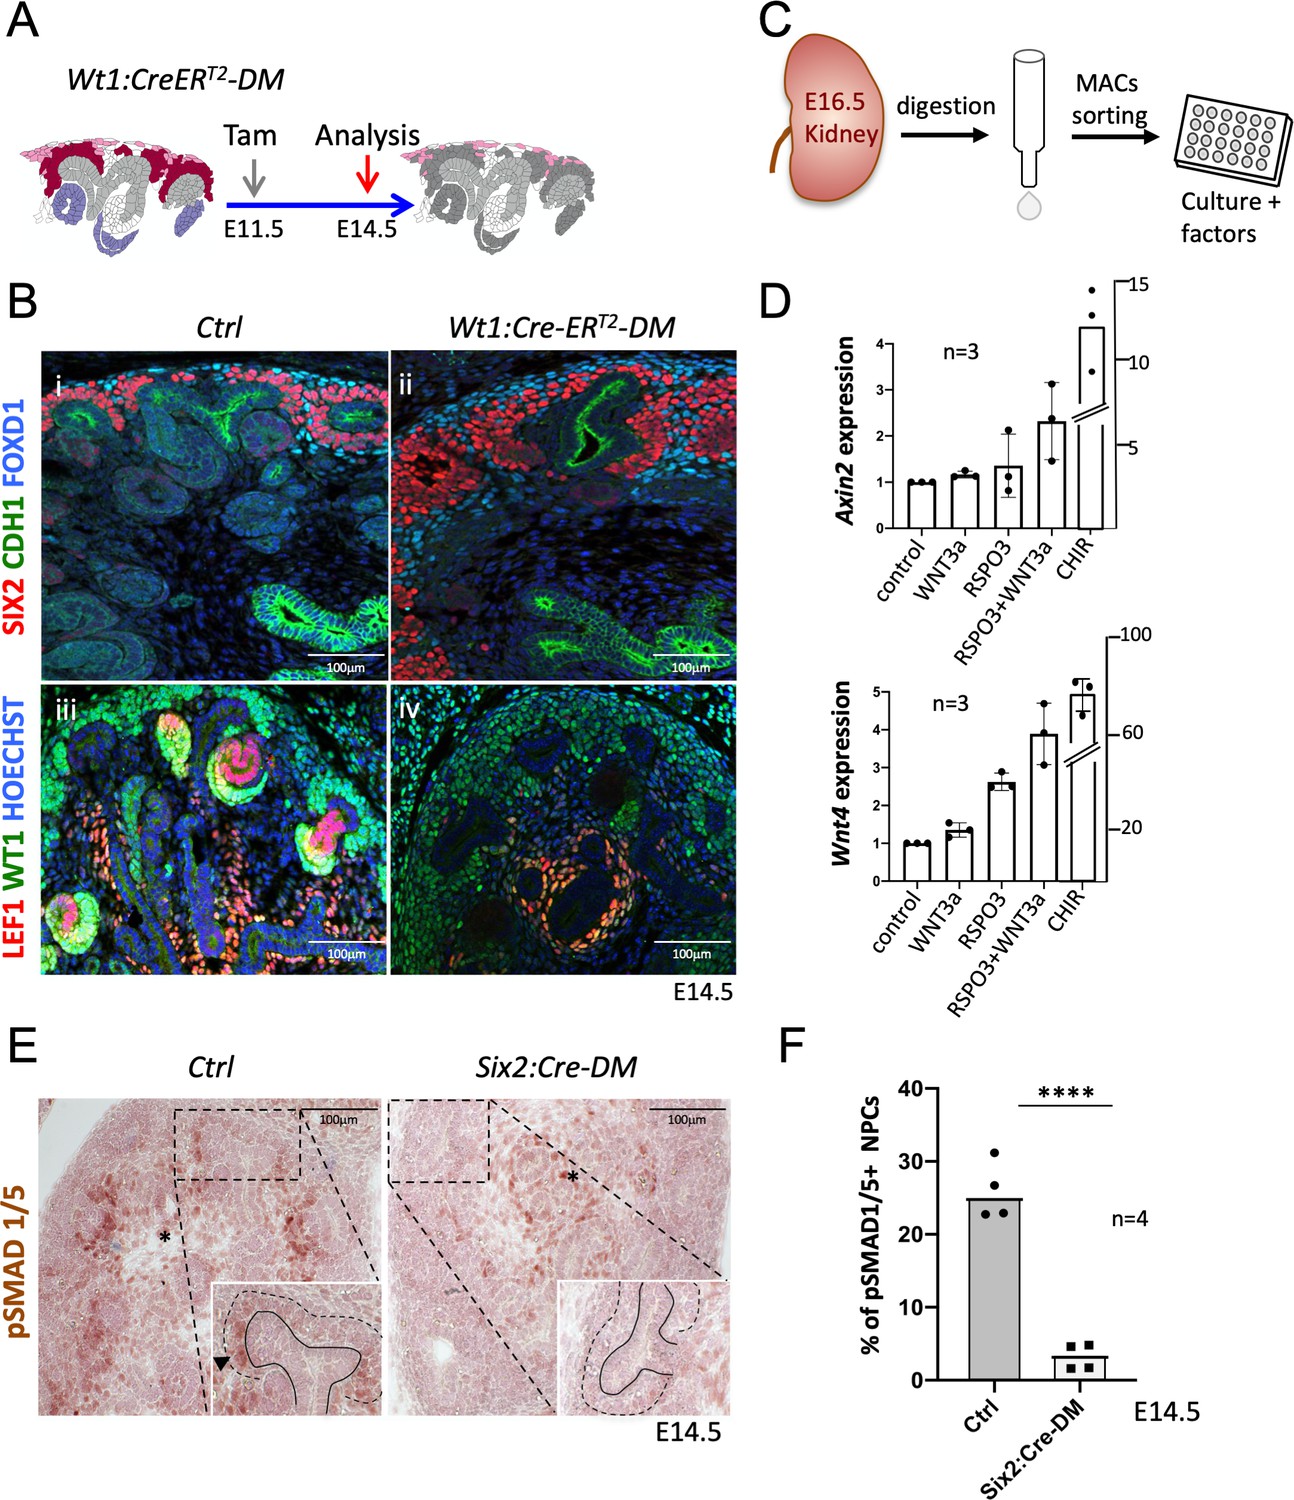
R-spondins are required for MET induction.
(A) Schematic outline of the strategy used for Wt1:CreERT2 induced deletion of Rspo3. Wt1:CreERT2-DM stands for (Wt1:CreERT2, Rspo1-/-, Rspo3fl/fl). (B) i and ii) Immunolabelling revealed lack of nephrogenesis upon Wt1:CreERT2 induced deletion of R-spondins, despite the persistence of large numbers of SIX2+ (red) nephron progenitors and FOXD1+ (blue) stroma progenitors (CDH1 = green). iii and iv) Staining for LEF1 (red) and WT1 (green) confirmed the lack of nephrogenesis (C) Schematic representation of the methodology followed to isolate and grow kidney progenitors in vitro. (D) Comparison of Axin2 or Wnt4 gene expression levels in nephron progenitors treated by recombinant protein WNT3a (50 ng/ml) or RSPO3 (200 ng/ml) alone, WNT3a and RSPO3 in combination or CHIR (3µM) alone as an internal positive control. Experiments were performed as triplicates (n = 3). Compared to control, addition of RSPO3 + WNT3A leads to a 2.3 fold and 4.6 fold increase of Axin2 and Wnt4 expression respectively, see Figure 5—source data 1. (E). Immunohistochemical analysis for pSMAD1/5 demonstrated the lack of nephron progenitor priming (black arrowhead). Note the persistence of pSMAD staining in medullary stroma (black asterisk). In the inset, black lines outline the ureter and dotted lines the CM compartment. (F) Quantification of progenitors that are pSMAD1/5+ reveals a highly significant reduction of SMAD1/5 phosphorylation in mutant compared to control kidneys at E14.5 (n = 4 embryos for each genotype, 3 and 4 litters for control and mutant respectively), see Figure 5—source data 1.
-
Figure 5—source data 1
Quantification ofWnt4andAxin2expression in progenitors cultured in vitro and quantification of pSMAD1/5+progenitors inSix2:Cre-DMkidneys.
- https://cdn.elifesciences.org/articles/53895/elife-53895-fig5-data1-v3.xls
Figure 5—figure supplement 1
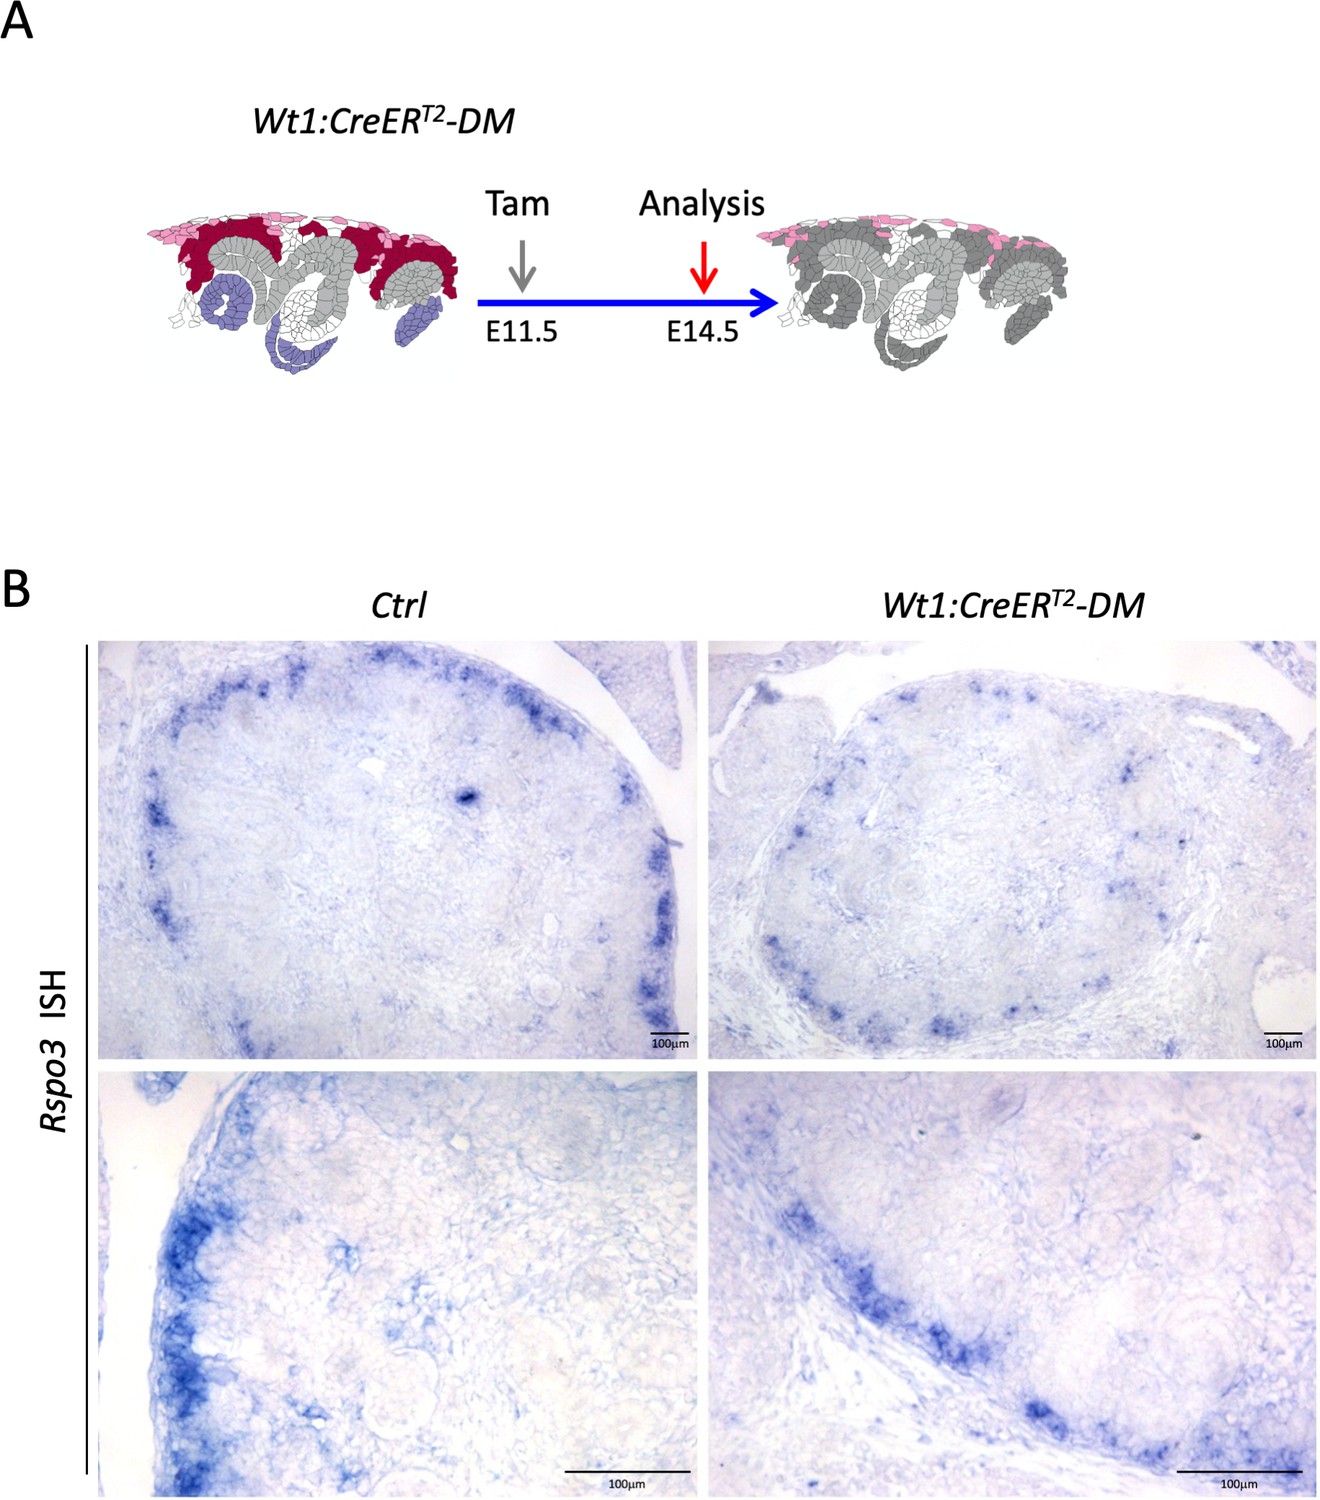
Wt1:CreERT2 induced deletion leads to reduced Rspo3 expression.
(A) Schematic outline of the experimental strategy. (B) In situ hybridization analysis using an Rspo3 anti-sense probe reveals persistence of Rspo3 in stromal cells.
Figure 6 with 1 supplement
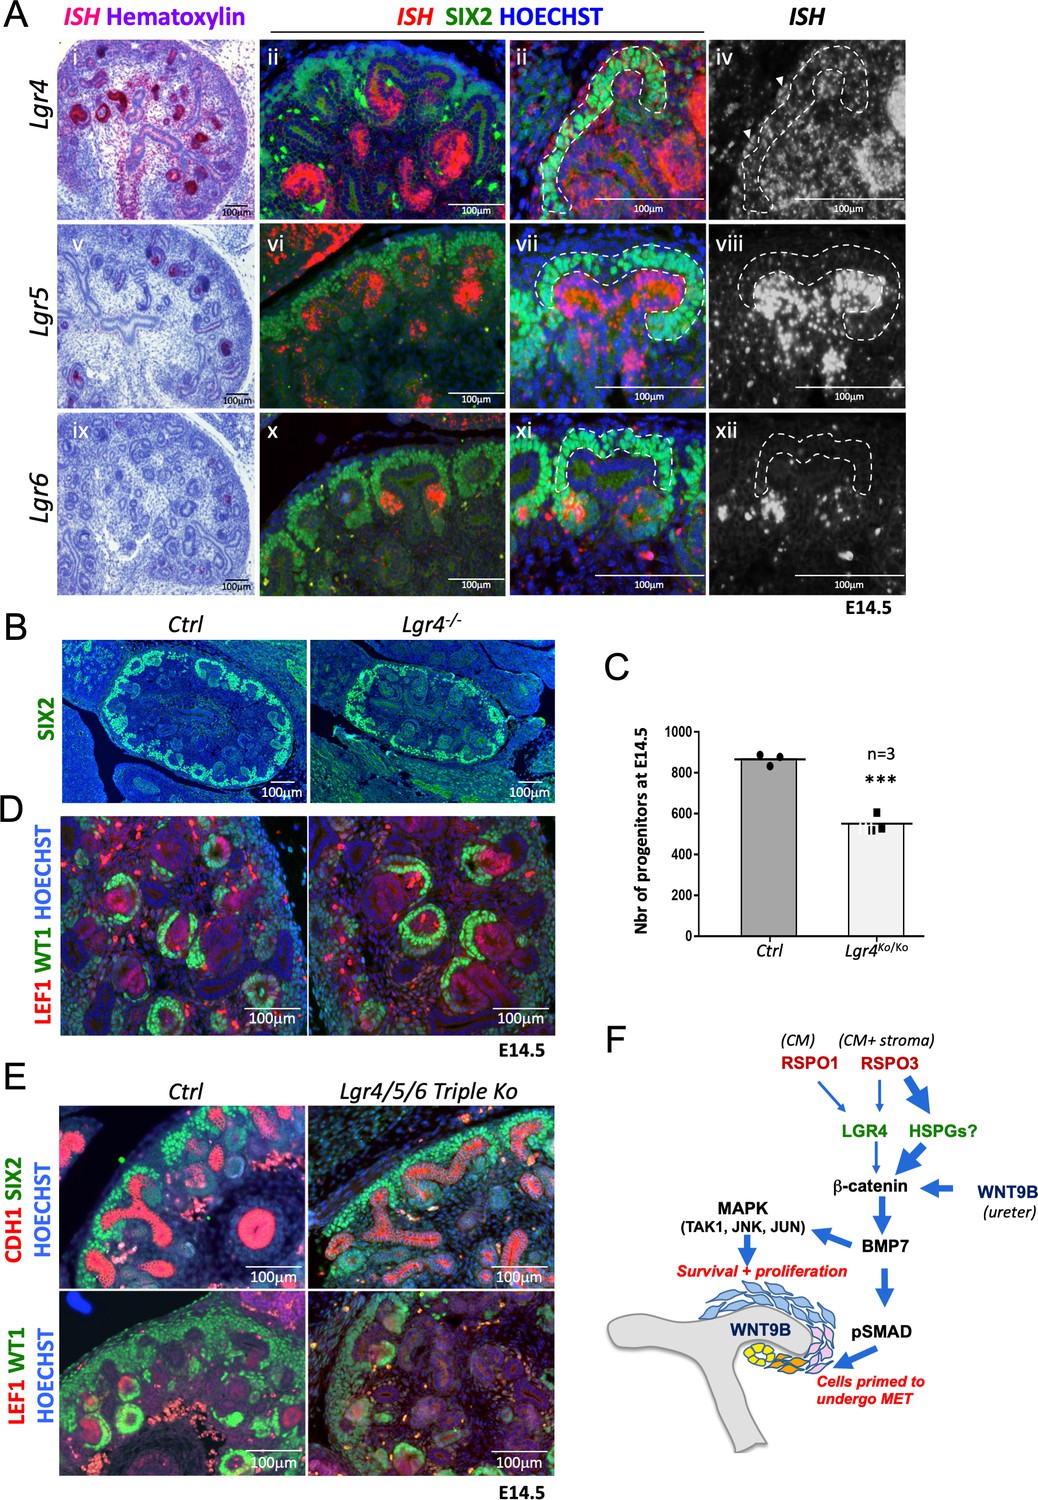
R-spondins can function in an LGR-independent manner during kidney development.
(A) i-iiii) RNAScope analysis (red) revealed low levels of Lgr4 expression throughout the developing kidney with strong signal within the distal portion of the forming nephron and weak activation in the stromal cells (white arrowhead). v-viii) Lgr5 expression was found within the ureteric tip and distal segment of S-shaped bodies. ix-xii) Lgr6 expression was restricted to PTAs of newly forming nephrons. (SIX2 = green, Hoechst = blue). The Cap Mesenchyme compartment is outlined by dotted white lines. (B) Immunofluorescence analysis of Lgr4 knockout and control samples performed on E14.5 kidney sections with SIX2 antibodies reveals a reduction of nephron progenitors. (C) Quantification of SIX2+ progenitors from (B) (for each genotype n = 3 embryos collected from two litters,) Every black dot or square represents the total number of SIX2+ progenitors located in the CM counted in one control or mutant of an entire kidney field, see Figure 6—source data 1. (D) Lgr4 negative progenitors undergo MET as revealed by WT1 staining (high WT1 expression is found in the proximal part of Comma and S-shaped bodies, as well as podocytes). (E) Immunofluorescent analysis in wholebody Lgr4/5/6 mutants demonstrates persistence of progenitors and MET despite the absence of all three cognate R-spondin receptors. (F) Model for the molecular cascade regulated by R-spondins during nephrogenesis.
-
Figure 6—source data 1
Source data for Figure 6C: Quantification of progenitor cells (SIX2+) in controls and Lgr4 mutants at E14.5.
- https://cdn.elifesciences.org/articles/53895/elife-53895-fig6-data1-v3.xls
Figure 6—figure supplement 1
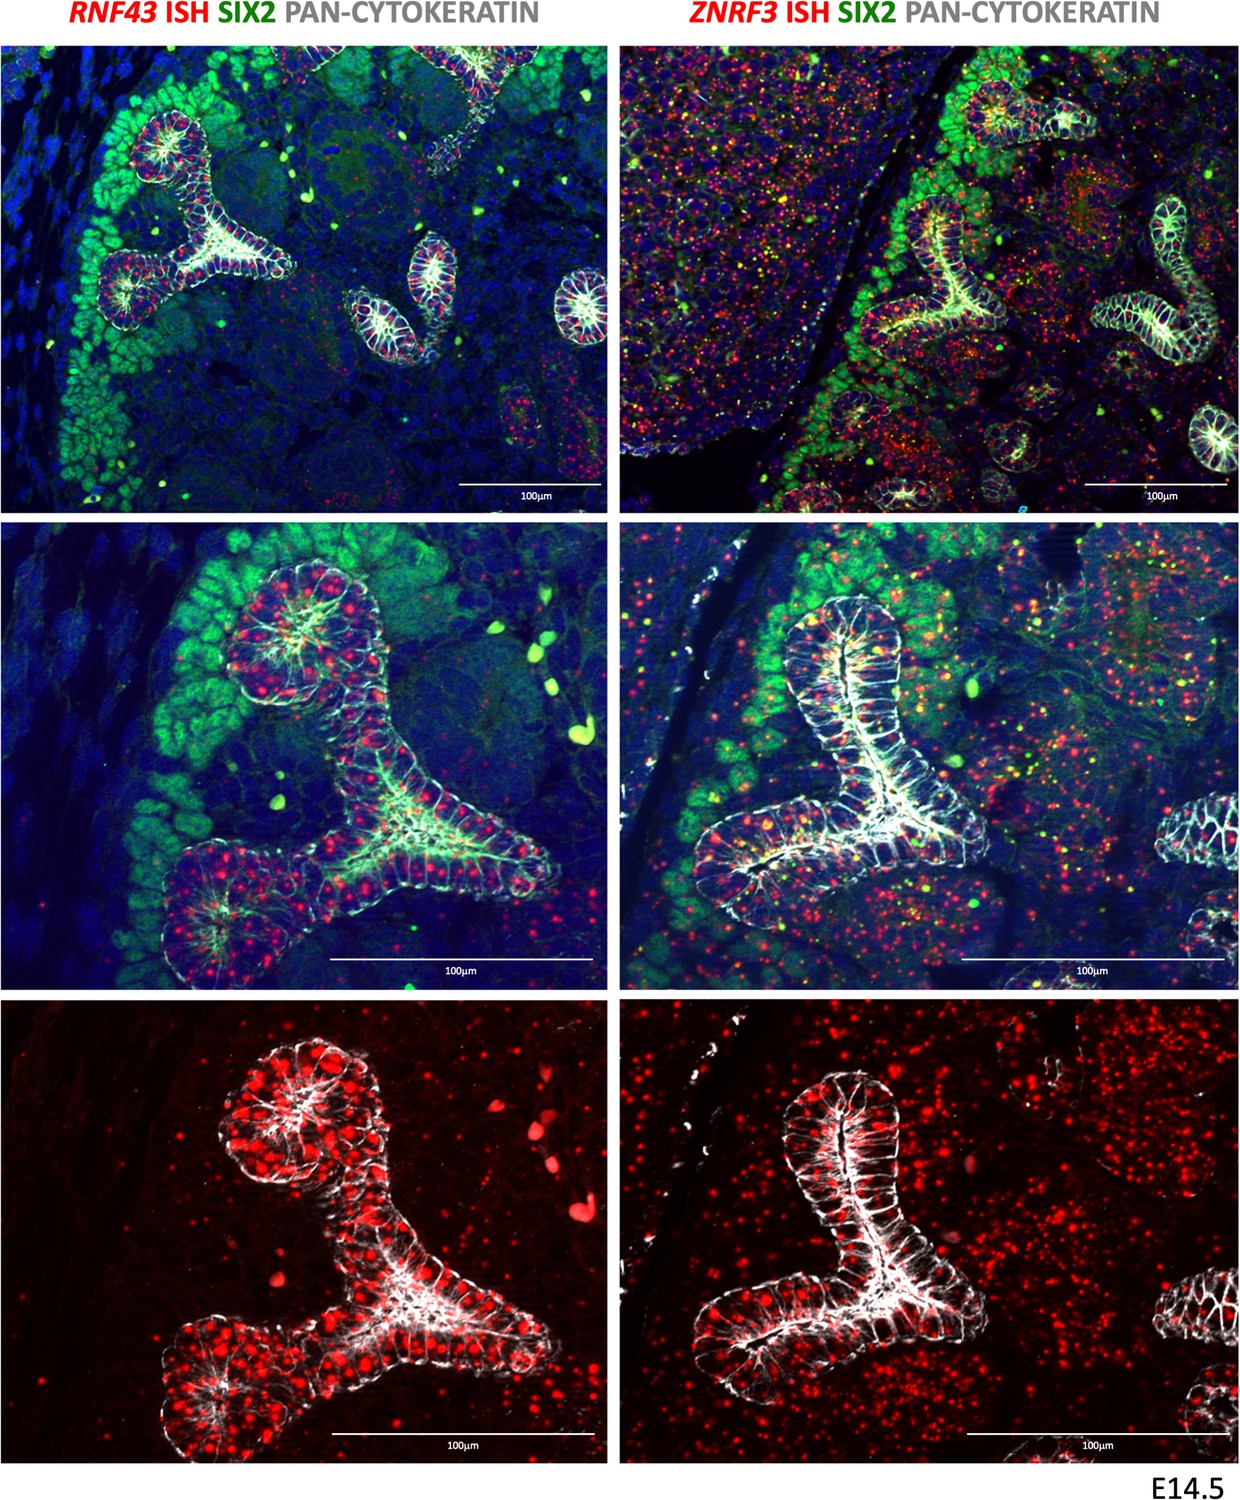
RNF43 and ZNRF3 expression pattern in developing kidneys.
RNF43 expression was found to be strongly expressed in the developing collecting duct system, but very low/absent in other compartments. ZNRF3 expression was more widespread with signals visible in virtually all compartments.
Tables
Table 1
List of primer pairs used for qPCR or genotyping analysis in this study.
| Name | Forward | Reverse | Usage |
|---|---|---|---|
| Axin2 | GCAAGTCCAAGCCCCATA | CGGCTGACTCGTTCTCCT | qPCR |
| Rspo2 | GCCAGGCAAAAGACACAATACCA | CAATCAGGCTTCCGCCTCTTCTTC | qPCR |
| Rspo3 | TCAAAGGGAGAGCGAGGA | CAGGAGGAGGAGCTTGTTTCC | qPCR |
| Rspo4 | GCTGTTTCAGGCCAGGGACTTC | TTGTGTATGCAGGGGACTCCA | qPCR |
| Sdha | TGTTCAGTTCCACCCCACA | TCTCCACGACACCCTTCTG | pPCR |
| Wnt4 | ACTGGACTCCCTCCCTGTCT | TGCCCTTGTCACTGCAAA | qPCR |
| Ctnnb1 | AAGGTAGAGTGATGAAAGTTGTT | CACCATGTCCTCTGTCTATTC | Genotyping |
| Cre | CCCACCGTCAGGTACGTGAGATAT | CGCGGTCTGGCAGGTAAAAACTAT | Genotyping |
| Foxd1 Wt | CTCCTCCGTGTCCTCGTC | TCTGGTCCAAGAATCCGAAG | Genotyping |
| Foxd1 Cre | GGGAGGATTGGGAAGACAAT | TCTGGTCCAAGAATCCGAAG | Genotyping |
| Lgr4 Wt and Ko | TGTGTTTTGGCTTGCTTGAC | AGTCTGCTCCCCTACCACT | Genotyping |
| Lgr4 Wt | TGCAACCCTAGAAGGGAAAA | CTCACAGGTGCTTGGGTGAAG | Genotyping |
| Lgr4 Ko | GCCTGCATTACCGGTCGATGCAACGA | CTCACAGGTGCTTGGGTGAAG | Genotyping |
| Lgr5 Wt | ACATGCTCCTGTCCTTGCT | GTAGGAGGTGAAGACGCTGA | Genotyping |
| Lgr5 Ko | CACTGCATTCTAGTTGTGG | CGGTGCCCGCAGGCGAG | Genotyping |
| Lgr6 Wt | CGCTCGCCCGTCTGAGC | GCGTCCAGGGTCCGCAGGG | Genotyping |
| Lgr6 Ko | CGCTCGCCCGTCTGAGC | CCTGGACGTAGCCTTCGGGC | Genotyping |
| Rspo1Ko | ATCCAGGGGTCCCTCTTGATC | AATATCGCGGCTCATTCGAGG | Genotyping |
| Rspo1Wt | ATCCAGGGGTCCCTCTTGATC | TTGAGGCAACCGTTGACTTC | Genotyping |
| Rspo3flox | CTTCAACTTGAAGGTGCTTTACC | CCAGGAATGTACAACAGGATCCTCTC | Genotyping |
Additional files
-
Supplementary file 1
Key resources table.
- https://cdn.elifesciences.org/articles/53895/elife-53895-supp1-v3.docx
-
Transparent reporting form
- https://cdn.elifesciences.org/articles/53895/elife-53895-transrepform-v3.docx
Download links
A two-part list of links to download the article, or parts of the article, in various formats.
Downloads (link to download the article as PDF)
Open citations (links to open the citations from this article in various online reference manager services)
Cite this article (links to download the citations from this article in formats compatible with various reference manager tools)
R-spondin signalling is essential for the maintenance and differentiation of mouse nephron progenitors
eLife 9:e53895.
https://doi.org/10.7554/eLife.53895


