AANAT1 functions in astrocytes to regulate sleep homeostasis
- Centre for Research in Neuroscience, Department of Neurology and Neurosurgery, McGill University, Canada
- BRaIN Program, Research Institute of the McGill University Health Centre, Canada
- Integrated Program in Neuroscience, McGill University, Canada
- Neuroscience Graduate Group, Perelman School of Medicine, University of Pennsylvania, United States
- Biology Graduate Group, University of Pennsylvania, United States
- Howard Hughes Medical Institute, Chronobiology and Sleep Institute, Perelman School of Medicine, University of Pennsylvania, United States
Figures
Figure 1 with 1 supplement
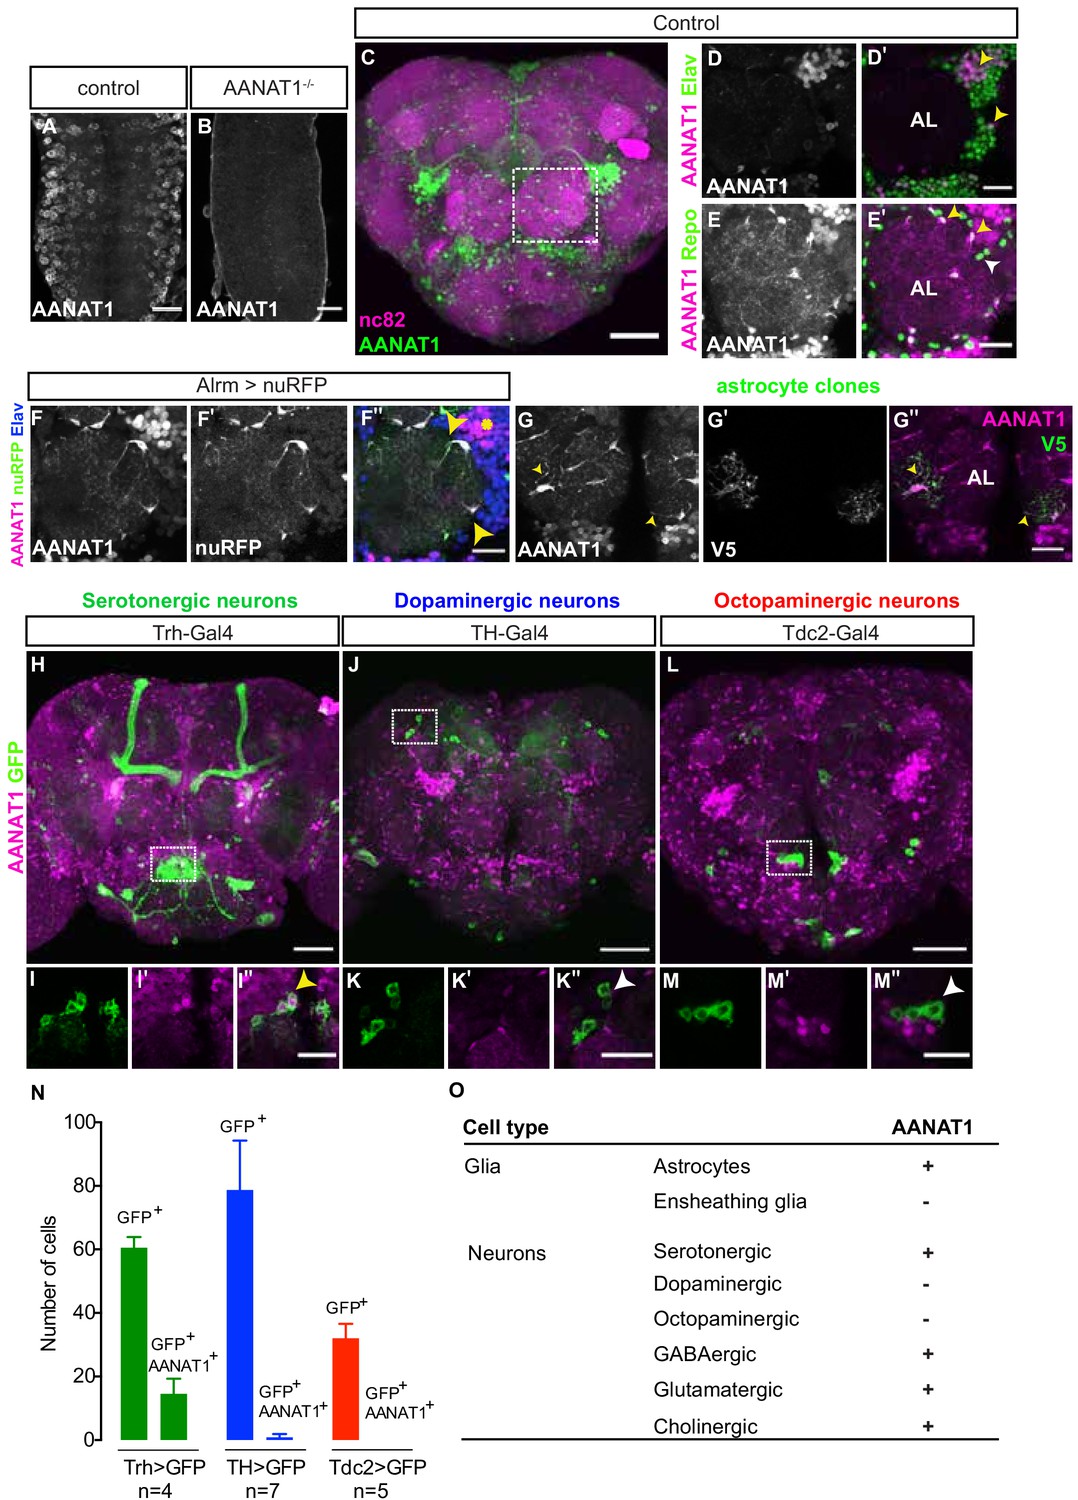
AANAT1 expression in the adult Drosophila brain.
(A–B) AANAT1 IHC in the ventral nerve cords of age-matched embryos (stage 17) of a w1118 control (A) and an AANAT1-null homozygous for Df(BSC)356 (B). (C–M) AANAT1 IHC in the central brain of adults. (C) Z-stack projection showing AANAT1 (green) and neuropil marker nc82 (magenta) in Alrm-Gal4/+ control animals. (D–D') Single optical slice showing AANAT1 (magenta) and the pan-neuronal marker Elav (green). Yellow arrowheads point to neurons co-expressing both (D'). (E–E'). Single optical slice of AANAT1 (magenta) and the pan-glial marker Repo (green) in control animals where most glia express AANAT1 (E'; yellow arrowheads), but not all (E'; white arrowheads). AL = antennal lobe. Glia were labeled less intensely for AANAT1 than neurons, and so the adjusted imaging parameters reveal higher background levels in the antennal lobe than seen in D-D'. (F–F'') Single slice of AANAT1 (magenta), Elav (blue), and astrocyte marker Alrm-Gal4; UAS-nuRFP (Alrm >nuRFP, green) showing co-expression of AANAT1 and nuRFP in astrocytes (F''; yellow arrowheads) and with Elav (F''; yellow asterisk). (G–G'') MCFO-labeled single-cell astrocyte clones (anti-V5, green) co-labeled with AANAT1 (magenta). Yellow arrowheads indicate AANAT1-positive astrocyte cell bodies and cytoplasm. AL = antennal lobe. (H–M'') Z-stack projections and single=slice images of AANAT1 (magenta) and GFP (green) IHC in monoaminergic neurons labeled with type-specific Gal4 drivers. Dotted boxes in H, J and L show regions approximating those selected for imaging at higher power in animals of the same genotypes shown in I, K and M, respectively. AANAT1 is expressed in some serotonergic neurons (I''; yellow arrowhead), but not in dopaminergic or octopaminergic neurons (K'', M''; white arrowheads). (N) Quantification of the mean number of GFP-positive and GFP/AANAT1 double-positive cells in the central brains of animals where Gal4 is used to express GFP in serotonergic (green), dopaminergic (blue) or octopaminergic (red) neurons. Error bars represent standard deviation. (O) Summary of AANAT1 expression in cell types of the adult Drosophila central brain. Scale bars in A, B, D-G, I, K, M = 20 µm. Scale bars in C, H, J, L = 50 μm.
Figure 1—figure supplement 1
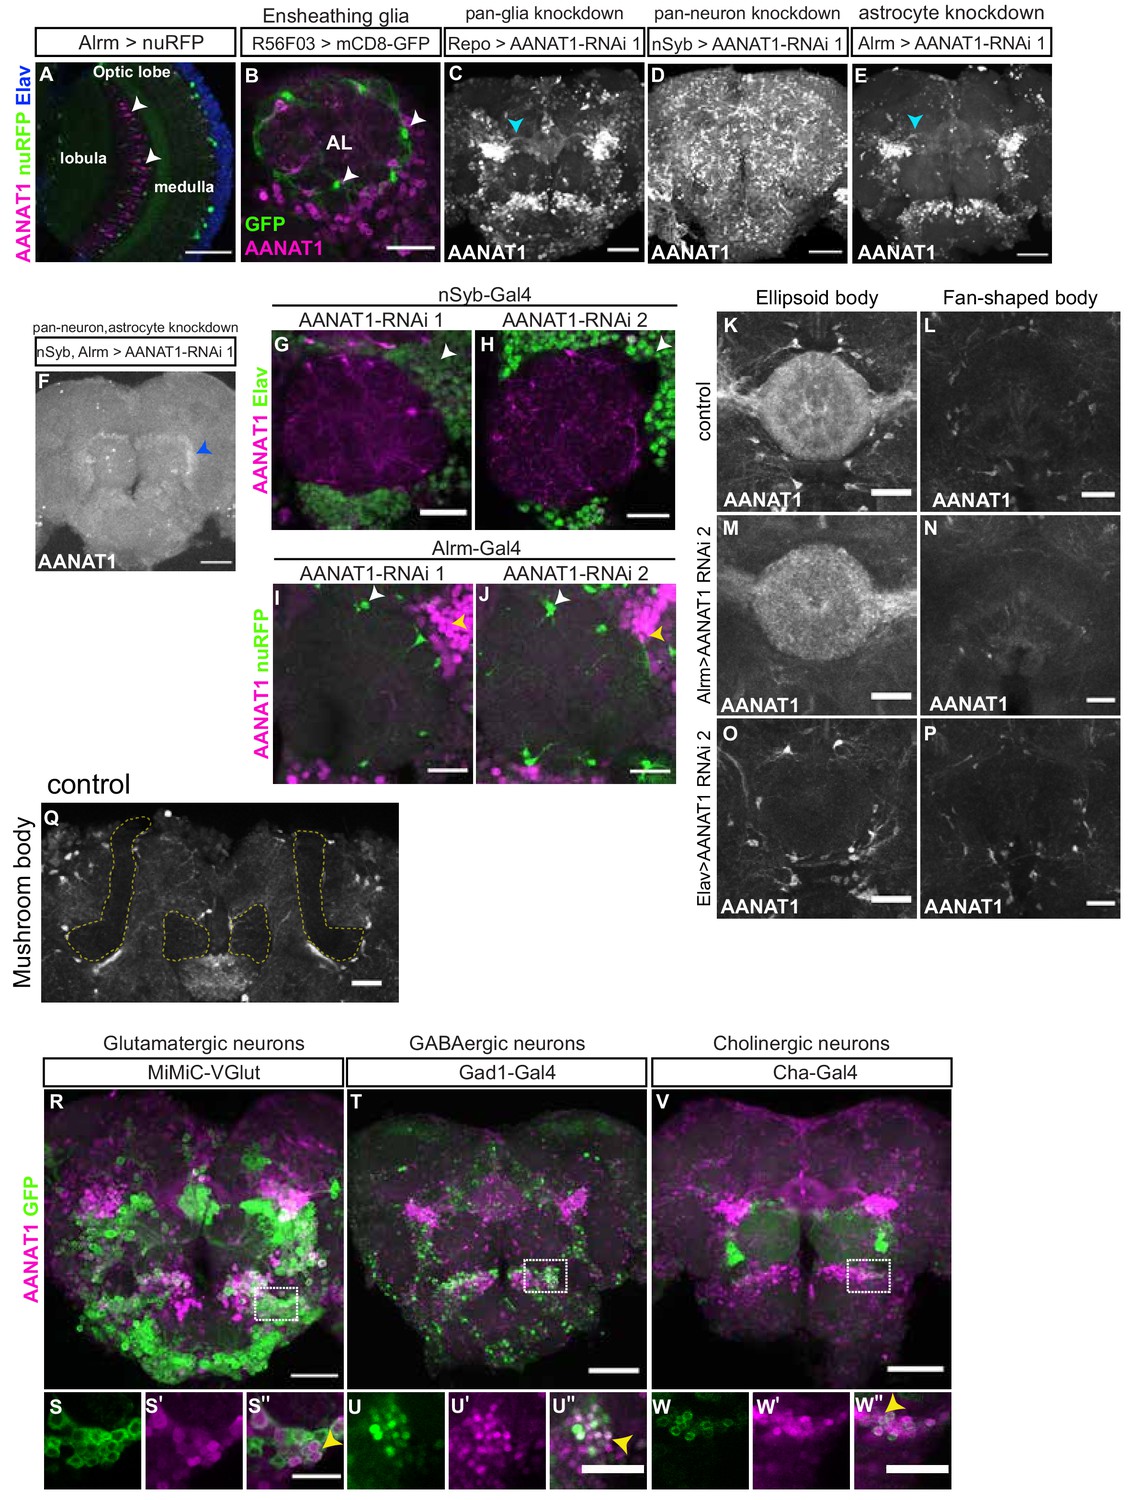
AANAT1 expression in the adult Drosophila brain.
(A) Single optical slice showing AANAT1 (magenta), Elav (blue) and Alrm >nuRFP (green), with AANAT1-negative astrocytes (white arrowheads) in the optic lobe. (B) Single optical slice showing AANAT1 (magenta) and R56F03 > mCD8 GFP (green) showing absence of AANAT1 in ensheathing glia (white arrowheads). (C–F) AANAT1 expression upon AANAT1 knockdown with UAS-HMS01617 RNAi driven in all glia (C; Repo-Gal4;UAS-Dcr-2), all neurons (D; nSyb-Gal4), astrocytes (E; Alrm-Gal4,UAS-nuRFP), and both in neurons and astrocytes (F; nSyb-Gal4;Alrm-Gal4). Cyan arrowheads in C and E depict axonal bundles. Blue arrowhead in F shows background signal. (G, H) Single slices of IHC for AANAT1 (magenta) and Elav (green) showing loss of AANAT1 expression (white arrowheads) upon knockdown in neurons using nSyb-Gal4 to drive either UAS-HMS01617 (G; RNAi 1) or UAS-JF02142 (H; RNAi 2). (I, J) Single slices of IHC for AANAT1 (magenta) and Alrm >nuRFP (green) showing loss of AANAT1 expression (white arrowheads) upon knockdown in astrocytes using Alrm-Gal4 to drive RNAi 1 (I) or RNAi 2 (J). Yellow arrowheads indicate AANAT1 expression in neurons. (K–P) Z-stack projections showing AANAT1 (gray) expression in ellipsoid body (K,M,O) and fan-shaped body (L,N,P) neuropil regions in UAS-JF02142/+ controls (K,L) and upon knockdown of AANAT1 with AANAT1-RNAi2 driven in astrocytes using Alrm-Gal4 (M,N) or in neurons using Elav-Gal4 (O,P). (Q) Single-slice of AANAT1 IHC (gray) showing absence of AANAT1 expression in the α and βγ lobes of the mushroom body (outlined with dotted yellow line). (R–W'') Z-stack projections (R,T,V) and single-slice images (S-S'';U-U'';W-W'') of AANAT1 (magenta) and GFP (green) IHC in non-monoaminergic neurons labeled with type-specific drivers. Dotted boxes in R, T and V show regions approximating those selected for imaging at higher magnification in animals of the same genotypes shown in S-S'', U-U'' and W-W'', respectively. AANAT1 is expressed in subsets of glutamatergic, GABAergic and cholinergic neurons (S'', U'', W''; yellow arrowheads). Scale bars in A, C-F, R, T, V = 50 µm. Scale bars in B, G-J, K-P, S'', U'', W''=20 μm.
Figure 2 with 1 supplement
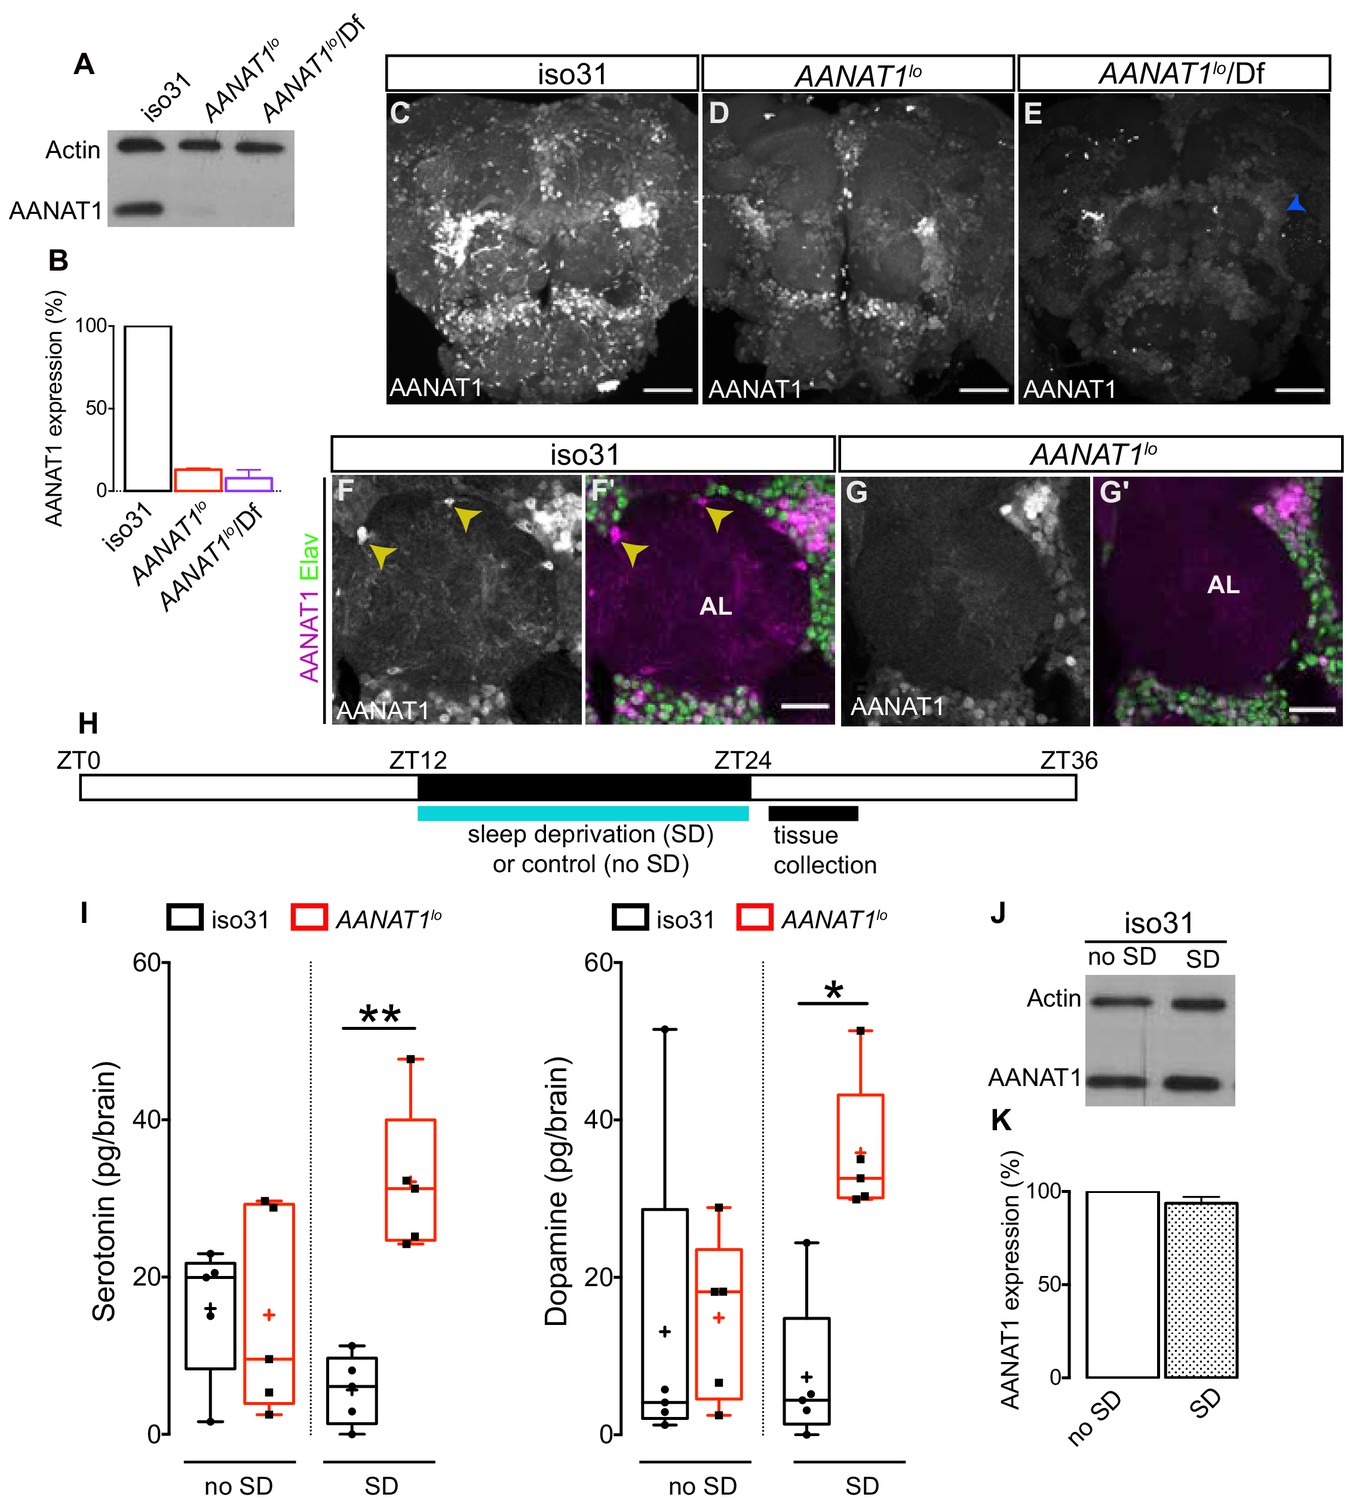
Characterization of AANAT1lo.
(A) Western blot of lysates prepared from dissected brains (ZT9-10) of iso31, AANAT1lo and AANAT1lo/Df(In(2LR)Px[4]) adult males. (B) Quantification of AANAT1 expression normalized to that of actin (mean + standard deviation, n = 3 biological replicates). (C–E) Z-stack images showing AANAT1 (gray) in iso31 (C), AANAT1lo (D) and AANAT1lo/Df(In(2LR)Px[4]) (E) animals. Blue arrowhead in E represents background signal. Scale bars = 50 µm. (F, G) Single optical slices showing AANAT1 (gray or magenta) and Elav (green) in iso31 (F, F') and AANAT1lo (G, G'). Yellow arrowhead shows AANAT1+ astrocytes. Scale bars = 20 µm. (H) Schematic of experiment for HPLC-MS analysis. (I) HPLC-MS measurement of serotonin (one-way ANOVA with Tukey’s post-hoc test, *p<0.05, **p<0.01,) and dopamine (Kruskal–Wallis test, Dunn’s multiple comparisons, *p<0.05,) in iso31 (black) and AANAT1lo (red) fly brains under control and sleep deprivation (SD) conditions. Box and whisker plots show 25–75% interquartile range (box), minimum and maximum (whiskers), median (horizontal line in box), and mean (+). n = 5 per genotype. (J) Western blot of lysates prepared from dissected brains (ZT24-25) of iso31 females in control (no SD) and SD conditions. (K) Quantification of AANAT1 (paired t-test, p=0.0831, n = 3) expression, normalized to actin levels in iso31 animals under control (no SD) and SD conditions.
Figure 2—figure supplement 1
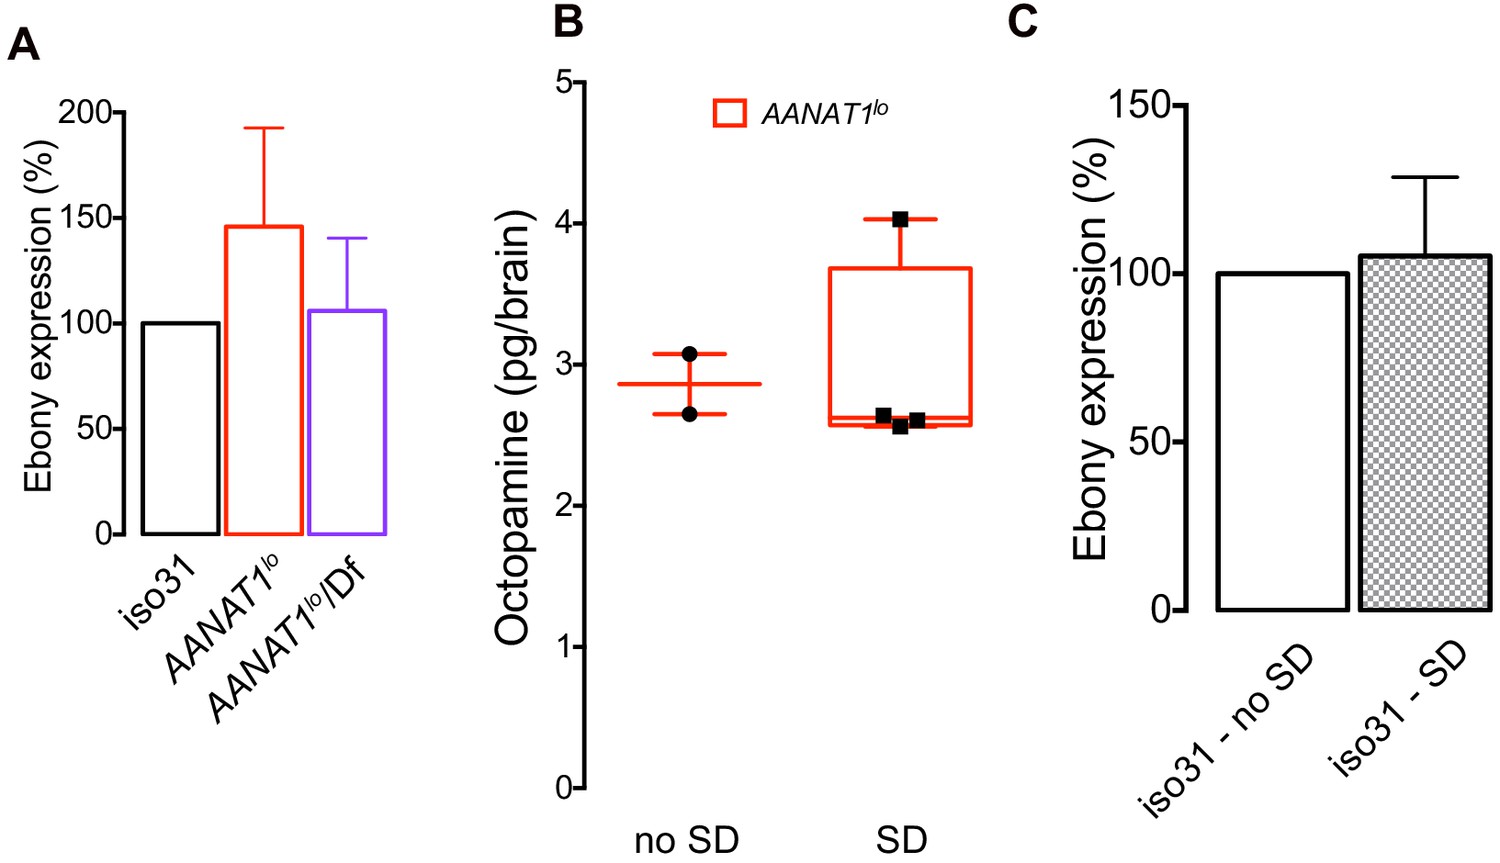
Characterization of AANAT1lo.
(A) Quantification of Ebony expression normalized to that of actin (mean + standard deviation, n = 3 biological replicates, one-way ANOVA with Tuckey’s post-hoc test). (B) HPLC-MS measurement of octopamine (Mann-Whitney test, p<0.533) in AANAT1lo animals under control (n = 2) and SD (n = 5) conditions. Box and whisker plot as in Figure 2F. (C) Quantification of Ebony (paired t-test, p=0.7036, n = 3) expression normalized to actin levels in iso31 animals under control and SD conditions.
Figure 3 with 1 supplement

AANAT1 knockdown in neurons.
(A–D) Baseline sleep upon knockdown with UAS-HMS01617 (RNAi 1). 24 hr sleep profile showing light/dark conditions on X-axis (A), and quantification during day (ZT 0–12) versus night (ZT 12–24) of total sleep duration (B), sleep bout length (C) and bout number (D) for the nSyb-Gal4 control (black, n = 30), the UAS-HMS01617 control (blue, n = 32), and knockdown animals (nSyb >HMS01617, green, n = 32). (bar graphs show mean + standard deviation, one-way ANOVA with Tukey’s post-hoc test, *p<0.05, ***p<0.001, ****p<0.0001). (E–H) Baseline sleep upon knockdown with UAS-JF02142 (RNAi 2). (E) 24 hr sleep profile showing light/dark conditions on X-axis. Quantification of total sleep duration (F), sleep bout length (G) and bout number (H) for the nSyb-Gal4 control (black, n = 30), the UAS- JF02142 control (blue, n = 32), and knockdown animals (nSyb >JF02142, green, n = 32). The plotted nSyb-Gal4 control data is the same as in A-D, as the experiments were done simultaneously. (one-way ANOVA with Tukey’s post-hoc test, ***p<0.001, ****p<0.0001). (I, J) Recovery sleep upon knockdown with UAS-HMS01617 (RNAi 1). (I) 24 hr sleep profile of baseline and recovery days, and (J) the duration of sleep during ZT0-6 recovery period. nSyb-Gal4 control (black), the UAS-HMS01617 control (blue), and knockdown animals (nSyb >HMS01617, green). (n = 27 per genotype, one-way ANOVA with Tukey’s post-hoc test). (K, L) Recovery sleep upon knockdown with UAS-JF02142 (RNAi 2). (K) 24 hr sleep profile of baseline and recovery day, (L) duration of sleep during ZT0-6 recovery period (L). nSyb-Gal4 control (black), the UAS- JF02142 control (blue), and knockdown animals (nSyb >HMS01617, green). (n = 32 per genotype, one-way ANOVA with Tukey’s post-hoc test).
Figure 3—figure supplement 1

AANAT1 knockdown in neurons.
(A) Activity Index for knockdown with UAS-HMS01617 (RNAi 1) for the nSyb-Gal4 control (black; n = 30), the UAS-HMS01617 control (blue; n = 32), and knockdown animals (nSyb >HMS01617, green; n = 32). (B) Activity Index for knockdown with UAS-JF02142 (RNAi 2) for the nSyb-Gal4 control (black; n = 30), the UAS-JF02142 control (blue; n = 32), and knockdown animals (nSyb >HMS01617, green; n = 32).
Figure 4 with 1 supplement

AANAT1 knockdown in astrocytes.
(A) Compared with Alrm-Gal4 controls (Alrm>), the number of nuRFP labeled astrocytes in the central brain is unaffected upon RNAi knockdown of AANAT1 with HMS01617 (AANAT1-RNAi 1) or JF02142 (AANAT1-RNAi 2). Box and whisker plot as in Figure 2F. One-way ANOVA with Tukey’s post-hoc test, n = 7–9 per genotype. (B, C) Baseline sleep upon knockdown with UAS-HMS01617 (RNAi 1). 24 hr sleep profile (B), and total sleep duration (C) for the Alrm-Gal4 control (black; n = 32), the UAS-HMS01617 control (blue; n = 26), and knockdown animals (Alrm >HMS01617, green; n = 32), (one-way ANOVA with Tukey’s post-hoc test). (D, E) Baseline sleep upon knockdown with UAS-JF02142 (RNAi 2). 24 hr sleep profile (D), and total sleep duration (E) for the Alrm-Gal4 control (black; n = 32), the UAS-JF02142 control (blue; n = 32), and knockdown animals (Alrm >JF02142, green; n = 30). The plotted Alrm-Gal4 control data is the same as in B and C, as the experiments were done simultaneously, (one-way ANOVA with Tukey’s post-hoc test). (F, G) Recovery sleep upon knockdown with UAS-HMS01617 (RNAi 1). 24 hr sleep profile of baseline day and recovery day (F), and the duration of sleep during ZT0-6 recovery period (G) for the Alrm-Gal4 control (black), the UAS-HMS01617 control (blue), and knockdown animals (Alrm >HMS01617, green). (n = 31 per genotype, Kruskal–Wallis one-way ANOVA with Dunn’s post-hoc test, ****p<0.0001). (H, I) Recovery sleep upon knockdown with UAS-JF02142 (RNAi 2). 24 hr sleep profile of baseline day and recovery day (H), and the duration of sleep during ZT0-6 recovery period (I) for the Alrm-Gal4 control (black), the UAS-JF02142 control (blue), and knockdown animals (Alrm >HMS01617, green). (n = 32 per genotype, error bars are mean + standard deviation, one-way ANOVA with Tukey’s post-hoc test, ****p<0.0001). (J) HPLC-MS measurement of serotonin (Mann-Whitney t-test) and dopamine (Mann-Whitney t-test) in Alrm-Gal4 control (black; n = 7 for dopamine; n = 5 for serotonin) and Alrm >JF02142 (green; n = 6) fly brains under sleep deprivation (SD) conditions. For UAS controls (not shown), some samples fell below the limit of detection, leaving too few data points for robust statistical analysis. Box and whisker plots show 25–75% interquartile range (box), minimum and maximum (whiskers), median (horizontal line in box), and mean (+). (K) AANAT1 levels in astrocyte cell bodies normalized to nuRFP at ZT12,15,18,21 and 24 time-points. (n = 3 per time-point, 10 cells per sample, mean+ SEM).
Figure 4—figure supplement 1
AANAT1 knockdown in astrocytes.
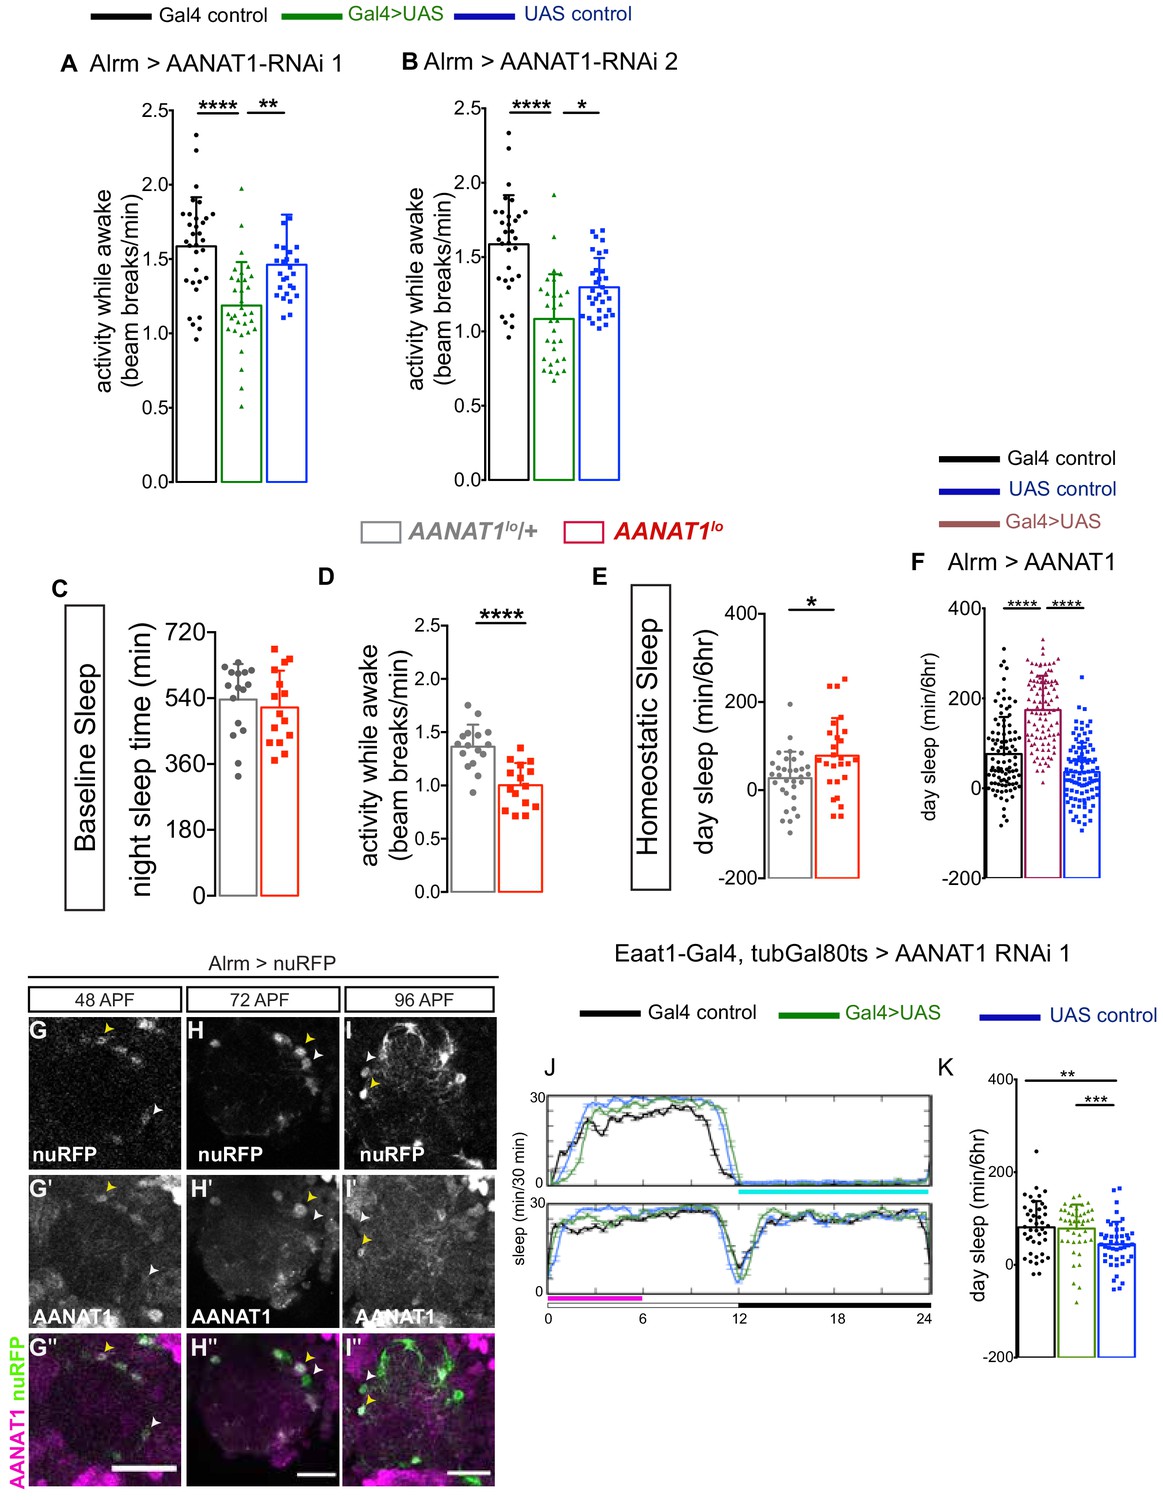
(A) Activity Index for knockdown with UAS-HMS01617 (RNAi 1) for the Alrm-Gal4 control (black; n = 32), the UAS-HMS01617 control (blue; n = 26), and knockdown animals (Alrm >HMS01617, green; n = 32). (B) Activity Index for knockdown with UAS-JF02142 (RNAi 2) for the Alrm-Gal4 control (black; n = 32), the UAS-JF02142 control (blue; n = 32), and knockdown animals (Alrm >JF02142, green; n = 30). (C, D) Nighttime sleep (C) and activity index (D) for AANAT1lo/+ heterozygotes (gray; n = 16) and AANAT1lo homozygous mutants (red; n = 15). (Error bars are mean + standard deviation, Mann-Whitney t-test, p=0.0003). (E) Recovery sleep measured as the duration of sleep during ZT0-6 recovery period for AANAT1lo/+ heterozygous (gray; n = 32) and AANAT1lo homozygous mutants (red; n = 26). (Error bars are mean + standard deviation, Mann-Whitney t-test, p=0.0131). (F) Recovery sleep upon overexpression with UAS-AANAT1. The duration of sleep during ZT0-6 recovery period for the Alrm-Gal4 control (black), the UAS-AANAT1 control (blue), and overexpression animals (Alrm >AANAT1, brown). (n = 96 per genotype, error bars are mean + standard deviation, Kruskal-Wallis one-way ANOVA with Dunn’s post-hoc test, ****p<0.0001). (G–I'') Single slices of IHC for AANAT1 (magenta) and Alrm >nuRFP (green) showing AANAT1 expression above background levels (yellow arrowheads) in astrocytes during pupal development time 48 hr after puparium formation ( APF) (G–G''), 72 APF (H–H'') and 96 APF (I–I''). White arrowheads indicate astrocytes that do not express AANAT1. Scale bars in G'',H'',I''=20 μm. (J–K) Recovery sleep after adult-specific knockdown of AANAT1 with UAS-HMS01617 (RNAi 1) in astrocytes. 24 hr sleep profile of baseline and recovery day (J) and the duration of sleep during ZT0-6 recovery period (K). The duration of sleep during ZT0-6 recovery period (K) for the Eaat1-Gal4;tubGal80ts control (black, n = 42), the UAS-HMS01617 control (blue, n = 46), and knockdown animals (Eaat1-Gal4;tubGal80ts>HMS01617, green, n = 44). Kruskal–Wallis one-way ANOVA with Dunn’s post-hoc test, **p<0.01, ***p<0.001.
Tables
Key resources table
| Reagent type (species) or resource | Designation | Source or reference | Identifiers | Additional information |
|---|---|---|---|---|
| Gene (Drosophila melanogaster) | AANAT1 | Flybase | FBgn0019643 | Previously known as Dat. Also, speck (sp) |
| Genetic reagent (D. melanogaster) | Trh-Gal4 | Bloomington Drosophila Stock Center | RRID:BDSC_52249 | FlyBase genotype: y1 w*; wgSp-1/CyO, P{Dfd-EYFP}2; P{Trh-GAL4.S}attP2 |
| Genetic reagent (D. melanogaster) | TH-Gal4 | Bloomington Drosophila Stock Center | RRID:BDSC_8848 | FlyBase genotype: w*; P{ple-GAL4.F}3 |
| Genetic reagent (D. melanogaster) | Tdc2-Gal4 | Bloomington Drosophila Stock Center | RRID:BDSC_52243 | FlyBase genotype: y1 w*; wgSp-1/CyO, P{Dfd-EYFP}2; P{Tdc2-GAL4.S}attP2 |
| Genetic reagent (D. melanogaster) | 10X-UAS-mCD8-GFP | Bloomington Drosophila Stock Center | RRID:BDSC_32186 | FlyBase genotype: w*; P{10XUAS-IVS-mCD8::GFP}attP40 |
| Genetic reagent (D. melanogaster) | UAS-RFP.nls | Bloomington Drosophila Stock Center | RRID:BDSC_30558 | FlyBase genotype: w[1118]; P{w[+mC]=GAL4-Act5C(FRT.CD2).P}S, P{w[+mC]=UAS RFP.W}3/TM3, Sb[1] |
| Genetic reagent (D. melanogaster) | Mi{MIC} VGlutMI04979 | Bloomington Drosophila Stock Center | RRID:BDSC_38078 | FlyBase genotype: y1w*; Mi{MIC}VGlutMI04979 |
| Genetic reagent (D. melanogaster) | Gad1-Gal4 | Bloomington Drosophila Stock Center | RRID:BDSC_51630 | FlyBase genotype: P{Gad1-GAL4.3.098}2/CyO |
| Genetic reagent (D. melanogaster) | Cha-Gal4 | Bloomington Drosophila Stock Center | RRID:BDSC_6793 | FlyBase genotype: w*; P{ChAT-GAL4.7.4}19B P{UAS-GFP.S65T}Myo31DFT2 |
| Genetic reagent (D. melanogaster) | R56F03-Gal4 | Bloomington Drosophila Stock Center | RRID:BDSC_39157 | FlyBase genotype: w[1118]; P{y[+t7.7] w[+mC]=GMR56 F03-GAL4}attP2 |
| Genetic reagent (D. melanogaster) | AANAT1lo | Bloomington Drosophila Stock Center | RRID:BDSC_3193 | FlyBase genotype: bw[1] AANAT1[lo] |
| Genetic reagent (D. melanogaster) | Df(2R)BSC356 | Bloomington Drosophila Stock Center | RRID:BDSC_24380 | FlyBase genotype: w[1118]; Df(2R)BSC356/SM6a |
| Genetic reagent (D. melanogaster) | In(2LR)Px4 | Bloomington Drosophila Stock Center | RRID:BDSC_1473 | FlyBase genotype: In(2LR)Px[4], dpy[ov1] b[1]/CyO |
| Genetic reagent (D. melanogaster) | tubGal80ts | Bloomington Drosophila Stock Center | RRID:BDSC_7018 | FlyBase genotype: w[*]; sna[Sco]/CyO; P{w[+mC]=tubP-GAL80[ts]}ncd[GAL80ts-7] |
| Genetic reagent (D. melanogaster) | UAS-HMS01617 | Bloomington Drosophila Stock Center | RRID:BDSC_36726 | FlyBase genotype: y[1] sc[*] v[1] sev[21]; P{y[+t7.7] v[+t1.8]=TRiP.HMS01617}attP40/CyO |
| Genetic reagent (D. melanogaster) | UAS-JF02142 | Bloomington Drosophila Stock Center | RRID:BDSC_26243 | FlyBase genotype: y[1] v[1]; P{y[+t7.7] v[+t1.8]=TRiP.JF02142}attP2 |
| Genetic reagent (D. melanogaster) | MCFO | Bloomington Drosophila Stock Center | RRID:BDSC_64085 | FlyBase genotype: FlpG5.Pest; 10xUAS(FRT-stop)myr::smGdP-HA, 10xUAS(FRT-stop)myr::smGdP-V5-THS-10xUAS(FRT-stop)myr::smGdP-FLAG |
| Genetic reagent (D. melanogaster) | Alrm-Gal4 | Marc Freeman | ||
| Genetic reagent (D. melanogaster) | Eaat1-Gal4 | Marc Freeman | ||
| Genetic reagent (D. melanogaster) | nSyb-Gal4 | Julie Simpson, Stefan Thor | ||
| Genetic reagent (D. melanogaster) | UAS-AANAT1 | This paper | See Materials and methods: Fly stocks | |
| Cell lines (Escherichia coli) | GH12636 | Drosophila Genomic Research Centre | FBcl0129063 | |
| Cell lines (Escherichia coli) | pJFRC-MUH | Addgene | RRID:Addgene_26213 | |
| Antibody | AANAT1 (Rabbit polyclonal) | MEDIMABS, Montreal | This paper | IHC(1:2000), WB (1:2500). See Materials and methods: Generation of AANAT1 antibody |
| Antibody | Elav (Rat monoclonal) | Developmental Studies Hybridoma Bank | Elav-7E8A10 | IHC(1:100) |
| Antibody | Repo (Mouse monoclonal) | Developmental Studies Hybridoma Bank | 8D12 | IHC(1:50) |
| Antibody | Brp (Mouse monoclonal) | Developmental Studies Hybridoma Bank | nc82 | IHC(1:50) |
| Antibody | GFP (Mouse monoclonal) | Clontech | #632381 | IHC(1:200) |
| Antibody | Ebony (Rabbit polyclonal) | Sean Carroll | WB (1:3000) | |
| Antibody | Actin (Mouse monoclonal) | Sigma | #A4700 | WB (1:3000) |
| Commercial assay or kit | HyGLO Chemiluminescent HRP Antibody Detection Reagent | Denville Scientific | ||
| Chemical compound, drug | Formic acid | Fisher scientific | ||
| Software, algorithm | Graphpad Prism 6 | RRID:SCR_002798 | ||
| Software, algorithm | Fiji | RRID:SCR_002285 |
Additional files
Download links
A two-part list of links to download the article, or parts of the article, in various formats.
Downloads (link to download the article as PDF)
Open citations (links to open the citations from this article in various online reference manager services)
Cite this article (links to download the citations from this article in formats compatible with various reference manager tools)
AANAT1 functions in astrocytes to regulate sleep homeostasis
eLife 9:e53994.
https://doi.org/10.7554/eLife.53994


