Regulation of nerve growth and patterning by cell surface protein disulphide isomerase
- Department of Physiology, Development and Neuroscience, University of Cambridge, United Kingdom
- Grenoble Institute des Neurosciences, France
- Independent researcher, United Kingdom
- Exeter College, United Kingdom
- School of Clinical Medicine, Cambridge University Hospitals, United Kingdom
- Winter, Brandl, Fürniss, Hübner, Röss, Kaiser & Polte, Partnerschaft mbB, Patent und Rechtsanwaltskanzlei, Germany
- School of Medicine and Health Sciences, Monash University, Malaysia
- School of Medicine, Medical Science and Nutrition, University of Aberdeen, United Kingdom
- Cambridge Innovation Capital, United Kingdom
- University of Exeter Medical School, United Kingdom
Figures
Figure 1 with 1 supplement
Identification of csPDI in somites.
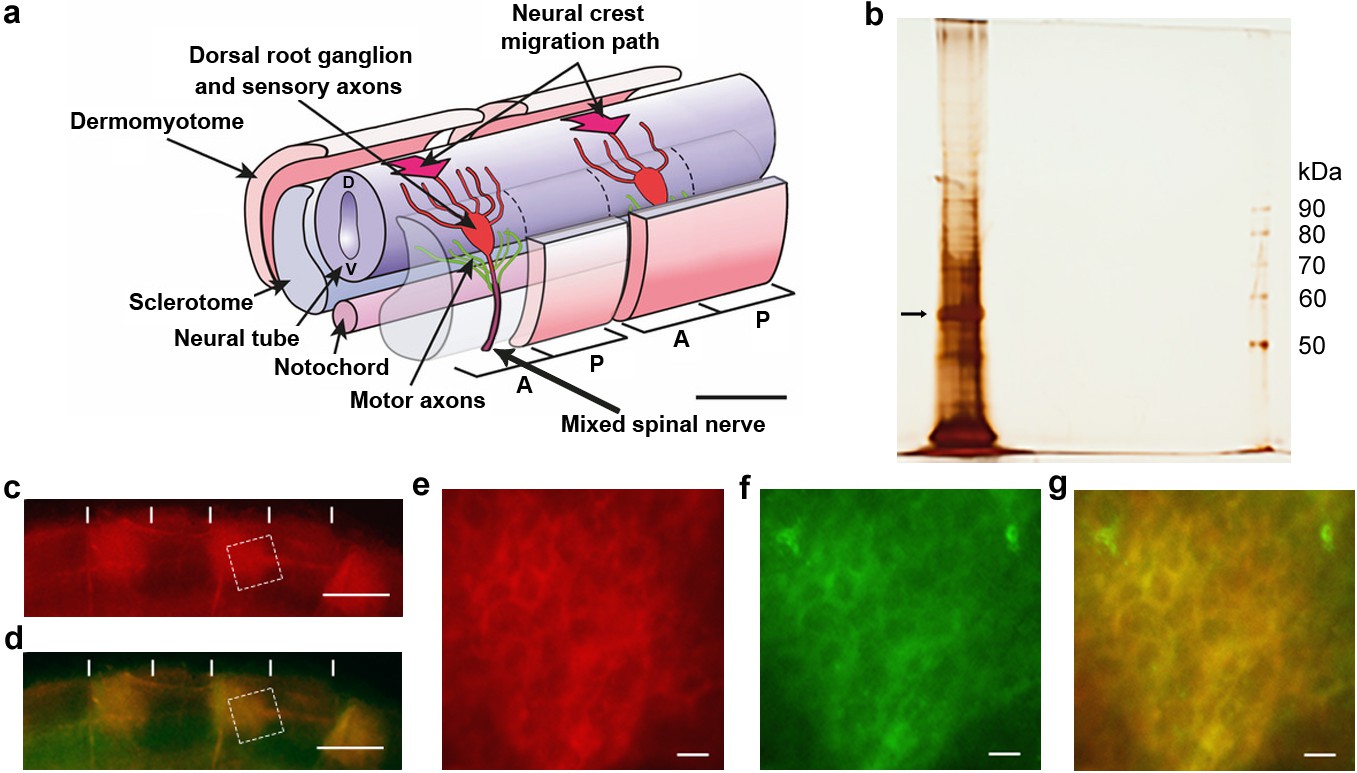
(a) Schematic diagram of two spinal nerve segments in the early embryo of birds and mammals. The neural tube (future spinal cord) extends longitudinally, overlying the midline notochord (future intervertebral discs); anterior/A (cranial/rostral) to the left and posterior/P (caudal) to the right. Two somites are shown, each sub-divided into 2 main components - the dermomyotome (future dermis and skeletal muscle) and sclerotome (future vertebral cartilage and bone). The sclerotome of each somite is further subdivided longitudinally into A- and P-halves (dashed lines), and the early components of the peripheral nervous system develop within the mesenchyme of each successive A-half-sclerotome. Here, motor axons (green) extend from cell bodies in the ventral (V) neural tube, and sensory axons (red) extend from cell bodies that coalesce to form the dorsal root ganglion (DRG). The DRGs derive from neural crest cells that earlier migrated into the A-half-sclerotomes (thick arrows) from the dorsal neural tube (D). Each DRG cell body generates one axon that grows dorsally to enter the neural tube and one that grows ventrally to join the motor axons; together with preganglionic autonomic axons (not shown), these motor and sensory axons form the 'mixed' spinal nerves that will innervate the body at each segmental level. Scale bar 50 μM. Adapted from Kuan et al., 2004. (b) Silver-stained SDS-PAGE of lactose eluate of chick somite proteins bound to PNA-agarose; arrow indicates the major band of 57 kDa. (c, d) Somite strip live-stained with rhodamine-PNA (red, (b) and co-stained with fluorescein-conjugated anti-PDI; preferential staining of three P-half-sclerotomes is shown; PNA staining and anti-PDI staining are co-localized (yellow, (c); vertical white lines indicate half-somite boundaries; Scale bars 50 μM. (e-g), Higher magnification of boxed regions in c and d showing ring staining at the cell periphery by rhodamine-PNA (d) and by fluorescein-conjugated anti-PDI (e), and their co-localisation (yellow, (f). Scale bars 5 μM.
Figure 1—figure supplement 1
Further characterisation of csPDI in somites.
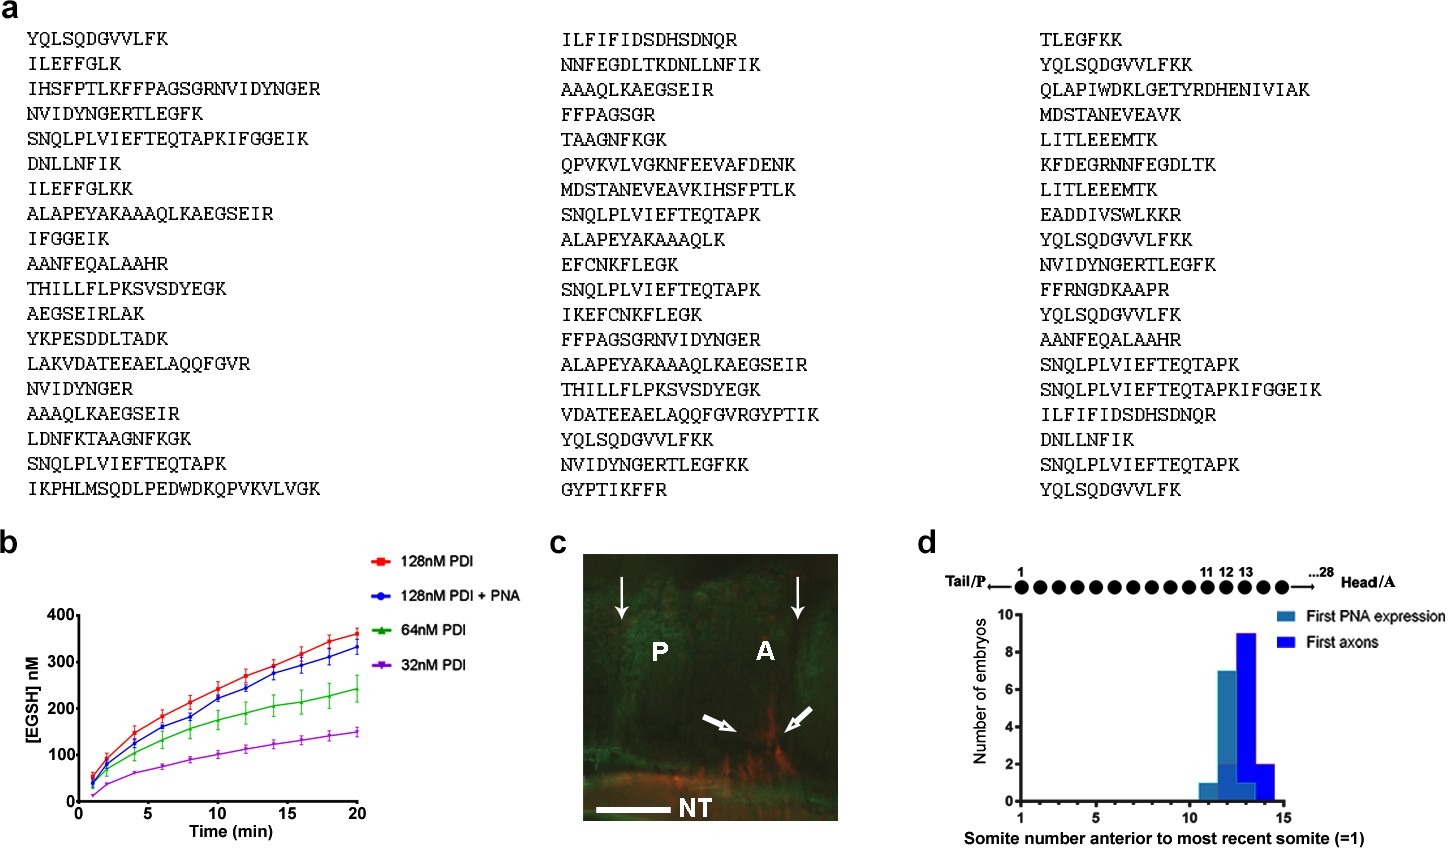
(a) Identification of csPDI in somites by mass spectrometry. The major band seen in Figure 1a (arrow) was carefully excised and dispatched to Alta Bioscience (UK) for tryptic digestion and examination by mass spectrometry. The 57-peptide tryptic digest amino acid sequences correspond to chicken PDI, subtype PDIA1 or P4HB. (b) Reductase activity in purified PDI. Three concentrations of purified PDI (Sigma-Aldrich; 128 nM, 64 nM, 32 nM) were examined for reductase activity using dieosin glutathione disulphide (Di-E-GSSG). Two-way analysis of variance and multiple comparisons using the Bonferroni test showed no significant difference between the upper curves (blue and red; Supplementary file 1). This is in accord with the carbohydrate composition of this enzyme preparation. Bovine liver PDI is a glycoprotein with 12% by weight of carbohydrate; L-fucose and N-acetylgalactosamine are not present in detectable quantities (Carmichael et al., 1977). The lack of the latter sugar indicates that O-glycosylation is not a feature of this liver enzyme. (c) Onset of csPDI expression in somites. A parasagittal section (10 μM) showing a somite with its A- and P-halves flanked on each side by adjacent half-somites, stained for csPDI using fluorescein-conjugated PNA (green), and for the first emerging spinal axons (red, thick arrows) using TUJ1 antibody; thin arrows indicate the somite boundaries; axons emerge from the neural tube in the A-half of the somite (A), and PNA-staining is visible in the P-half (P). NT, neural tube. Scale bar 40 μM. (d) Onset of csPDI expression in 11 stage 16/17 chick embryos (26–32 somites), assessed using 10 μM parasagittal sections of somites stained with fluorescein-conjugated PNA; the X-axis and upper schematic diagram show the somite positions (11, 12, 13) where PNA-staining was first detected in individual embryos, counting somites in a P-A (left-right) direction (most recently formed somite = 1). The first emerging spinal axons (stained using TUJ1 antibody) either coincided with the onset of PNA staining (1/11 embryos), or were delayed by the time taken to form one more somite (9/11 embryos) or two more somites (1/11 embryos). Since each somite takes ~90 min to form, csPDI expression precedes axon outgrowth in each segment by ~90–180 min.
Figure 2 with 1 supplement
csPDI mediates nerve patterning in vivo.
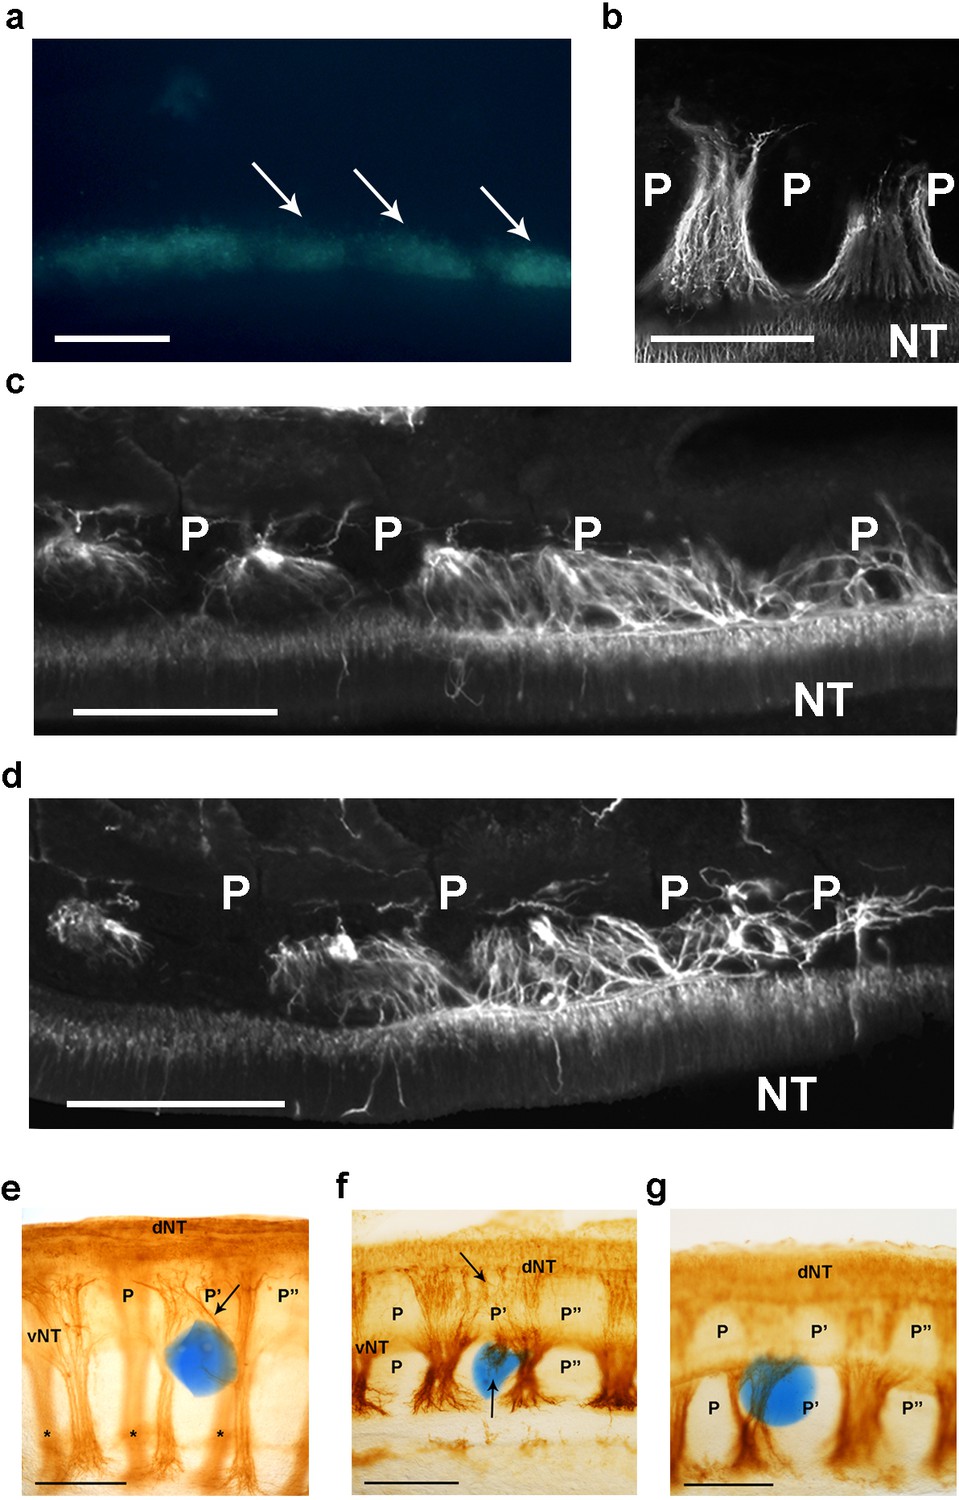
(a) Image of a live embryo in ovo, viewed from above, taken 24 hr after injection of fluorescein-labelled siRNA into somites (arrows) on one side; label is distributed throughout the A- and P-half-sclerotomes of each somite, and is visibly diminished, as expected, at 3 consecutive somite boundaries. Scale bar 100 μM. (b) Representative image of normal motor axon segmentation following scrambled siRNA delivery. Longitudinal section stained using fluorescein-conjugated TUJ1 antibody. Scale bar 100 μM. (c, d) Loss of axon segmentation in two embryos after PDI siRNA knockdown. The siRNA-treated side of each embryo is shown; axons are segmented normally (left) but this is disrupted (right) where axons grow into P-half-sclerotomes (P). NT, neural tube. Scale bars 100 μM. (e, f) Loss of axon segmentation in embryos after in ovo implantation of PACMA 31-impregnated bead (blue); embryos were stained using HRP-labelled TUJ1 antibody and viewed as whole-mounts (e) or as implanted-side-only half-mounts (f); abnormal growth of sensory axons (arrow, e; upper arrow, f) towards dorsal neural tube (dNT) in P-half-sclerotome (P’), compared with normal projections avoiding two adjacent P-half-sclerotomes (P, P’’); lower arrow (f) indicates motor axons sprouting from ventral neural tube (vNT) into P-half-sclerotome; asterisks, spinal axons on opposite side of whole-mount (e). Scale bars 150 μM. (g) Normal segmentation of dorsal/sensory axons and ventral/motor axons after implantation of PACMA 56 bead; P, P’, P’’, dorsal and ventral domains of 3 consecutive P-half-sclerotomes. Scale bar 150 μM.
Figure 2—figure supplement 1
Phenotypic rescue of siRNA knockdown and effect of inhibiting csPDI using PACMA 31.
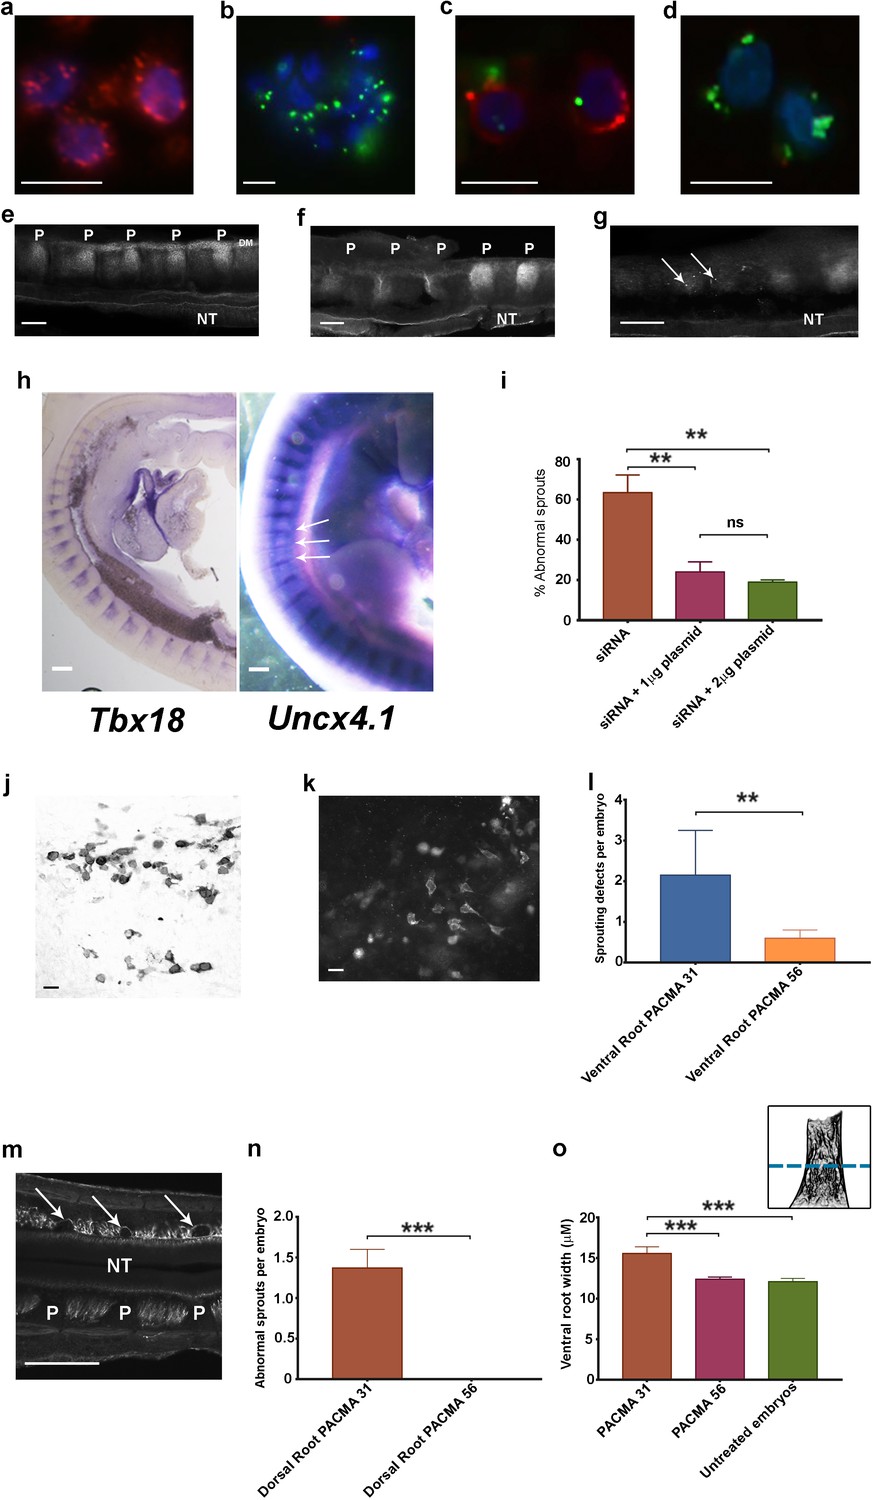
(a) Chick retinal cells after transfection with scrambled siRNA, stained with anti-PDI antibody (red) and the nuclear marker DAPI (blue). Scale bar 10 μM. (b) Stained as in a, after PDI knockdown using FITC-siRNA (green). Scale bar 10 μM. (c, d) P-half-sclerotome cells showing PDI expression (red) after transfection with scrambled FITC-siRNA (green) (c), and loss of PDI expression after knockdown with FITC-siRNA (green; d). Scale bar 10 μM. (e) Somite strip after injection of control scrambled siRNA, showing normal PNA expression in 5 P-half-sclerotomes along the A-P axis. P-half-sclerotome, P; Dermomyotome, DM; neural tube, NT. Scale bar 50 μM. (f, g) Somite strips stained for PNA after siRNA PDI knockdown. f, loss of PNA staining in three consecutive P-half-somites (left) compared with two normally stained P-half-somites (right); P, P-half-sclerotome; g, loss of PNA staining in two segments with residual spots of FITC-siRNA expression (arrows). Scale bars 50 μM. (h) Left, sagittal section of a stage 22 siRNA-transfected embryo, hybridized with a Tbx18 probe; regional expression in A-half-somites is unaltered. Scale bar 100 μM. Right, stage 22 PDI-siRNA transfected whole-mounted embryo, hybridized with an Uncx4.1 probe, showing diminished expression in 3 P-half-sclerotomes (arrows). Scale bar 100 μM. (i) Rescue of siRNA-induced ventral root/motor axon phenotype by co-injection in ovo of siRNA with PDI-expressing plasmid (1 μg or 2 μg as indicated). For each histogram bar, 10 consecutive somites in the injected region of each embryo were assessed (observer-blind to treatment condition) for the presence or absence of motor axons projecting abnormally into P-half-somite, using anti-TUJ1-HRP-stained whole-mounted embryos. (j) Sclerotome cells stained with HRP-labelled anti-PDI antibody in a whole-mounted embryo that received co-injected siRNA and plasmid (1 μg). Scale bar 5 μM. (k) Sclerotome cells stained with fluorescein-conjugated anti-FLAG-M1 antibody in a whole-mounted embryo that received co-injected siRNA and plasmid (1 μg). Scale bar 5 μM. l, PACMA 31 (200μM administered by direct injection to somites on one side in ovo) caused a significant increase in aberrant motor/ventral root axon sprouting compared with PACMA 56 injection. (m) PACMA 31 (200μM by direct injection in ovo) resulted in dorsal 'bridges' of sensory axons (arrows) interconnecting adjacent axon bundles, contrasting with the normal dorsal/sensory axon segmentation on the non-injected side (NT, neural tube; P, P-half-sclerotome). Scale bar 100 μM. (n) PACMA 31 (200μM by direct injection in ovo) showing the incidence of dorsal bridges of sensory axons in PACMA 31-injected embryos compared with their absence in PACMA 56-injected embryos (P56). (o) Assessment of ventral root A-P width after PACMA injection (200 μM) into somites in ovo. Sections of stage-21 TUJ1-stained embryos were blind-coded and assessed by fluorescence microscopy. Images were taken with QCapture Pro 6.0 and analyzed with ImageJ, measuring the A-P width of the ventral root at the most proximal position where constituent motor axons align in parallel (schematic inset upper right, above dashed line); n = 12 embryos (PACMA31), n = 9 embryos (PACMA56), n = 10 embryos (untreated).
Figure 3 with 1 supplement
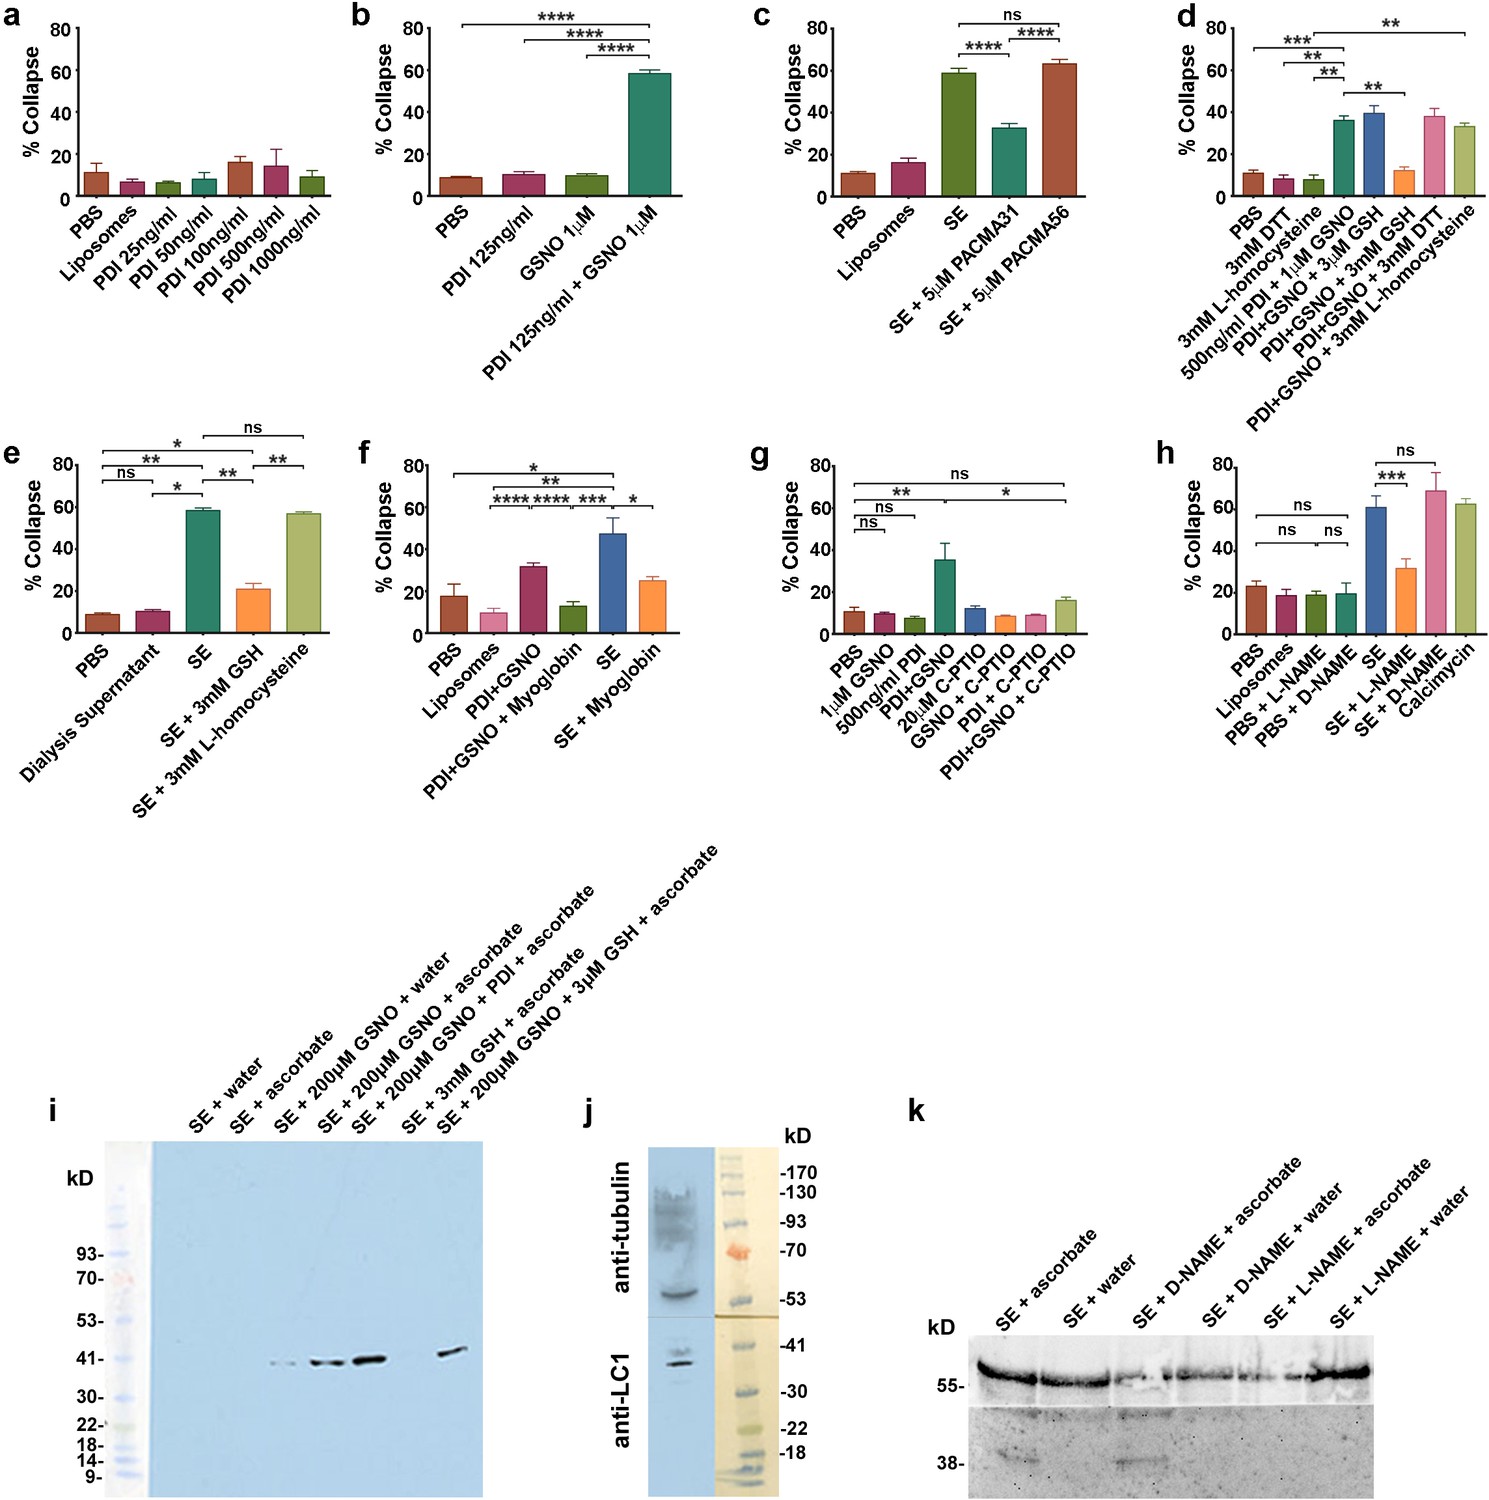
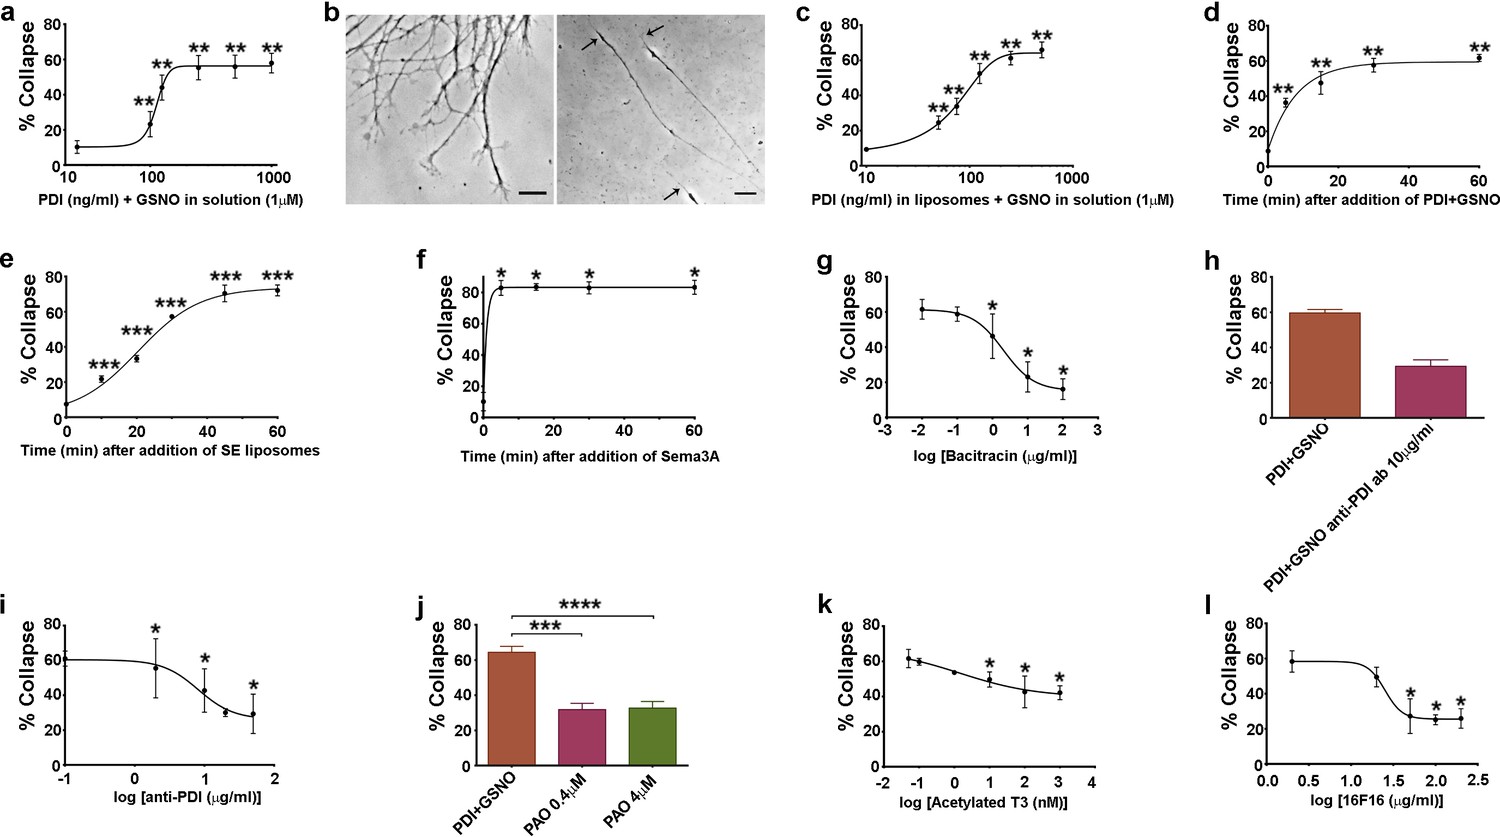
csPDI mediates axon repulsion in vitro.
(a) Collapse assays testing purified bovine PDI in liposomes at a range of concentrations; controls, phosphate-buffered saline (PBS) and untreated liposomes; histogram shows mean + s.e.m. (b) Assays testing PDI and GSNO applied individually or concomitantly. (c) Assays testing PACMA31 and PACMA56 on somite extracts (SE). (d) Assays testing reducing agents at the concentrations indicated when applied either alone or together with PDI+GSNO. (e) Assays testing GSH and L-homocysteine on SE-induced collapse. (f) Assays testing myoglobin (20 μM) on SE- and PDI+GSNO-induced collapse. (g) Assays testing carboxy (C)-PTIO (20 μM) on PDI+GSNO-induced collapse. (h) Assays testing L-NAME and its control D-NAME on SE-induced collapse; calcimycin was used as a positive control. (i) S-nitrosylated protein (iodo-TMT-labelled) in somites; protein samples (48 μg) from somite cell-free extracts were fractionated on NuPAGE 4–12% Bis Tris gels as described in the Methods; lanes 1 and 2 are controls consisting of somite proteins only, with no detectable signal compared with lanes 3 and 4 where GSNO has been added; lane 3 is a control (treated with water) showing negligible iodoTMT labelling, and lane 4 (reduced with ascorbate to generate a new free thiol for labelling) shows increased label; lane 5 shows that addition of PDI (1 μg/0.1 ml reaction mixture) enhances labelling; lane 6 shows that 3 mM GSH in the absence of GSNO and PDI does not generate a signal; lane 7 shows that 3 μM GSH is insufficient to interfere with nitrosylation, concurring with the findings of Sliskovic et al., 2005. The coloured molecular weight markers on the blot are shown on the left (BLUeye prestained protein ladder, 2.5 μL, Geneflow). (j) Identification of LC1 in somite extract (25 μg protein); the blot was cut in half above the 41K marker and the top half of the membrane was probed with rabbit anti-tubulin followed by goat anti-rabbit IgG; the bottom half was probed with mouse monoclonal antibody against amino acids 2257–2357 of mouse MAP-1B (LC1) followed by goat anti-mouse IgG. The molecular weight markers on the blot are shown to the right (BLUeye prestained protein ladder, 3 μl). (k) Identification of LC1 as a substrate for S-nitrosylation; cell-free somite extract (200 μg) was treated with D-NAME or L-NAME, followed by further incubation in GSNO (200 μM), as described in the Methods. Samples were then processed for the presence of S-nitrosylated proteins using iodo-TMT as described in the Methods. Protein samples (15 μg) were then fractionated and blotted, after which the blot was cut as described for (j). The top half was treated with anti-tubulin and the bottom half with anti-iodoTMT. L-NAME treatment blocked S-nitrosylation, as shown by the lack of iodoTMT labelling. The control D-NAME was without effect.
Figure 3—figure supplement 1
Additional characterisation of csPDI-mediated growth cone collapse.
(a-c) Comparison of collapse induced by PDI+GSNO either in solution (a,b) or in liposomes (c) when PDI is applied at a range of concentrations together with GSNO (1 μM). Panel b (left-half) shows the predominantly spread growth cones in an untreated/control culture, compared with a representative phase-contrast image of 3 collapsed growth cones (right-half, arrows) 1 hr after addition of PDI+GSNO in solution. Scale bars 15 μM. (d-f) Comparison of collapse time course after applying PDI (125 ng/ml) and GSNO (1 μM) in solution (d), after SE in liposomes (e), and after Sema3A (f). g-l, Assays testing purified bacitracin (g), anti-PDI neutralizing antibody (h,i), PAO (j), T3 (k) and 16F16 (l) on PDI+GSNO-induced collapse.
Figure 4 with 1 supplement
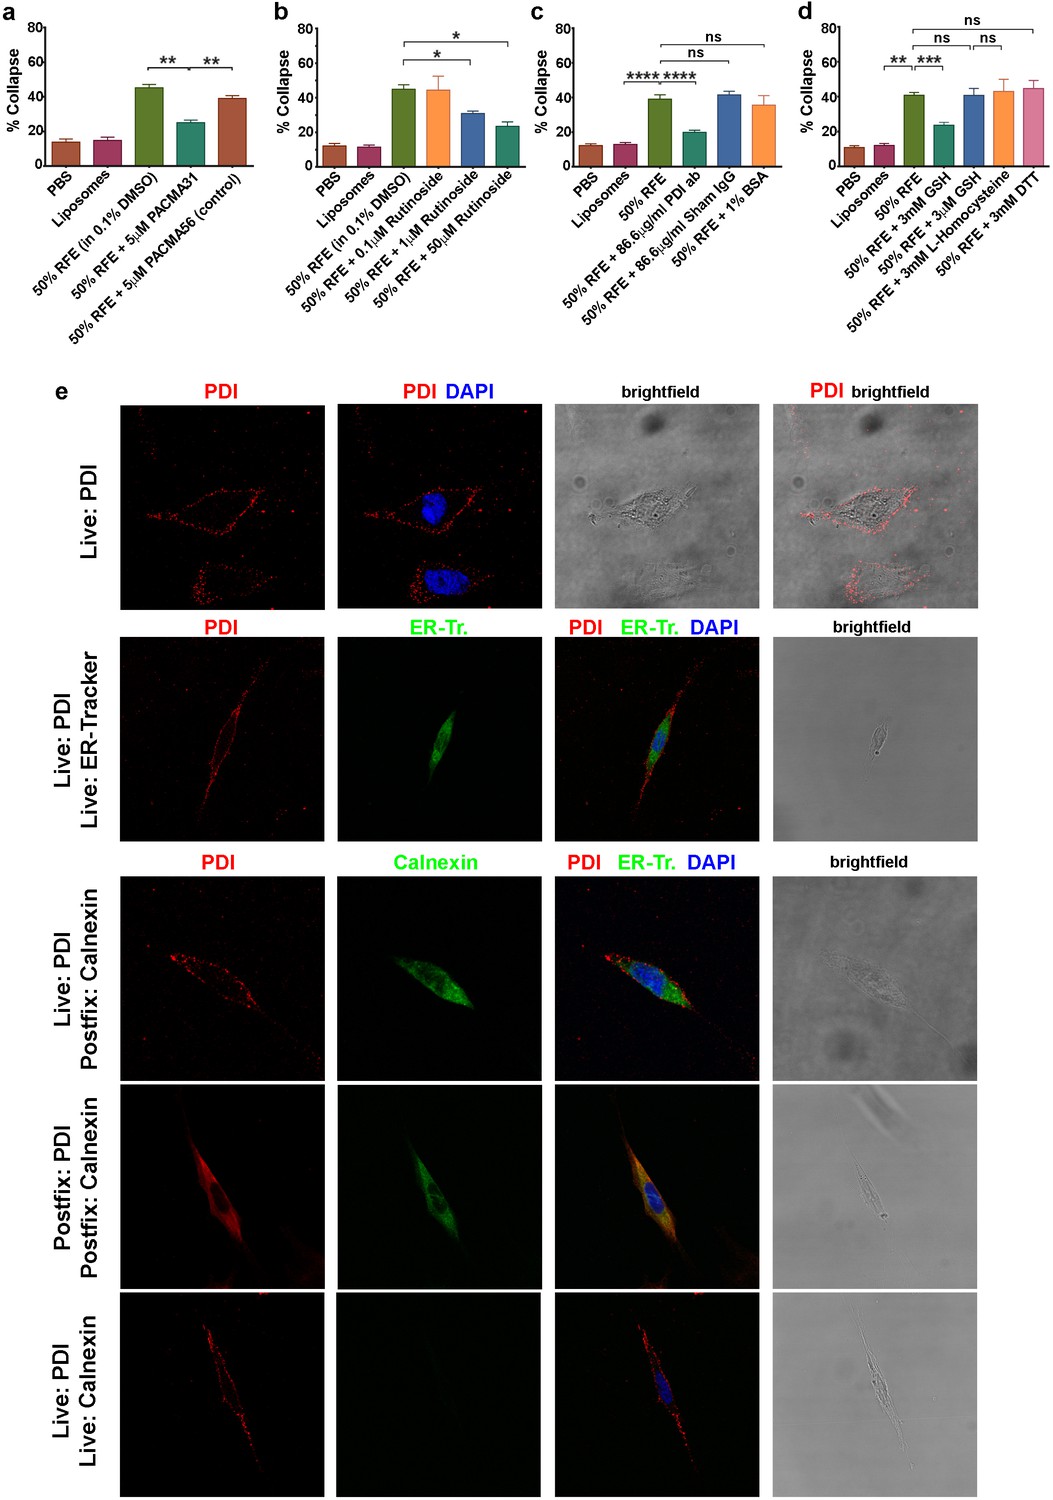
csPDI activity in mammalian forebrain.
(a-d) Collapse assays using PACMA 31 and PACMA 56 (a), quercetin-3-O-rutinoside (b), immunodepletion (c), and reducing agents (d). (e) Immunocytochemistry on live human astrocytic (1718) cells. Scale bars 20 μM. Row 1, anti-PDI (red) shows PDI expression at the cell surface, DAPI-staining (blue) shows position of nucleus. Row 2, anti-PDI live staining at the cell surface (red) contrasts with selective staining of ER with ER-Tracker (green). Rows 3,4, fixation permits visualisation of ER-PDI using anti-calnexin (green), which is absent under live staining conditions (Row 5).
Figure 4—figure supplement 1
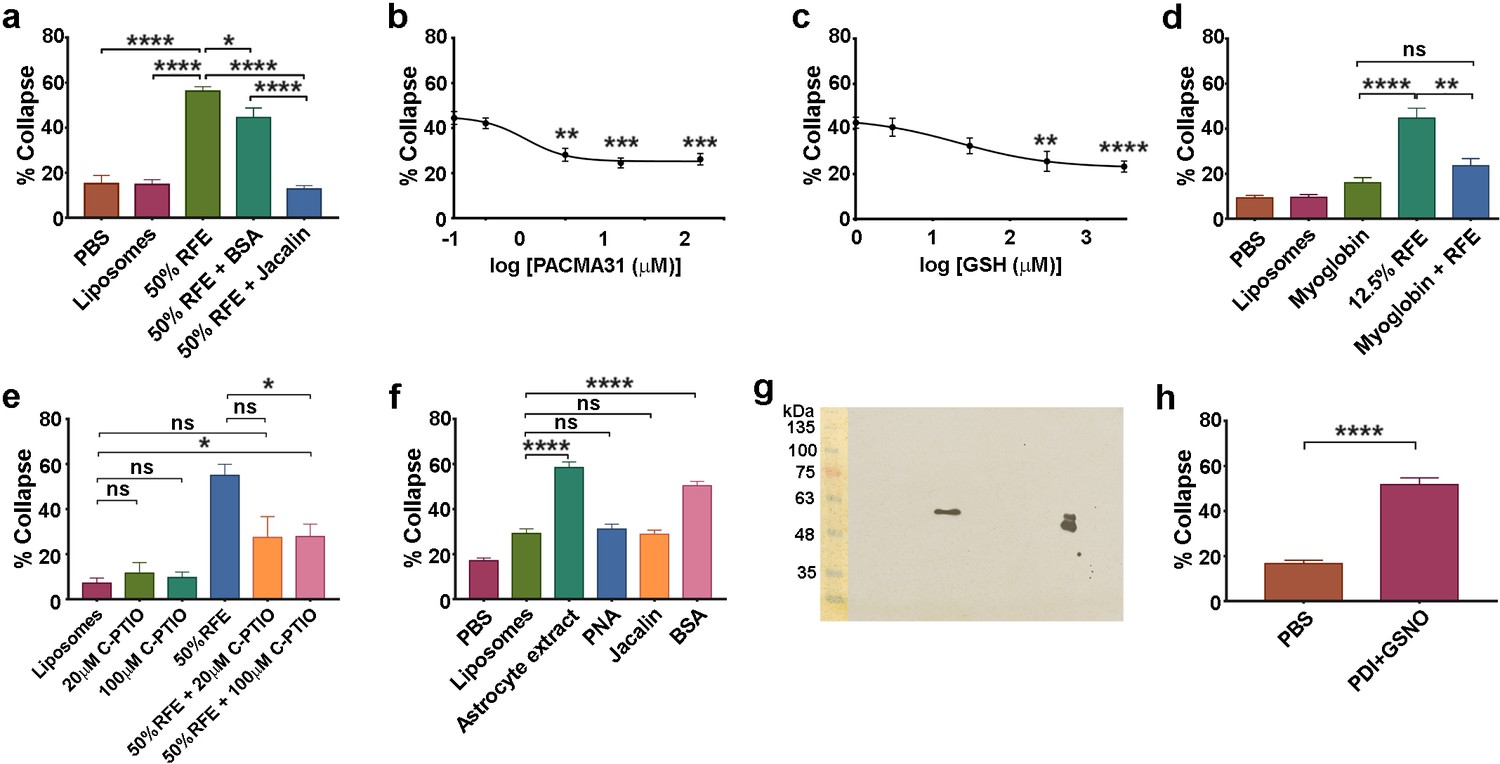
Action of lectins and other reagents on collapse activity in brain/astrocyte extracts and responsivity of retinal neurons.
(a ) Collapse assays showing depletion of collapse activity in rat forebrain extract (RFE) by use of immobilized jacalin; immobilized BSA was used as an additional control. (b) Collapse assays showing quantification of PACMA31 dose/response relationship. (c) Collapse assay and GSH titration. (d) Collapse assays testing the NO scavenger myoglobin (20 μM). (e) Collapse assays testing the NO scavenger C-PTIO. (f) Collapse assays using dialysed extracts from human 1718 astrocytic cells, testing activity before and after depletion by immobilized PNA and jacalin; immobilized BSA was used as an additional control. (g) Western blot of rat cortical astrocyte cell surface preparation using anti-PDI antibody, showing one band at 57 KDa in the centre of the blot. The doublet (right) is control purified bovine PDI (500 ng), and the lower band indicates that this control sample was partially oxidised. Molecular weight markers (10 μl; BLUeye Prestained Wide Range Protein ladder, Geneflow) are shown (left), transferred from the gel to the blot. (h) Collapse assays testing reactivity of chick retinal axon growth cones to PDI+GSNO.
Figure 5

Schematic diagram of the proposed action of csPDI in mediating growth cone repulsion by NO.
1. A filopodium (blue) contacts a sclerotome cell in the posterior/P-half-somite, where it encounters csPDI, leading to the denitrosylation of a NO-donor molecule, for example GSNO. This reaction can be blocked by PACMA 31, so preventing collapse. 2. NO (which is known to cross cell membranes) is transferred into the filopodium as a result, where it may additionally regulate nNOS activity (Benhar et al., 2009). 3. As shown by Stroissnigg et al., 2007., nNOS activation causes nitrosylation of cysteine 2457 in the COOH terminus of the MAP1B light chain LC1. They propose that the resulting conformational change in LC1 enhances MAP1B/microtubule binding, which in turn blocks activity of the anchored motor protein dynein. Dynein normally provides a tubulin/minus-end-directed motor activity via its motor domains (filled green circles) that drives axon extension through interaction with microtubules. This is counteracted by a retraction force due to cortical actin/myosin, so that dynein blockade converts filopodial extension to filopodial retraction/repulsion (large red arrow). MT, microtubule-binding domain of MAP1B/LC1; C, COOH terminus of LC1. The lower part of this diagram is adapted from the scheme of Stroissnigg et al., 2007.
Tables
Key resources table
| Reagent type (species) or resource | Designation | Source or reference | Identifiers | Additional information |
|---|---|---|---|---|
| Cell line (Homo-sapiens) | Human astrocytoma- derived 1718 cells | ATCC | RRID:CVCL_1118 | authentication by STR profiling mycoplasma contamination not tested (used directly from ATCC) |
| Transfected construct (Gallus gallus) | siRNA to 3'UTR of chick P4HB/PDIA1 | This paper | siRNA | TCGCCCTCACTTGTCTTTA |
| Transfected construct (Gallus gallus) | scrambled siRNA | This paper | siRNA | GCTCTCTCGTCTATCTACT |
| Biological sample (Gallus gallus) | somite extract | This paper | Freshly isolated from Gallus gallus | |
| Biological sample (Rattus norvegicus domestica) | rat forebrain extract | This paper | Freshly isolated from Rattus norvegicus domestica | |
| Antibody | Mouse IgG2a anti-tubulin β3 (mouse monoclonal) | BioLegend | clone TUJ1 RRID:AB_2315519 | (1:500) |
| Antibody | anti-PDI (rabbit polyclonal) | Sigma-Aldrich | Cat# P7496 | (1:250 live staining) (1:500 post-fixation staining) (1:20,000 western blot) |
| Antibody | anti-calnexin mouse IgG2b (mouse monoclonal) | Abcam | clone 6F12BE10 RRID:AB_10860712 | (1:100 live staining) (1:200 post-fixation staining) |
| Antibody | Alexa Fluor 488 Goat anti-Mouse IgG1 (goat polyclonal) | Invitrogen | A-21121 RRID:AB_2535764 | 1:500 |
| Antibody | Alexa Fluor 594 Goat anti-Mouse IgG2a (goat polyclonal) | Invitrogen | A-21135 | 1:500 |
| Antibody | Peroxidase-conjugated Goat anti-mouse IgG (goat polyclonal) | Jackson Immuno Research | 115-035-003 | 1:500 |
| Recombinant DNA reagent | plasmid encoding human PDIA1 (18–508) | Addgene | hPDI1_18–508_WT_pFLAG-CMV1 RRID:Addgene_31382 | Depositing lab: Prof David Ron University of Cambridge, UK |
| Sequence-based reagent | Uncx4.1 | This paper | primer synthesis | (forward) ATCGATGGATTACTGAGCGG (reverse) TAATACGACTCACTATAGGGAGGTTTAAGCAAACGGACGCTG |
| Sequence-based reagent | Tbx18 | This paper | primer synthesis | (forward) GTAATGCTGACTCCCCGGTA (reverse) TAATACGACTCACTATAGGGAGACTGGTTTGGTTTGTGAGCC |
| Sequence-based reagent | T7 promoter | Sigma-Aldrich | primer synthesis | TAATACGACTCACTATAGGGAG |
| Commercial assay or kit | In-Fusion HD Cloning | Clontech | 639647 | |
| Other | ER-TrackerGreen FL Glibenclamide | Thermo Fisher | E34251 |
Additional files
-
Supplementary file 1
Statistical data for Figure 1—figure supplement 1b–f; Figure 2b–g; Figure 2—figure supplement 1a–g,i,l,n,o; Figure 3a–h; Figure 3—figure supplement 1a–k; Figure 4a–e; Figure 4—figure supplement 1a–f,h.
- https://cdn.elifesciences.org/articles/54612/elife-54612-supp1-v3.xlsx
-
Transparent reporting form
- https://cdn.elifesciences.org/articles/54612/elife-54612-transrepform-v3.docx
Download links
A two-part list of links to download the article, or parts of the article, in various formats.
Downloads (link to download the article as PDF)
Open citations (links to open the citations from this article in various online reference manager services)
Cite this article (links to download the citations from this article in formats compatible with various reference manager tools)
Regulation of nerve growth and patterning by cell surface protein disulphide isomerase
eLife 9:e54612.
https://doi.org/10.7554/eLife.54612


