A single-cell survey of Drosophila blood
- Department of Genetics, Blavatnik Institute, Harvard Medical School, United States
- Department of Life Science, Hanyang University, Republic of Korea
- Harvard TH Chan Bioinformatics Core, United States
- Howard Hughes Medical Institute, United States
Figures
Figure 1 with 2 supplements
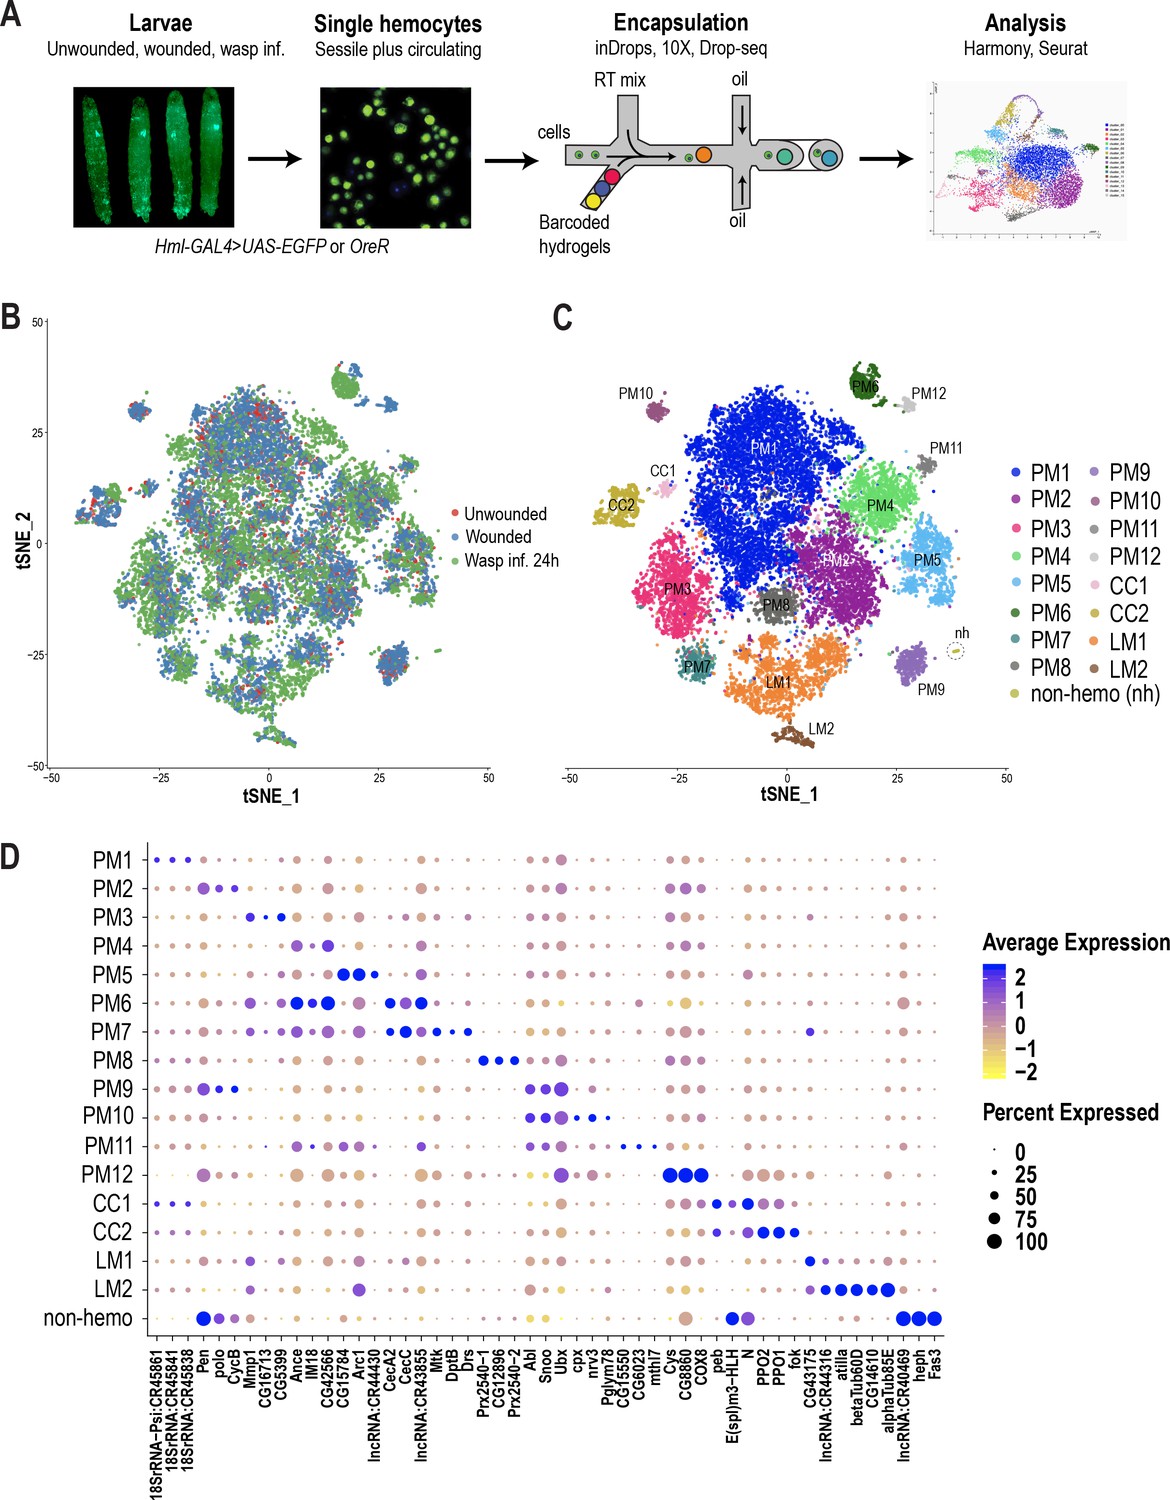
scRNA-seq of Drosophila hemocytes reveals subpopulations of plasmatocytes, crystal cells, and lamellocytes.
(A) Schematic of the microfluidics-based scRNA-seq workflow. (B) t-Distributed Stochastic Neighbor Embedding (t-SNE) plot of Harmony-based batch correction and integration of unwounded (red), wounded (blue), and wasp inf. 24 hr (green) data sets. (C) Clustering of batch corrected cells from all three conditions reveals a total of 17 clusters. (D) Dot plot representing the top three genes enriched per cluster based on average expression (avg_logFC). Color gradient of the dot represents the expression level, while the size represents percentage of cells expressing any gene per cluster.
Figure 1—figure supplement 1
scRNA-seq of Drosophila hemocytes reveals subpopulations of plasmatocytes, crystal cells, and lamellocytes.
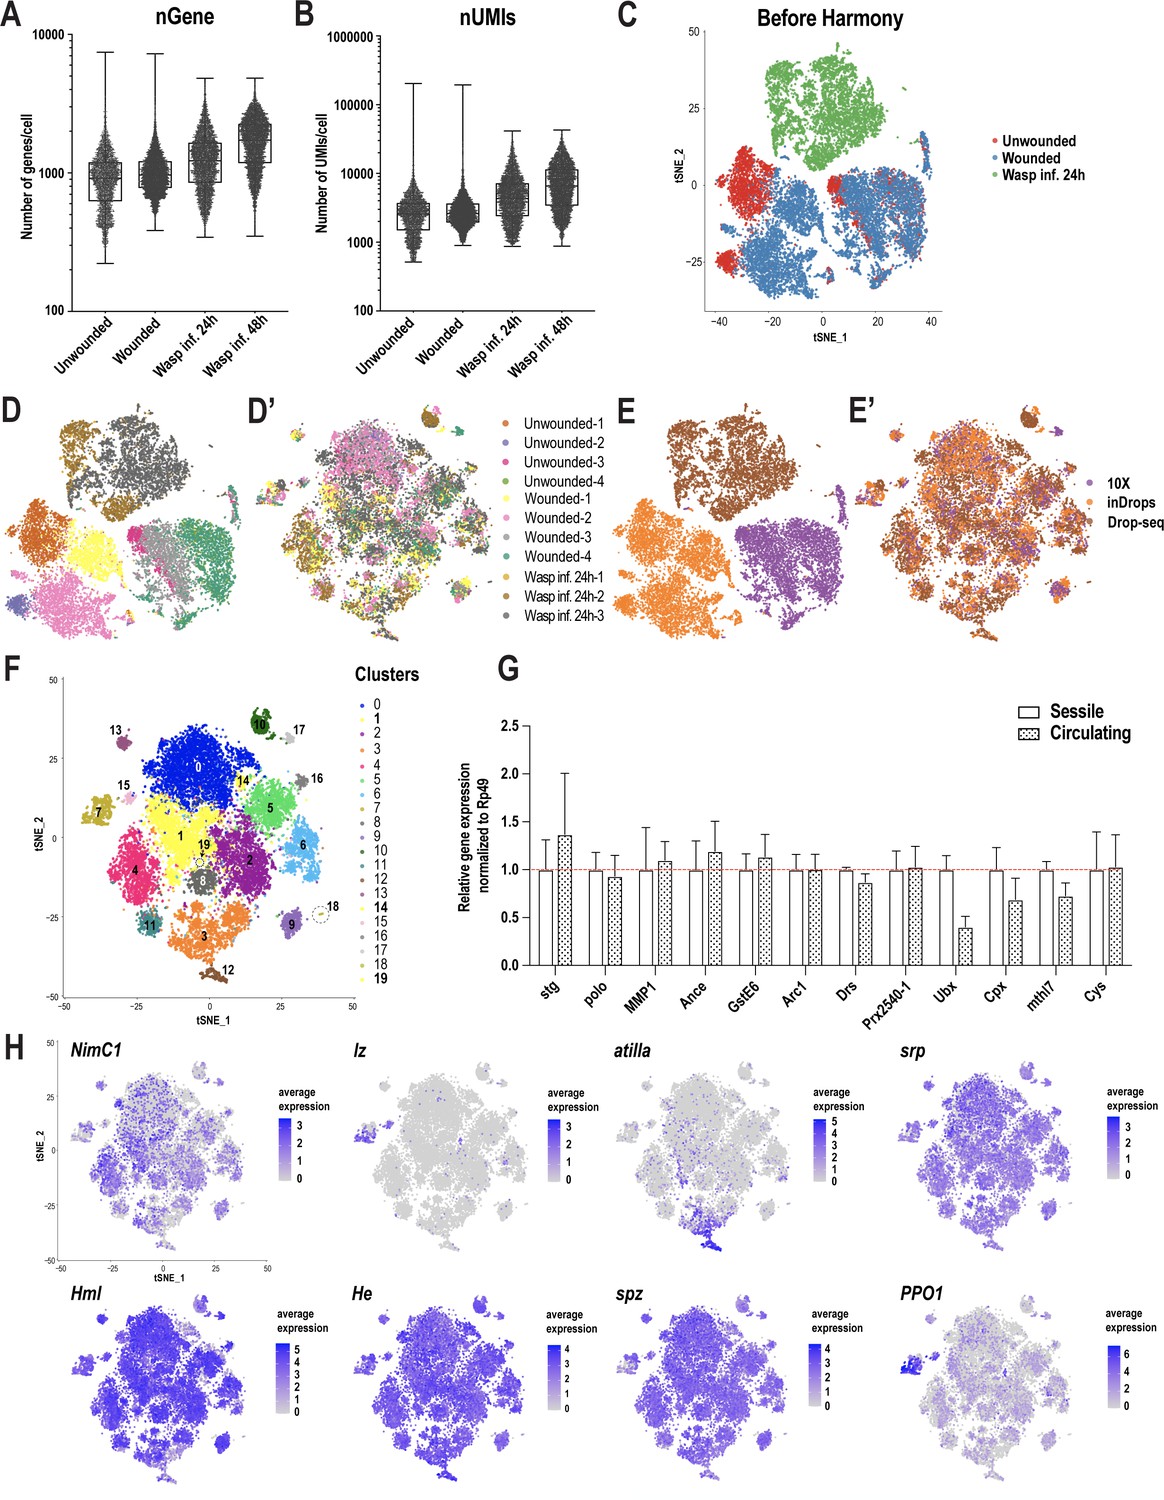
(A, B) Number of genes (nGene [A]) and number of unique molecular identifiers (nUMI [B]) detected per cell in unwounded controls (n = 4), wounded (n = 4), wasp infested (wasp inf., 24 hr, n = 3 and wasp inf. 48 hr, n = 3) conditions. (C) t-Distributed Stochastic Neighbor Embedding (t-SNE) plot of all the three conditions prior to Harmony-based batch correction and integration of unwounded controls (red), Wounded (blue), and Wasp inf. 24 hr (green) data sets revealed condition specific clusters. Each dot representing one cell is depicted in the t-SNE plot. (D, D’) t-SNE plots representing all the replicates across all conditions prior to (D) and after (D’) batch correction. (E, E’) t-SNE plots representing all the technologies prior to (E) and after (E’) batch correction. (F) t-SNE plot showing all 20 clusters prior to merging clusters 1, 14, and 19 (in yellow) with cluster 0 (see Merging of clusters in Materials and methods section for details). (G) Quantitative real time PCR (qRT-PCR) determines the expression patterns of plasmatocyte marker genes in hemocytes of sessile and circulating compartments in unwounded larvae. (H) t-SNE plots representing marker genes that are known to be expressed in hemocytes.
Figure 1—figure supplement 2
Quality of scRNA-seq data and development of Drosophila blood scRNA-seq portal.
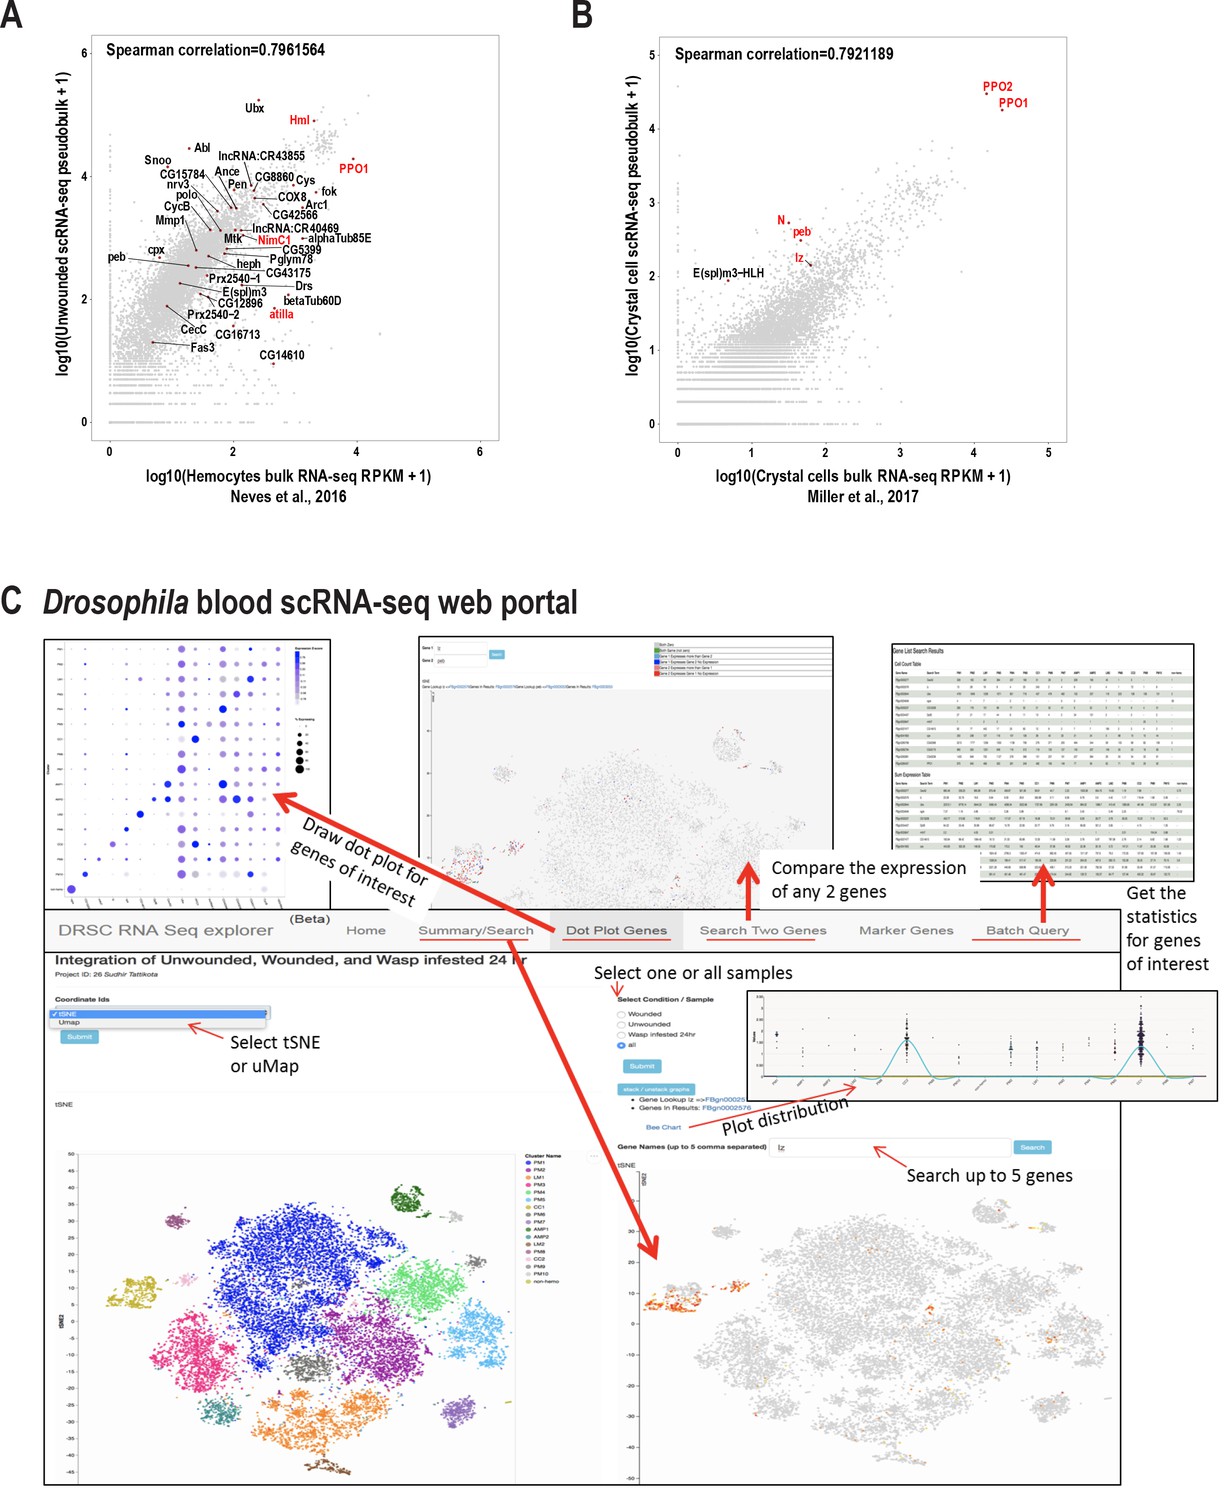
(A) Comparing pseudobulk scRNA-seq data of unwounded samples with published bulk RNA-seq data of control hemocytes from Hml-GAL4 >UAS EGFP larvae (Neves et al., 2016), reveals a strong correlation between the two data sets. Known marker genes are highlighted in red and some of the top genes per cluster are represented in the plot. (B) Comparing pseudobulk scRNA-seq data of crystal cells with published bulk RNA-seq data of wildtype Lz+crystal cells from lz-GAL4 >UAS EGFP larvae (Miller et al., 2017), reveals a strong correlation between the two data sets. Known marker genes of crystal cells are highlighted in red and the novel crystal cell enriched gene E(spl)m3-HLH is depicted in the plot. (C) Snapshot of the searchable Drosophila blood scRNA-seq web portal (https://www.flyrnai.org/scRNA/blood/). At the search page, users can search the expression of one gene or the accumulative expression up to 5 genes displayed on the map of choice (t-SNE or UMAP) as well as the sample of choice (unwounded, wounded, wasp infested or all samples together). Users can also view the expression pattern across all the clusters by various plots such as bar graph and violin plot. Users can draw the dot plot for any genes of interest at ‘Dot Plot Genes’ page and compare the expression of any 2 genes at ‘Search Two Genes’ page. The portal allows users to query the markers of any cell cluster of choice as well as getting cluster-based statistics (number of cells’ expression and sum of expression value) at ‘Batch Query’ page.
Figure 2 with 1 supplement
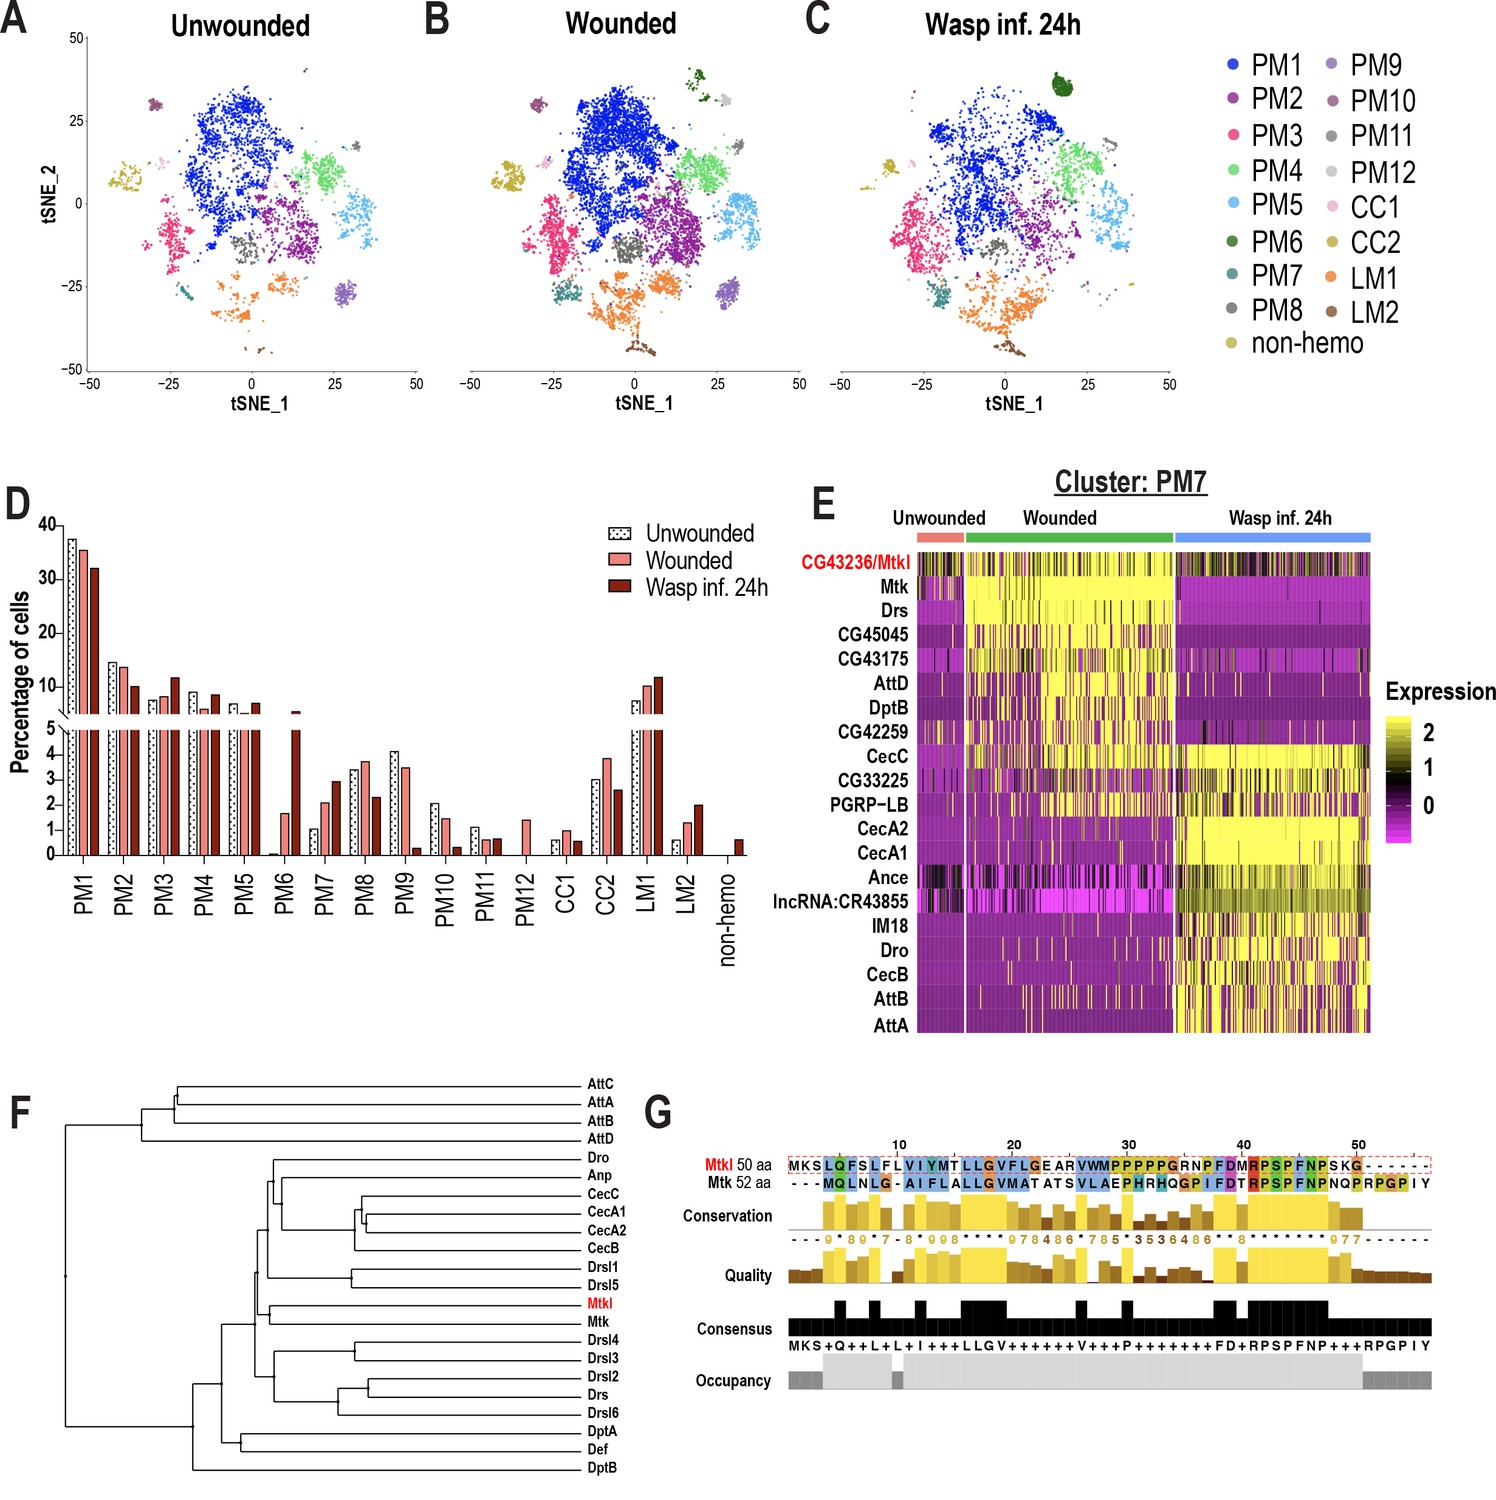
Changes in blood cell composition and identification of a novel Mtk-like AMP.
(A-C) t-SNE plots of (A) Unwounded, (B) Wounded, and (C) Wasp inf. 24 hr conditions. (D) Cell fraction changes in clusters based on treatment conditions. (E) Heat map profile of the top expressed genes in cluster PM7 identifies CG43236/Mtk-like (Mtkl). Genes were ranked based on expression levels in each condition in the heat map. (F) Phylogenetic tree map constructed with the peptide sequences of all known AMPs together with Mtkl. (G) Global alignment of Mtkl and Mtk peptide sequences using Jalview protein alignment software (Waterhouse et al., 2009).
-
Figure 2—source data 1
Source data pertaining to cell fraction bar graph of Figure 2D.
- https://cdn.elifesciences.org/articles/54818/elife-54818-fig2-data1-v2.xlsx
Figure 2—figure supplement 1
Changes in blood cell composition and identification of a novel Mtk-like AMP.
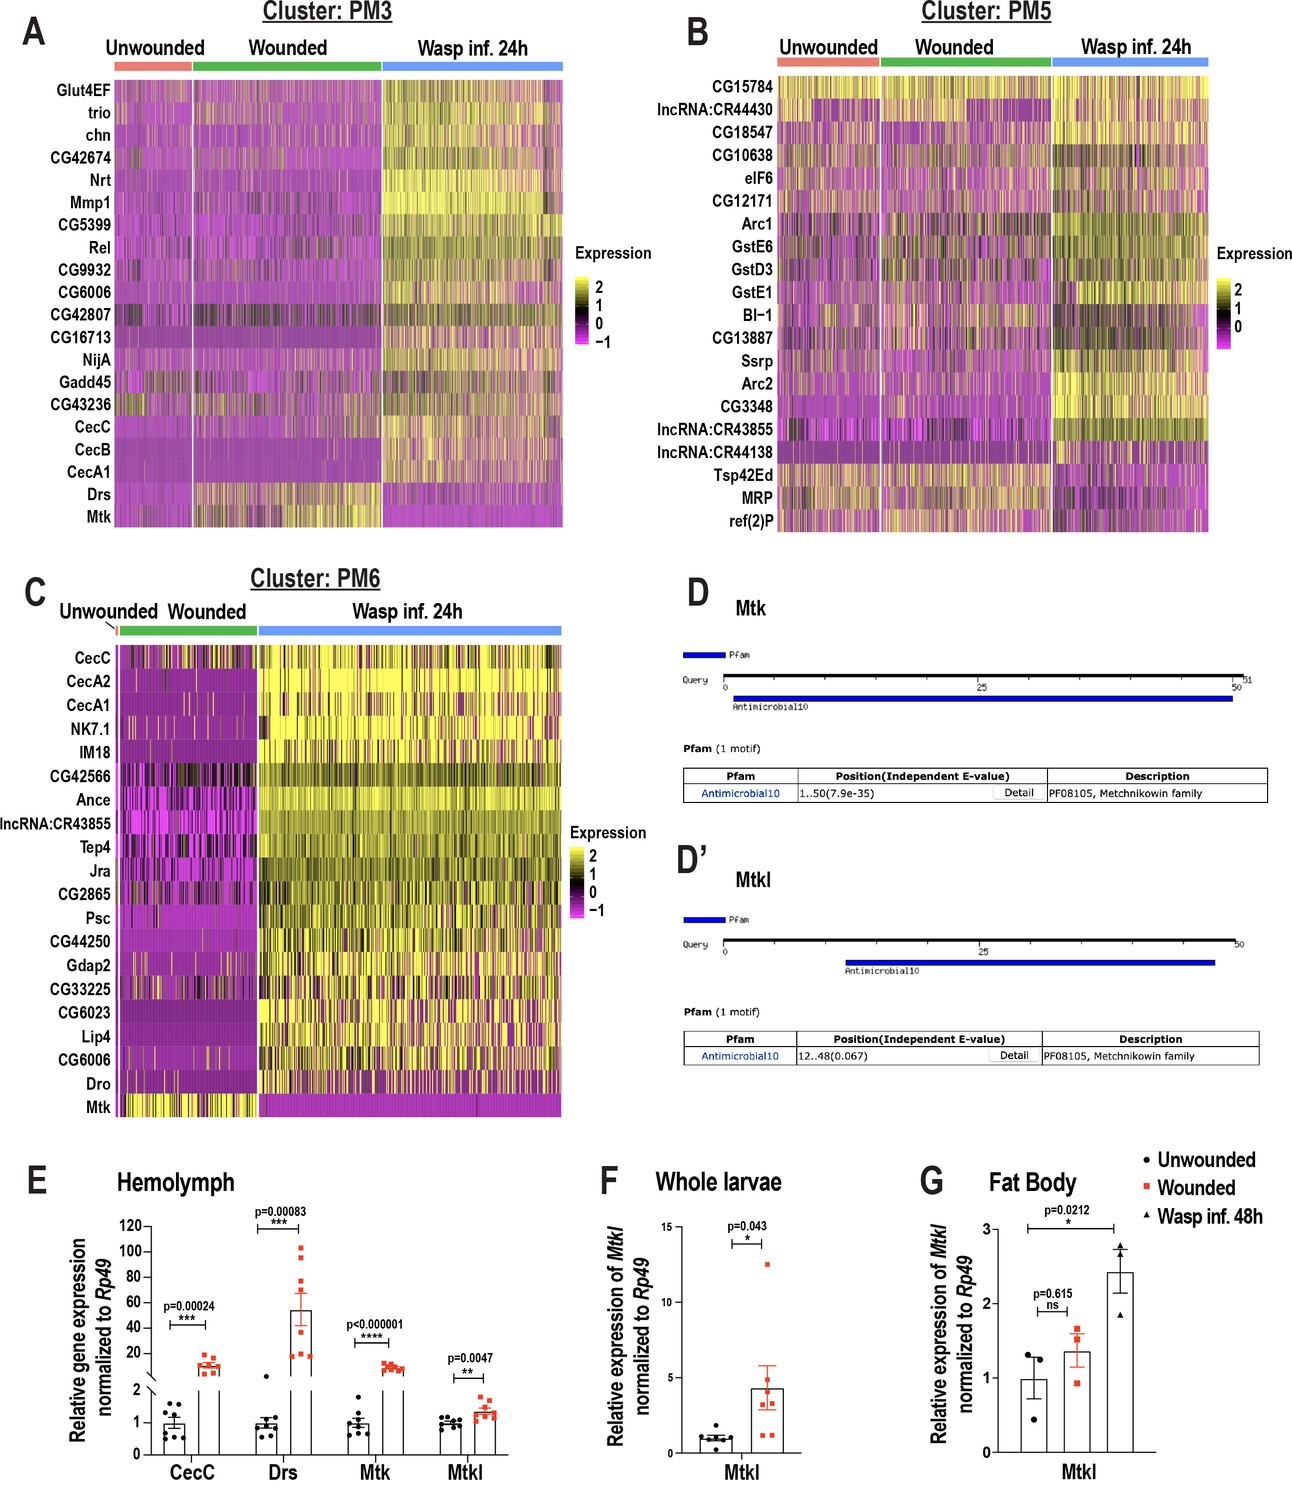
(A-C) Heat maps of differentially expressed gene signatures pertaining to PM3 (A), PM5 (B), and PM6 (C). (D, D’) Screen shots of the Antimicrobial10 domains within the peptide sequences of Mtk (D) and Mtkl (D’) using the motif search tool https://www.genome.jp/tools/motif/. E)qRT-PCR-based relative expression of the AMP genes (CecC, Drs, Mtk, and Mtkl) in hemolymph derived from unwounded and wounded larvae. (F-G) qRT-PCR based relative expression of Mtkl in whole larvae from unwounded and wounded conditions (F) and in fat bodies of unwounded, wounded, and wasp infested larvae (G). Error bars in E-G are represented as ± SEM (standard error of mean). Statistics were done in Prism using unpaired t-tests (E-F) and one-way ANOVA (G). P values are represented by * (p<0.05), ** (p<0.01), *** (p<0.001), **** (p<0.0001).
Figure 3 with 2 supplements
Pseudotemporal ordering of cells using Monocle3 delineates blood cell lineages.
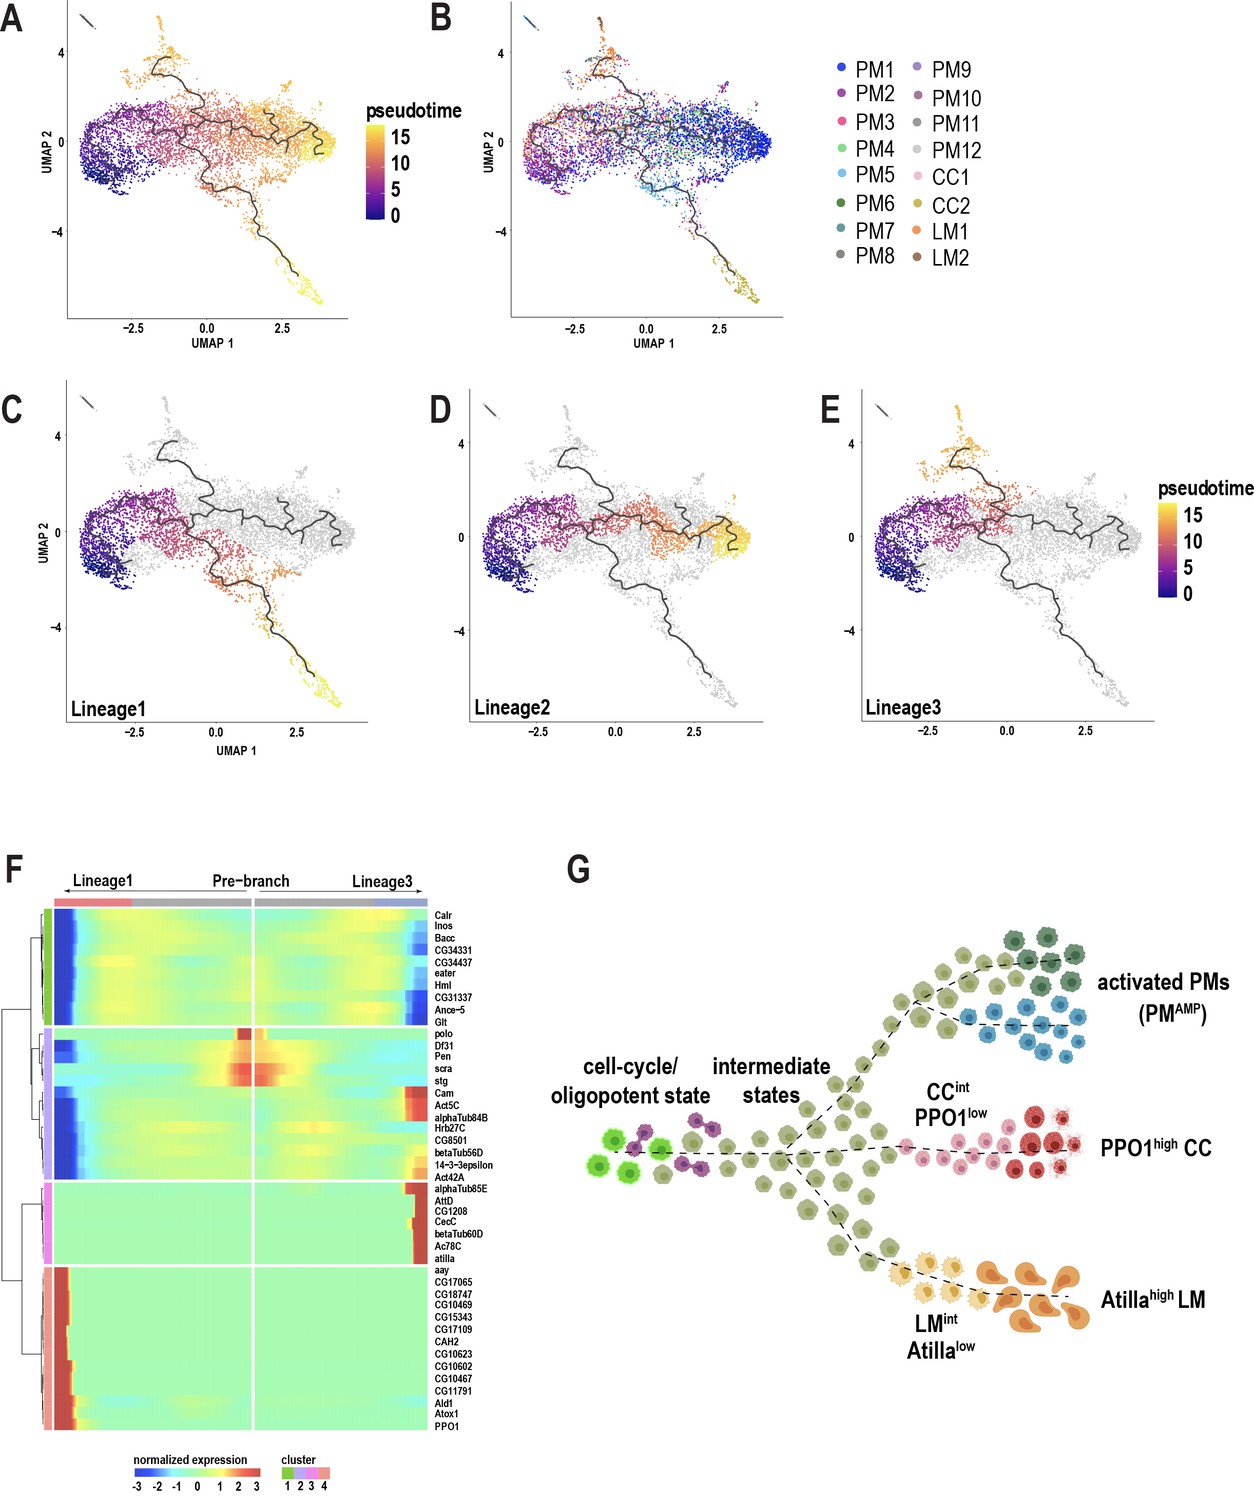
(A) Monocle3 was used to track cells over pseudotime on the 10X-derived unwounded and wounded data sets. (B) Visualization of clusters (from Figure 1C) onto the pseudotime map. (C-E) Three major lineage routes were obtained from the start site: Lineage 1 (C), Lineage 2 (D), and Lineage 3 (E). (F) Monocle-based gene expression signature between Lineages 1 and 3 with the ‘pre-branch’ in the middle. (G) Schematic showing potential lineage flow from the oligopotent state of plasmatocytes (PM2) to mature cell types with their intermediates.
Figure 3—figure supplement 1
Pseudotemporal ordering of cells using Monocle3 delineates blood cell lineages.
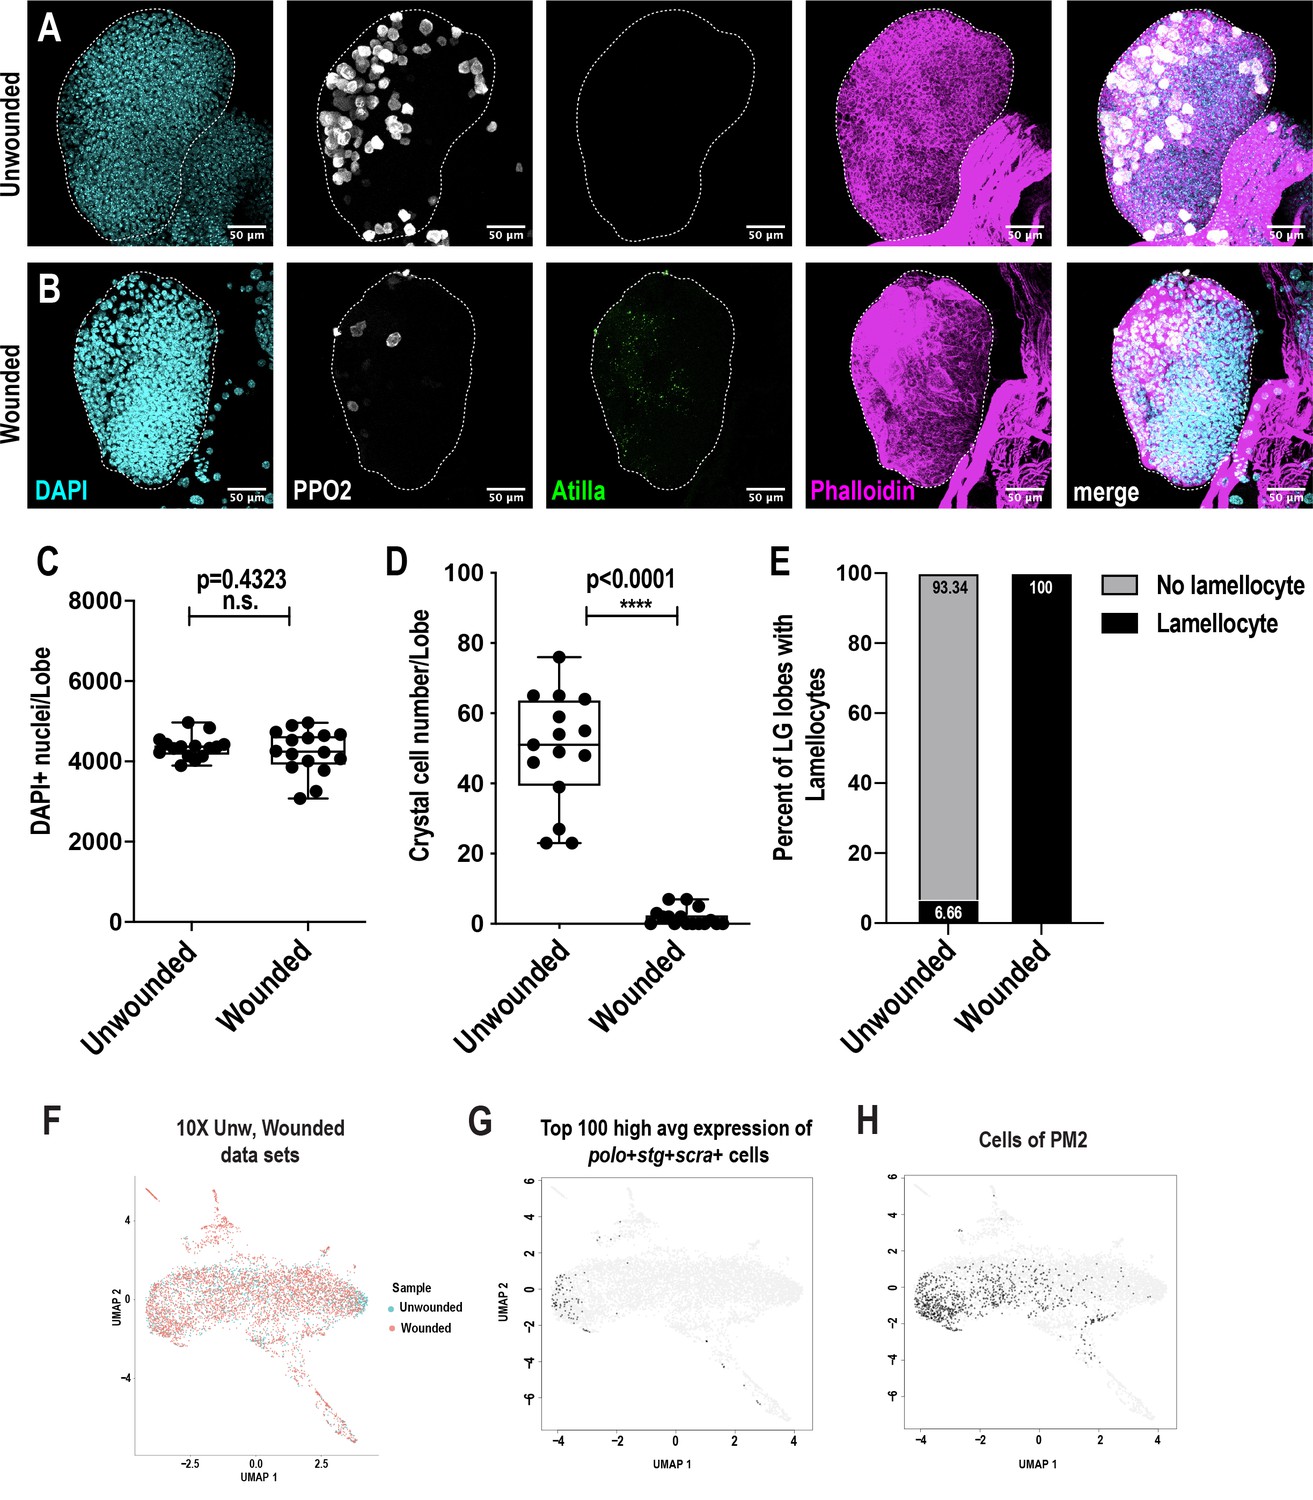
(A-B) Confocal imaging reveals that the lymph glands are intact and unruptured in wounded larvae (B) compared to unwounded controls (A). Scale bar = 50 μm. (C-E) Total number of cells, represented by the nuclear stain DAPI, remain unchanged (C), while the number of crystal cells decrease (D), and all the lymph glands showed positive staining for lamellocytes (E) in wounded larvae compared to unwounded controls. (D) Monocle three was used to track cells over pseudotime on the 10X genomics-derived unwounded and wounded data sets. The UMAP represents the two conditions. (E) UMAP plot represents the cells with high combined average expression of the cell cycle and cell cycle associated genes polo, stg, and scra. (F) UMAP plot shows that the cells with high combined average expression of polo, stg, and scra belong to the PM2 cluster.
Figure 3—figure supplement 2

Pseudotemporal ordering of cells using Monocle3 delineates blood cell lineages.
(A-D) Gene expression of blood cell marker genes, such as PPO1 (A), atilla (B), Drs (C), and GstE6 (D) along the pseudotime intervals, reveals that these genes are enriched over pseudotime. (E) Ridge plots of all the clusters over pseudotime intervals reveal that most plasmatocyte subpopulations including all minor PM clusters (PM8, 9, 10, and 12) possibly are transient intermediate states. (F) Heat map depicts the gene set enrichment pertaining to various metabolic pathways enriched in each cluster (from Figure 1C). (G-H) Confocal imaging of hemocytes derived from third instar larvae with Hml-GAL4-mediated expression of UAS-empty control (G) or poloRNAi (H). Hml+ cells, crystal cells, lamellocytes, and nuclei are represented by EGFP (green), mCherry (PPO1 in magenta), Atilla (gray [far red]), and DAPI (cyan), respectively. Scale bar = 25 μm. (I) Percentage of lamellocytes normalized to Hml+ plasmatocytes per field of view in three independent biological replicates (n = 3). Error bars are represented as ± SEM (standard error of mean). Statistics were done in Prism using unpaired t-test. P values are represented by * (p=0.032).
Figure 4 with 1 supplement
Crystal cell sub-clustering distinguishes crystal cell intermediates from mature crystal cells.
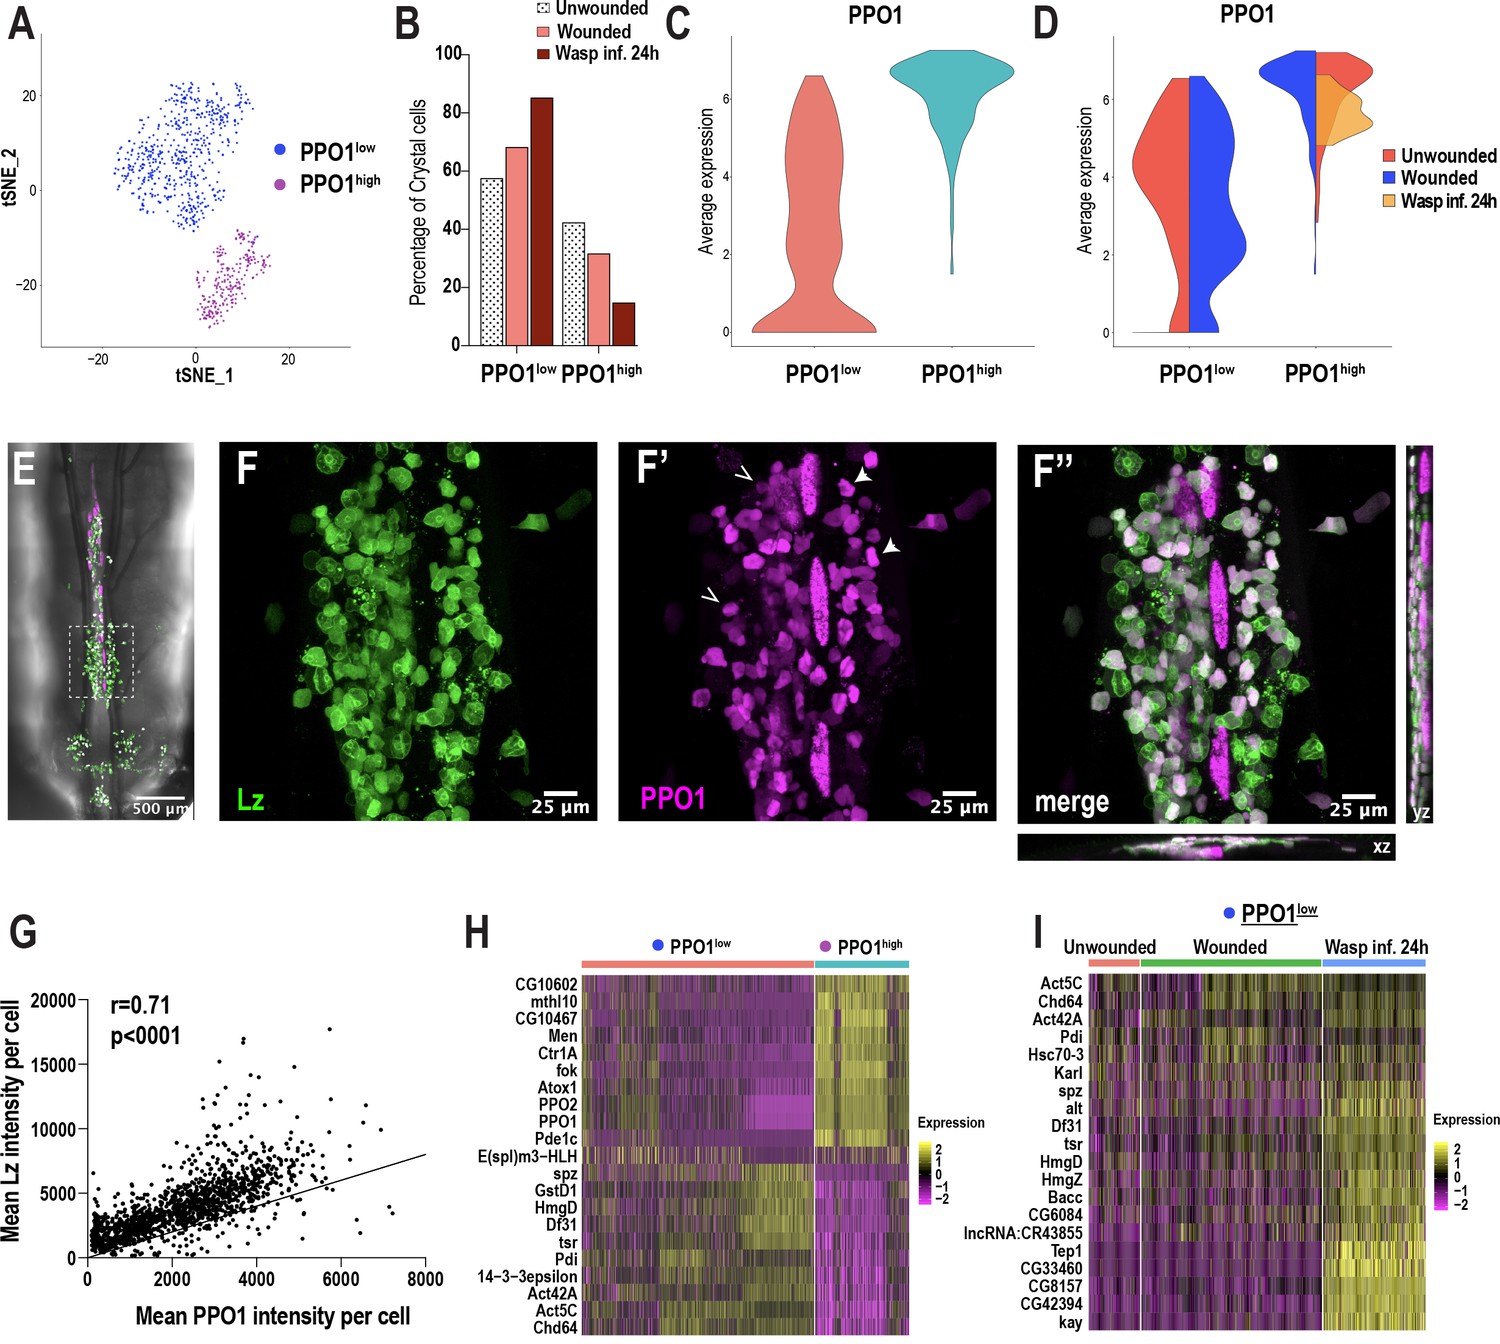
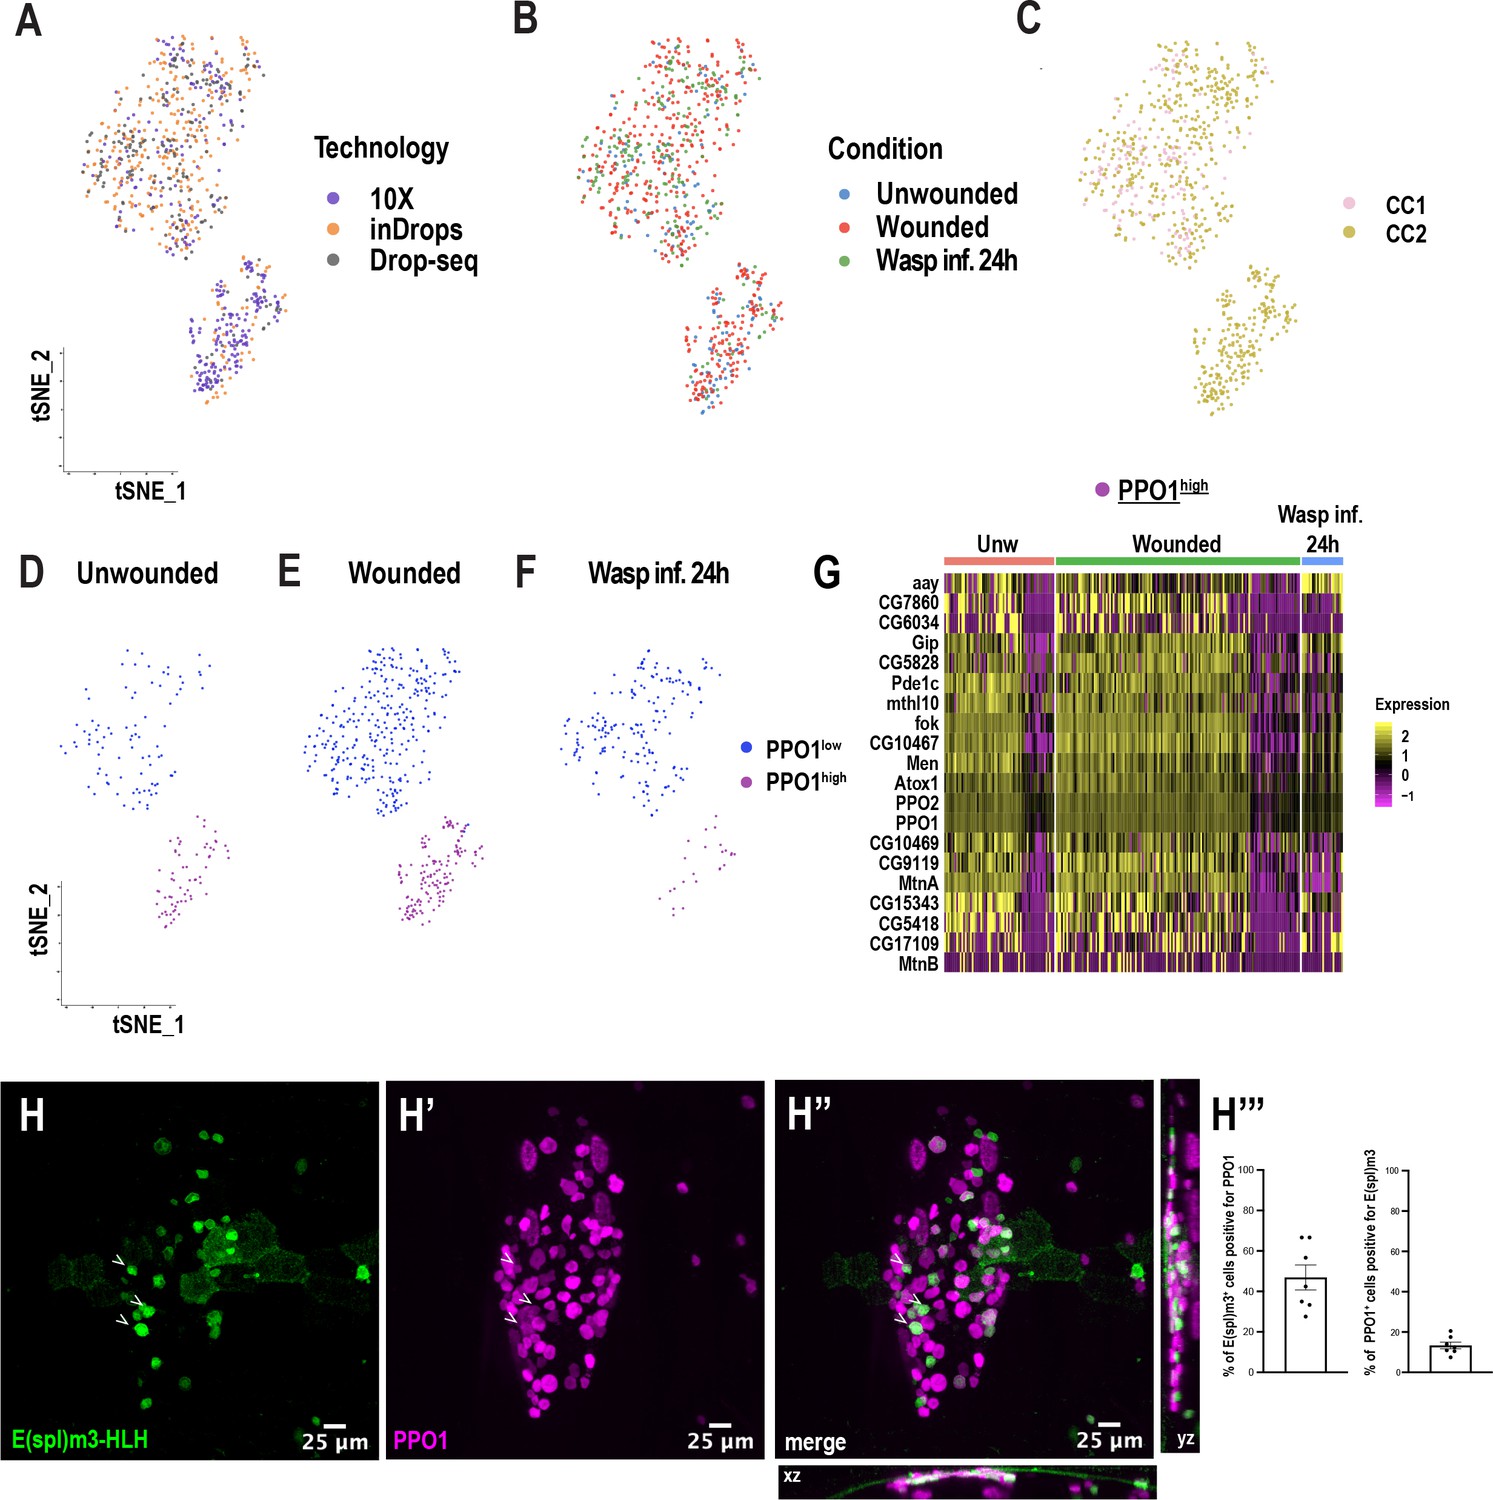
(A) t-SNE plot of crystal cell sub-clustering depicting two crystal cell sub-clusters, PPO1low and PPO1high. (B) Percentage of PPO1low and PPO1highcrystal cells across the three conditions. (C) Violin plot indicating the average expression level of PPO1 in the two crystal cell clusters. (D) Average expression level of PPO1 across the three conditions. (E) Confocal image of the posterior-dorsal side of a representative lz-GAL4; UAS-GFP, BcF6-mCherry third instar larva. BcF6-mCherry is a reporter for PPO1+crystal cells. Scale bar = 500 μm. (F-F’’) Confocal images of GFP+ (F), BcF6-mCherry+ (F’), and merged GFP+ mCherry+ crystal cells (F’’). xz and yz images in F’’ represent the depth of the stacks. Representative PPO1low and PPO1highcrystal cells are shown by open and solid arrow heads, respectively, in F’. Scale bar = 25 μm. (G) Mean intensities of GFP (Lz) and mCherry (PPO1). The correlation plot represents data from unwounded lz-GAL4; UAS-GFP, BcF6-mCherry larvae (n = 23; total crystal cells analyzed = 1397). The Pearson’s correlation coefficient (r) and the p value (two-tailed) were calculated using Prism 8. (H-I) Heat maps of marker gene expression in PPO1low and PPO1high clusters (H) and differentially expressed gene (DEG) analysis of the marker genes across conditions in PPO1low cluster (I).
-
Figure 4—source data 1
Source data pertaining to cell fraction bar graph of Figure 4B.
- https://cdn.elifesciences.org/articles/54818/elife-54818-fig4-data1-v2.xlsx
-
Figure 4—source data 2
Excel file for Figure 4G pertaining to raw intensity values of Lz+ PPO1+ crystal cells.
- https://cdn.elifesciences.org/articles/54818/elife-54818-fig4-data2-v2.xlsx
Figure 4—figure supplement 1
Crystal cell sub-clustering distinguishes crystal cell intermediates from mature crystal cells.
(A-B) t-SNE plots represent Harmony-based batch correction per technology (A) and condition (B). (C) Representation of CC1 and CC2 cluster colors (from Figure 1C) onto the crystal cell sub-clusters. (D-F) t-SNE plots of unwounded (D), wounded (E), and wasp inf. 24 hr (F) segregated from the main t-SNE plot pertaining to Figure 4A. (G) Heat map depicting the differentially expressed genes corresponding to the top enriched genes in the PPO1high cluster. Genes were ranked based on expression (logFC) across the different conditions. (H-H’’) Expression validation of E(spl)m3-HLH in vivo. Confocal images of crystal cells at the posterior-dorsal region of E(spl)m3-HLH-GAL4; mCD8-GFP, BcF6-mCherry third instar larvae at steady state reveal that a subset of crystal cells express E(spl)m3-HLH. xz and yz panels in G’’ represent the depth of the confocal Z stacks. Scale bar = 25 μm. (H’’’) Percentage of E(spl)m3-HLH+ cells positive for PPO1 and percentage of crystal cells positive for E(spl)m3-HLH (n=7). Error bars are represented as ± SEM.
Figure 5 with 1 supplement
Lamellocyte sub-clustering identifies lamellocyte intermediates and subtypes.
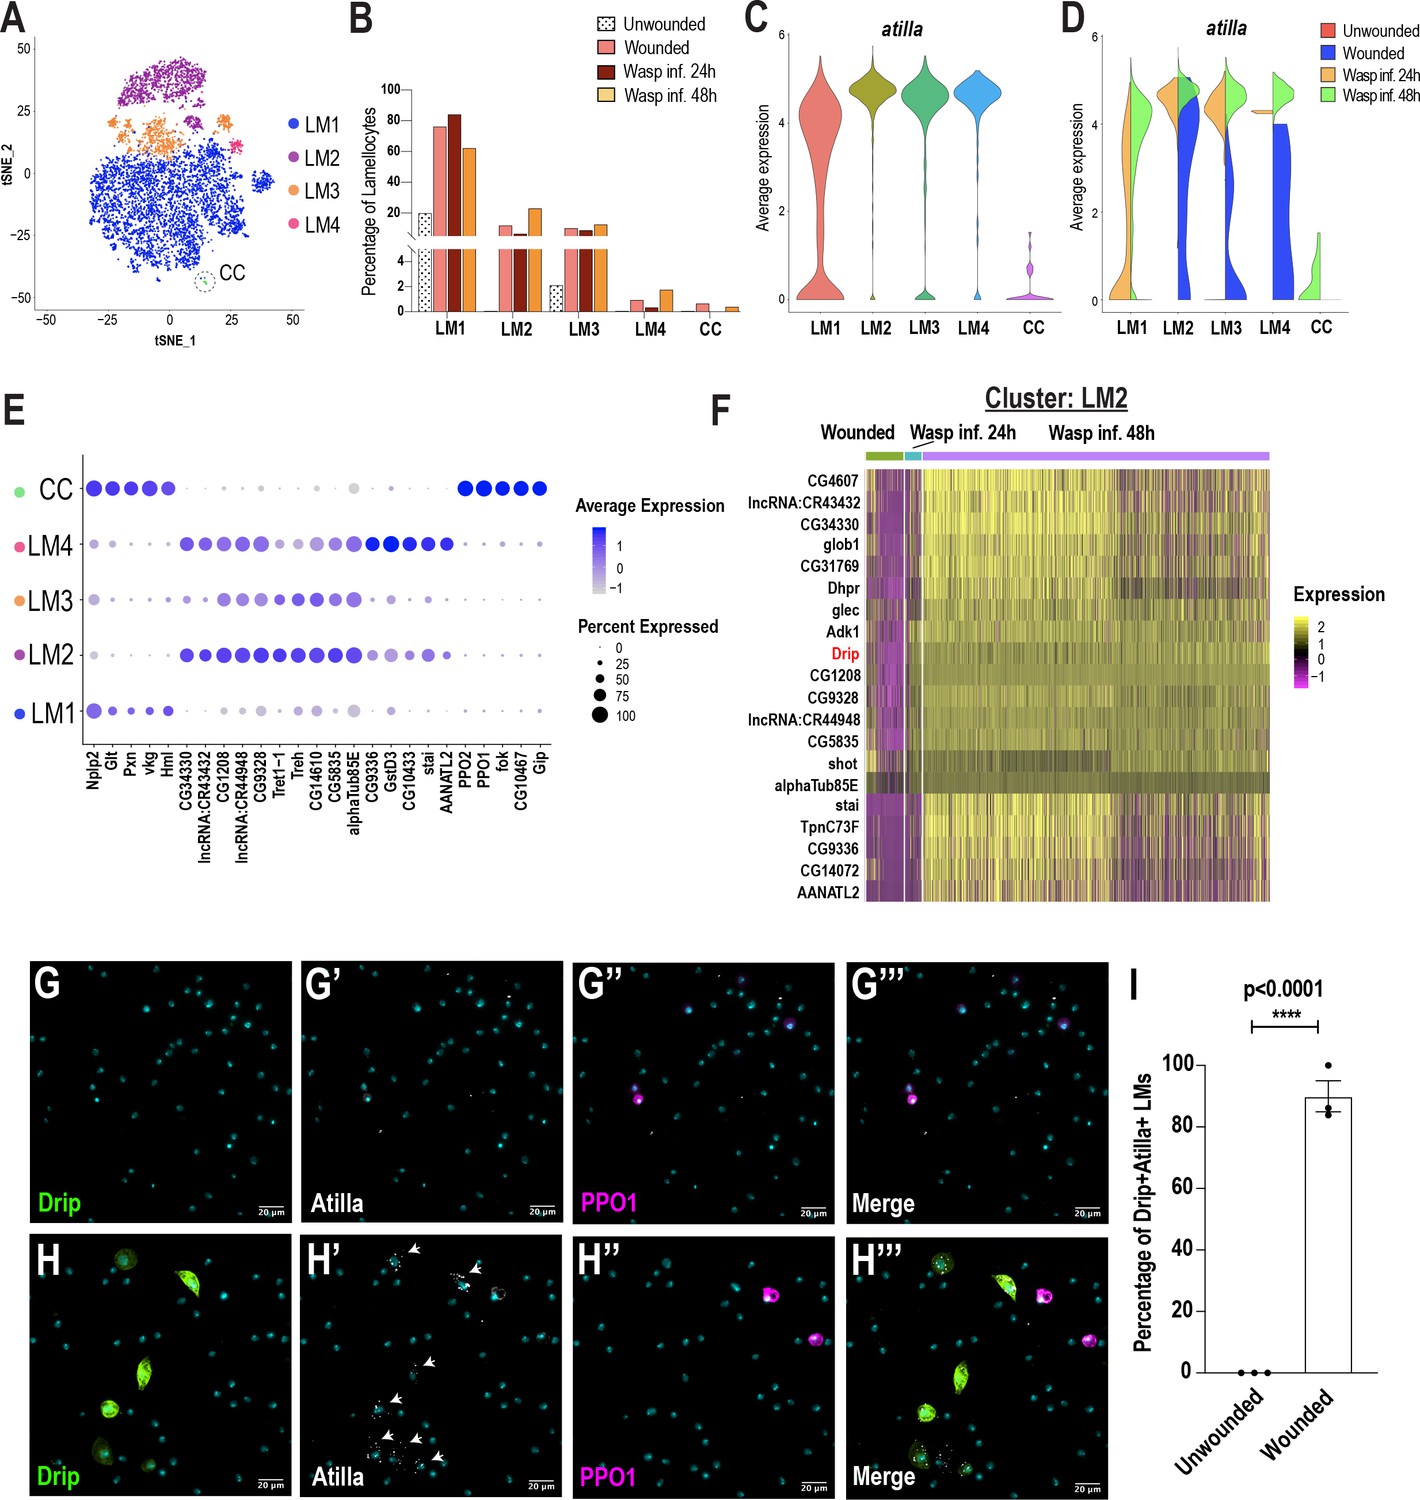
(A) t-SNE plot depicting the lamellocyte sub-clusters. (B) Changes in lamellocyte fractions across the three conditions. (C) Expression of the lamellocyte marker gene atilla was used to annotate the lamellocyte clusters. (D) Split violin plot shows the differential expression of atilla in different conditions. (E) Dot plot representing the top 5 marker genes per lamellocyte cluster. (F) Heat map depicts the DEG analysis of top genes in LM2 across all conditions. (G-H’’’) Expression validation of Drip in hemocytes derived from Drip-GAL4 >mCD8 GFP; BcF6-mCherry unwounded (n = 3 with 16 larvae per n) (G-G’’’) or wounded (n = 3 with 16 larvae per n) (H-H’’’) larvae. Nuclei are stained with DAPI (Cyan). Scale bar = 20 μm. (I) Percentage of GFP+ Atilla+ lamellocytes normalized to total Atilla+ lamellocytes per field of view. Data is represented by three independent biological replicates (n = 3). The error bars are represented as ± SEM (standard error of mean). The P value (unpaired t-test) is represented by **** (p<0.0001).
-
Figure 5—source data 1
Source data pertaining to cell fraction bar graph of Figure 5B.
- https://cdn.elifesciences.org/articles/54818/elife-54818-fig5-data1-v2.xlsx
-
Figure 5—source data 2
Excel sheet pertaining to the lamellocyte counts used for Figure 5I.
- https://cdn.elifesciences.org/articles/54818/elife-54818-fig5-data2-v2.xlsx
Figure 5—figure supplement 1
Lamellocyte sub-clustering identifies lamellocyte intermediates and subtypes.
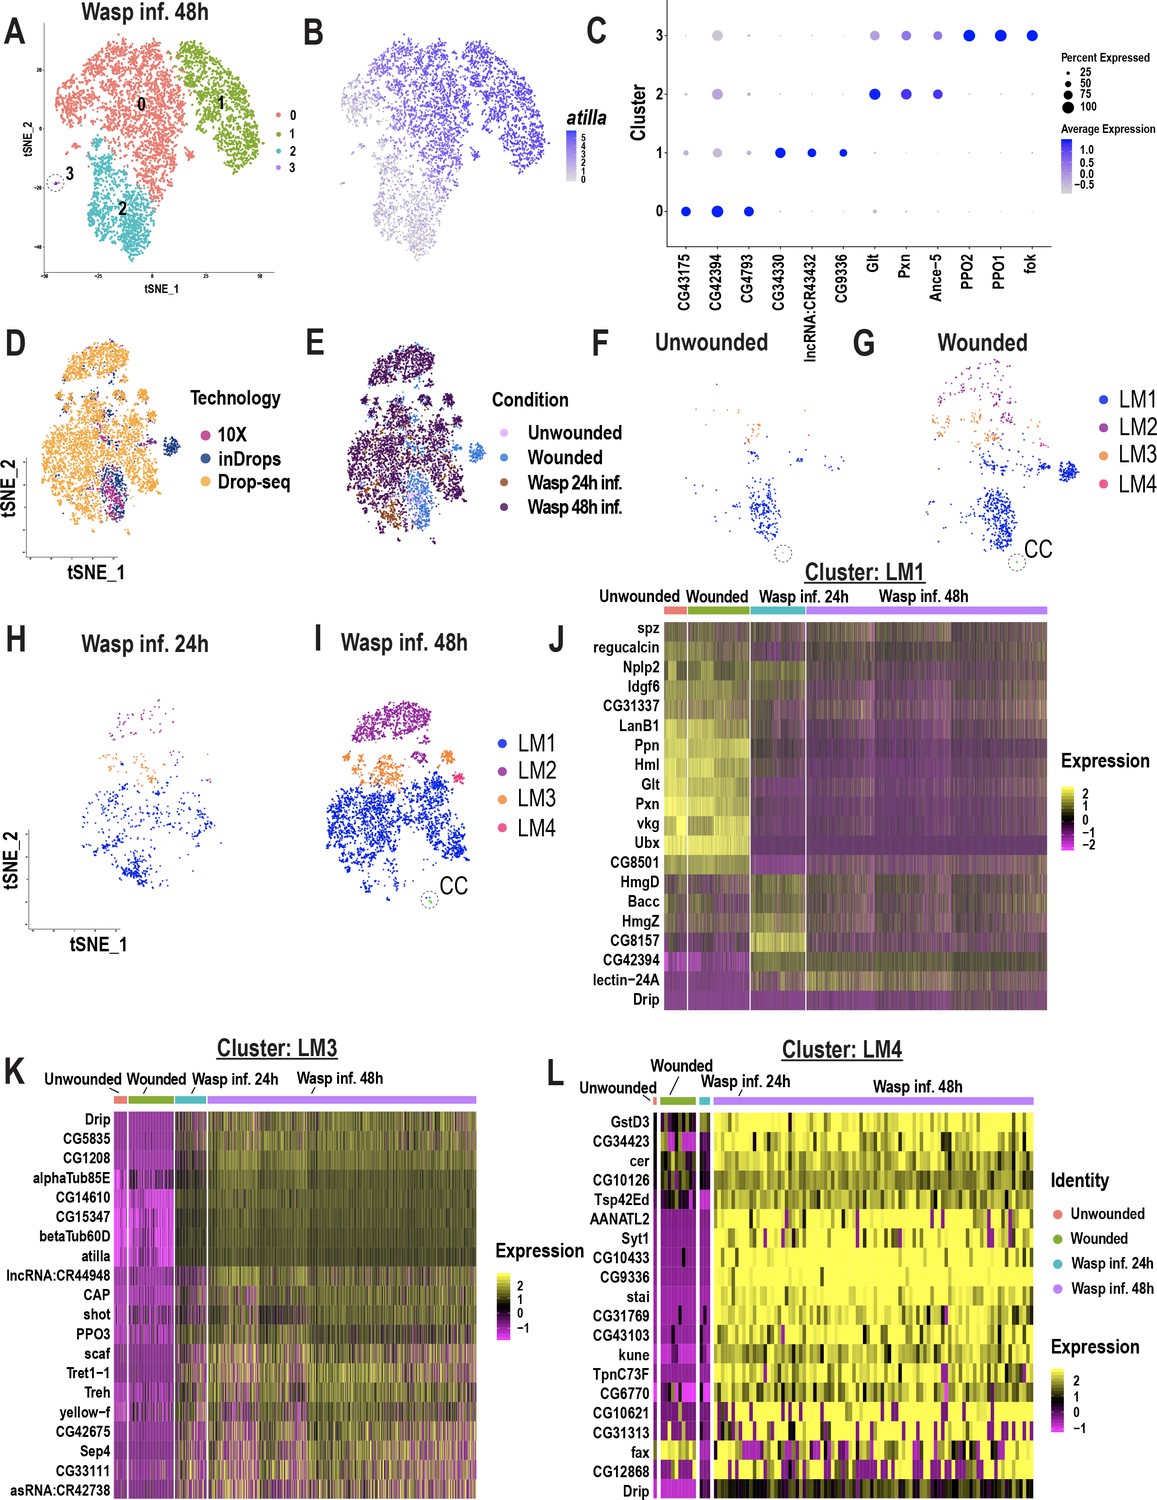
(A) t-SNE plot representing the clustering analysis of wasp inf. 48 hr data set reveals 4 distinct clusters. (B) t-SNE plot demonstrating the expression of atilla in the wasp inf. 48 hr data set. (C) Dot plot shows top enriched genes in each lamellocyte sub-cluster. (D, E) t-SNE plots represent Harmony-based batch correction per technology (D) and condition (E). (F-I) t-SNE plots of unwounded (F), wounded (G), wasp inf. 24 hr (H), and wasp inf. 48 hr (I) segregated from the main t-SNE plot pertaining to Figure 5A. (J-L) Heat maps of differentially expressed gene signatures pertaining to the top enriched genes of LM1 (J), LM3 (K), and LM4 (L).
Figure 6 with 3 supplements
scRNA-seq uncovers a novel role for the FGF pathway in immune response.
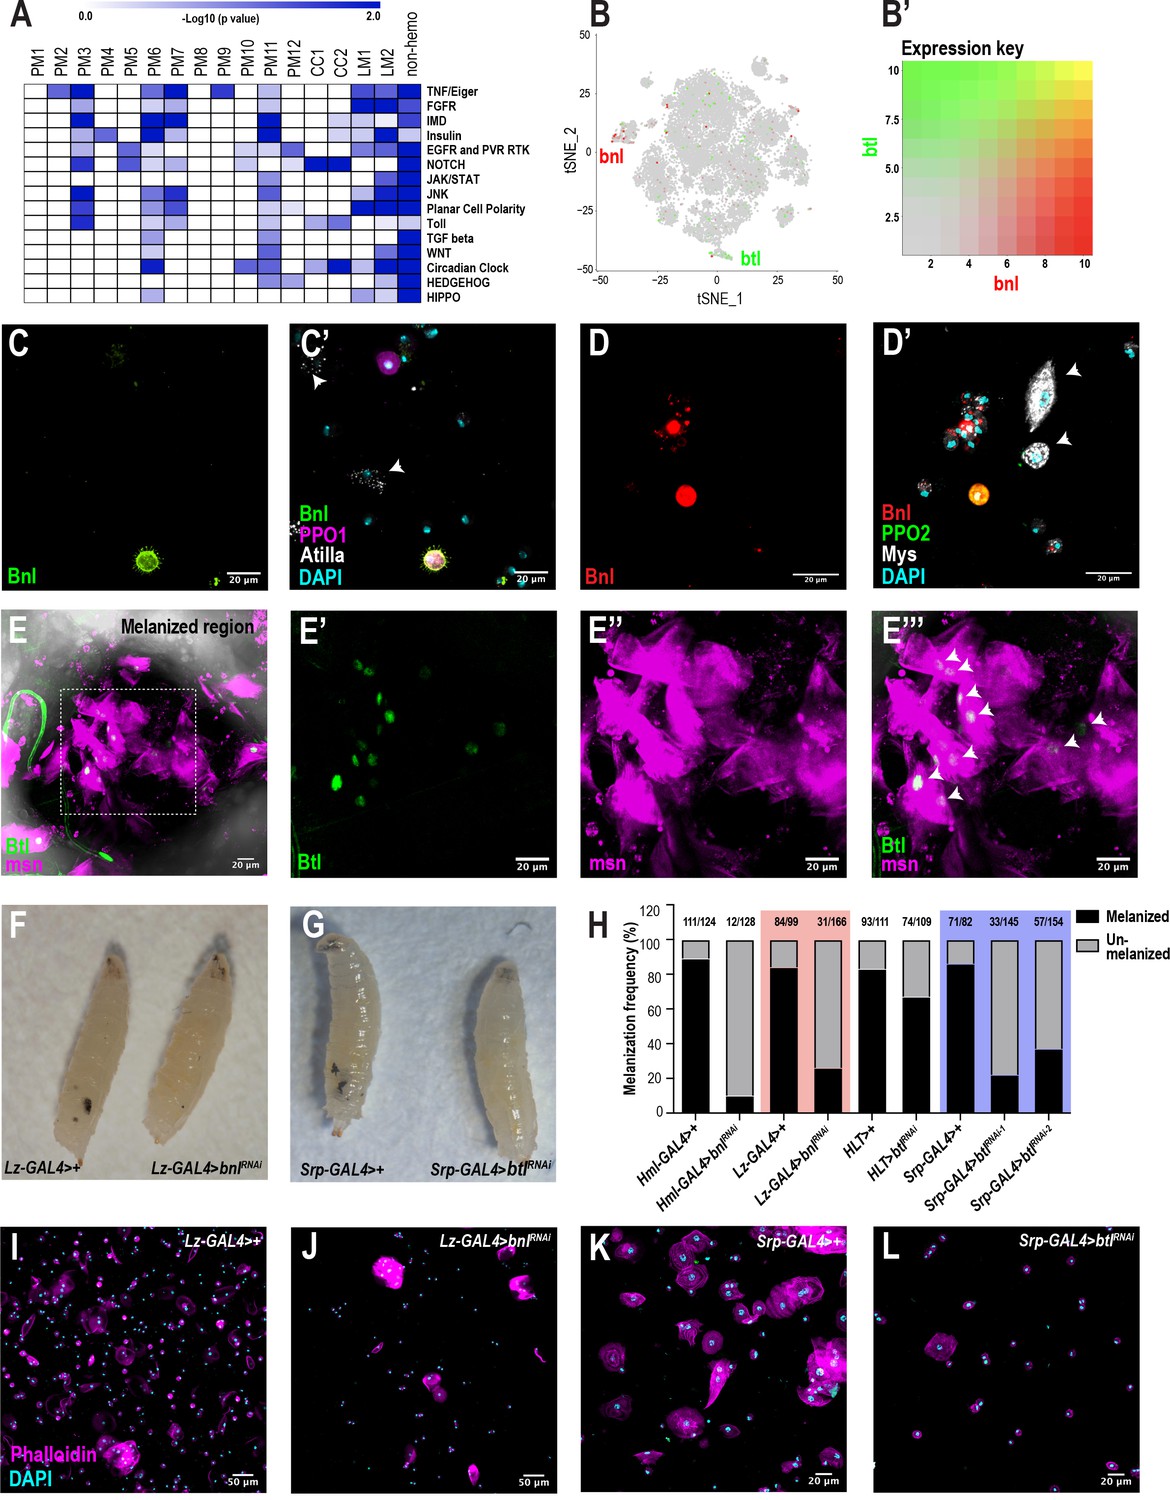
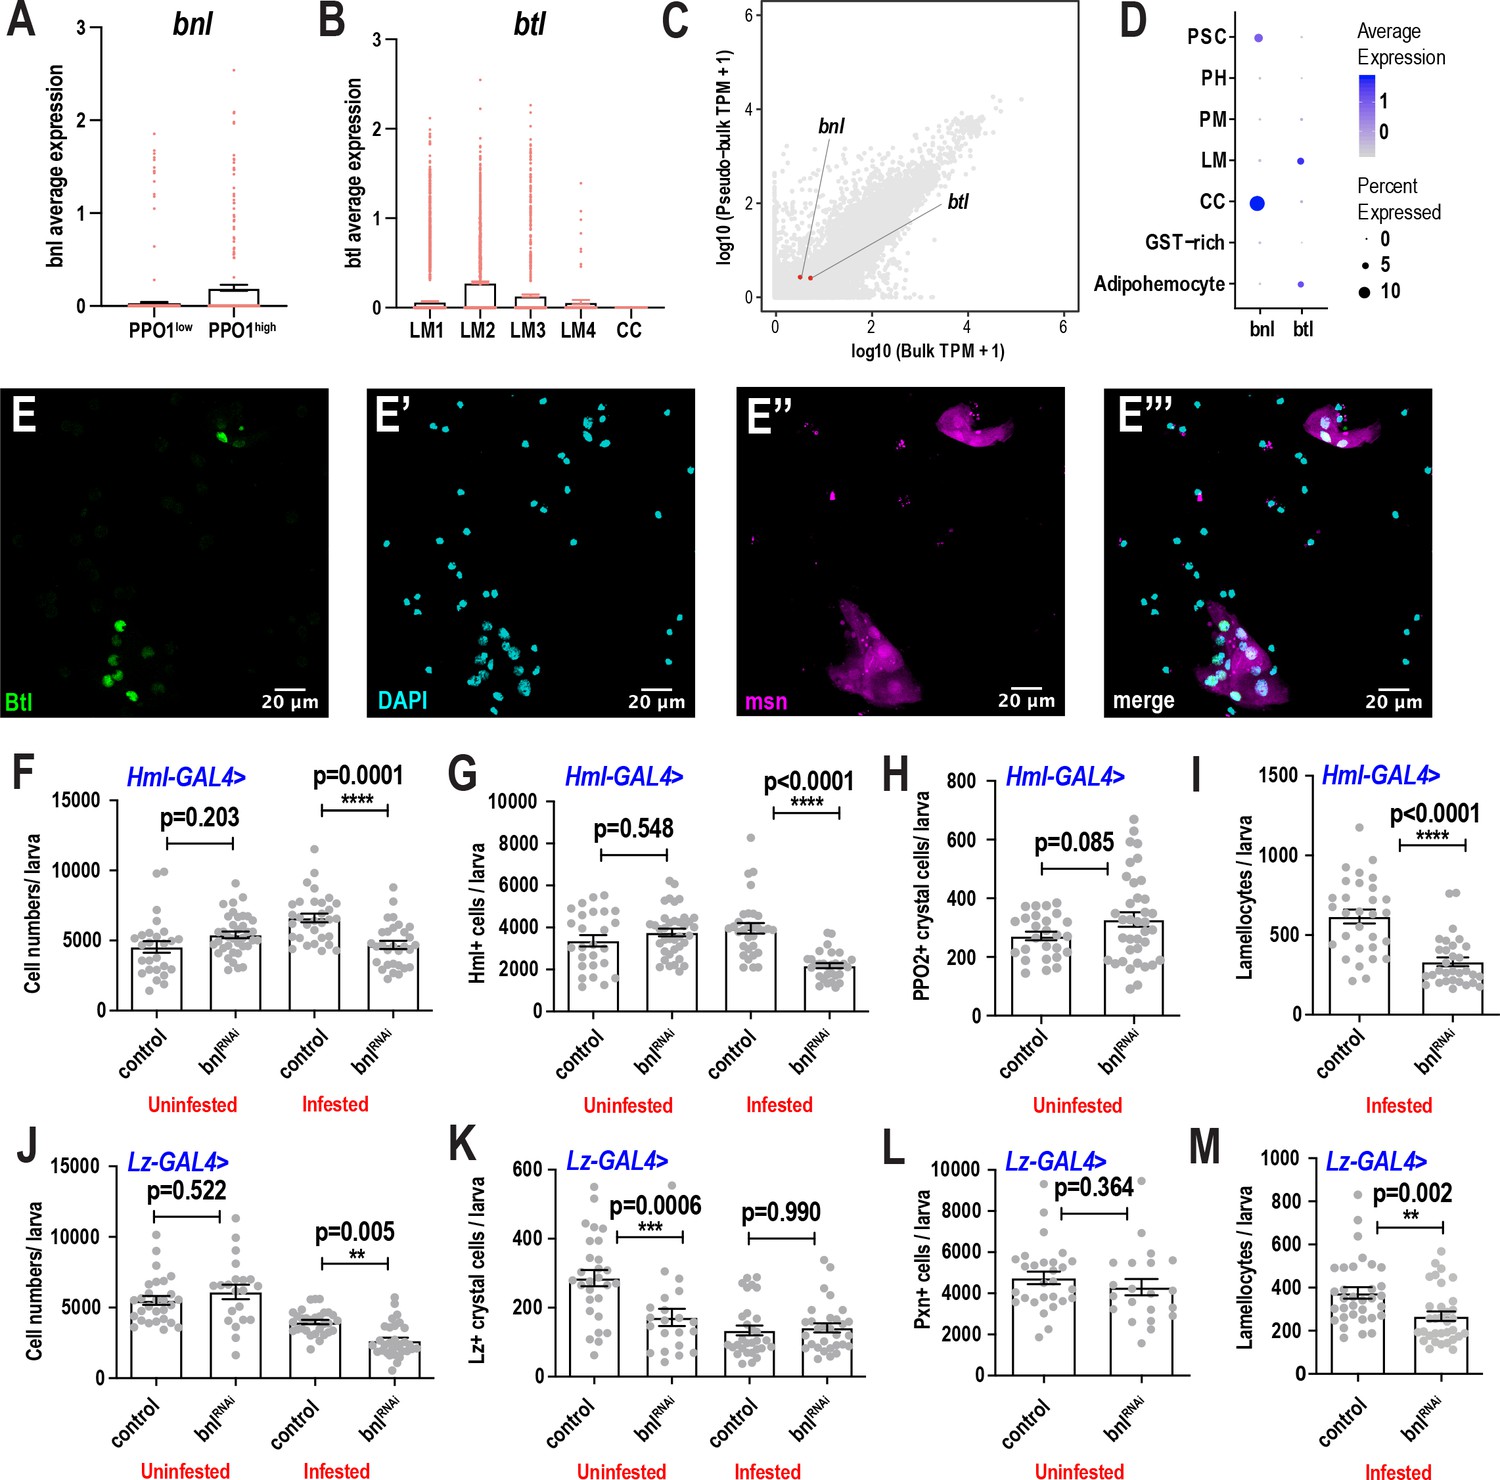
(A) Pathway enrichment of the top marker genes across all the clusters from Figure 1C. (B) Expression of bnl (red) and btl (green) in crystal cell and lamellocyte clusters, respectively. (B’) Expression heat map key. (C, C’) Validation of bnl expression in hemocytes of wounded bnl-LexA; LexAOp-myr-GFP, BcF6-mCherry larvae. Expression of GFP was detected only in crystal cells and not lamellocytes (white arrows). GFP and BcF6-mCherry represent the expression of bnl and PPO1, respectively. Scale bar = 20 μm. (D, D’) Validation of bnl expression in hemocytes of wasp infested bnl-LexA; LexAOp-mCherry larvae. Bnl (mCherry+), Bnl+PPO2 (red+green merged), Myospheroid (Mys, which is specific for lamellocytes) (white arrows), DAPI (cyan). Scale bar = 20 μm. (E-E’’’) Validation of btl expression in lamellocytes in vivo. The melanized region of btl-GAL4; UAS-GFPN-lacZ, msn-mCherry larvae was imaged using confocal microscopy. Expression of GFP was detected in LM nuclei (white arrows in E’’’). GFP and msn-mCherry represent the expression of btl and msn, respectively. msn is a marker for lamellocytes. Scale bar = 20 μm. (F) Representative images of wasp inf. 48 hr lz-GAL4>+ (control) and lz-GAL4 >bnlRNAi larvae. (G) Representative images of wasp inf. 48 hr srp-GAL4>+ and srp-GAL4 >btlRNAi larvae. (H) Melanization frequencies of wasp inf. 48 hr larvae upon bnl and btl knockdown using Hml-, lz-, HLT-, and srp-GAL4 drivers. (I, J) Confocal images of hemocytes from wasp inf. 48 hr larvae in lz-GAL4>+ controls (I) compared to their lz-GAL4 >bnlRNAi (J). Scale bar = 50 μm. (K, L) Confocal images of hemocytes from wasp inf. 48 hr larvae in srp-GAL4>+ controls (K) compared to their srp-GAL4 >btlRNAi (L). Scale bar = 20 μm.
Figure 6—figure supplement 1
scRNA-seq uncovers a novel role for the FGF pathway in immune response.
(A) Average bnl expression counts derived from the crystal cell sub-clustering data revealed that bnl is more enriched in PPO1highcrystal cells. Each colored dot represents one cell. Error bars are represented as ± SEM. (B) Average btl expression counts derived from the lamellocyte sub-clustering data revealed that btl is more enriched in LM2 and LM3 sub-clusters. Each colored dot represents one cell. Error bars are represented as ± SEM. (C) Expression validation of bnl and btl in pseudobulk scRNA- and bulk RNA-seq of lymph glands from unwounded normal larvae. D) Dot plot representing the expression enrichment of bnl in crystal cell (CC) and btl in lamellocyte (LM) clusters of lymph gland scRNA-seq of unwounded control larvae. Clusters GST-rich, PM, PH, and PSC are glutathione S transferase-rich, plasmatocytes, prohemocytes, and posterior signaling center, respectively. (E-E’’’) Validation of btl expression in lamellocytes upon wasp infestation. btl-GAL4; UAS-GFPN-lacZ, msn-mCherry larvae were wasp infested and the hemocytes were bled for subsequent staining of the nuclei using DAPI. Scale bar = 20 μm. (F-I) Bar graphs representing average number of total cells (F), Hml+ cells (G), PPO2+crystal cells (H), and lamellocytes (I) per larva with or without RNAi against bnl using the Hml-GAL4 driver. Comparisons were made between the genotypes in uninfested control and wasp inf. 48 hr conditions. n = 26–37 biological replicates per condition and genotype. (J-M) Bar graphs representing average number of total cells (J), Lz+crystal cells (K), Pxn+ cells (L), and lamellocytes (M) per larva with or without RNAi against bnl using the Lz-GAL4 driver. Comparisons were made between the genotypes in uninfested control and wasp inf. 48 hr conditions. n = 21–31 biological replicates per condition and genotype. Error bars are represented as ± SEM. Statistics were done in Prism 8 using one-way ANOVA. P values are represented by * (p<0.05), ** (p<0.01), *** (p<0.001), **** (p<0.0001).
Figure 6—figure supplement 2
scRNA-seq uncovers a novel role for the FGF pathway in immune response.
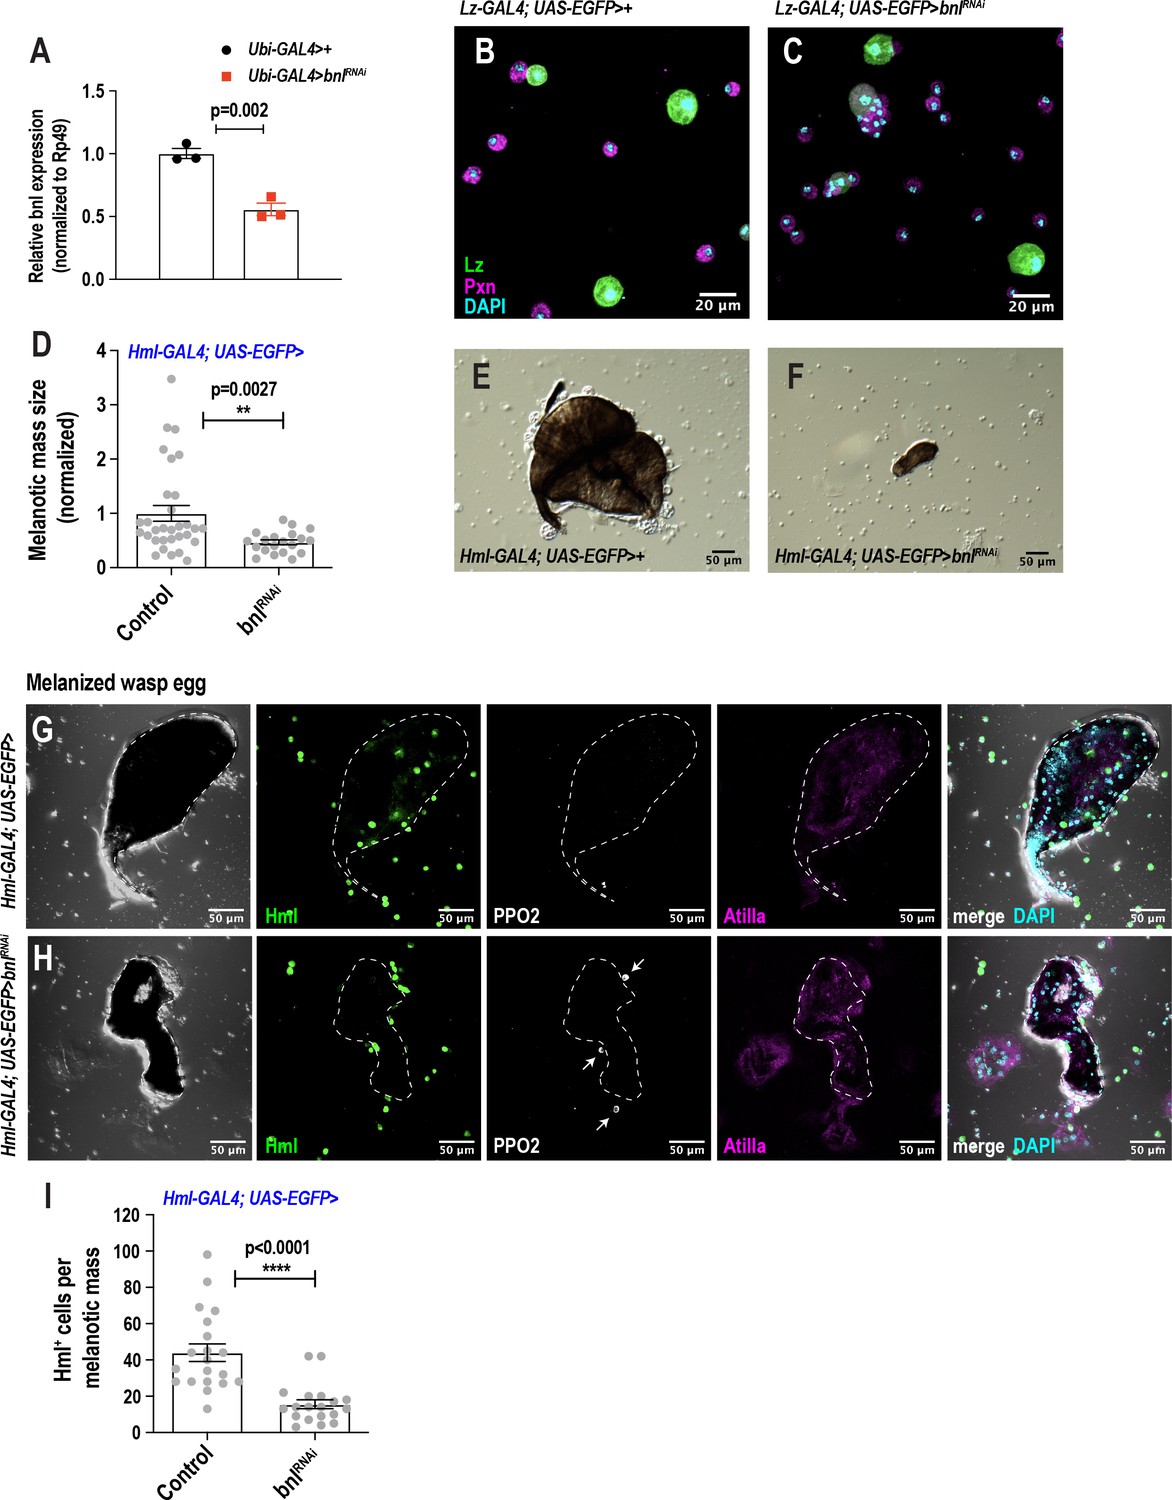
(A) Validation of bnlRNAi knockdown efficiency by qRT-PCR. UAS-bnlRNAi flies were crossed to Ubiquitin (Ubi)-GAL4 and the resulting RNA from Ubi >control and Ubi >bnlRNAi larvae was subjected to qRT-PCR, which determined the knockdown efficiency to be ~45%. (B-C) Representative confocal images reveal normal crystal cell morphology upon knockdown of bnl in crystal cells in normal conditions. Scale bar = 20 μm. (D-F) Knockdown of bnl in hemocytes (Hml-GAL4 >bnlRNAi) results in a significantly decreased size of the melanotic mass 48 hr post wasp infestation. Scale bar in E-F = 50 μm. (G-I) Confocal microscopy of melanized wasp eggs reveals that knockdown of bnl in plasmatocytes (Hml-GAL4 >bnlRNAi) affects the recruitment of Hml+ cells towards the melanized wasp egg. Arrows indicate intact crystal cells, labelled with PPO2, around wasp eggs in Hml-GAL4 >bnlRNAi larvae. Lamellocytes, marked by Atilla, are seen in both control and Hml-GAL4 >bnlRNAi larvae. Scale bar in G-H = 50 μm. Error bars are represented as ± SEM. Statistics were done in Prism 8 using unpaired t-test. P values are represented by * (p<0.05), ** (p<0.01), *** (p<0.001), **** (p<0.0001).
Figure 6—figure supplement 3
scRNA-seq uncovers a novel role for the FGF pathway in immune response.
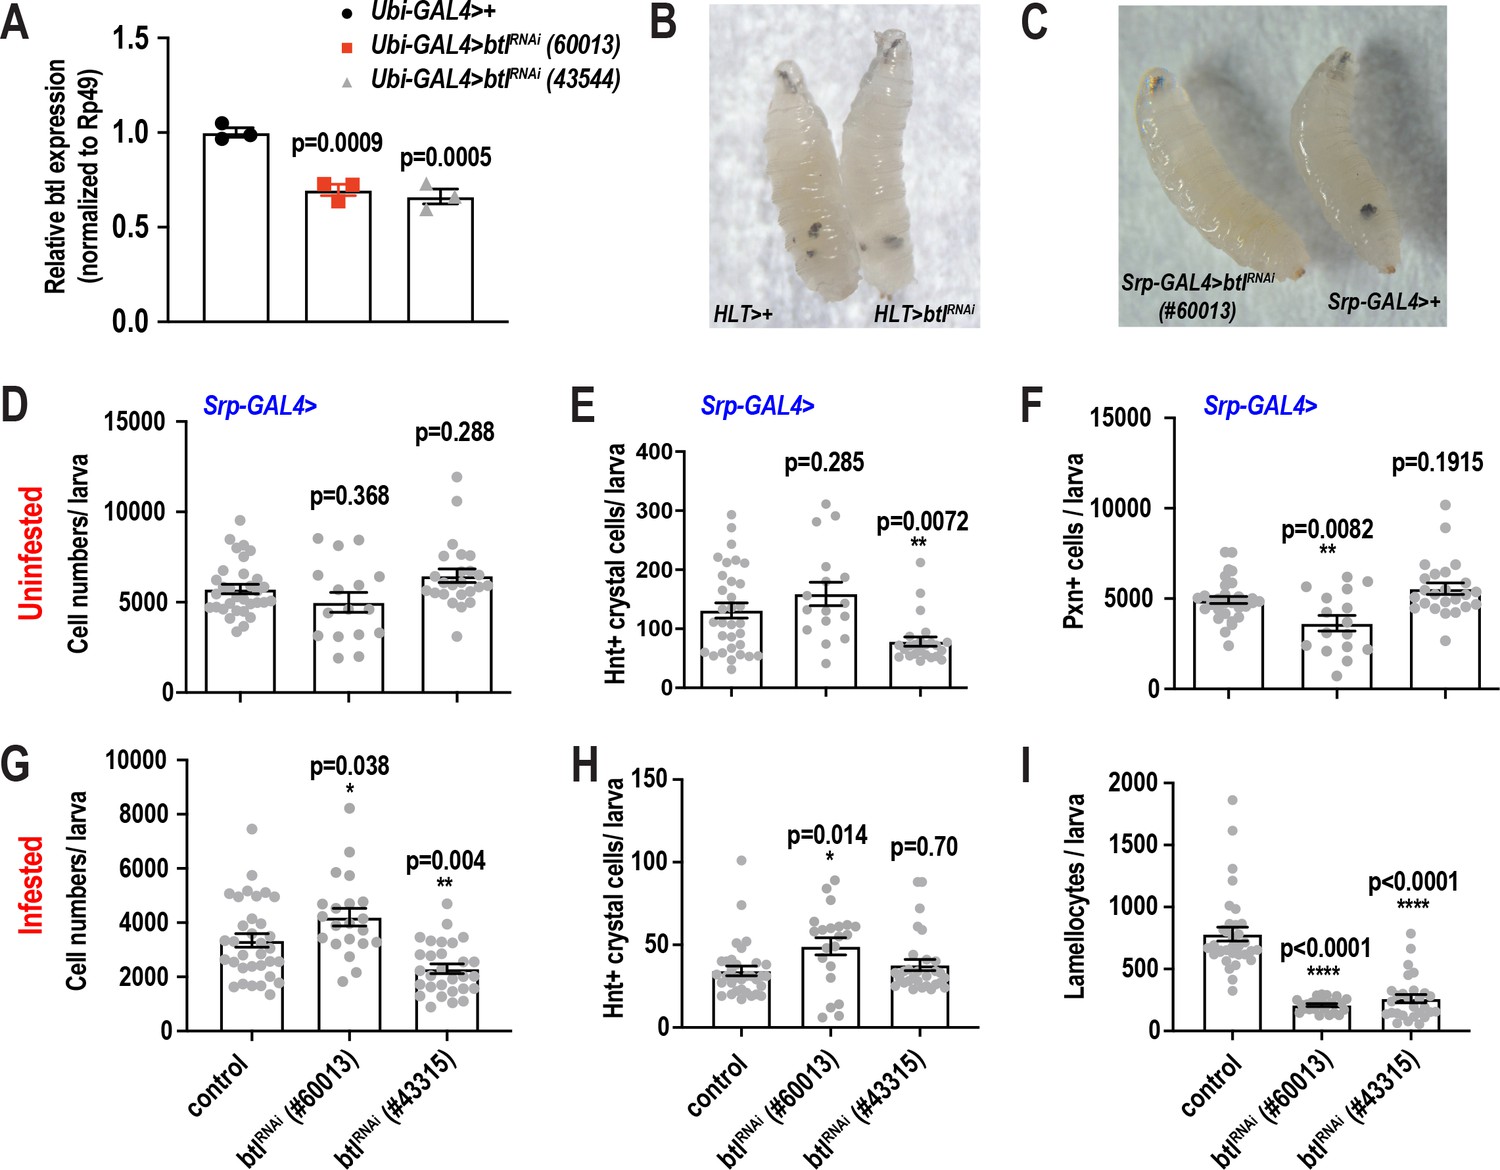
(A) Validation of btlRNAi knockdown efficiency by qRT-PCR. UAS-btlRNAi flies (BL#60013 and #43544) were crossed to Ubiquitin (Ubi)-GAL4 and the resulting RNA from Ubi >control and Ubi >btlRNAi larvae was subjected to qRT-PCR, which determined the knockdown efficiency to be ~30–35% in the two different RNAi lines. (B) Bright field image of wasp infested HLT-GAL4> and HLT-GAL4 >btlRNAi (#60013) larvae. (C) Bright field image of wasp infested srp-GAL4 >btlRNAi (#60013) and srp-GAL4> larvae. (D-F) Bar graphs representing average number of total cells (D), Lz+crystal cells (E), Pxn+ cells (F) per larva with or without RNAi against btl using the srp-GAL4 driver in uninfested control condition. n = 24–30 biological replicates per condition and genotype. (G-I) Bar graphs representing average number of total cells (G), Hnt+crystal cells (H), Pxn+ cells (F), and lamellocytes (I) per larva with or without RNAi against btl using the srp-GAL4 driver in 48 hr post wasp infested condition. n = 24–30 biological replicates per condition and genotype. Error bars are represented as ± SEM. Statistics were done in Prism 8 using one-way ANOVA. P values are represented by * (p<0.05), ** (p<0.01), *** (p<0.001), **** (p<0.0001).
Figure 7
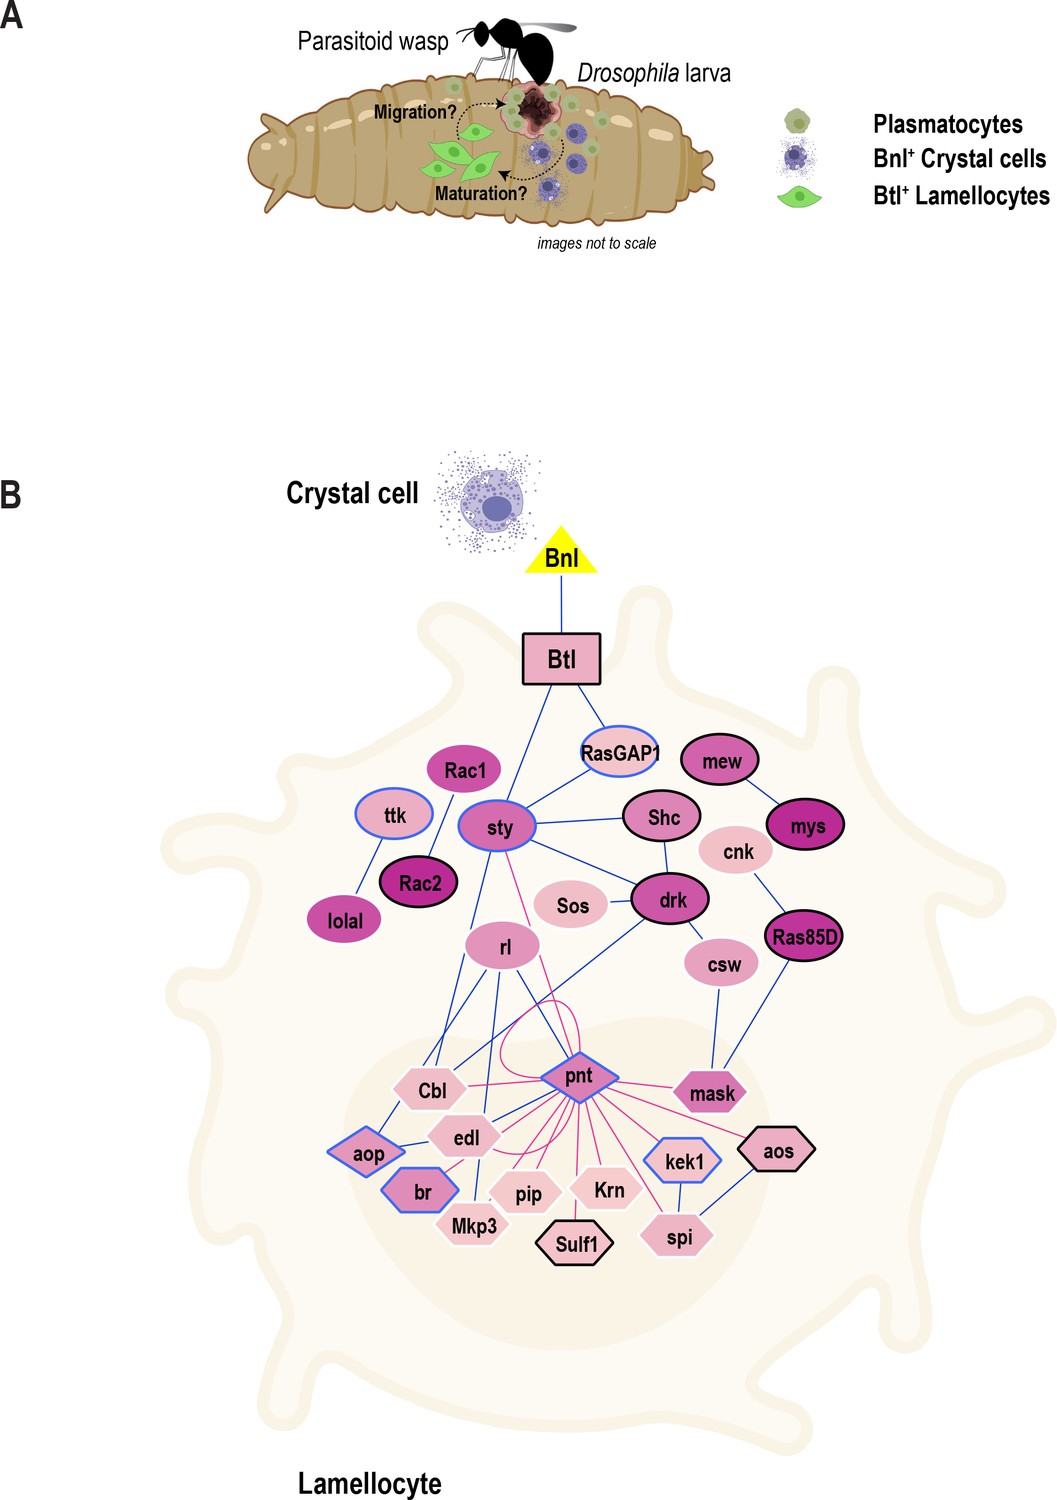
Model of the role of FGF signaling pathway in blood cell migration.
(A) Proposed model depicting inter-hemocyte crosstalk between Bnl+crystal cells and Btl+ lamellocytes. Based on our in vivo data, we propose that crystal cells expressing Bnl are important for the differentiation or maturation and possible migration or recruitment of lamellocytes towards parasitoid wasp eggs. (B) FGF signaling pathway map depicting the enrichment of genes that encode core components of the FGF signaling pathway. Triangle, rectangle, circles, diamonds, polygons represent ligand, receptor, signaling proteins, transcription factors, and their downstream target genes, respectively. Color gradient within nodes represents the number of cells a particular gene is enriched. Blue line (edge color) represents protein-protein interactions (from PPI network) and red line represents transcription factor-target gene networks. Genes that are more enriched in lamellocytes are in black border and those that are in blue border represent less enriched genes. Note that some genes with white border may be enriched in other clusters and are not marker genes of LM2.
Tables
Key resources table
| Reagent type (species) or resource | Designation | Source or reference | Identifiers | Additional information | |||
|---|---|---|---|---|---|---|---|
| Gene (D. melanogaster) | CG43236 | NA | FLYB: FBgn0262881 | NA | |||
| Gene (D. melanogaster) | E(spl)m3-HLH | NA | FLYB: FBgn0002609 | NA | |||
| Gene (D. melanogaster) | Drip | NA | FLYB: FBgn0015872 | NA | |||
| Gene (D. melanogaster) | bnl | NA | FLYB: FBgn0014135 | NA | |||
| Gene (D. melanogaster) | btl | NA | FLYB: FBgn0285896 | NA | |||
| Strain, strain background (D. melanogaster) | Oregon R | BloomingtonDrosophilaStock Center | BDSC: 5 | NA | |||
| Strain, strain background (L. boulardi) | Leptopilina boulardi | BloomingtonDrosophilaStock Center | PMID:17967061 | Strain G486 | |||
| Genetic reagent (D. melanogaster) | HmlΔ-GAL4; UAS-2XEGFP | BloomingtonDrosophilaStock Center | BDSC: 30140; FLYB: FBst0030140 | FLYB genotype: w1118; P{Hml-GAL4.Δ}2, P{UAS-2xEGFP}AH2 | |||
| Genetic reagent (D. melanogaster) | Hml-GAL4-Lineage Trace (HLT)-GAL4 | Dr. Utpal Banerjee | PMID:22134547 | Hml-Gal4 UAS-FLP, ubi-FRT-STOP-FRT-Gal4 | |||
| Genetic reagent (D. melanogaster) | lz-GAL4; UAS-GFP | BloomingtonDrosophilaStock Center | BDSC: 6314; FLYB: FBst0006314 | FLYB genotype: y1 w* P{UAS-mCD8::GFP.L}Ptp4ELL4 P{GawB}lzgal4 | |||
| Genetic reagent (D. melanogaster) | E(spl)m3-HLH-GAL4 | BloomingtonDrosophilaStock Center | BDSC: 46517; FLYB: FBst0046517 | FLYB genotype: w1118; P{GMR10E12-GAL4}attP2 | |||
| Genetic reagent (D. melanogaster) | Drip-GAL4 | BloomingtonDrosophilaStock Center | BDSC: 66782; FLYB: FBst0066782 | FLYB genotype: y1 w*; Mi{Trojan-GAL4.0}DripMI00887-TG4.0/SM6a | |||
| Genetic reagent (D. melanogaster) | btl-GAL4 | Perrimon Lab stock | NA | Genotype: yw; UAS-GFPN-lacZ(2-1)/CyO; btl-Gal4(3-1)/TM3 Sb Ser | |||
| Genetic reagent (D. melanogaster) | bnl-LexA | Dr. Sougata Roy | PMID:28502613 | bnl-LexA/TM6 | |||
| Genetic reagent (D. melanogaster) | Ubi-GAL4 | Dr. Utpal Banerjee | PMID:24267893 | Ubiquitin-GAL4 | |||
| Genetic reagent (D. melanogaster) | BcF6-mCherry | Dr. Robert Schulz | PMID:27913635 | BcF6-mCherry (III) | |||
| Genetic reagent (D. melanogaster) | msn-mCherry | Dr. Robert Schulz | PMID:27913635 | MSNF9mo-mCherry (III) | |||
| Genetic reagent (D. melanogaster) | srp-GAL4 | Dr. Lucas Waltzer | PMID:14657024 | NA | |||
| Genetic reagent (D. melanogaster) | LexAOp-myr-GFP | BloomingtonDrosophilaStock Center | BDSC:32210; FLYB: FBst0032210 | FLYB genotype: P{13XLexAop2-IVS-myr::GFP}attP40 | |||
| Genetic reagent (D. melanogaster) | LexAOp-mCherry | BloomingtonDrosophilaStock Center | BDSC:52271; FLYB: FBst0052271 | FLYB genotype: y1 w*; wgSp-1/CyO, P{Wee-P.ph0}BaccWee-P20; P{13XLexAop2-6XmCherry-HA}attP2 | |||
| Genetic reagent (D. melanogaster) | UAS-mCD8- GFP | BloomingtonDrosophilaStock Center | BDSC: 5137; FLYB: FBst0005137 | FLYB genotype: y1 w*; P{UAS-mCD8::GFP.L}LL5, P{UAS-mCD8::GFP.L}2 | |||
| Genetic reagent (D. melanogaster) | UAS-poloRNAi | BloomingtonDrosophilaStock Center | BDSC: 33042; FLYB: FBst0033042 | FLYB genotype: y1 sc* v1 sev21; P{TRiP.HMS00530}attP2 | |||
| Genetic reagent (D. melanogaster) | UAS-btlRNAi-1 | BloomingtonDrosophilaStock Center | BDSC: 43544; FLYB: FBst0043544 | FLYB genotype: y1 sc* v1 sev21; P{TRiP.HMS02656}attP40 | |||
| Genetic reagent (D. melanogaster) | UAS-btlRNAi-2 | BloomingtonDrosophilaStock Center | BDSC: 60013; FLYB: FBst0060013 | FLYB genotype: y1 v1; P{TRiP.HMS05005}attP40 | |||
| Genetic reagent (D. melanogaster) | UAS-empty | Dr. Hugo Bellen | PMID:27640307 | UAS-empty (III) | |||
| Transfected construct (D. melanogaster) | NA | NA | NA | NA | |||
| Biological sample (D. melanogaster) | larval hemolymph (blood) | NA | NA | Hemocytes from hemolymph of third instar (96 and 120 hr AEL) larvae | |||
| Antibody | L1abc (mouse monoclonal) | Prof. Istvan Andó | PMID:18297797 | 1:100 dilution | |||
| Antibody | anti-PPO2 (mouse monoclonal) | Prof. Istvan Andó | PMID:18297797 | 1:1000 dilution | |||
| Antibody | anti-Hindsight (mouse monoclonal) | Developmental Studies Hybridoma Bank | Cat# 1G9 | 1:10 dilution | |||
| Antibody | anti-Mys (mouse monoclonal) | Developmental Studies Hybridoma Bank | Cat# CF-6G11 | 1:10 dilution | |||
| Recombinant DNA reagent | NA | NA | NA | NA | |||
| Sequence-based reagent | CecC (primer) | FlyPrimerBank | PD41779 | For: GCATTGGACAATCGGAAGCC Rev: TTGCGCAATTCCCAGTCCTT | |||
| Sequence-based reagent | Drs (primer) | FlyPrimerBank | PD40133 | For: CTGGGACAACGAGACCTGTC Rev: ATCCTTCGCACCAGCACTTC | |||
| Sequence-based reagent | Mtk (primer) | FlyPrimerBank | PD41985 | For: GCTACATCAGTGCTGGCAGA Rev: TTAGGATTGAAGGGCGACGG | |||
| Sequence-based reagent | CG43236 (primer) | FlyPrimerBank | PD41670 | For: GCAAGAGTTTGGATGCCACC Rev: GCCTCATATCGAAAGGATTGCG | |||
| Sequence-based reagent | stg (primer) | FlyPrimerBank | PB60117 | For: GAAAACAACTGCAGCATGGAT Rev: CGACAGCTCCTCCTGGTC | |||
| Sequence-based reagent | polo (primer) | FlyPrimerBank | PP7029 | For: CCCGAGGATAAGAGCACGGA Rev: GTCGTCGGTTTCCACATCG | |||
| Sequence-based reagent | MMP1 (primer) | FlyPrimerBank | PP18419 | For: CCAGTTCGGCTATCTACCCG Rev: CTCGATGGCACTCACCCAG | |||
| Sequence-based reagent | Ance (primer) | FlyPrimerBank | PP22471 | For: GTGATACCACCAAGTTCCAATGG Rev: GGCATAGTCGTCTTCAGGTAGAG | |||
| Sequence-based reagent | GstE6 (primer) | FlyPrimerBank | PP10905 | For: TACGGTTTGGACCCCAGTC Rev: ATATTCCGGTGAAAGTTGGGC | |||
| Sequence-based reagent | Arc1 (primer) | FlyPrimerBank | PP10071 | For: ATGGCCCAGCTTACACAGATG Rev: GGAGAAGTTGCCTTTGCCTC | |||
| Sequence-based reagent | Prx2540-1 (primer) | FlyPrimerBank | PD40349 | For: ATGATCCTGCCCACTGTCAC Rev: CAGTGGTGCGGACGTAGTTT | |||
| Sequence-based reagent | Ubx (primer) | FlyPrimerBank | PP12922 | For: ATGAACTCGTACTTTGAACAGGC Rev: CCAGCGAGAGAGGGAATCC | |||
| Sequence-based reagent | Cpx (primer) | FlyPrimerBank | PD40622 | For: CGCGAGAAGATGAGGCAAGA Rev: CATCAGGGGATTGGGCTCTT | |||
| Sequence-based reagent | mthl7 (primer) | FlyPrimerBank | PP15001 | For: AGTTTGGGGACGGTTCGATTA Rev: TGAGACCATCATCGCATTTTCC | |||
| Sequence-based reagent | Cys (primer) | FlyPrimerBank | PP22082 | For: GGATGCCACTCTCGCACAG Rev: GGTGTTAAGACTTCCAGCTACG | |||
| Sequence-based reagent | bnl (primer) | NA | NA | For: AACCCAAATCCAATCCCAAT Rev: GATGCTGTTGCTGTTGCTGT | |||
| Sequence-based reagent | btl (primer) | NA | NA | For: GAGTCGATCCCTGAAGTTGC Rev: GCAGTTGCCCCACTGTTAAT | |||
| Sequence-based reagent | RpL32/rp49 (primer) | FlyPrimerBank | PD41810 | For: AGCATACAGGCCCAAGATCG Rev: TGTTGTCGATACCCTTGGGC | |||
| Peptide, recombinant protein | NA | NA | NA | NA | |||
| Commercial assay or kit | Chromium Single Cell 3’ Library and Gel Bead Kit v2 | 10x Genomics | PN-120267 | NA | |||
| Commercial assay or kit | Chromium i7 Multiplex Kit | 10x Genomics | PN-120262 | NA | |||
| Commercial assay or kit | Chromium Single Cell A Chip Kit | 10x Genomics | PN-1000009 | NA | |||
| Chemical compound, drug | NA | NA | NA | NA | |||
| Software, algorithm | Seurat | Stuart et al., 2019 | PMID:31178118 | NA | |||
| Software, algorithm | Harmony | Korsunsky et al., 2019 | PMID:31740819 | NA | |||
| Software, algorithm | Monocle 3 | Cao et al., 2019 | PMID:30787437 | NA | |||
| Software, algorithm | Jalview | Waterhouse et al., 2009 | PMID:19151095 | NA | |||
| oftware, algorithm | Biorender | https://biorender.com/ | NA | Biorender was utilized to make the schematic diagrams used in this study. | |||
| Other | DAPI (nuclear stain) | Vector Laboratories | Cat# H-1200 | Ready to use | |||
| Other | Phalloidin | ThermoFischer | Cat# A34055 | 1:100 dilution | |||
| Other | Optiprep | AxisShield | AXS-1114542 | Working concentration: 1.09 g/ml | |||
| Other | SyBr Green | Bio-Rad iQ SYBR Green Supermix | Cat# 1708880 | Working concentration: 1X | |||
Additional files
-
Supplementary file 1
Table representing number of cells, genes, reads, and unique molecular identifiers (UMIs) recovered per cell per sample.
- https://cdn.elifesciences.org/articles/54818/elife-54818-supp1-v2.xlsx
-
Supplementary file 2
Table representing the top marker genes per cluster pertaining to Figure 1C and D. One cluster per sheet.
- https://cdn.elifesciences.org/articles/54818/elife-54818-supp2-v2.xlsx
-
Supplementary file 3
Table representing the Differentially Expressed Genes per cluster across all conditions pertaining to Figure 2 and its supplement.
- https://cdn.elifesciences.org/articles/54818/elife-54818-supp3-v2.xlsx
-
Supplementary file 4
Table representing differentially expressed genes across all conditions in PPO1low and PPO1highcrystal cells.
- https://cdn.elifesciences.org/articles/54818/elife-54818-supp4-v2.xlsx
-
Supplementary file 5
Table representing differentially expressed genes across all conditions in lamellocyte clusters.
- https://cdn.elifesciences.org/articles/54818/elife-54818-supp5-v2.xlsx
-
Supplementary file 6
Table representing the gene enrichment analysis pertaining to Figure 6A and Figure 3—figure supplement 2F.
- https://cdn.elifesciences.org/articles/54818/elife-54818-supp6-v2.xlsx
-
Transparent reporting form
- https://cdn.elifesciences.org/articles/54818/elife-54818-transrepform-v2.docx
Download links
A two-part list of links to download the article, or parts of the article, in various formats.
Downloads (link to download the article as PDF)
Open citations (links to open the citations from this article in various online reference manager services)
Cite this article (links to download the citations from this article in formats compatible with various reference manager tools)
A single-cell survey of Drosophila blood
eLife 9:e54818.
https://doi.org/10.7554/eLife.54818


