Stimulus-dependent relationships between behavioral choice and sensory neural responses
- Neural Computation Laboratory, Center for Neuroscience and Cognitive Systems@UniTn, Istituto Italiano di Tecnologia, Italy
- Department of Neurobiology, Harvard Medical School, United States
- Brain and Cognitive Sciences, Center for Visual Science, University of Rochester, United States
Figures
Figure 1
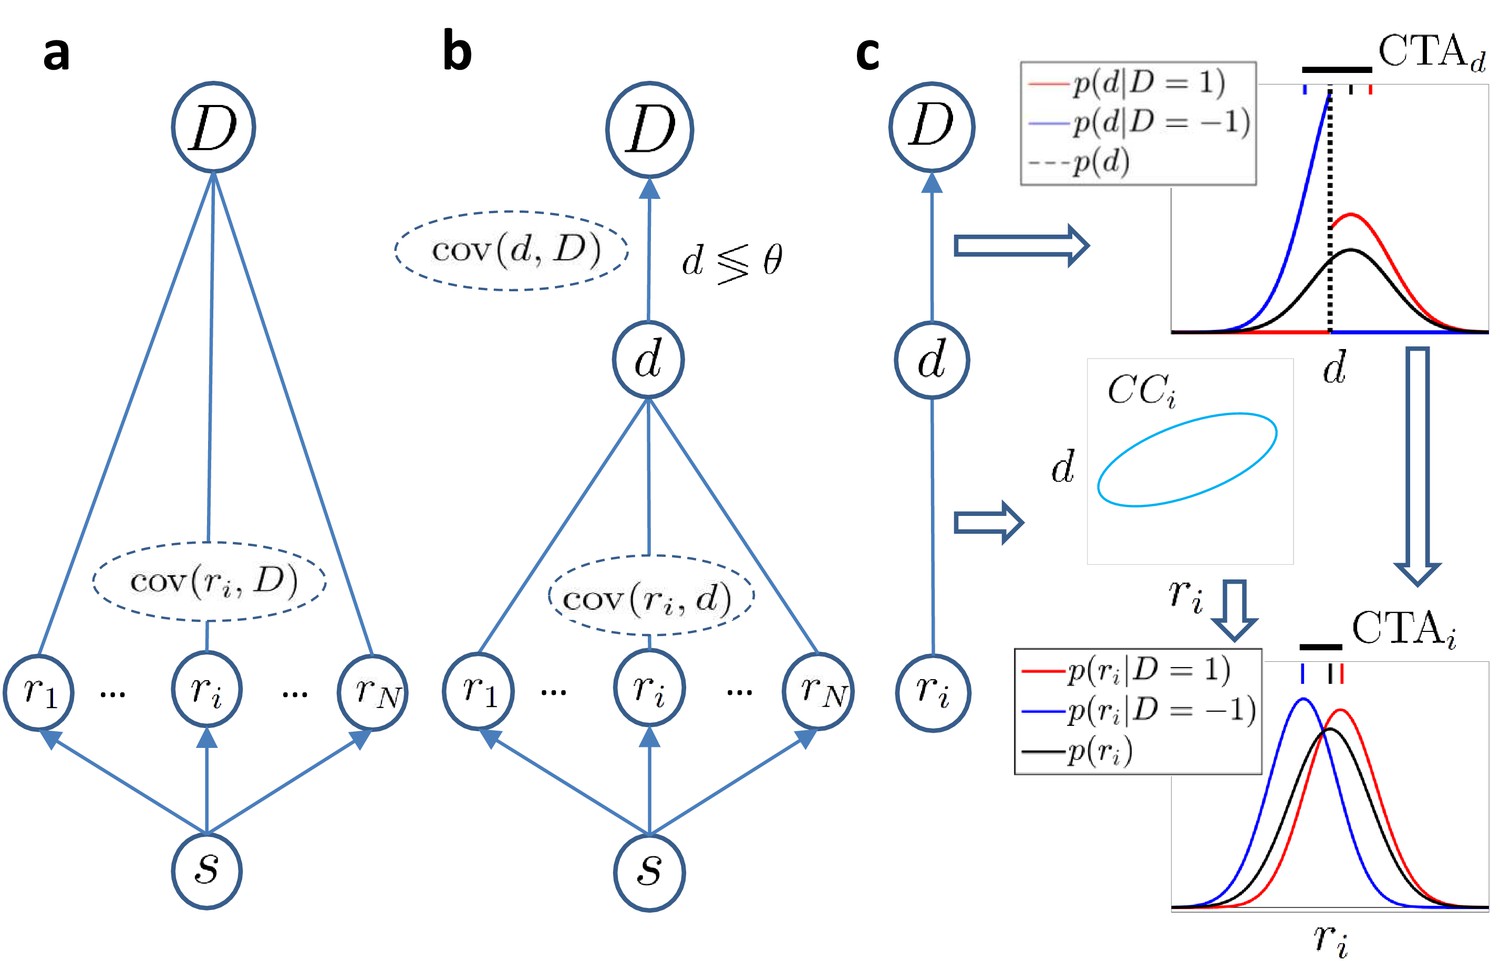
Models of choice probabilities.
Arrows indicate causal influences. Undirected edges indicate relationships that may be due to feedforward, feedback, and/or common inputs. (a) A model agnostic to the causal origin of the choice–response covariation: the response of sensory neurons encoding a stimulus covaries with choice . (b) Threshold model with a continuous decision variable mediating the relationship between responses and choice. The binary decision is made comparing to a threshold θ. (c) The threshold mechanism (vertical dashed black line) dichotomizes the -space, resulting in a difference between the means of the conditional distributions associated with (red and blue vertical dashes on top of figure). This difference is quantified by (horizontal thick black line) and implies a non-zero difference between the choice-triggered average responses () in the presence of a correlation, , between and ri.
Figure 2
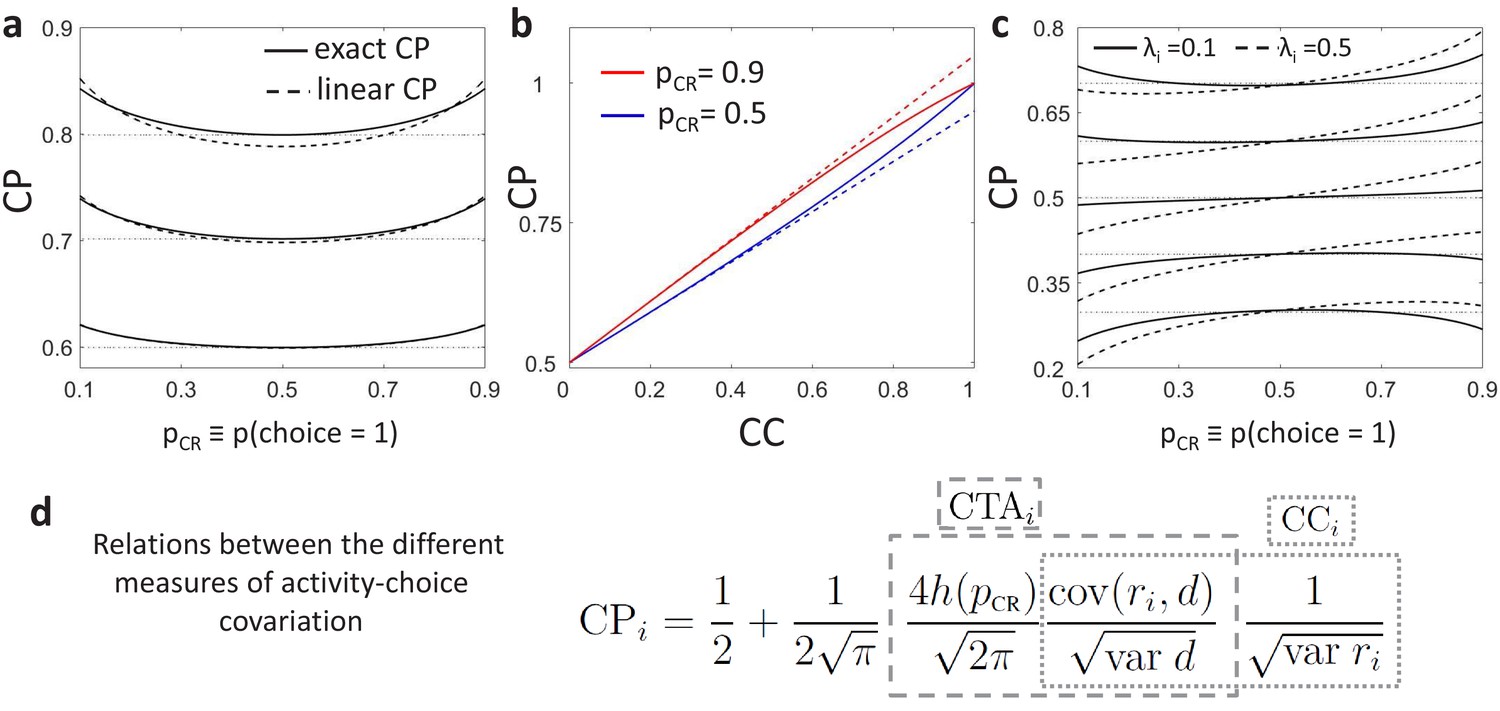
Predictions for stimulus dependencies from the threshold model.
(a) CP dependence on through the threshold-induced factor . Results are shown for three values of a stimulus-independent choice correlation, , isolating the shape of from other stimulus dependencies. Solid curves represent the exact solution of the CP obtained from our model (see Methods, Equation 16) and dashed curves its linear approximation (Equation 7). (b) Comparison of the exact solution of the CP (solid) and its linear approximation (dashed), as a function of the magnitude of a stimulus-independent choice correlation. Results are shown for two values of , 0.5 and 0.9. (c) CP dependence on when together with the factor stimulus dependencies also appear through stimulus-dependent choice correlations induced by response gain fluctuations (Equation 11). Results are shown for five values of (dotted horizontal lines) and in each case for two values of , the fraction of the variance of a cell caused by the gain fluctuations (Methods). (d) Summary of the derived relationships as provided by Equations 4-7.
Figure 3
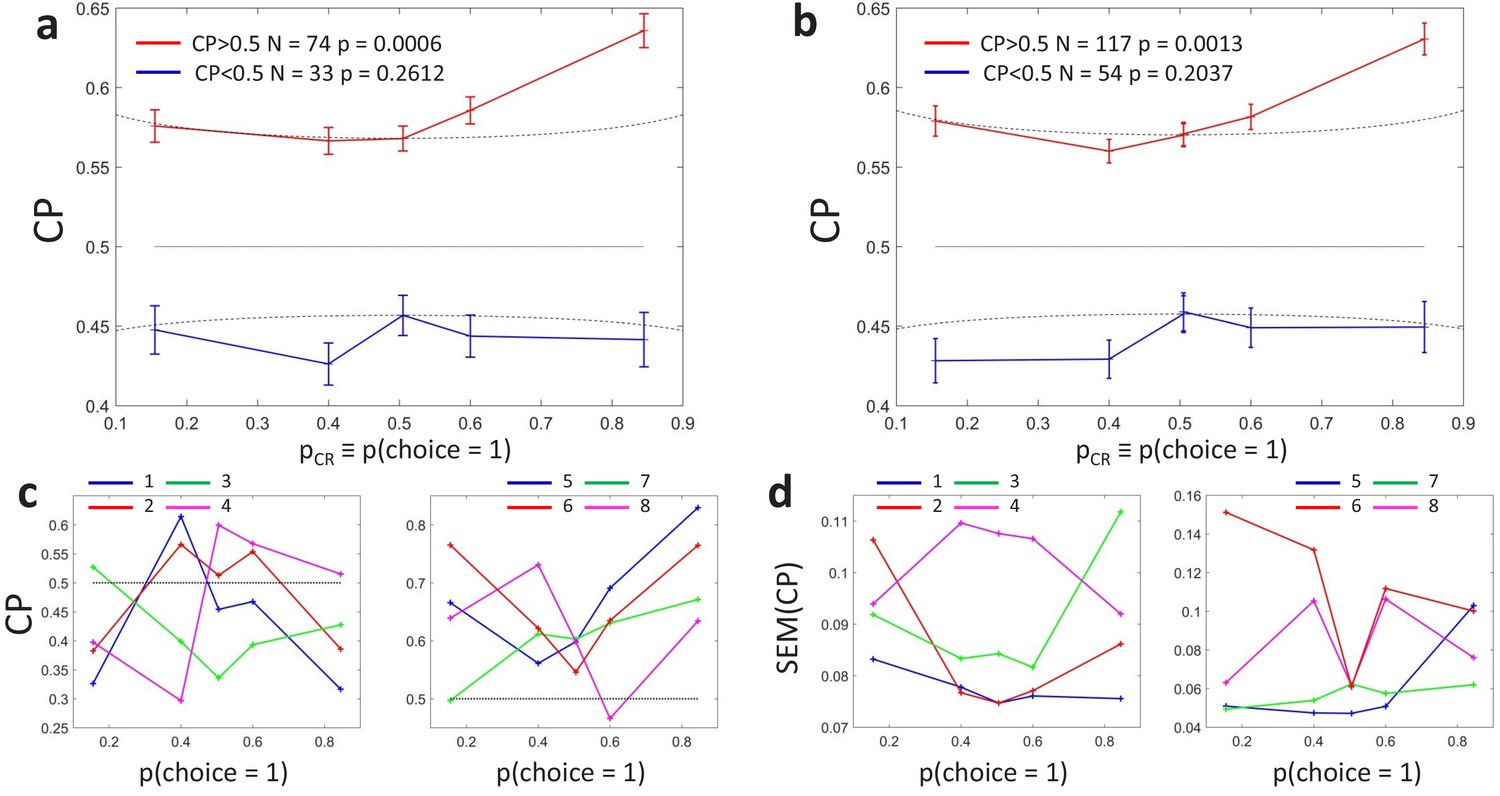
Choice probability as a function of the choice rate for MT cells during a motion direction discrimination task (Britten et al., 1996).
(a) Average CP as a function of . The average across cells was calculated separately for cells with average CP higher or lower than 0.5. Dotted curves reflect the relationship predicted by the factor (Equation 6). Significance of the stimulus dependencies was evaluated against the null hypothesis of a constant CP value using surrogate data (see Methods). (b) Same analysis but with a less strict inclusion criterion (see main text). (c) profile for four example cells with average CP lower and higher than 0.5, respectively. (d) Standard errors of the estimated CP for the example cells as a function of .
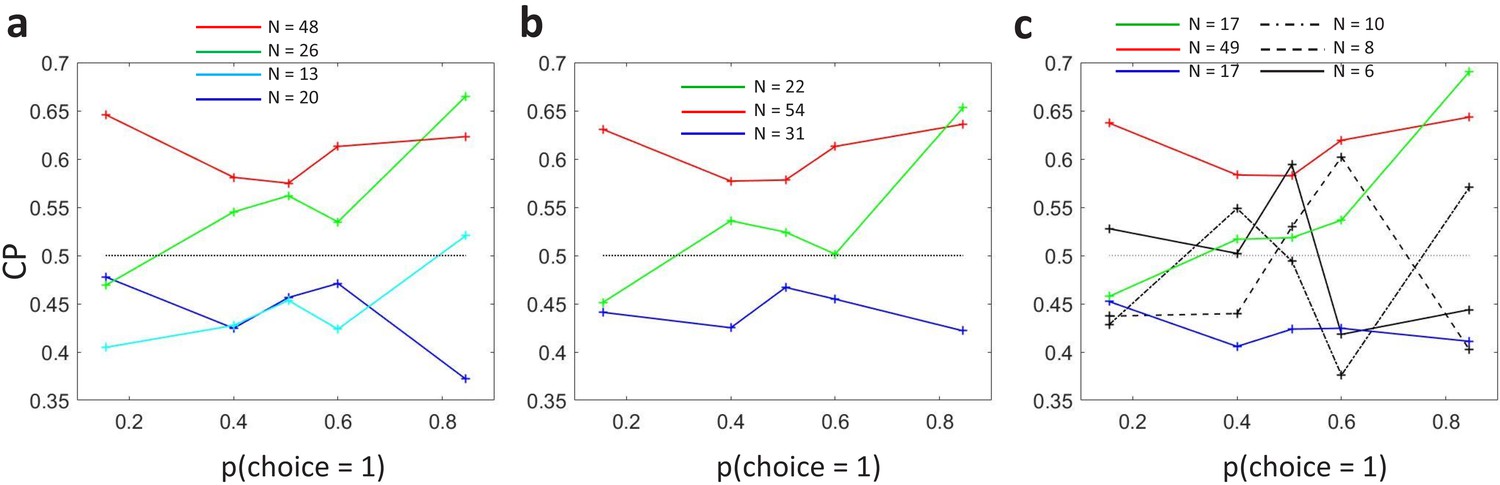
Figure 4
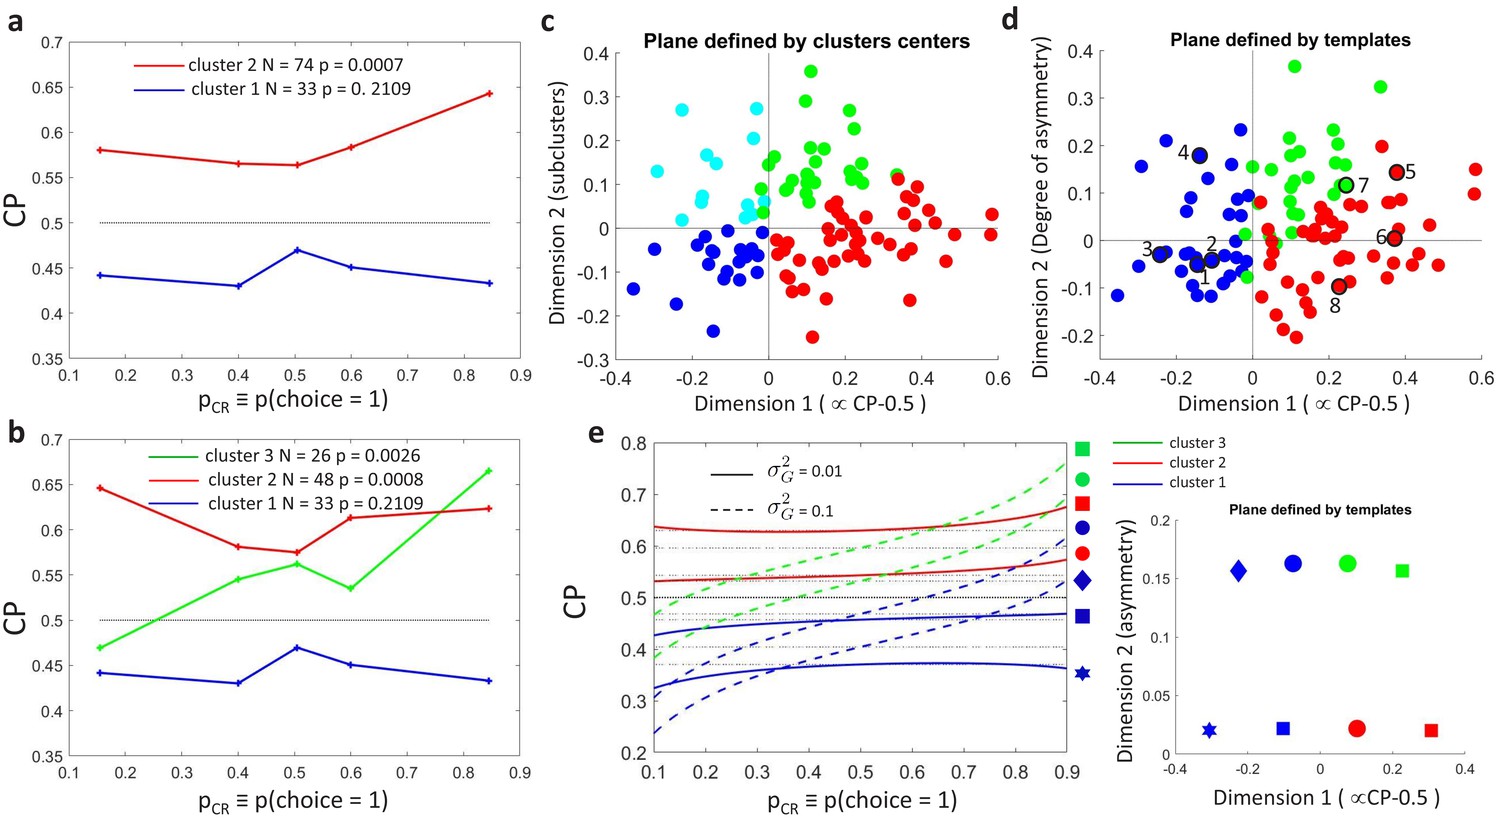
Clustering analysis of choice probability as a function of .
(a–b) CP as a function of for clusters of the MT cells determined by -means clustering. Each profile corresponds to the center of a cluster. Significance of the modulation was quantified as in Figure 3. (a) Two clusters () for all cells. (b) Further subclustering of cells with average into two subclusters. (c) Representation of the profiles in a two-dimensional space spanned by the cluster means. The horizontal axis is defined by clusters 1 and 2 and closely aligned with . Vertical axis is defined as perpendicular to horizontal axis in the plane defined by the subcluster means. Colors correspond to the clusters of panel b, with blue and cyan further indicating subclusters of cells with average (see Appendix 3—figure 1A). (d) Space defined by projection onto two templates: a constant relationship (x-axis) representing the magnitude of , and a monotonic relationship with slope 1 (y-axis) representing CP asymmetry. Colors correspond to the clusters of panel b and numbers indicate example cells shown in Figure 3C. (e) Modeling the influence of neuronal gain modulation on profiles. profiles for different combinations of strength of the gain fluctuations, , and the choice correlation that would be obtained for the uninformative stimulus s0 with no gain fluctuations, . We display for four values of (curves vertically separated) and two values of (solid vs dashed). Each curve corresponds to a point in the two-dimensional space defined by the symmetric and asymmetric templates introduced in panel b. See Methods for model details.
Figure 5
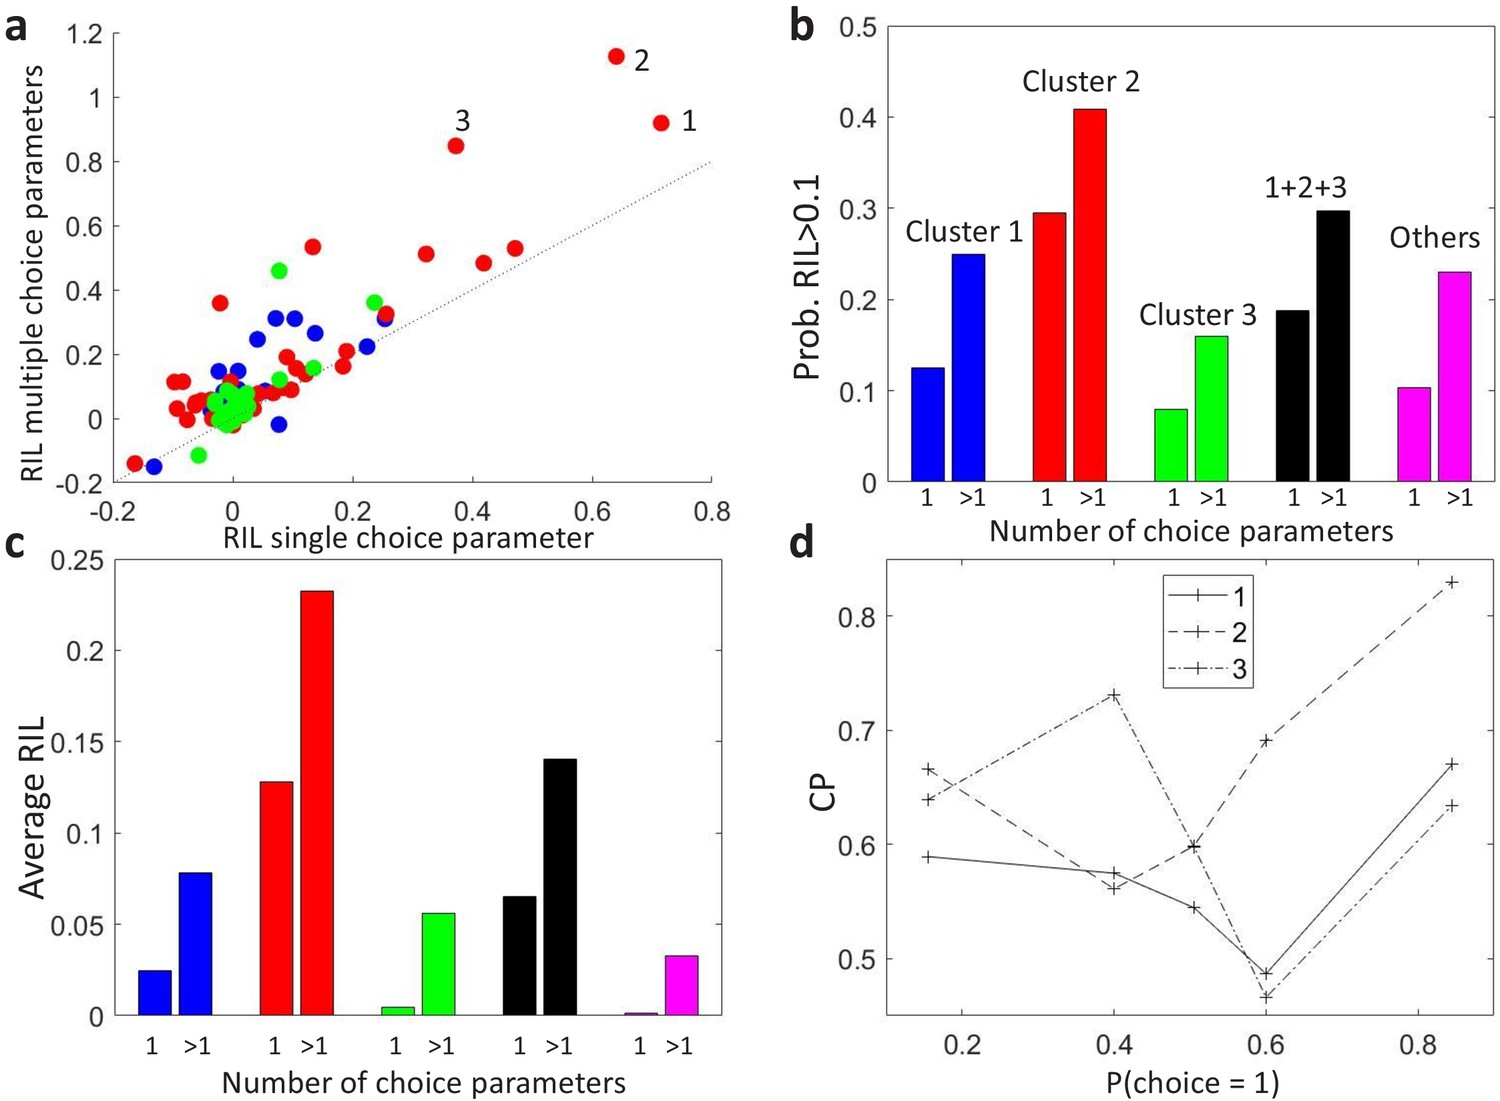
Modeling stimulus-dependent choice-related signals with GLMs.
(a) Scatter plot of the cross-validated relative increase in likelihood (RIL), with respect to a stimulus-only model, of the stimulus-dependent-choice GLMs (multiple choice parameters) versus the stimulus-independent-choice GLMs (a single choice parameter). (b) Proportion of cells with RIL>0.1 for the two types of models, grouped by the clusters as in Figure 4B. Cells not included in the set of 107 cells for which a CP value could be estimated for each bin of are labeled as ‘Others’. (c) Average RIL values, grouped as in b. (d) profiles of the three cells with the highest RIL in the stimulus-dependent-choice GLMs, as numbered in panel a.
Appendix 1—figure 1
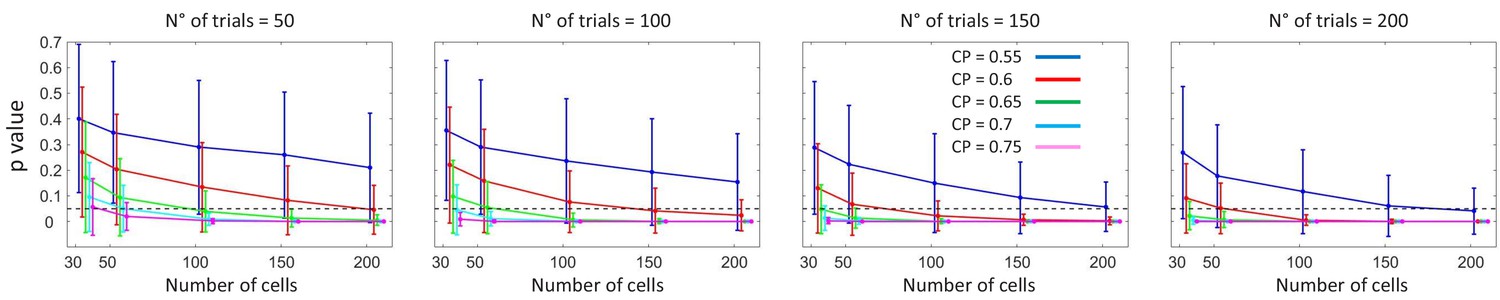
Statistical power for the detection of threshold-induced CP stimulus dependencies.
For cell responses generated from the threshold model (see text for details), the figure characterizes the p-values obtained in the surrogates test used to assess the presence of a symmetric modulation of the CP, with increased CP values for unbalanced choice rates. Each panel presents the p-values as a function of the number of cells included to calculate an averaged profile, and of the value. Curves corresponding to different CP values are shifted for a better visualization of the error bars (standard deviation of the p-value across 500 simulations). The horizontal dashed line indicates the threshold of significance .
Appendix 3—figure 1
Subclustering of dependencies.
(a) Analogous to Figure 4B but showing also the average profiles for the two subclusters obtained from cells with average . (b) Nonparametric -means clustering with three clusters determined from all cells. (c) Nonparametric -means clustering with six clusters determined from all cells. The clusters more similar to the ones of Figure 4B are correspondingly coloured.
Appendix 4—figure 1
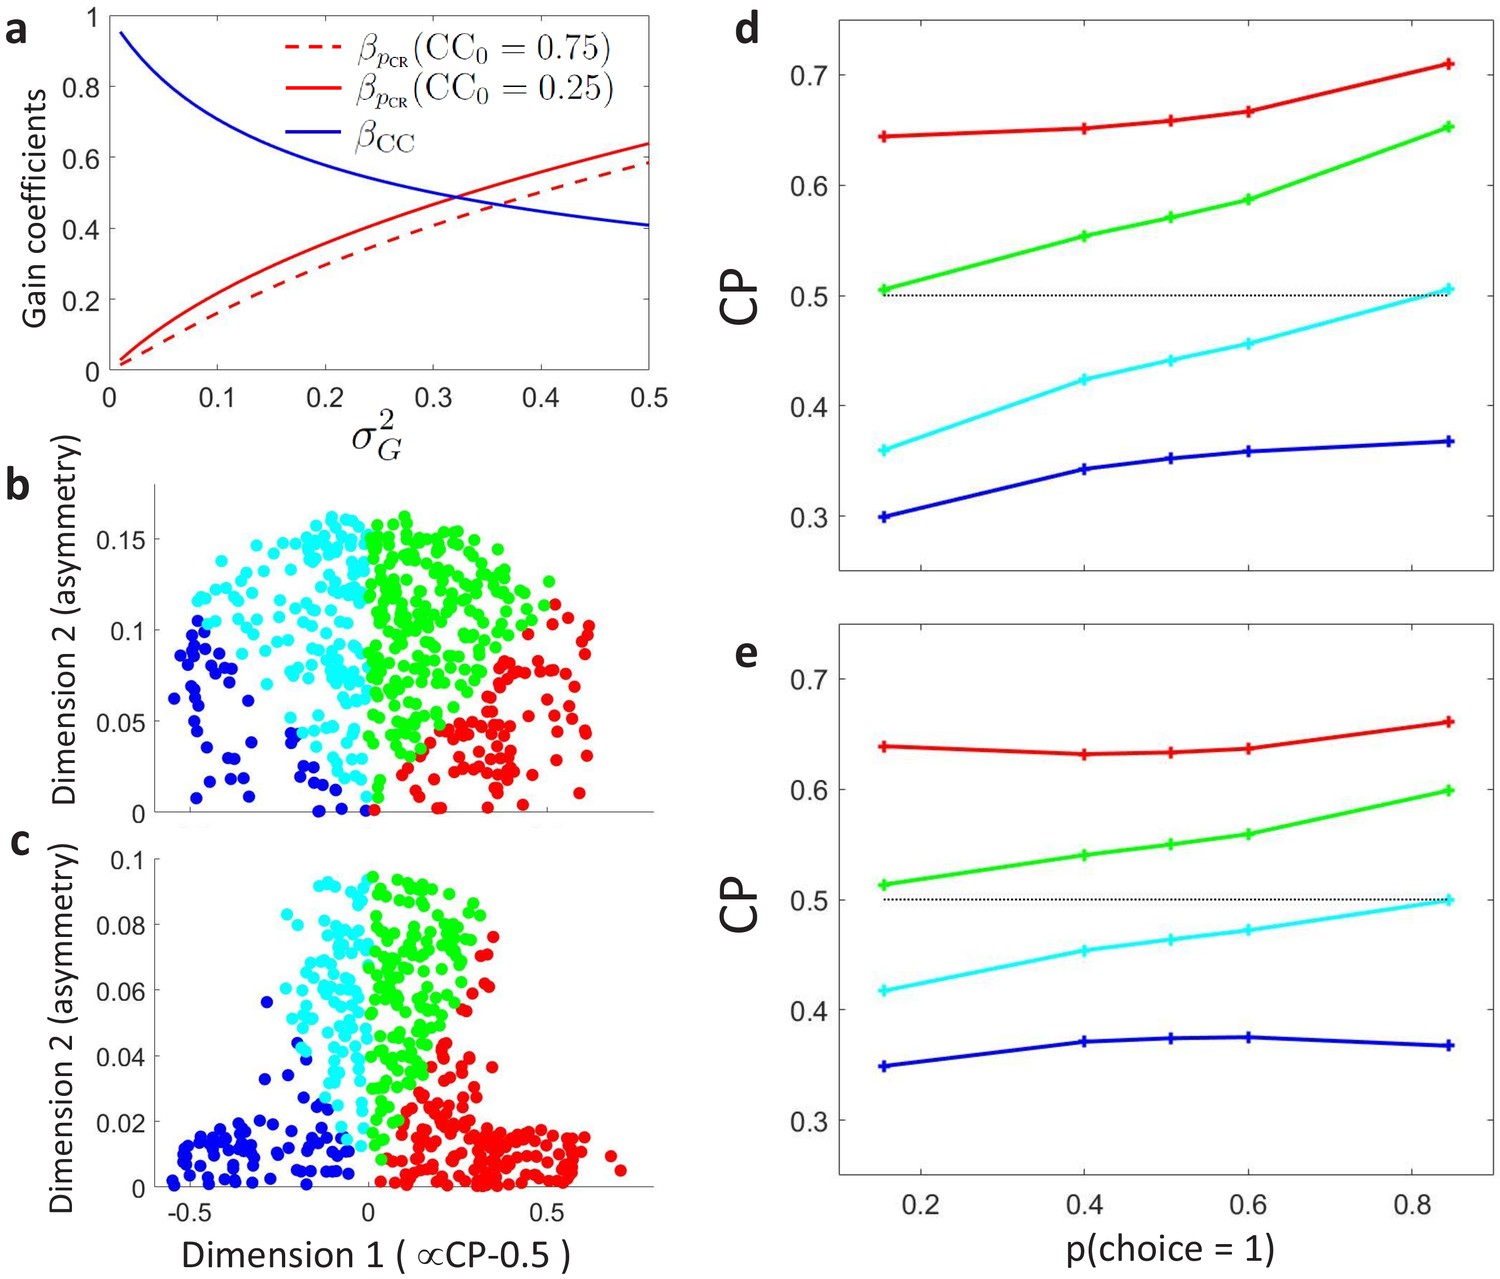
Modeling the influence of neuronal gain modulation on profiles.
(a) Dependence of gain coefficients and (Equations 23) on the strength of the gain fluctuations, determines their effect on the choice correlation for the uninformative stimulus s0. determines the degree of asymmetry of the choice correlation dependence on the . (b) profiles, represented in the same 2-D space as in Figure 4D,E, generated with a uniform sampling of consistent with the observed average CPs of the MT cells, and with a uniform sampling of the gain (). (c) Analogous to b, but with a nonuniform distribution in the 2-D space, reflecting structure in the covariation of and . (d–e) profiles corresponding to the clusters centers obtained when sampling the space according to panels b and c, respectively.
Author response image 1
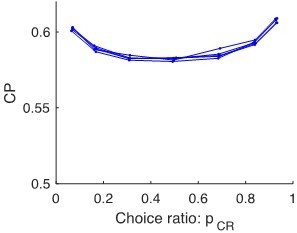
5 runs simulating 30 Poisson neurons, spiking an average of 5 spikes/trial.
For larger populations, and for higher spike counts, our approximations will be even better.
Additional files
Download links
A two-part list of links to download the article, or parts of the article, in various formats.
Downloads (link to download the article as PDF)
Open citations (links to open the citations from this article in various online reference manager services)
Cite this article (links to download the citations from this article in formats compatible with various reference manager tools)
Stimulus-dependent relationships between behavioral choice and sensory neural responses
eLife 10:e54858.
https://doi.org/10.7554/eLife.54858


