Par protein localization during the early development of Mnemiopsis leidyi suggests different modes of epithelial organization in the metazoa

  1. Miguel Salinas-Saavedra  Is a corresponding author
  2. Mark Q Martindale  Is a corresponding author
  1. The Whitney Laboratory for Marine Bioscience, and the Department of Biology, University of Florida, United States

Abstract

In bilaterians and cnidarians, epithelial cell-polarity is regulated by the interactions between Par proteins, Wnt/PCP signaling pathway, and cell-cell adhesion. Par proteins are highly conserved across Metazoa, including ctenophores. But strikingly, ctenophore genomes lack components of the Wnt/PCP pathway and cell-cell adhesion complexes raising the question if ctenophore cells are polarized by mechanisms involving Par proteins. Here, by using immunohistochemistry and live-cell imaging of specific mRNAs, we describe for the first time the subcellular localization of selected Par proteins in blastomeres and epithelial cells during the embryogenesis of the ctenophore Mnemiopsis leidyi. We show that these proteins distribute differently compared to what has been described for other animals, even though they segregate in a host-specific fashion when expressed in cnidarian embryos. This differential localization might be related to the emergence of different junctional complexes during metazoan evolution.

Introduction

In bilaterians and cnidarians, a polarized epithelium is classically defined as a group of polarized cells joined by belt-like cell-cell junctions and supported by a basement membrane (Magie and Martindale, 2008; St Johnston and Sanson, 2011; Thompson, 2013; Ohno et al., 2015; Salinas-Saavedra et al., 2015). While the asymmetric cortical distribution of the Wnt Planar Cell Polarity (PCP) pathway components polarizes the cells along the tissue plane, the asymmetric cortical distribution of Par system components polarizes the cells along the apical-basal axis (St Johnston and Sanson, 2011; Thompson, 2013; Gumbiner and Kim, 2014; Besson et al., 2015; Yang and Mlodzik, 2015; Ahmed and Macara, 2016; Aigouy and Le Bivic, 2016; Butler and Wallingford, 2017; Davey and Moens, 2017; Salinas-Saavedra et al., 2015; Fanto and McNeill, 2004; St Johnston and Ahringer, 2010; Cha et al., 2011; Kumburegama et al., 2011; Nance and Zallen, 2011; Momose et al., 2012; Wallingford, 2012). The mechanisms that organize cell-polarity are highly conserved in all animals that have been studied and most likely been present in the most recent common ancestor (MRCA) of Cnidaria and Bilateria (Thompson, 2013; Salinas-Saavedra et al., 2015; Kumburegama et al., 2011; Momose et al., 2012; Fahey and Degnan, 2010; Ragkousi et al., 2017; Salinas-Saavedra et al., 2018; Belahbib et al., 2018; Figure 1A).

Figure 1 with 3 supplements see all
Evolution of cell polarity components during animal evolution.

(A) Three major evolutionary steps (left side) that might have changed the organization of cell polarity in the Metazoa. The diagram (right side) depicts the subcellular asymmetric localization of Par proteins in Cnidaria and Bilateria. However, there are no previous descriptions available for ctenophore cells. (B) The stereotyped early development of M. leidyi.

Interestingly, ctenophores or comb jellies, whose position at the base of metazoan tree is still under debate (Dunn et al., 2008; Hejnol et al., 2009; Ryan et al., 2013; Moroz et al., 2014; Whelan et al., 2017), (Simion et al., 2017), (Feuda et al., 2017), possess a stereotyped development (Figure 1B) and do not have the genes that encode the components of the Wnt/PCP pathway in their genomes (Ryan et al., 2013). Thus, the study of the subcellular organization of the Par system components in ctenophores is important to understand the evolution of tissue organization in Metazoa.

The asymmetric localization of the Crumbs (Crb) complex, (e.g. Crb/Pals1/Patj), the Par/aPKC complex (e.g. Par-3/aPKC/Par-6), and the Scribble complex (e.g. Scribble/Lgl/Dlg) in the cortex of bilaterian and cnidarian cells maintains epithelial integrity by stabilizing cell-cell junctions (Ohno et al., 2015; Salinas-Saavedra et al., 2015; Fahey and Degnan, 2010; Salinas-Saavedra et al., 2018; Belahbib et al., 2018) via the Cadherin-Catenin complex (CCC) of mature Adherens Junctions (AJs) (Magie and Martindale, 2008; Belahbib et al., 2018; Harris and Peifer, 2004; Nelson and Nusse, 2004; McGill et al., 2009; Oda and Takeichi, 2011; Schäfer et al., 2014; Weng and Wieschaus, 2016). The maturation of AJs is essential for the maintenance of the Par/aPKC complex localization at the apical cortex that displaces members of the Scribble complex and Par-1 to basolateral localizations associated with Septate Junctions (SJs) (Belahbib et al., 2018; Benton and St Johnston, 2003; Hurov et al., 2004; Zhang et al., 2007; Iden and Collard, 2008; Yamanaka and Ohno, 2008; Oshima and Fehon, 2011; Ganot et al., 2015; Humbert et al., 2015; Kharfallah et al., 2017).

This mechanism is deployed in bilaterian cells to establish embryonic and epithelial cell polarity during early development and is critical for axial organization (Salinas-Saavedra et al., 2015; Cha et al., 2011; Munro, 2006; Patalano et al., 2006; Goldstein and Macara, 2007; Weisblat, 2007; Alford et al., 2009; Munro and Bowerman, 2009; Doerflinger et al., 2010; Chan and Nance, 2013; Lang and Munro, 2017; Tepass, 2012; Nance and Zallen, 2011; Weng and Wieschaus, 2017; Zhu et al., 2017; Ragkousi et al., 2017; Salinas-Saavedra et al., 2018; Schneider and Bowerman, 2003; Macara, 2004; Vinot et al., 2004; Dollar et al., 2005; Ossipova et al., 2005). Components of the Par system are unique to, and highly conserved, across Metazoa, including placozoans, poriferans, and ctenophores (Fahey and Degnan, 2010; Belahbib et al., 2018). But strikingly, ctenophore genomes do not have many of the crucial regulators present in other metazoan genomes (Belahbib et al., 2018; Ganot et al., 2015). For example, none of the components of the Crb complex, a Scribble homolog, or Human and Drosophila SJs, are present (Belahbib et al., 2018; Ganot et al., 2015), and the cytoplasmic domain of cadherin lacks the crucial biding sites to catenins that interact with the actin cytoskeleton (Belahbib et al., 2018). These data raise the question of whether or not ctenophore cells are polarized by mechanisms involving the apicobasal cell polarity mediated by Par proteins. Here, by using antibodies raised to specific ctenophore proteins and confirmed by live-cell imaging of injected fluorescently labeled mRNAs, we describe for the first time the subcellular localization of selected components of the Par system during the development of the ctenophore Mnemiopsis leidyi. Data obtained here challenge the conservation of the apicobasal cell polarity module and raise questions about the epithelial tissue organization as an evolutionary trait of all metazoans.

Results

MlPar-6 gets localized to the apical cortex of cells during early M. leidyi development

We characterized the subcellular localization of the MlPar-6 protein during early M. leidyi development by using our specific MlPar-6 antibody (Figure 2 and Figure 2—figure supplements 16). Although MlPar-6 immunoreactivity can be detected in the periphery of the entire cell, in all of over 100 specimens examined, its expression appears to be polarized to the animal cortex (determined by the position of the zygotic nucleus; Figure 2A and Figure 2—figure supplements 810) of the single cell zygote and to the apical (animal) cell cortex during every cleavage stage (Figure 2 and Figure 2—figure supplement 3). At the cortex, MlPar-6 localizes to cell-contact-free regions facing the external media (Figure 2C). Gradually through the next three hours of development, MlPar-6 becomes localized to the position of cell-cell contacts by 60 cell stage onwards (Figure 2—figure supplements 3E–G and 4). During gastrulation (3–7 hpf; Figure 2D and Figure 2—figure supplements 34), MlPar-6 is not localized in cells undergoing cellular movements including the oral (four hpf; Figure 2—figure supplement 3G) and aboral ectoderm (5–6 hpf; Figure 2D) undergoing epibolic movements, syncytial endoderm, and mesenchymal ‘mesoderm’ (quotation marks its debatable homology). However, this protein remains polarized in ‘static’ ectodermal cells remaining at the animal pole (blastopore) and vegetal pole (4–7 hpf; Figure 2—figure supplements 3F–J and 4). By the end of gastrulation (8–9 hpf; Figure 2E), MlPar-6 becomes localized asymmetrically to the apical cortex of the ectodermal epidermal cells and the future ectodermal pharyngeal cells that start folding inside the blastopore (Figure 2E and Figure 2—figure supplement 5A–C). Interestingly, we do not observe a clear cortical localization in later cydippid stages, and the antibody signal is weaker after 10 hpf in juveniles (Figure 2F). Contrary to expectations, at these later stages, MlPar-6 is cytosolic and does not localize in the cortex of epidermal cells, and a few epithelial and mesenchymal cells showed nuclear localization (Figure 2F). Thereafter, MlPar-6 remains cytosolic in all scored stages up to 24 hpf (Figure 2—figure supplement 6). Cytosolic and nuclear localization of Par-6 has been reported in other organisms when the polarizing roles of this protein are inactive (Mizuno et al., 2003; Johansson et al., 2000; Cline and Nelson, 2007). Thus, our data suggest that MlPar-6 does not play a role in cell polarity during juvenile cydippid stages. These patterns of apical localization seem not to be affected by the cell cycle (Figure 2—figure supplements 811). Further work is required to assess the relationship between cell cycle and the localization of these proteins.

Figure 2 with 12 supplements see all
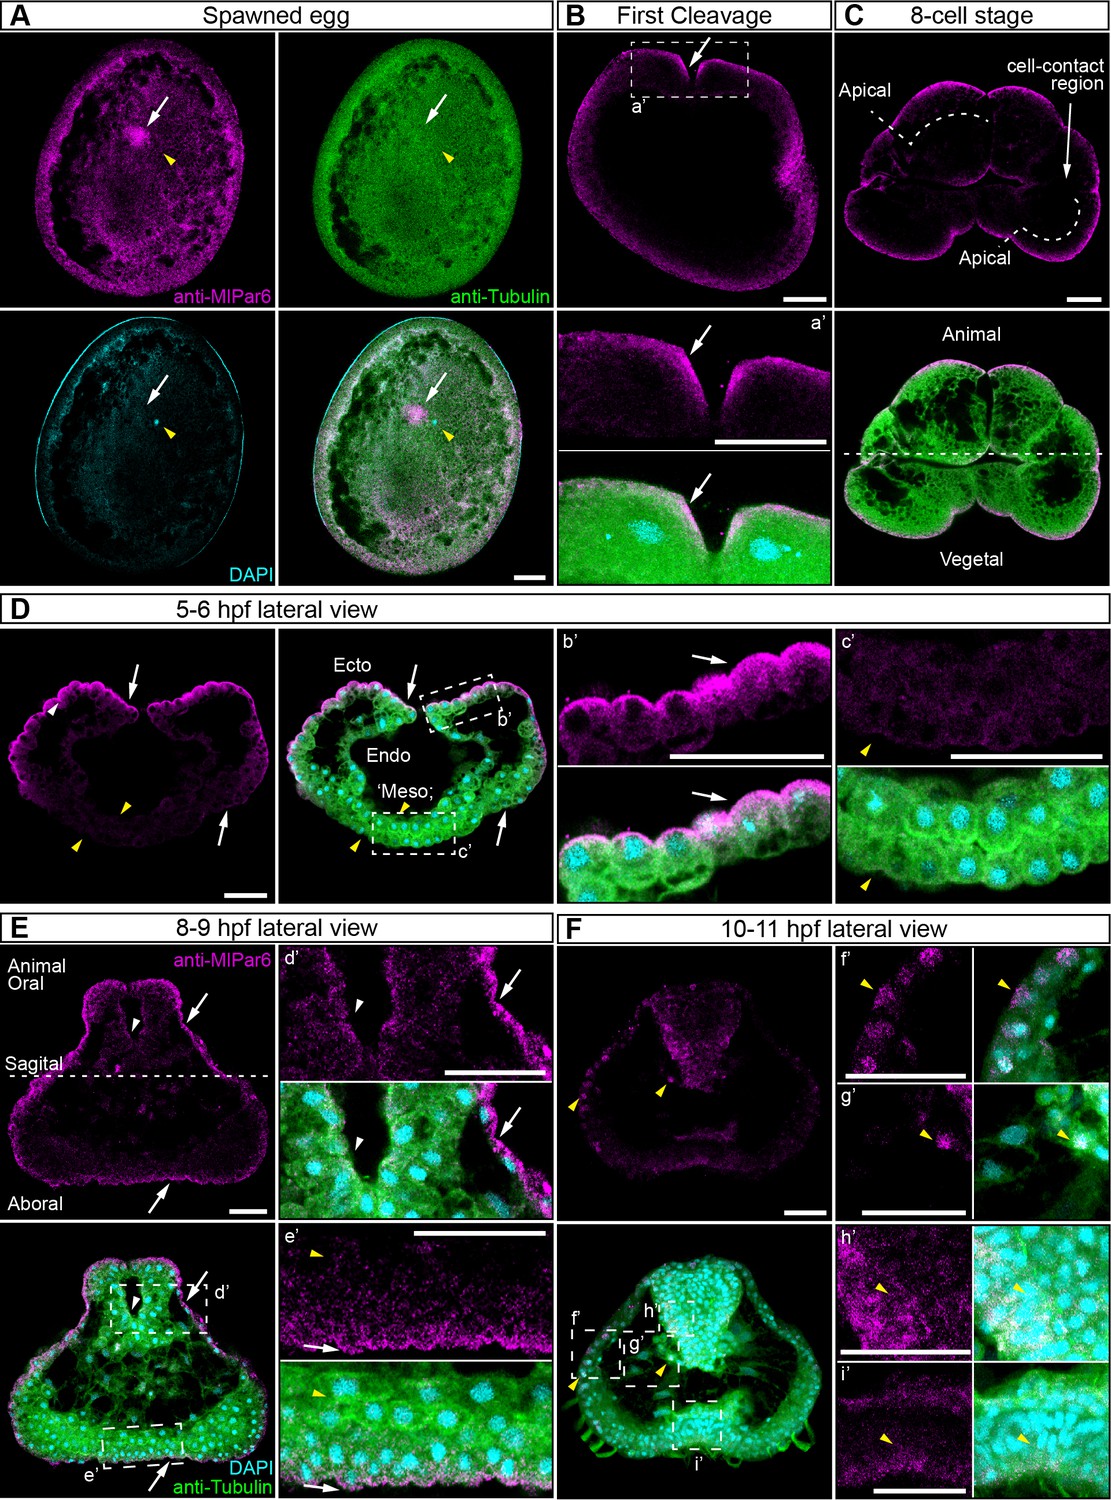
MlPar-6 protein subcellular localization during the early development of M. leidyi.

Immunostaining against MlPar-6 protein shows that this protein localizes asymmetrically in the cell cortex of the eggs (A) and in the cell-contact-free regions of cleavage stages (B–C; white arrows). White circle in C indicates the lack of signal in the cell-contact region. Yellow arrowhead indicates the zygotic nucleus in A. a’ is a magnification of the section depicted in (B) the first cleavage. (D–F): b’ to i’ correspond to magnifications of the regions depicted for each stage. (D) 5–6 hpf, MlPar-6 protein localizes to the apical cortex of the ectodermal cells (Ecto) but is absent from endodermal (Endo) and ‘mesodermal’ (‘Meso’) cells. White arrowhead indicates MlPar-6 protein in regions of cell-contact. Yellow arrowheads indicate the absence of cortical localization. (E) Until 9 hpf, MlPar-6 protein localizes to the apical cortex of the ectoderm (white arrows) and pharynx (white arrowhead) but it is not cortically localized after 10 hpf (F; Yellow arrowheads indicate nuclear localization). Images are maximum projections from a z-stack confocal series. The 8 cell stage corresponds to a single optical section. Orientation axes are depicted in the Figure: Animal/oral pole is to the top. Morphology is shown by DAPI and Tubulin immunostainings. See Figure 2—figure supplements 111 for expanded developmental stages. Scale bars: 20 µm.

Similar results were obtained when we overexpressed the mRNA encoding for MlPar-6 fused to mVenus (MlPar-6-mVenus) and recorded the in vivo localization of the protein in M. leidyi embryos (Figure 2—figure supplement 5D–H). Translated MlPar-6-mVenus was observed approximately 4 hr post injection into the uncleaved egg so localization during early cleavage stags was not possible. However, during gastrulation, MlPar-6-mVenus localizes to the apical cell cortex and displays enrichment at the level of cell-cell contacts (Figure 2—figure supplement 5D–F). As we observed by antibody staining, this cortical localization is no longer observable during the cell movements associated with gastrulation and MlPar-6-mVenus remains cytosolic (Figure 2—figure supplement 5D bottom). After eight hpf, MlPar-6-mVenus localizes to the apical cortex of ectodermal epidermal and pharyngeal cells but is not observable in any other internal tissue (Figure 2—figure supplement 5G). After 10 hpf, MlPar-6-mVenus remains in the cytosol and no cortical localization was detectable (Figure 2—figure supplement 5H). Microinjection and mRNA expression in ctenophores is really challenging. For the first time, we have overexpressed fluorescent-tagged proteins for in vivo imaging. In spite of the low number of replicates (see Materials and methods), our results are consistent with the antibody observations presented above.

MlPar-1 remains cytoplasmic during early M. leidyi development

In bilaterians and cnidarians, the apical localization of MlPar-6 induces the phosphorylation of MlPar-1, displacing this protein to basolateral cortical regions (Ohno et al., 2015; Salinas-Saavedra et al., 2015; Ragkousi et al., 2017; Salinas-Saavedra et al., 2018). Using our specific MlPar-1 antibody, we characterized the subcellular localization of the MlPar-1 protein during the early M. leidyi development (Figure 3 and all its supplements). Even though MlPar-1 appears to be localized in the cortex at the cell-contact regions of early blastomeres and gastrula stages (Figure 3D–E), this antibody signal was not clear enough to be discriminated from the cytosolic distribution, possibly due to edge effects. Nevertheless, and strikingly, MlPar-1 remains as punctate aggregations distributed uniformly in the cytosol, and in some cases, co-distributes with chromosomes during mitosis (Figure 3 and Figure 3—figure supplement 2). We did not observe asymmetric localization of MlPar-1 in the cell cortex of M. leidyi embryos at any of the stages described above for MlPar-6.

Figure 3 with 6 supplements see all
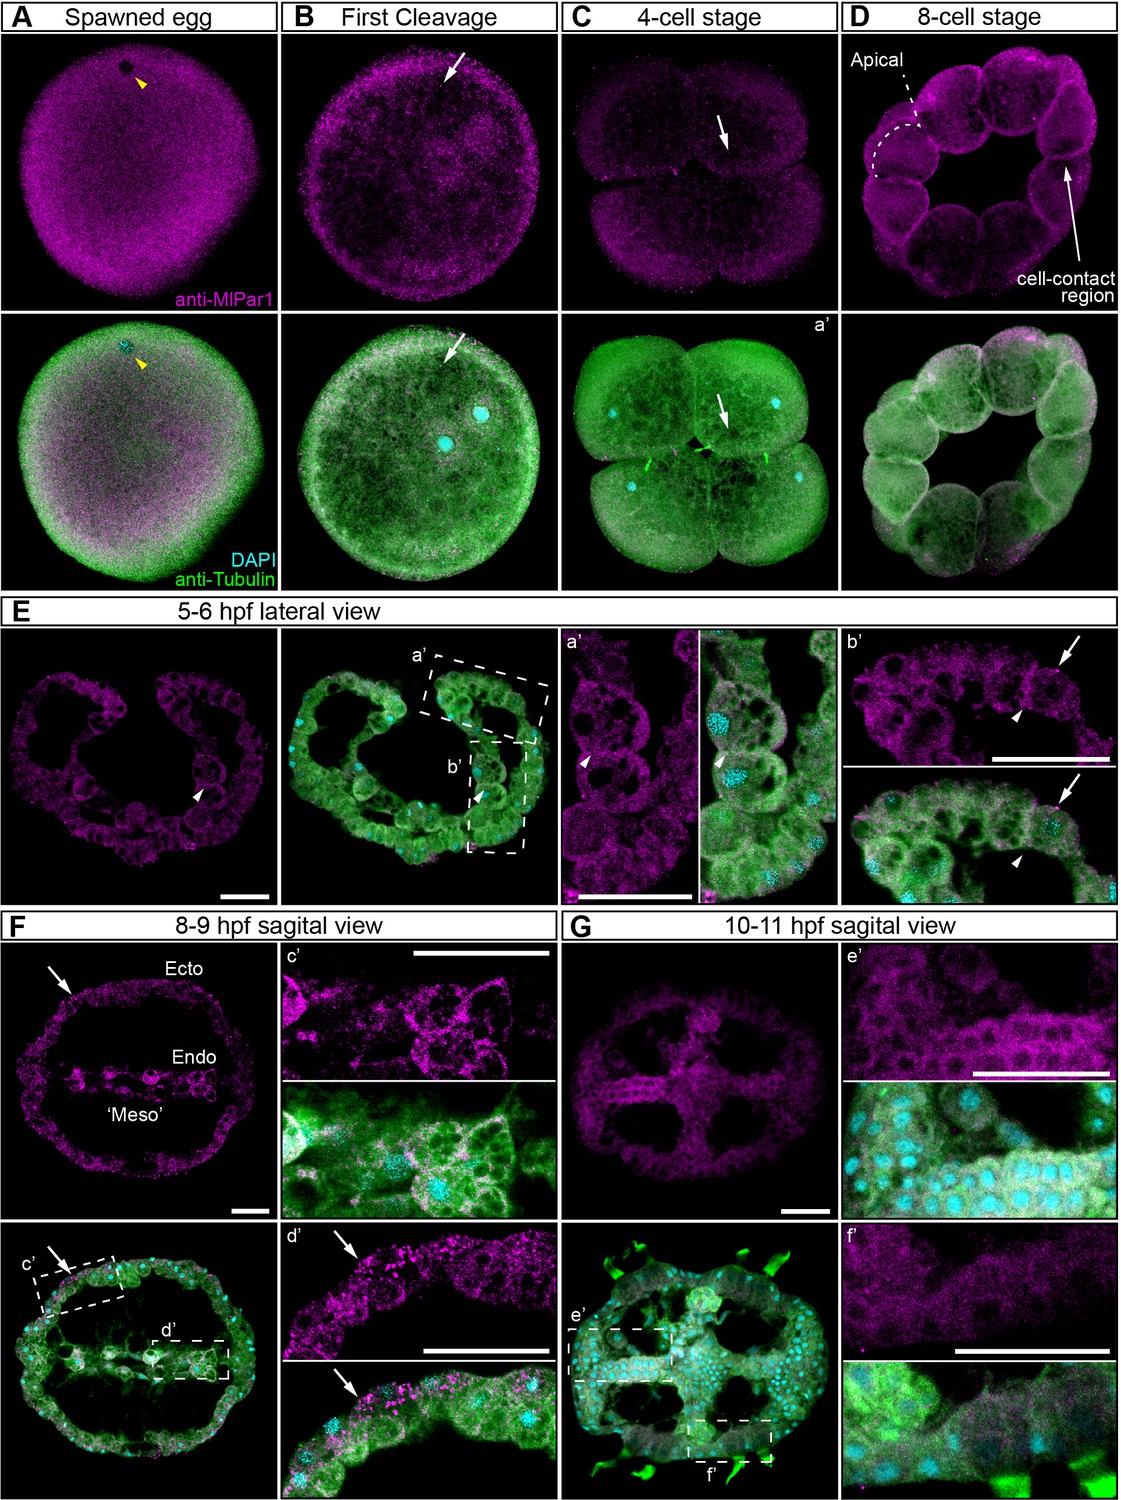
MlPar-1 protein subcellular localization during the early development of M. leidyi.

Immunostaining against MlPar-1 protein shows that this protein remains cytoplasmic during early cleavage stages (A–D). MlPar-1 protein appears as punctate aggregations distributed uniformly in the cytosol (white arrows). Yellow arrowhead indicates the zygote nucleus in (A). 8 cell-stage (D): A single optical section from a z-stack confocal series. MlPar-1 appears to be localized in the cortex at the cell-contact regions but this antibody signal was similar to its cytosolic distribution. (E–G) Between 5 and 11 hpf, MlPar-1 protein remains as punctate aggregations distributed uniformly in the cytosol (white arrows). a’ to f’ correspond to the magnifications of the regions depicted for each stage. (E) MlPar-1 appears to be localized in the cortex at the cell-contact regions (white arrowheads) but this antibody signal was similar to its cytosolic distribution. (F) MlPar-1 protein remains cytoplasmic in ectodermal cells (Ecto; c’), endodermal (Endo; d’), and ‘mesodermal’ (‘Meso’) cells. Images are maximum projections from a z-stack confocal series. Sagittal view of an 8–9 hpf embryo corresponds to a single optical section from a z-stack confocal series. Orientation axes are depicted in the figure. Morphology is shown by DAPI and tubulin immunostainings. The animal pole is towards the top. Scale bars: 20 µm.

These results were also supported in vivo when we overexpressed the mRNA encoding for MlPar-1 fused to mCherry (MlPar-1-mCherry) into M. leidyi embryos by microinjection (Figure 3—figure supplement 3). Similar to MlPar-6-mVenus mRNA overexpression, the MlPar-1-mCherry translated protein was observed after 4 hr post injection into the uncleaved egg. Our in vivo observations on living embryos confirm the localization pattern described above by using MlPar-1 antibody at gastrula stages. MlPar-1-mCherry localizes uniformly and form aggregates in the cytosol during gastrulation (4–5 hpf; Figure 3—figure supplement 3D–E and Video 1). This localization pattern remains throughout all recorded stages until cydippid juvenile stages where MlPar-1-mCherry remains cytosolic in all cells but is highly concentrated in the tentacle apparatus and underneath the endodermal canals (24 hpf; Figure 3—figure supplement 3F–G, Figure 3—figure supplement 4, and Video 2).

Video 1
Punctuate aggregates of MlPar-1-mCherry are highly dynamic.

2.5 min in vivo recording of a gastrula embryo at 40x.

Video 2
Z-stack of MlPar-1-mCherry expression at 24 hpf at 40X.

MlPar-6 and MlPar-1 Proteins can localize like host proteins localize in a heterologous system

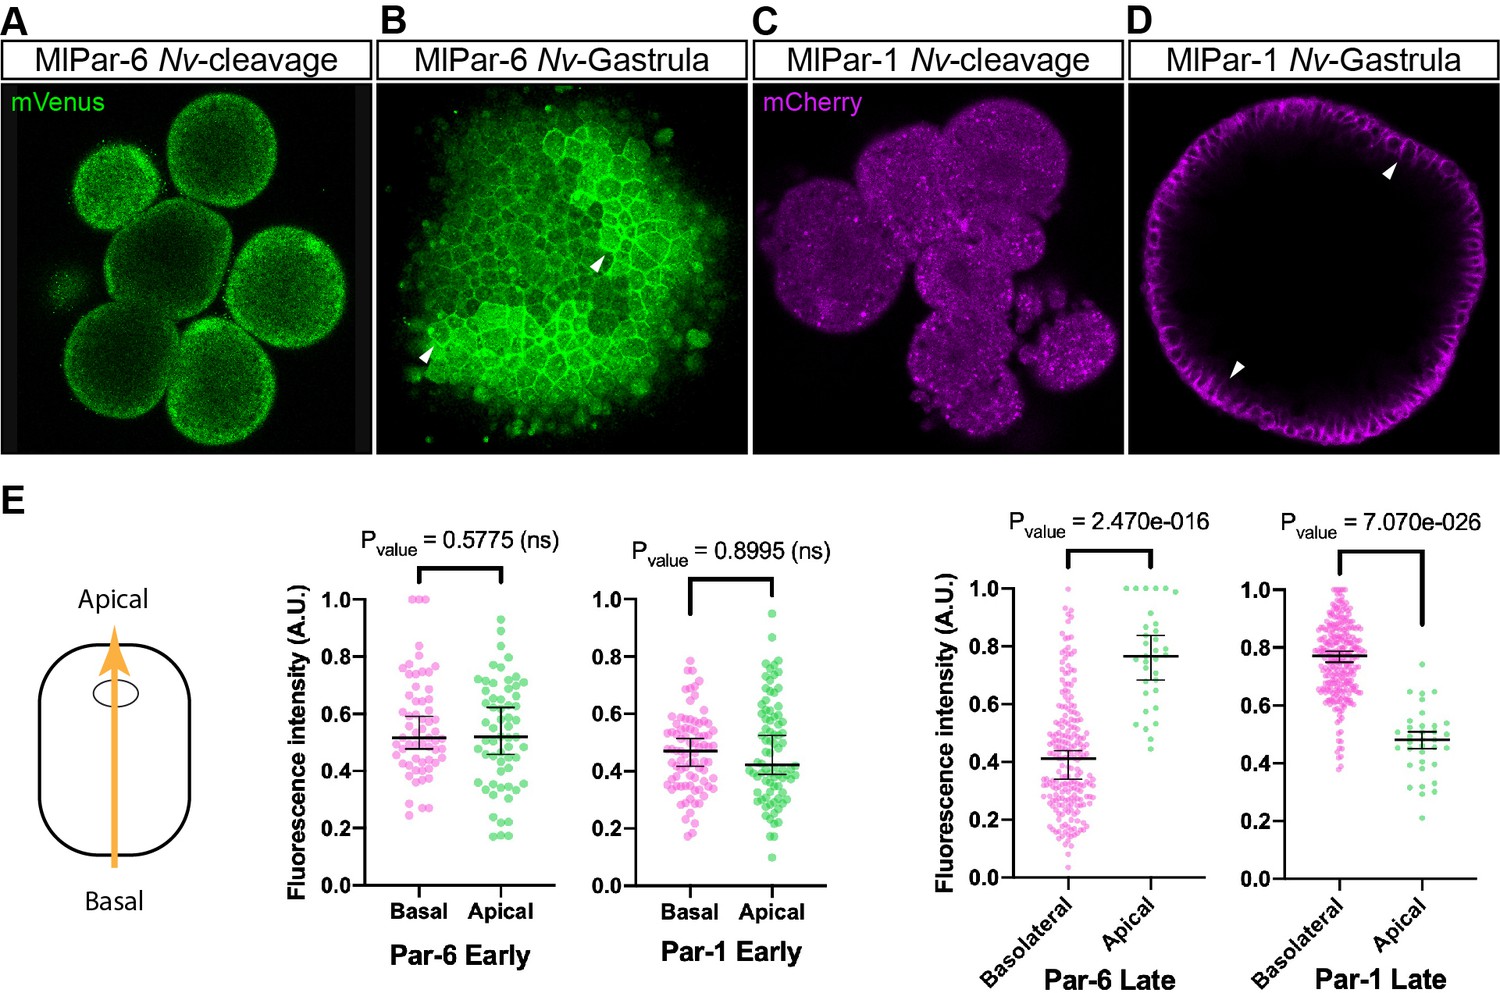
To discount the possibility that the observations recorded in vivo for both MlPar-6-mVenus and MlPar-1-mCherry proteins are caused by a low-quality mRNA or lack of structural conservation, we overexpressed each ctenophore mRNA into embryos of the cnidarian Nematostella vectensis and followed their localization by in vivo imaging (Figure 4). In N. vectensis embryos, MlPar-6-mVenus and MlPar-1-mCherry symmetrically distribute during early cleavage stages (Figure 4A and C) and both proteins localize asymmetrically only after blastula formation (Figure 4B and D). In these experiments, both MlPar-6-mVenus and MlPar-1-mCherry translated proteins display the same pattern as the previously described endogenous N. vectensis Par-6 and Par-1 proteins (Salinas-Saavedra et al., 2015). These data suggest that the protein structure of ctenophore MlPar-6 and MlPar-1 contains the necessary information to localize as other bilaterians proteins do.

Figure 4 with 2 supplements see all
Expression of ctenophore MlPar6-mVenus and MlPar1-mCherry in embryos of the cnidarian N. vectensis.

The translated exogenous proteins display the same pattern than the previously described for endogenous N. vectensis proteins (A–D). White arrowheads indicate MlPar6-mVenus and MlPar1-mCherry cortical localization (B and D). All images are a single slice from a z-stack confocal series. (E) Graphical depiction of fluorescence intensity measurements between basal and apical cortex. The diagram at the left shows the direction of the measurements represented in this figure and in Figure 4—figure supplement 2. Median, 95% CI, and P values are depicted in the figure.

Discussion

Par protein asymmetry is established early but not maintained during M. leidyi embryogenesis

The asymmetric localization of the Par/aPKC complex has been used as an indicator of apical-basal cell polarity in a set of animals, including bilaterians (Ohno et al., 2015; Salinas-Saavedra et al., 2015; Besson et al., 2015; Yang and Mlodzik, 2015; Goldstein and Macara, 2007; Munro and Bowerman, 2009; Doerflinger et al., 2010; Chan and Nance, 2013; Lang and Munro, 2017; Mizuno et al., 2003; Kemphues et al., 1988; Etienne-Manneville and Hall, 2003; Vinot et al., 2005; Lee et al., 2007; Martindale and Hejnol, 2009; Martindale and Lee, 2013; Chalmers et al., 2005; Hayase et al., 2013) and a cnidarian (Salinas-Saavedra et al., 2015; Ragkousi et al., 2017). While in the studied bilaterians this asymmetry is established and maintained since the earliest stages of development (Munro and Bowerman, 2009; Lang and Munro, 2017; Zhu et al., 2017; Nance, 2014; Hoege and Hyman, 2013; Von Stetina and Mango, 2015), in the cnidarian N. vectensis there is no early asymmetrical localization of any of the Par components (Salinas-Saavedra et al., 2015; Ragkousi et al., 2017) and embryonic polarity is controlled by the Wnt signaling system (Kumburegama et al., 2011; Wikramanayake et al., 2003; Lee et al., 2007; Martindale and Hejnol, 2009; Martindale and Lee, 2013). In spite of these differences, once epithelial tissues form and epithelial cell-polarity is established in both bilaterian and cnidarian species, the asymmetric localization of Par proteins become highly polarized and is maintained through development. In those cases, Par-mediated apicobasal cell polarity is responsible for the maturation and maintenance of cell-cell adhesion in epithelial tissue (Ohno et al., 2015; Salinas-Saavedra et al., 2018). We have suggested that the polarizing activity of the Par system was already present in epithelial cells of the MRCA between Bilateria and Cnidaria (Salinas-Saavedra and Martindale, 2018; Salinas-Saavedra and Martindale, 2018) and could be extended to all Metazoa, where these proteins are present (including ctenophores, sponges, and placozoans Fahey and Degnan, 2010; Belahbib et al., 2018).

However, our current data suggest a different scenario for ctenophores where the Par protein polarization observed during earlier stages (characterized by the apical and cortical localization of MlPar-6; Figure 2) is not maintained when ctenophore juvenile epithelial tissues form after nine hpf. Epithelial cells of later cydippid stages do not display an asymmetric localization of MlPar-6 (Figure 2—figure supplement 6). Furthermore, the subcellular localization of MlPar-1 does not display a clear localization during any of the observed developmental stages (Figure 3 and all its supplements). Instead, punctate aggregates distribute symmetrically in the cytosol. MlPar-1 and mCherry aggregates may be consequence of the highly protein availability in the cytosol that is not captured to the cell cortex.

The components of the ctenophore MlPar/aPKC complex (MlPar-3/MlaPKC/MlPar-6 and MlCdc42) are highly conserved and contain all the domains present in other metazoans (Figure 1—figure supplements 12; Fahey and Degnan, 2010; Belahbib et al., 2018). Similarly, the primary structure of MlPar-1 protein (a Serine/threonine-protein kinase) is highly conserved and contains all the domains (with the same amino acid length) required for its proper functioning in other metazoans (Figure 1—figure supplement 3; Fahey and Degnan, 2010; Belahbib et al., 2018), and localizes to the lateral cortex when expressed in cnidarian embryos (Figure 4). Regardless, these proteins do not asymmetrically localize to the cortex of M. leidyi juvenile epithelium. Interestingly, the punctuate aggregates of MlPar-1-mCherry are highly dynamic and move throughout the entire cytosol (Figure 3—figure supplement 3), suggesting a potential association with cytoskeletal components (see Video 1) as MlPar-1 conserve these motifs.

Recent studies have shown that ctenophores do not have homologs for any of the Crb complex components (Belahbib et al., 2018), required for the proper stabilization of the CCC and Par/aPKC complex in other studied taxa (Ohno et al., 2015; Harris and Peifer, 2004; Tepass, 2012; Chalmers et al., 2005; Hayase et al., 2013; Whitney et al., 2016). The lack of MlPar-6 (Figure 2) polarization during later stages is totally congruent with these observations, indicating that Par proteins in ctenophores do not have the necessary interactions to stabilize apico-basal cell polarity in their cells as in other animals. In addition, ctenophore species do not have the molecular components to form SJs and lack a Scribble homolog (Belahbib et al., 2018; Ganot et al., 2015). This could explain the cytosolic localization of MlPar-1 during the observed stages (Benton and St Johnston, 2003; Iden and Collard, 2008; Humbert et al., 2015; Bilder et al., 2000; Vaccari et al., 2005), (Bonello et al., 2019).

Evolution of cell polarity and epithelial structure in metazoa

Given the genomic conservation of cell-polarity components in the Bilateria and Cnidaria, we propose to classify their epithelium as ‘Par-dependent’ to include its mechanistic regulatory properties. That is, the structural properties of a ‘Par-dependent’epithelium are the result of conserved interactions between subcellular pathways that polarize epithelial cells. Thus, when we seek to understand the origins of the epithelial nature of one particular tissue, we are trying to understand the synapomorphies (shared derived characters) of the mechanisms underlying the origin of that particular tissue. Under this definition, a ‘Par-dependent epithelium’ may have a single origin in Metazoa, but, different mechanisms might have co-opted to generate similar epithelial morphologies (Figure 4—figure supplement 1). Ctenophore epithelia, along with other recent works in N. vectensis endomesoderm (Salinas-Saavedra et al., 2015; Salinas-Saavedra et al., 2018) and Drosophila midgut (Chen et al., 2018), suggest this possibility. In all these cases, epithelial cells are highly polarized along the apical-basal axis, but this polarization does not depend on Par proteins. Therefore, these cells are not able to organize a ‘Par-dependent epithelium’ (mechanistic definition) but still polarized epithelial morphologies.

Genomic studies also suggest that ctenophore species lack the molecular interactions necessaries to form the apical cell polarity and junctions observed in Cnidaria + Bilateria. Intriguingly, ctenophore genomes do not have the Wnt signaling pathway components (Ryan et al., 2013; Moroz et al., 2014; Pang et al., 2010) that control the activity of Par proteins in bilaterian and cnidarian embryos (components that are also present in poriferan and placozoan genomes Belahbib et al., 2018). For example, in bilaterians the Wnt/PCP signaling pathway antagonizes the action of the Par/aPKC complex (Cha et al., 2011; Besson et al., 2015; Aigouy and Le Bivic, 2016; Humbert et al., 2015; Humbert et al., 2006; Seifert and Mlodzik, 2007), so this may explain the lack of polarization in ctenophore tissue. Furthermore, ctenophore species do not have the full set of cell-cell adhesion proteins (Belahbib et al., 2018; Ryan et al., 2013; Ganot et al., 2015) as we know them in other metazoans, including Placozoans and Poriferans (Magie and Martindale, 2008; Belahbib et al., 2018). The cadherin of ctenophores does not have the cytoplasmic domains required to bind any of the catenins of the CCC (e.g. p120, alpha- and ß-catenin) (Belahbib et al., 2018). This implies that neither the actin nor microtubule cytoskeleton can be linked to ctenophore cadherin through the CCC, as seen essential in other metazoans to stabilize pre-existent Par proteins polarity. This suggests that there are additional mechanisms that integrate the cytoskeleton of ctenophore cells with their cell-cell adhesion system.

In conclusion, regardless the phylogenetic position of the Ctenophora, the conservation of an organized ‘Par-dependent epithelium’ cannot be extended to all Eumetazoa. Ctenophore cells do not have other essential components to organize the polarizing function of the Par system as in other studied metazoans. Despite the high structural conservation of Par proteins across Metazoa, we have shown that ctenophore cells do not deploy and/or stabilize the asymmetrical localization of Par-6 and Par-1 proteins. Thus, ctenophore tissues organize their epithelium in a different way than the classical definition seen in bilaterians. In agreement with genomic studies, our results question what molecular properties defined the ancestral roots of a metazoan epithelium, and whether similar epithelial morphologies (e.g., epidermis and mesoderm) could be developed by independent or modifications of existing cellular and molecular interactions (including cell adhesion systems). Unless the lack of Par protein localization in M. leidyi is a secondary loss, the absence of these pathways in ctenophores implies that a new set of interactions emerged at least in the Cnidaria+Bilateria ancestor (Figure 4—figure supplement 1), and that, could have regulated the way by which the Par system polarizes embryonic and epithelial cells. While bioinformatic studies are critical to understand the molecular composition, we need further research to understand how these molecules actually interact with one another to organize cellular behavior (e.g., integrin-collagen, basal-apical interactions) in a broader phylogenetical sample, including Porifera and Placozoa.

Materials and methods

Key resources table
Reagent type
(species) or
resource
DesignationSource or
reference
IdentifiersAdditional information
AntibodyMouse Anti-alpha-Tubulin Monoclonal Antibody, Unconjugated, Clone DM1ASigma-AldrichT9026; RRID:AB_477593(1:500)
Antibodyanti-MlPar-6 custom peptide antibody produced in rabbitBethyl labs; This studyStored at MQ Martindale's lab; (1:100)
Antibodyanti-MlPar-1 custom peptide antibody produced in rabbitBethyl labs; This studyStored at MQ Martindale's lab; (1:100)
AntibodyGoat anti-Mouse
IgG Secondary Antibody, Alexa Fluor 568
Thermo Fisher ScientificA-11004; RRID:AB_2534072(1:250)
AntibodyGoat anti-Rabbit IgG Secondary Antibody, Alexa Fluor 647Thermo Fisher ScientificA-21245; RRID:AB_2535813(1:250)
OtherDAPI (4',6-Diamidino-2-Phenylindole, Dihydrochloride)Thermo Fisher ScientificD1306; RRID:AB_2629482(0.1 µg/µl)
Chemical compound, drugDextran, Alexa Fluor 488; 10,000 MW, Anionic, FixableThermo Fisher ScientificD22910
Chemical compound, drugDextran, Alexa Fluor 555; 10,000 MW, Anionic, FixableThermo Fisher ScientificD34679
Chemical compound, drugDextran, Alexa Fluor 647; 10,000 MW, Anionic, FixableThermo Fisher ScientificD22914
Chemical compound, drugDextran, Cascade Blue, 10,000 MW, Anionic, Lysine FixableThermo Fisher ScientificD1976
Sequence-based reagentMlpar-6: F-GTACTGTGCTGTGTGTTTGGA; R- GTACTGTGCTGTGTGTTTGGAMnemiopsis Genome Project - NIH-NHGRIMLRB351777
Sequence-based reagentMlpar-1: F- ATGTCAAATTCTCAACACCAC; R- CAGTCTTAATTCATTAGCTATGTTAMnemiopsis Genome Project - NIH-NHGRIMLRB182569
Recombinant DNA reagentpSPE3-mVenusRoure et al., 2007Gateway vector
Recombinant DNA reagentpSPE3-mCherryRoure et al., 2007Gateway vector
Software, algorithmFiji (ImageJ)NIHhttp://fiji.sc
Software, algorithmImaris 7.6.4Bitplane Inc

Culture and spawning of M. leidyi

Request a detailed protocol

Spawning, gamete preparation, fertilization and embryo culturing of M. leidyi at the Whitney Laboratory for Marine Bioscience of the University of Florida (USA)embryos was performed as previously described (Salinas-Saavedra and Martindale, 2018).

Western blot

Request a detailed protocol

Western blots were carried out as described (Salinas-Saavedra et al., 2015; Salinas-Saavedra et al., 2018) using adult epithelial tissue lysates dissected by hand in order to discard larger amount of mesoglea. Antibody concentrations for Western blot were 1:1000 for all antibodies tested.

Immunohistochemistry

Request a detailed protocol

All immunohistochemistry experiments were carried out using the previous protocol for M. leidyi (Salinas-Saavedra and Martindale, 2018). The primary antibodies and concentrations used were: mouse anti-alpha tubulin (1:500; Sigma-Aldrich, Inc Cat.# T9026. RRID:AB_477593). Secondary antibodies are listed in the Key Resources table. Rabbit anti-MlPar-6, and rabbit anti-MlPar-1 antibodies were custom made high affinity-purified peptide antibodies that commercially generated by Bethyl labs, Inc (Montgomery, TX, USA). Affinity-purified M. leidyi anti-Par-6 (anti-MlPar-6) and anti-Par-1 (anti-MlPar-1) peptide antibodies were raised against a selected amino acid region of the MlPar-6 protein (MTYPDDSNGGSGR) and MlPar-1 protein (KDIAVNIANELRL), respectively. Blast searches against the M. leidyi genome sequences showed that the amino acid sequences were not present in any predicted M. leidyi proteins other than the expected protein. Both antibodies are specific to M. leidyi proteins (Figure 2—figure supplement 2) and were diluted 1:100.

mRNA microinjections

Request a detailed protocol

The coding region for each gene of interest was PCR-amplified using cDNA from M. leidyi embryos and cloned into pSPE3-mVenus or pSPE3-mCherry using the Gateway system (Roure et al., 2007). To confirm the presence of the transcripts during M. leidyi development, we cloned each gene at 2 hpf and 48 hpf. N. vectensis eggs were injected directly after fertilization as previously described (Salinas-Saavedra et al., 2015; DuBuc et al., 2014; Layden et al., 2013) with the mRNA encoding one or more proteins fused in frame with reporter fluorescent protein (N-terminal tag) using an optimized final concentration of 300 ng/µl for each gene. Fluorescent dextran was also co-injected to visualize the embryos. Live embryos were kept at room temperature and visualized after the mRNA of the FP was translated into protein (4–5 hr). Live embryos were mounted in 1x sea water for visualization. Images were documented at different stages. We injected and recorded at least 20 embryos for each injected protein and confocal imaged each specimen at different stages for detailed analysis of phenotypes in vivo. We repeated each experiment at least five times obtaining similar results for each case. The fluorescent dextran and primers for the cloned genes are listed in Key resources table.

Imaging of M. leidyi embryos

Request a detailed protocol

Images of live and fixed embryos were taken using a confocal Zeiss LSM 710 microscope using a Zeiss C-Apochromat 40x water immersion objective (N.A. 1.20). Pinhole settings varied between 1.2–1.4 A.U. according to the experiment. The same settings were used for each individual experiment to compare control and experimental conditions. Z-stack images were processed using Imaris 7.6.4 (Bitplane Inc) software for three-dimensional reconstructions and FIJI for single slice and videos. Final figures were assembled using Adobe Illustrator and Adobe Photoshop.

Par proteins display a general cytosolic localization when their polarizing activity is inactive. This signal was diminished by modifying contrast and brightness of the images in order to enlighten their cortical localization (active state in cell-polarity and stronger antibody signal) as it has shown in other organisms. All RAW images are available upon request.

Fluorescent intensity measurements and statistical analyses

Request a detailed protocol

Images of fixed embryos were measured using FIJI plot profile tool using the RAW source data. Fluorescent intensity was measured along the animal-vegetal axis for 1 and 2 cell stages and along the apico-basal axis for the other later stages. The data obtained were then normalized by the maximum value of each X and Y axes. X axis corresponds to the distance from basal (0) to apical (1) cortex. Y axis corresponds to fluorescence intensity. The normalized data were plotted and the numerical values can be found in figure supplement-data source files. For later stages than 8 cells, we took measurements of two cells located in perpendicular axes of the embryo where the apicobasal axis was clearly detectable. These measurements correspond to cells going through interphase and metaphase. Statistical analyses were executed using GraphPad prism software. To do this, we compared the 10% most basal positions with the 10% most apical positions for each stage. We plotted this data and differences were assessed by comparing medians using Mann-Whitney U test.

Similarly, fluorescent intensity during cell cycle (Figure 2—figure supplement 11) was measured along the apical cortex. The data obtained were then normalized by the maximum value of each X and Y axes. X axis corresponds to the arbitrary distance (0 to 1) along the apical cortex where the middle point corresponds to the cell-cell contact region or cleavage furrow. Y axis corresponds to fluorescence intensity. The normalized data were plotted and the numerical values can be found in Figure 2—figure supplement 11—source data 1.

Data availability

Genomic and Sequencing data can be found in the Mnemiopsis Genome Project (NIH-NHGRI) webpage (http://kona.nhgri.nih.gov/mnemiopsis/). We used the genome and prediction models to search the sequences of Par6 (https://kona.nhgri.nih.gov/mnemiopsis/jbrowse/data.cgi?type=unfiltered2.2&gene=MLRB351777) and Par1 (https://kona.nhgri.nih.gov/mnemiopsis/jbrowse/data.cgi?type=unfiltered2.2&gene=MLRB182569) using the blast tool. All data generated or analyzed during this study are included in the manuscript and supporting files.

The following data sets were generated
    1. Salinas-Saavedra M
    2. Martindale MQ
    (2020) BioStudies
    ID S-BSST502. Par protein localization during the early development of Mnemiopsis leidyi suggests different modes of epithelial organization in the Metazoa.

References

    1. Johansson A
    2. Driessens M
    3. Aspenström P
    (2000)
    The mammalian homologue of the Caenorhabditis elegans polarity protein PAR-6 is a binding partner for the rho GTPases Cdc42 and Rac1
    Journal of Cell Science 113:3267–3275.
    1. Macara IG
    (2004) Parsing the polarity code
    Nature Reviews Molecular Cell Biology 5:220–231.
    https://doi.org/10.1038/nrm1332
  1. Book
    1. Ohno S
    2. Goulas S
    3. Hirose T
    (2015) The PAR3-aPKC-PAR6 complex. in cell polarity 1
    In: Ebnet K, editors. Biological Role and Basic Mechanisms. Springer. pp. 3–23.
    https://doi.org/10.1007/978-3-319-14463-4_1

Decision letter

  1. Patricia J Wittkopp
    Senior and Reviewing Editor; University of Michigan, United States
  2. Alejandro Sánchez Alvarado
    Reviewer; Stowers Institute for Medical Research, United States

In the interests of transparency, eLife publishes the most substantive revision requests and the accompanying author responses.

Acceptance summary:

This work provides insight into the evolution of body plans by molecularly characterizing epithelial organization in the early branching ctenophore, Mnemiopsis leidyi, including the first in vivo cell imaging of proteins in a ctenophore embryo. These data provide new insight into how Par proteins might pattern epithelial tissue in animals.

Decision letter after peer review:

Thank you for submitting your article "Par protein localization during the early development of M. leidyi suggests different modes of epithelial organization" for consideration by eLife. Your article has been reviewed by two peer reviewers, including Alejandro Sánchez Alvarado as the Reviewing Editor and Reviewer #1, and the evaluation has been overseen by Patricia Wittkopp as the Senior Editor.

The reviewers have discussed the reviews with one another and the Reviewing Editor has drafted this decision to help you prepare a revised submission.

Summary:

This paper by Salinas-Saavedra and Martindale reports on a molecular characterization of epithelial organization in ctenophores using immunohistochemistry and expression of fusion mRNAs. The paper focuses on the endogenous, polarity-associated Par proteins Par-1 and Par-6 and comparing these to fusion mRNAs at the same developmental stages. The authors heterologously express ctenophore Par fusion mRNAs in the cnidarian, Nematostella vectensis. They show that while in Nematostella, ctenophore Par proteins localize in a similar fashion to endogenous cnidarian Par proteins, but that in the ctenophore, based on their localization patterns during embryonic development, they conclude that Par-6 localizes asymmetrically to the apical surface of blastomeres early in development but then later fails to localize in epithelia. They also show that ctenophore Par-1 is primarily localized to cytosolic puncta during most stages of development.

Essential revisions:

While the results are certainly intriguing, and we commend the authors for generating key reagents that will be critical in addressing the evolutionary origin of metazoan epithelium there are several major concerns that would need to be addressed before the work is suitable for publication. We list these below:

1) A more rigorous demonstration that the cell cycle is not affecting protein distribution is necessary. For example, evidence that mitotic cells may have different localization of Par-6 than during interphase is shown in the supplemental figure of MlPar-6 Ab staining showing 4 hpf Animal view. Here, Par-6 localization appears in two cells that are likely in anaphase and there is Par-6 localization polarized to opposite sides of the daughter cells.

2) Given the nature of the claims made in the paper, it is necessary to quantify the imaging data reported. Making a generalization of localization based on single representative images without quantification is not acceptable. While the authors claim in the body of the text (subsection “MlPar-6 gets localized to the apical cortex of cells during early M. leidyi development”) to have looked at hundreds of embryos, it would make more sense to quantify the localization using FIJI/ImageJ at each developmental stage and then display the representative image that best shows the quantified data as well as include how many embryos were examined at each developmental stage. Without being able to examine all of the collected image data, it seems problematic to make a generalization of localization based on single representative images without quantification. For example, for the early blastomere localization of Par-6, it would be important to show the fluorescence intensity of the apical vs. basal side of the population of blastomeres to make a claim about the establishment of polarity, especially during the earliest cell divisions. By performing a quick line scan in FIJI of the data across the cells, it is not particularly convincing that the signal is polarized to the apical cortex. At first cleavage, there is just as much signal in the lateral right portion of the embryo as there is at the cytokinetic furrow.

3) It would also be helpful to include a maximum projection of the collected Z-stack of each representative image to highlight the localization of the proteins.

4) It is unclear how the Ragkousi et al., 2017 is considered in the schematic. Ragkousi et al., show that Nematostella embryos lose polarity and the localization of Par-6 only during mitotic rounding, yet re-establish polarity during each interphase when they reinforce cell-cell contacts and are compacted. As the authors have primarily examined static time points, it is important to take into account cell cycle state, particularly the difference between interphase and mitotic cells. For example, in many of the images shown in the figures the cells are undergoing mitosis. It might be important to compare localization between interphase cells. Data from Nematostella (Ragkousi et al., 2017) demonstrates that localization changes of Par proteins between interphase and mitosis during early cleavages of blastomere (more on the interpretation of this data below). It would be extremely interesting to know if something similar is occurring during early Mnemiopsis cell divisions. One striking example where mitotic cells may have different localization of Par-6 than during interphase is the image from the supplement showing Par-6 localization where to the left and right of center there are two cells that appear to be in anaphase and there is Par-6 localization polarized to opposite sides of the daughter cells (supplemental figure of MlPar-6 Ab staining showing 4 hpf Animal view).

5) In reference to Figure 2—figure supplement 4B which shows the localization of MIPar-6-mVenus – it is hard to see how similar this localization pattern is to the endogenous Par6. The authors should fix the MIPar-6-mVenus expressing embryos and stain for Par6. For example, the antibody staining for Par6 at 5hpf shows an enrichment in the cells on the animal pole, but this localization is not shown with the MIPar-6-mVenus expressing animals.

6) In reference to the summary model – it is unclear how interpretation of the Ragkousi et al., paper is considered in the schematic. In their paper, they showed that Nematostella embryos lose polarity and the localization of Par-6 only during mitotic rounding but re-establish polarity during each interphase when they reinforce cell-cell contacts and are compacted. It would be extremely interesting to know if something similar is occurring during Mnemiopsis cell divisions early. Also, it would be worth more carefully visualizing the heterologous experiments or including images of compacted Nematostella embryos expressing ctenophore Par-6 to verify that it localizes in the same manner as the endogenous NvPar-6.

[Editors' note: further revisions were suggested prior to acceptance, as described below.]

Thank you for submitting your article "Par protein localization during the early development of Mnemiopsis leidyi suggests different modes of epithelial organization in the Metazoa" for consideration by eLife. Your article has been reviewed by Patricia Wittkopp as the Senior Editor, a Reviewing Editor, and two reviewers. The reviewers have opted to remain anonymous.

The reviewers have discussed the reviews with one another and the Reviewing Editor has drafted this decision to help you prepare a revised submission.

We would like to draw your attention to changes in our revision policy that we have made in response to COVID-19 (https://elifesciences.org/articles/57162). Specifically, we are asking editors to accept without delay manuscripts, like yours, that they judge can stand as eLife papers without additional data, even if they feel that they would make the manuscript stronger. Thus the revisions requested below only address clarity and presentation.

We thank the authors for preparing this revised version of their work showing that Par6 polarizes in early but not late blastomeres. The manuscript was re-evaluated by one of the original reviewers (reviewer #2) and a new reviewer (reviewer #3), who prepared their independent thoughts and then evaluated the prior reviews and the authors' response to reviewer. As you will see below, reviewer #2 still has some remaining concerns, particularly about statistical analysis and the need for a schematic, whereas reviewer #3 has more extensive concerns about over-interpretation in the manuscript. In the post review discussion, reviewer #2 agreed that reviewer #3's concerns are valid and that they would also like to see them addressed. I am therefore inviting a further revised version (which is rarely done at eLife) so that you can address these issues. The reviewers agree that no new data is required. Specifically, they think that their "comments could be addressed by text revisions, especially toning down the overly strong conclusions. The authors also need to show some sequence alignments, and ideally also domain prediction, to support their claims about the conservation of Ctenophore PAR proteins; but this would only require computational work rather than new experiments."

The full set of comments from both reviewers appear below.

Reviewer #2:

We commend the authors for responding to our previous comments. We also thank the authors for clarifying that ctenophore interphase cells maintain mid-bodies and apologize for a lack of familiarity on these fascinating embryos. In regards to the addition of the requested quantification of their data, we have several concerns (specifics detailed below). Anytime quantification is done, it is appropriate to also include statistical tests to support claims (of either no change in localization across an area measured or a significant change across the area measured). Additionally, it would be very helpful to the readers to include a schematic of where the line scans were done – either utilizing the staged drawings of the ctenophore embryos or placing a line on an example micrograph.

Specifically:

Figure 2—figure supplement 7 – Line scans appear very noisy for 1 and 2 cell stage measurements (i.e., there is a large degree of variability between the 4 quantified embryos at the 1-cell stage and 1/3 embryos at the 2-cell stage is quite different than the other 2) – at the 4 cell stage there seems to be a clear enrichment on apical vs basal, but this would require statistical tests to make the appropriate claim. – or relative enrichment on apical vs basal would make this quantitatively clear and allow the authors to make (or not) their claims.

Figure 2—figure Supplement 8

Here, the argument for telophase enrichment only has an n=2 embryos for both 2 and 4 cell stages – in which one embryo of the 2 does seem to have a dramatic changes in enrichment along the apical surface. We recognize the difficulties associated with imaging these embryos but the data needs to be consistent across samples to make claims, even where statistics may not be able to be used due to low sample size (but some sort of claim needs to be made stating that a statistical analysis could not be performed due to this low (n) issue).

Additionally, we had requested that the authors examine apical vs. basal enrichment during the cell cycle, but it appears that they have quantified the distribution of signal across the apical cortex only, but for example at first cleavage there is a dip in signal at the mid-point of their line scan, but in the text they make the conclusion that there is more Par6 at the cleavage furrow – or is the dip in signal overlapping with the absence of localization right at the middle of the cleavage furrow (Figure 2B/A'). Again, a schematic or annotation of how the line scans were made would be extremely useful for interpretation of data.

Figure 3 and Figure 4 – Really, to make any claims about localization, the quantification should be included in the main figures as well as an annotation of where the line scan was made in a representative image along with reporting the (n) analyzed and the appropriate statistical tests included and referenced in the main text manuscript.

Reviewer #3:

It is widely accepted that polarized epithelial tissues are a conserved feature of all metazoans, although the vast majority of studies have focused on bilaterian model organisms. Here, Salinas-Saavedra and Martindale examine cell polarity in M. leidyi, a representative of the basally branching ctenophore lineage. Using immunostaining and mRNA injections, the authors find that two well-studied polarity proteins, Par-6 and Par-1, exhibit a polarized localization in a smaller number of cells and during a narrower range of times during M. leidyi embryogenesis than might have been predicted based on studies in other systems.

The examination of epithelial polarity in an early-branching metazoan lineage is interesting and important, and I think the data presented in this study are of good quality, especially considering the limitations of a non-model invertebrate animal. The finding that Par-6 may polarize in early embryonic cells but not in later cells undergoing gastrulation is particularly interesting. Unfortunately, the manuscript as presented contains numerous statements and conclusions that are far too strong given the data presented. The authors seem determined to draw strong, sweeping conclusions about metazoan evolution, but these claims rest largely on negative results. A comprehensive study of epithelial organization and polarity in ctenophores is clearly of great importance, but this has not been achieved here.

I particularly took exception to the authors' statement that "Despite of [sic] the high structural conservation of Par proteins across Metazoa, we have shown that ctenophore cells do not deploy and/or stabilize the asymmetrical localization of these proteins" (subsection “Evolution of cell polarity and epithelial structure in Metazoa”). In fact, the authors have examined two out of the dozen or so key conserved proteins that participate in Par polarity in metazoans. One of these (Par-6) localized in a polarized fashion in some, though not all, of the stages examined. The other (Par-1) was difficult to visualize by immunostaining, perhaps in part due to poor performance of the antibody, but it appears to show the opposite polarity from Par-6 at some stages as would be expected (Figure 3D-E). Thus, the data not only do not support the conclusion that "ctenophore cells do not deploy and/or stabilize the asymmetrical localization of these proteins;" they actually suggest the opposite (albeit not conclusively). The data also do not rule out roles for Crumbs, Scribble, Lgl or other conserved Par proteins in polarizing ctenophore cells, nor do they exclude the possibility of Par-dependent polarity at adult stages not examined here. I would urge the authors to be cautious and focus on what the data show, rather than attempting to interpret broadly from a limited number of observations.

- The authors assert that ctenophore Par-3/Par-6/aPKC and Par-1 "contain all the domains present in other metazoans" (subsection “Par protein asymmetry is established early but not maintained during M. leidyi embryogenesis”), but no evidence is presented to support this statement.

- The statement that "The components of the ctenophore MPar/aPKC complex… are not only able to phosphorylate and displace MPar-1 and MLgl to the cytoplasm but are also able to interact with Crb and localize to the apical cortex" (subsection “Par protein asymmetry is established early but not maintained during M. leidyi embryogenesis”) should be removed from the manuscript. This statement is far too strong given the data presented, which do not in any way examine the interactions between aPKC and Par-1/Lgl or Crb nor provide any evidence of active phosphorylation by aPKC or Par-1.

- The statement "This suggests that none of the lateral polarity proteins (Dlg, Lgl, and Par-1) can localize the lateral cortex of the ctenophore cells" (subsection “Par protein asymmetry is established early but not maintained during M. leidyi embryogenesis”) is also inappropriate and should be removed, as only Par-1 has been examined here.

- I object to the authors' definition of a "true-epithelium" as being dependent on Par proteins. Although this point is somewhat semantic, I think that the most useful definitions of epithelia are based on their structural and functional properties. Molecular pathways that remain incompletely understood are a poor basis for these kinds of definitions, since it makes the definitions prone to change as our understanding of molecular mechanisms evolves. Better to simply separate epithelia into "Par-dependent" and "Par-independent" categories and avoid unscientific arguments about what constitutes a "true" epithelium.

- It is not obvious from the images presented in Figure 4—figure supplement 2 that "Mnemiopsis clearly have polarized epithelia" (subsection “Evolution of cell polarity and epithelial structure in Metazoa”). The authors show some peripheral actin staining, but the cells themselves look rounded and non-polarized, and not obviously epithelial like.

Authors' response to previous reviews:

To avoid bias, I avoided reading the previous decision letter and the authors' response until after I had written the review above. Having now examined the previous comments, I believe the authors' response is satisfactory. The issues raised by the previous reviewers were, in my opinion, far less significant and serious than the issues of overinterpretation that most struck me upon a naïve reading of the manuscript.

Of note, in their response to the previous reviewers, the authors point out that the mRNA injection experiments and live imaging are very technically challenging, making it difficult to visualize Par proteins in live embryos (responses to point 5). The senior author of this paper is known in the community as an exceptionally skilled microinjector, so if he describes the injections as "really challenging," that statement should be taken seriously. I raise this point because I think the authors should point out the technical difficulty of the mRNA injection experiments in the main manuscript text. I get the impression that the authors have higher confidence in their immunostaining data than in the localization of ectopically expressed proteins; if this is true, then it needs to be conveyed to the reader.

https://doi.org/10.7554/eLife.54927.sa1

Author response

Summary:

This paper by Salinas-Saavedra and Martindale reports on a molecular characterization of epithelial organization in ctenophores using immunohistochemistry and expression of fusion mRNAs. The paper focuses on the endogenous, polarity-associated Par proteins Par-1 and Par-6 and comparing these to fusion mRNAs at the same developmental stages. The authors heterologously express ctenophore Par fusion mRNAs in the cnidarian, Nematostella vectensis. They show that while in Nematostella, ctenophore Par proteins localize in a similar fashion to endogenous cnidarian Par proteins, but that in the ctenophore, based on their localization patterns during embryonic development, they conclude that Par-6 localizes asymmetrically to the apical surface of blastomeres early in development but then later fails to localize in epithelia. They also show that ctenophore Par-1 is primarily localized to cytosolic puncta during most stages of development.

Essential revisions:

While the results are certainly intriguing, and we commend the authors for generating key reagents that will be critical in addressing the evolutionary origin of metazoan epithelium there are several major concerns that would need to be addressed before the work is suitable for publication. We list these below:

1) A more rigorous demonstration that the cell cycle is not affecting protein distribution is necessary. For example, evidence that mitotic cells may have different localization of Par-6 than during interphase is shown in the supplemental figure of MlPar-6 Ab staining showing 4 hpf Animal view. Here, Par-6 localization appears in two cells that are likely in anaphase and there is Par-6 localization polarized to opposite sides of the daughter cells.

We have added a new supplemental figure (Figure 2—figure supplement 8) and its data source file (Figure 2—figure supplement 8—source data 1), where we included intensity measurements along the apical cortex at different phases of the cell cycle (observed throughout RAW images). These new data saw no changes in protein localization, neither in the cortex nor in the cell-cell contacts of blastomeres and ectodermal cells throughout the cell cycle in cells of 125 embryos examined (total number from Figure 2—figure supplement 7 and Figure 2—figure supplement 8).

The differences noted by the reviewers correspond to the specific behaviour of individual cells. As we mention in the text, Par6 only localizes in ‘static’ ectodermal cells. The cells pointed out by the reviewers are undergoing asymmetrical cell divisions and are located into the inner cell layers. Ctenophore cells are attached by persistent mid-bodies that can give the impression of the presence of a mitotic spindle, but it is not the case and these cells are in interphase.

2) Given the nature of the claims made in the paper, it is necessary to quantify the imaging data reported. Making a generalization of localization based on single representative images without quantification is not acceptable. While the authors claim in the body of the text (subsection “MlPar-6 gets localized to the apical cortex of cells during early M. leidyi development”) to have looked at hundreds of embryos, it would make more sense to quantify the localization using FIJI/ImageJ at each developmental stage and then display the representative image that best shows the quantified data as well as include how many embryos were examined at each developmental stage.

We have added a new supplemental figure (Figure 2—figure supplement 7) and its source data file (Figure 2—figure supplement 7—source data 1), where we include these measurements. In the respective source data we have included the raw and normalized data for these measurements. For the earliest stages, we could only do this for embryos where the animal-vegetal axis was perpendicular to the z-axis of the z-stack. For later stages, we took measurements of two cells located in perpendicular axes of the embryo where the apicobasal axis was clearly detectable.

Without being able to examine all of the collected image data, it seems problematic to make a generalization of localization based on single representative images without quantification. For example, for the early blastomere localization of Par-6, it would be important to show the fluorescence intensity of the apical vs. basal side of the population of blastomeres to make a claim about the establishment of polarity, especially during the earliest cell divisions. By performing a quick line scan in FIJI of the data across the cells, it is not particularly convincing that the signal is polarized to the apical cortex.

We performed the intensity measurements using the RAW confocal images without contrast modification as is presented in the Figures. These measurements (Figure 2—figure supplement 7) support the higher intensity observed in the animal/apical cortex. Ctenophore cells are polarized with the apical cortex facing the external media. Thus, we measure cells at the middle point of the z-stack where the apico-basal axis is clearly differentiated.

At first cleavage, there is just as much signal in the lateral right portion of the embryo as there is at the cytokinetic furrow.

We made the respective measures along the animal-vegetal axis. The increased intensity in the right side of the embryo is an artefact of the mounting. The early ctenophore cleavage program is highly symmetrical, and in this preparation, the left side where the morphology is intact, has lower intensity than the animal cortex. Unfortunately, mounting early stages of ctenophores embryos is challenging due to the amount of yolk, density, and delicate consistency. The embryo presented in Figure 2, was the best preparation for this stage. We apologise for this inconvenience, but at the moment, this is beyond our technical skills.

3) It would also be helpful to include a maximum projection of the collected Z-stack of each representative image to highlight the localization of the proteins.

Figures presented in the main article correspond to projections of a portion of the z-stack, unless indicated otherwise. The problem with including maximum projections of the entire embryo is that makes it even more difficult to identify subcellular localization of proteins in a ‘thick’ tissue. We have tried to give the reader an accurate representation of the localization, but realize there is probably not one ‘ideal’ way to convey all of these data in a single snapshot. Please, see Author response image 1. We are happy to provide these images if is necessary and informative to the reader.

Author response image 1

4) It is unclear how the Ragkousi et al., 2017 is considered in the schematic. Ragkousi et al., show that Nematostella embryos lose polarity and the localization of Par-6 only during mitotic rounding, yet re-establish polarity during each interphase when they reinforce cell-cell contacts and are compacted.

We have now added the Par proteins in the cell-cell contacts in our schematics. As is observable in the figures of Ragkousi et al., paper, and similar to what we reported two years before Ragkouski et al., (see Salinas-Saavedra et al., 2015), Par proteins (Par6) are not asymmetrically localized in the blastomere cortex but are concentrated in blastomere-blastomere contacts during the earliest cleavage stages.

We tried to make the schematics as simple as possible and considered the most common characteristics of Nematostella cell polarity. We are only using as a reference the earliest stages and post gastrula stages of Nematostella development to compare with other animals.

The Ragkousi et al., paper reports the events of stereotyped and synchronous cell divisions in Nematostella that are rare among the other patterns of cell divisions (Fritzenwanker et al., 2007; Salinas-Saavedra et al., 2015).

As the authors have primarily examined static time points, it is important to take into account cell cycle state, particularly the difference between interphase and mitotic cells. For example, in many of the images shown in the figures the cells are undergoing mitosis. It might be important to compare localization between interphase cells.

One striking example where mitotic cells may have different localization of Par-6 than during interphase is the image from the supplement showing Par-6 localization where to the left and right of center there are two cells that appear to be in anaphase and there is Par-6 localization polarized to opposite sides of the daughter cells (supplemental figure of MlPar-6 Ab staining showing 4 hpf Animal view).

Ctenophore cells are connected by their mid bodies, which should not be confused with the mitotic spindle. As can be seen in the Figures, most of the cells are in interphase, specially at 4hpf.

Data from Nematostella (Ragkousi et al., 2017) demonstrates that localization changes of Par proteins between interphase and mitosis during early cleavages of blastomere (more on the interpretation of this data below). It would be extremely interesting to know if something similar is occurring during early Mnemiopsis cell divisions.

This seems not to be the case in ctenophore cells. We have now included intensity measurements along the apical cortex during different phases of the cell cycle with no apparent changes. We show anaphase and telophase data in the new Figure 2—figure supplement 8 of several stages. Intensity measurements reported in Figure 2—figure supplement 7 are of cells going though interphase and metaphase.

5) In reference to figure 2—figure supplement 4B which shows the localization of MIPar-6-mVenus – it is hard to see how similar this localization pattern is to the endogenous Par6.

It is rather challenging to do microinjections in ctenophores, and even more, to overexpress the protein for in vivo imaging. The cell cycle is quite short (15 minutes) and low mRNA concentrations are needed such that it takes several hours before enough protein is expressed to visualize. This means that we are reporting a mixture between the endogenous (unlabelled) and exogenous (labelled) protein and we were only able to observe where the protein is highly concentrated (hence, we add this data as a supplement). Antibody staining, on the other hand, shows the total protein in the cells. These differences are expected due to the difficulty in the handling and imaging. However, both set of experiments show similar localization enriched at the cell-cell contacts for later stages. Ctenophore embryonic material is ‘exquisite.’ However, it presents a number of technical limitations (perhaps that is why there is not a large literature on them).

For example, the antibody staining for Par6 at 5hpf shows an enrichment in the cells on the animal pole, but this localization is not shown with the MIPar-6-mVenus expressing animals.

In vivo imaging of ctenophore embryos is a real challenge. The signal, as every in vivo imaging, is faint due to the thickness of the tissue and lack of tissue clearing. In addition, mounting specimens in the ideal position for imaging is problematic. For this specific stage, we were not able to find the right position to image the whole embryo and make a figure from that. We think that the immune histochemical analyses are more thorough. Unfortunately, as we explain below, these experiments cannot be repeated in a near future.

The authors should fix the MIPar-6-mVenus expressing embryos and stain for Par6.

We tried this. However, ctenophore embryos disintegrate when they are fixed without the chorion (needed for microinjection) and the addition of even a small amount (over 0.2%) of glutaraldehyde (which helps stabilize cellular structure) causes autofluorescent background. In addition, microinjections are really challenging and we were able to inject and overexpress the protein into a few number of embryos.

Unfortunately, these experiments cannot be accomplished in a near future for two main reasons: (1) MSS, is now a postdoc in Ireland, and (2) Coronavirus pandemic and lockdowns prevent travel back to the Whitney Lab where these experiments were performed. These expression studies were performed to validate the immunohistochemistry localizations, and with the hope of additional live cell imaging that did not come as easily as we had hoped.

6) In reference to the summary model – it is unclear how interpretation of the Ragkousi et al., paper is considered in the schematic. In their paper, they showed that Nematostella embryos lose polarity and the localization of Par-6 only during mitotic rounding but re-establish polarity during each interphase when they reinforce cell-cell contacts and are compacted. It would be extremely interesting to know if something similar is occurring during Mnemiopsis cell divisions early.

See response above in point 4.

Also, it would be worth more carefully visualizing the heterologous experiments or including images of compacted Nematostella embryos expressing ctenophore Par-6 to verify that it localizes in the same manner as the endogenous NvPar-6.

These expression studies were performed to validate the structure conservation. In that moment, we did not carefully look for changes in cell cycle. Unfortunately, we are unable to do these experiments by the reasons given in point 5 (inability of travel).

[Editors' note: further revisions were suggested prior to acceptance, as described below.]

We thank the authors for preparing this revised version of their work showing that Par6 polarizes in early but not late blastomeres. The manuscript was re-evaluated by one of the original reviewers (reviewer #2) and a new reviewer (reviewer #3), who prepared their independent thoughts and then evaluated the prior reviews and the authors' response to reviewer. As you will see below, reviewer #2 still has some remaining concerns, particularly about statistical analysis and the need for a schematic, whereas reviewer #3 has more extensive concerns about over-interpretation in the manuscript. In the post review discussion, reviewer #2 agreed that reviewer #3's concerns are valid and that they would also like to see them addressed. I am therefore inviting a further revised version (which is rarely done at eLife) so that you can address these issues. The reviewers agree that no new data is required. Specifically, they think that their "comments could be addressed by text revisions, especially toning down the overly strong conclusions. The authors also need to show some sequence alignments, and ideally also domain prediction, to support their claims about the conservation of Ctenophore PAR proteins; but this would only require computational work rather than new experiments."

We thank the reviewers and their comments. Information about ctenophore biology is not abundant and we appreciate all the help given by the reviewers to analyze our data. In this version we have changed the tone of the main text and addressed the changes suggested by the reviewers. We have also included schematics and statistical data of our intensity measurements and better explanations for the specific cases pointed out by the reviewers. Finally, we have added a new protein alignment for Par6 and Par1 with their respective protein domains. Please, find below our detailed response for the full comments.

Reviewer #2:

We commend the authors for responding to our previous comments. We also thank the authors for clarifying that ctenophore interphase cells maintain mid-bodies and apologize for a lack of familiarity on these fascinating embryos. In regards to the addition of the requested quantification of their data, we have several concerns (specifics detailed below). Anytime quantification is done, it is appropriate to also include statistical tests to support claims (of either no change in localization across an area measured or a significant change across the area measured). Additionally, it would be very helpful to the readers to include a schematic of where the line scans were done – either utilizing the staged drawings of the ctenophore embryos or placing a line on an example micrograph.

Our apologies. We agree that these additions will help clarify our results. We now included these data and schematics in Figure 2—figure supplement 7, Figure 2—figure supplement 8, Figure 2—figure supplement 9 and Figure 2—figure supplement 10 and Figure 3—figure supplement 5 and Figure 3—figure supplement 6.

Specifically:

Figure 2—figure supplement 7 – Line scans appear very noisy for 1 and 2 cell stage measurements (i.e., there is a large degree of variability between the 4 quantified embryos at the 1-cell stage and 1/3 embryos at the 2-cell stage is quite different than the other 2)

Thank you for pointing this out. We have now explained the situation with these embryos in the figure legend of Figure 2—figure supplement 7. The early stages of ctenophore development are quite delicate (before many blastomere-blastomere cell contacts form). For this particular case, the measurements were taken on a preparation where part of the cytoplasm was not in the same focal plane as the cortex and therefore presented this lack of intensity (see Author response image 2). Nevertheless, the blastomeres are still intact and do not present much variation, as can be seen in the maximum projections presented below this answer. As we explained in our previous revision, making the measurements in maximum projections is not appropriate because of the noise added by this mounting artefact.

Author response image 2

– at the 4 cell stage there seems to be a clear enrichment on apical vs basal, but this would require statistical tests to make the appropriate claim. – or relative enrichment on apical vs basal would make this quantitatively clear and allow the authors to make (or not) their claims.

Added in Figure 2—figure supplement 8, Figure 2—figure supplement 8, Figure 2—figure supplement 9 and Figure 2—figure supplement 10 that quantifies the differences described.

Figure 2—figure Supplement 8

Here, the argument for telophase enrichment only has an n=2 embryos for both 2 and 4 cell stages – in which one embryo of the 2 does seem to have a dramatic changes in enrichment along the apical surface. We recognize the difficulties associated with imaging these embryos but the data needs to be consistent across samples to make claims, even where statistics may not be able to be used due to low sample size (but some sort of claim needs to be made stating that a statistical analysis could not be performed due to this low (n) issue).

We have added a statement in the figure legend of Figure 2—figure supplement 11: Unfortunately, we did not have enough telophase replicates to show statistical significance of these observations. However, we think the dramatic changes correspond to the larger size of the cells and the cleavage furrow which are explained in Figure 2—figure supplement 7 schematics.

Additionally, we had requested that the authors examine apical vs. basal enrichment during the cell cycle, but it appears that they have quantified the distribution of signal across the apical cortex only,

The quantification to examine apical vs. basal enrichment shown in Figure 2—figure supplements 7, Figure 2—figure supplement 8, Figure 2—figure supplement 9 and Figure 2—figure supplement 10 also represent cycling cells and we show that the apical localization of Par-6 seems unaffected by cell cycle dynamics. This can be appreciated in Figure 2Db’ where the arrow points to a cell in anaphase. In Figure 2—figure supplement 7 we have also included a cell in metaphase. Hence, we think that including measurements along the apical cortex is also valuable because it shows the signal distribution in the cleavage furrow.

but for example at first cleavage there is a dip in signal at the mid-point of their line scan, but in the text they make the conclusion that there is more Par6 at the cleavage furrow – or is the dip in signal overlapping with the absence of localization right at the middle of the cleavage furrow (Figure 2B/A'). Again, a schematic or annotation of how the line scans were made would be extremely useful for interpretation of data.

The reviewer is correct. The dip in the signal is due to the empty space created by the cleavage furrow. We have clarified this in the Figure 2—figure supplement 7 with schematics.

Figure 3 and Figure 4 – Really, to make any claims about localization, the quantification should be included in the main figures as well as an annotation of where the line scan was made in a representative image along with reporting the (n) analyzed and the appropriate statistical tests included and referenced in the main text manuscript.

We apologize for the lack of schematics in the first revision. Now we have added new figures where the statistics are graphically represented (Figure 2—figure supplement 9, Figure 2—figure supplement 10 and Figure 3—figure supplement 5) and we have also added new schematic figures to show how all these measurements were made to Figure 2—figure supplement 7 and Figure 3—figure supplement 6.

We are submitting this work as a Short Report and we would like to limit the number of main figures to show the immunostaining of these proteins in the largest sample of developmental stages as possible. We think that these figures are already large and saturated with information. For aesthetic reason and simplicity, we would like to keep the quantification as supplemental figures for Figure 3. We have added this data in Figure 4. We think this should not be a problem given the eLife online format. If the reviewers think that this is a critical problem, we are willing to rearrange our figures.

Reviewer #3:

It is widely accepted that polarized epithelial tissues are a conserved feature of all metazoans, although the vast majority of studies have focused on bilaterian model organisms. Here, Salinas-Saavedra and Martindale examine cell polarity in M. leidyi, a representative of the basally branching ctenophore lineage. Using immunostaining and mRNA injections, the authors find that two well-studied polarity proteins, Par-6 and Par-1, exhibit a polarized localization in a smaller number of cells and during a narrower range of times during M. leidyi embryogenesis than might have been predicted based on studies in other systems.

The examination of epithelial polarity in an early-branching metazoan lineage is interesting and important, and I think the data presented in this study are of good quality, especially considering the limitations of a non-model invertebrate animal. The finding that Par-6 may polarize in early embryonic cells but not in later cells undergoing gastrulation is particularly interesting. Unfortunately, the manuscript as presented contains numerous statements and conclusions that are far too strong given the data presented. The authors seem determined to draw strong, sweeping conclusions about metazoan evolution, but these claims rest largely on negative results. A comprehensive study of epithelial organization and polarity in ctenophores is clearly of great importance, but this has not been achieved here.

We acknowledge that our observations are only the beginning of a comprehensive understanding of the structure and function of ctenophore epithelial cells and the molecular basis of cell polarity. However, what we have seen in Mnemiopsis is rather radically different than what we have seen in Nematostella (which in itself was different from other bilaterians, at least during early cleavage stages). Because the reagents and techniques we deployed in Nematostella are pretty much the same we used in Mnemiopsis we feel that the differences are in fact biological. We probably over interpreted the meaning of these findings in our original versions but since these are the very first observations in this system we have few data by which to compare our results to.

I particularly took exception to the authors' statement that "Despite of [sic] the high structural conservation of Par proteins across Metazoa, we have shown that ctenophore cells do not deploy and/or stabilize the asymmetrical localization of these proteins" (subsection “Evolution of cell polarity and epithelial structure in Metazoa”). In fact, the authors have examined two out of the dozen or so key conserved proteins that participate in Par polarity in metazoans.

The reviewer is correct. We have only shown two proteins of the Par complex and now we have added two new supplementary figures (Figure 1—figure supplement 2 and Figure 1—figure supplement 3) to show sequence alignments to other metazoan species. We have also changed this statement to be more specific: ‘ctenophore cells do not deploy and/or stabilize the asymmetrical localization of Par-6 and Par-1 proteins’

We have cloned Mnemiopsis aPKC and CDC42 and tried to see their in vivo localization by mRNA microinjection as well. However, the expression of these constructs was not strong enough to have conclusive information and we did not observe any distinctive localization. As we stated in the text, we were not able to clone other proteins to test in vivo.

Regarding the conservation of the full set of proteins, we have made the respective analyses within the genomic sequences and transcriptomics when we started to work with these proteins back in 2016. We decided to do not report these studies because Belahbib et al., 2018 (referenced) have done a more complete analysis for most of these proteins and they deserve full credit for that.

One of these (Par-6) localized in a polarized fashion in some, though not all, of the stages examined. The other (Par-1) was difficult to visualize by immunostaining, perhaps in part due to poor performance of the antibody,

We performed the appropriate experiments to test this antibody and we are confident of its quality. In addition, we rely in the in vivo protein expression as an extra confirmation.

but it appears to show the opposite polarity from Par-6 at some stages as would be expected (Figure 3D-E). Thus, the data not only do not support the conclusion that "ctenophore cells do not deploy and/or stabilize the asymmetrical localization of these proteins;" they actually suggest the opposite (albeit not conclusively).

We are including the respective quantification of the fluorescence to show that these apparent differences are not significant (Figure 3—figure supplement 5.).

The data also do not rule out roles for Crumbs, Scribble,

Scribble and proteins of the crumbs complex are not present in ctenophore genomes (Belahbib et al., 2018).

Lgl or other conserved Par proteins in polarizing ctenophore cells, nor do they exclude the possibility of Par-dependent polarity at adult stages not examined here. I would urge the authors to be cautious and focus on what the data show, rather than attempting to interpret broadly from a limited number of observations.

The conservation of these proteins has been published already (Belahbib et al., 2018) and the two ctenophore genes we studied here polarize when expressed in Nematostella. We assumed that the lack of a Scribble complex in ctenophores may not be able to localize Lgl, but the reviewer is correct. We do not have a mechanistic answer for this at this time.

Studying fully grown adult ctenophores is difficult, but since ctenophores are ‘direct developers’ and their adult body plan is generated rapidly (24 hours.) we feel relatively confident that epithelial organization is similar during older adult stages.

- The authors assert that ctenophore Par-3/Par-6/aPKC and Par-1 "contain all the domains present in other metazoans" (subsection “Par protein asymmetry is established early but not maintained during M. leidyi embryogenesis”), but no evidence is presented to support this statement.

These analyses have been published already (Belahbib et al., 2018). We have now included the protein alignment from the sequences cloned in our study (Figure 1—figure supplement 1, Figure 1—figure supplement 2 and Figure 1—figure supplement 3).

- The statement that "The components of the ctenophore MPar/aPKC complex… are not only able to phosphorylate and displace MPar-1 and MLgl to the cytoplasm but are also able to interact with Crb and localize to the apical cortex" (subsection “Par protein asymmetry is established early but not maintained during M. leidyi embryogenesis”) should be removed from the manuscript. This statement is far too strong given the data presented, which do not in any way examine the interactions between aPKC and Par-1/Lgl or Crb nor provide any evidence of active phosphorylation by aPKC or Par-1.

- The statement "This suggests that none of the lateral polarity proteins (Dlg, Lgl, and Par-1) can localize the lateral cortex of the ctenophore cells" (subsection “Par protein asymmetry is established early but not maintained during M. leidyi embryogenesis”) is also inappropriate and should be removed, as only Par-1 has been examined here.

They were only suggestions and now have been removed.

- I object to the authors' definition of a "true-epithelium" as being dependent on Par proteins. Although this point is somewhat semantic, I think that the most useful definitions of epithelia are based on their structural and functional properties. Molecular pathways that remain incompletely understood are a poor basis for these kinds of definitions, since it makes the definitions prone to change as our understanding of molecular mechanisms evolves. Better to simply separate epithelia into "Par-dependent" and "Par-independent" categories and avoid unscientific arguments about what constitutes a "true" epithelium.

This is a fair point and is mostly semantic, so we have changed it as the reviewer suggested. However, we clearly defined what we meant by a ‘true’ epithelium (which of course one could always argue with!). Our definition aimed to convey structural and functional properties of bilaterians and cnidarians. Ctenophora do not have many of those structural components, e.g. Wnt PCP pathway, Crb complex, Scribble, classical e-cadherin, SJs, and our results show that Par proteins do not localize as we had expected. Hence, we decided to use a mechanistic definition. Now we have changed to a "Par-dependent" and "Par-independent." Discussion section.

- It is not obvious from the images presented in Figure 4 —figure supplement 2 that "Mnemiopsis clearly have polarized epithelia" (subsection “Evolution of cell polarity and epithelial structure in Metazoa”). The authors show some peripheral actin staining, but the cells themselves look rounded and non-polarized, and not obviously epithelial like.

Thanks for pointing this out. We still believe that M. leidyi has a polarized epithelium given the presence of a cilium in the apical side of epithelial cells. This can be observed in the figures after 20 hpf. However, we do not have an elegant picture to show the intact epithelium with all its characteristics at this point. To avoid confusion and unnecessary statements, we have deleted this figure and the correspondent text.

Authors' response to previous reviews:

To avoid bias, I avoided reading the previous decision letter and the authors' response until after I had written the review above. Having now examined the previous comments, I believe the authors' response is satisfactory. The issues raised by the previous reviewers were, in my opinion, far less significant and serious than the issues of overinterpretation that most struck me upon a naïve reading of the manuscript.

Of note, in their response to the previous reviewers, the authors point out that the mRNA injection experiments and live imaging are very technically challenging, making it difficult to visualize Par proteins in live embryos (responses to point 5). The senior author of this paper is known in the community as an exceptionally skilled microinjector, so if he describes the injections as "really challenging," that statement should be taken seriously. I raise this point because I think the authors should point out the technical difficulty of the mRNA injection experiments in the main manuscript text. I get the impression that the authors have higher confidence in their immunostaining data than in the localization of ectopically expressed proteins; if this is true, then it needs to be conveyed to the reader.

We thought it was important to validate our immunohistochemical studies. Now we have stated this: ‘Microinjection and mRNA expression in ctenophores is really challenging. For the first time, we have overexpressed fluorescent-tagged proteins for in vivo imaging. In spite of the low number of replicates (see Materials and methods section), our results are consistent with the antibody observations presented above.’

https://doi.org/10.7554/eLife.54927.sa2

Article and author information

Author details

  1. Miguel Salinas-Saavedra

    The Whitney Laboratory for Marine Bioscience, and the Department of Biology, University of Florida, St. Augustine, United States
    Present address
    Centre for Chromosome Biology, Bioscience Building, National University of Ireland Galway, Galway, Ireland
    Contribution
    Conceptualization, Resources, Validation, Investigation, Visualization, Methodology, Writing - original draft, Project administration, Writing - review and editing
    For correspondence
    miguel.salinas-saavedra@nuigalway.ie
    Competing interests
    No competing interests declared
    ORCID icon "This ORCID iD identifies the author of this article:" 0000-0002-1598-9881
  2. Mark Q Martindale

    The Whitney Laboratory for Marine Bioscience, and the Department of Biology, University of Florida, St. Augustine, United States
    Contribution
    Conceptualization, Resources, Supervision, Funding acquisition, Writing - original draft, Project administration, Writing - review and editing
    For correspondence
    mqmartin@whitney.ufl.edu
    Competing interests
    No competing interests declared

Funding

National Science Foundation (NSF IOS-1755364)

  • Mark Q Martindale

National Aeronautics and Space Administration (NASA 16-EXO16_2-0041)

  • Mark Q Martindale

The funders had no role in study design, data collection and interpretation, or the decision to submit the work for publication.

Acknowledgements

We thank J Torres-Paz, CE Schnitzler, U Frank, and J Ryan for technical assistance and helpful comments.

Senior and Reviewing Editor

  1. Patricia J Wittkopp, University of Michigan, United States

Reviewer

  1. Alejandro Sánchez Alvarado, Stowers Institute for Medical Research, United States

Version history

  1. Received: January 6, 2020
  2. Accepted: July 23, 2020
  3. Accepted Manuscript published: July 27, 2020 (version 1)
  4. Accepted Manuscript updated: July 30, 2020 (version 2)
  5. Version of Record published: August 20, 2020 (version 3)

Copyright

© 2020, Salinas-Saavedra and Martindale

This article is distributed under the terms of the Creative Commons Attribution License, which permits unrestricted use and redistribution provided that the original author and source are credited.

Metrics

  • 1,789
    Page views
  • 262
    Downloads
  • 8
    Citations

Article citation count generated by polling the highest count across the following sources: Crossref, PubMed Central, Scopus.

Download links

A two-part list of links to download the article, or parts of the article, in various formats.

Downloads (link to download the article as PDF)

Open citations (links to open the citations from this article in various online reference manager services)

Cite this article (links to download the citations from this article in formats compatible with various reference manager tools)

  1. Miguel Salinas-Saavedra
  2. Mark Q Martindale
(2020)
Par protein localization during the early development of Mnemiopsis leidyi suggests different modes of epithelial organization in the metazoa
eLife 9:e54927.
https://doi.org/10.7554/eLife.54927

Further reading

    1. Developmental Biology
    2. Neuroscience
    Xiong Yang, Rong Wan ... Ke Tang
    Research Article

    The hippocampus executes crucial functions from declarative memory to adaptive behaviors associated with cognition and emotion. However, the mechanisms of how morphogenesis and functions along the hippocampal dorsoventral axis are differentiated and integrated are still largely unclear. Here, we show that Nr2f1 and Nr2f2 genes are distinctively expressed in the dorsal and ventral hippocampus, respectively. The loss of Nr2f2 results in ectopic CA1/CA3 domains in the ventral hippocampus. The deficiency of Nr2f1 leads to the failed specification of dorsal CA1, among which there are place cells. The deletion of both Nr2f genes causes almost agenesis of the hippocampus with abnormalities of trisynaptic circuit and adult neurogenesis. Moreover, Nr2f1/2 may cooperate to guarantee appropriate morphogenesis and function of the hippocampus by regulating the Lhx5-Lhx2 axis. Our findings revealed a novel mechanism that Nr2f1 and Nr2f2 converge to govern the differentiation and integration of distinct characteristics of the hippocampus in mice.

    1. Developmental Biology
    2. Evolutionary Biology
    Nico Posnien, Vera S Hunnekuhl, Gregor Bucher
    Review Article

    Gene expression has been employed for homologizing body regions across bilateria. The molecular comparison of vertebrate and fly brains has led to a number of disputed homology hypotheses. Data from the fly Drosophila melanogaster have recently been complemented by extensive data from the red flour beetle Tribolium castaneum with its more insect-typical development. In this review, we revisit the molecular mapping of the neuroectoderm of insects and vertebrates to reconsider homology hypotheses. We claim that the protocerebrum is non-segmental and homologous to the vertebrate fore- and midbrain. The boundary between antennal and ocular regions correspond to the vertebrate mid-hindbrain boundary while the deutocerebrum represents the anterior-most ganglion with serial homology to the trunk. The insect head placode is shares common embryonic origin with the vertebrate adenohypophyseal placode. Intriguingly, vertebrate eyes develop from a different region compared to the insect compound eyes calling organ homology into question. Finally, we suggest a molecular re-definition of the classic concepts of archi- and prosocerebrum.