Performance of a deep learning based neural network in the selection of human blastocysts for implantation
- Division of Reproductive Endocrinology and Infertility, Department of Obstetrics and Gynecology, Massachusetts General Hospital, Harvard Medical School, United States
- Harvard Medical School, United States
- Division of Engineering in Medicine, Department of Medicine, Brigham and Women’s Hospital, Harvard Medical School, United States
- Extend Fertility, United States
- San Diego Fertility Center, United States
- Colorado Center for Reproductive Medicine IVF Laboratory Network, United States
- Division of Reproductive Endocrinology and Infertility, Department of Obstetrics and Gynecology, University of Wisconsin, United States
Figures
Figure 1
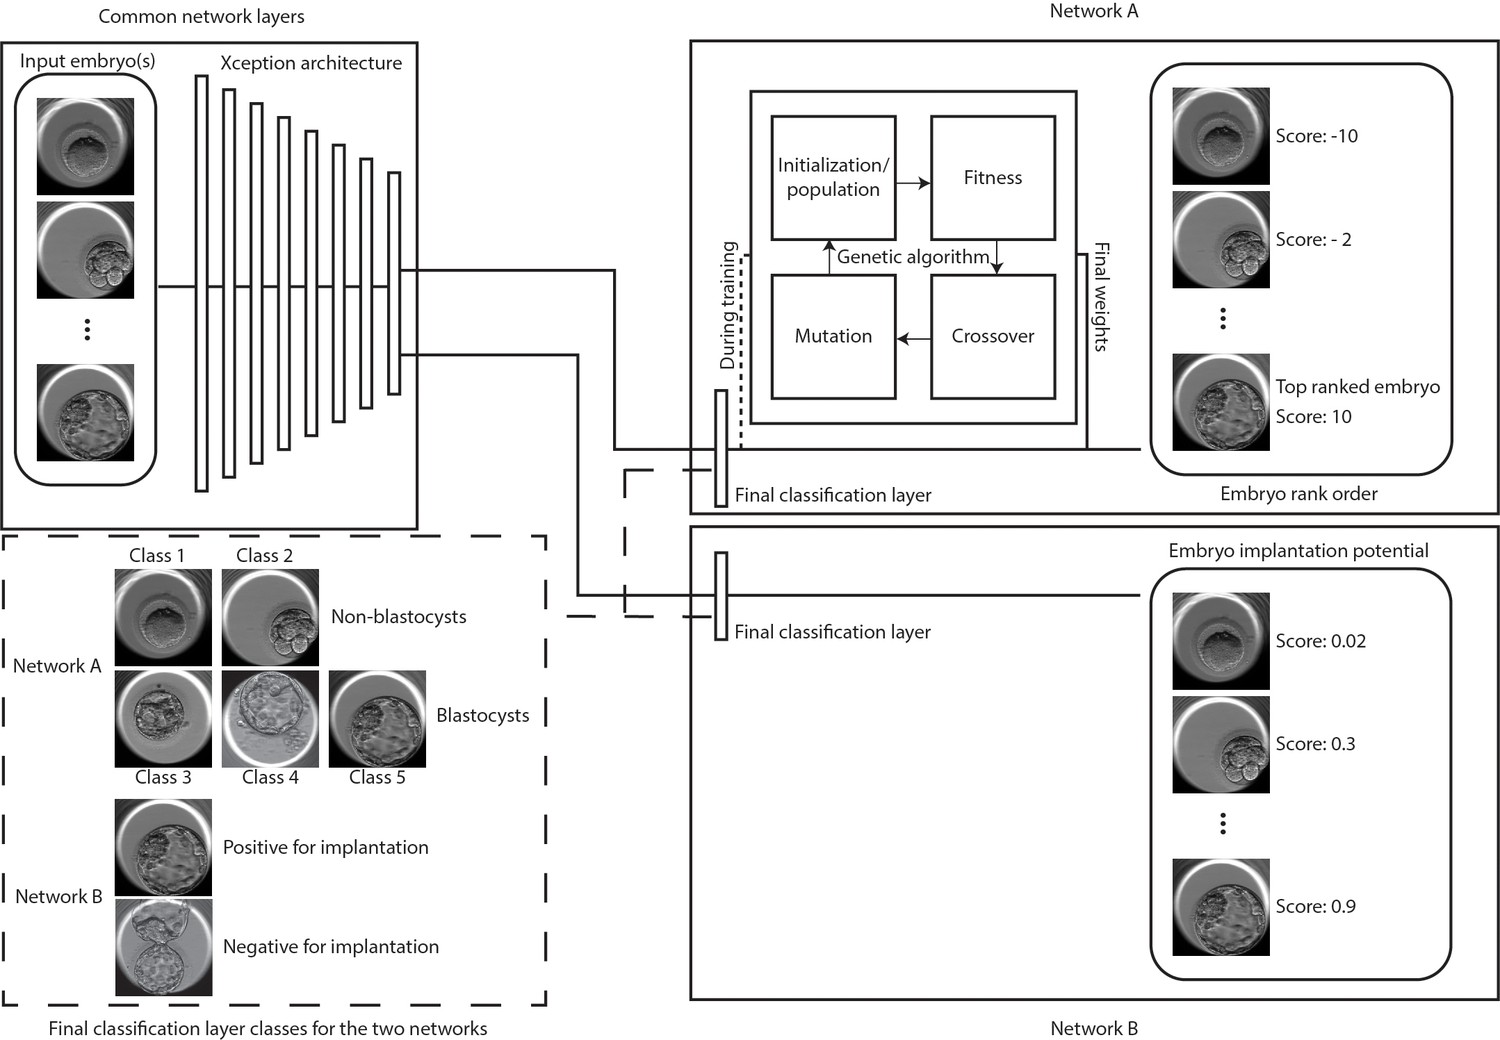
Classification and selection of embryos at 113 hpi.
The schematic shows neural networks that classify, and rank order embryos based on their morphological quality (network A) and classify embryos based on the implantation potential (network B). The two networks share a common Xception architecture but the classification layers are specific to each task. Network A also uses a genetic algorithm that helps in generating embryo scores by using the softmax output of the network with weights generated by the algorithm during training. Embryo(s) with the highest scores are evaluated for single embryo and double embryo transfer scenarios using the retrospective test set. The implantation potential is given by the softmax output of the neural network.
Figure 2 with 1 supplement
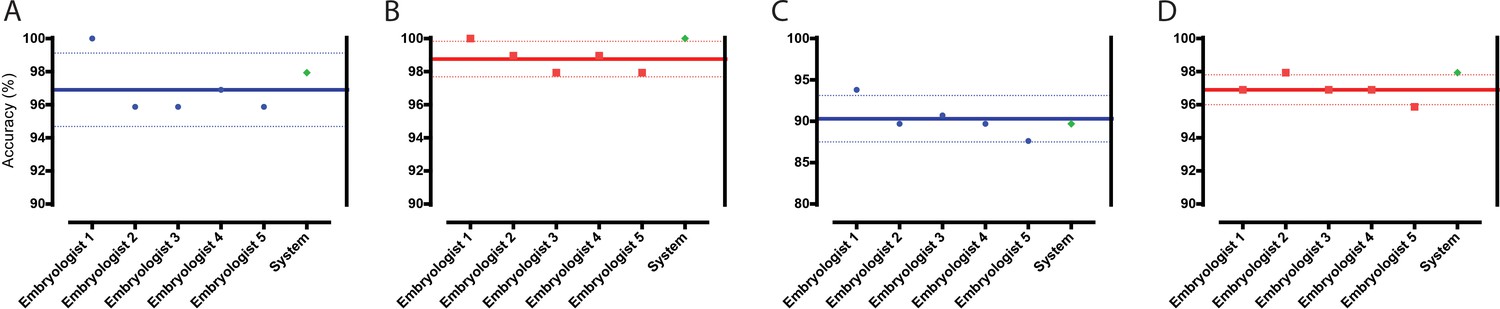
Classification and selection of embryos at 113 hpi.
(A) The performance in single embryo selections by embryologists and the algorithm in selecting blastocysts using embryo morphologies obtained at 113 hpi from 97 patient cohorts. (B) The performance in double embryo selections by the two groups in selecting blastocysts (n = 97 patient cohorts). (C) The performance in single embryo selections by the two groups in selecting the highest quality blastocysts (n = 97 patient cohorts). (D) The performance of the two groups in selecting the highest quality blastocysts when two selections were provided (n = 97 patient cohorts).
Figure 2—figure supplement 1
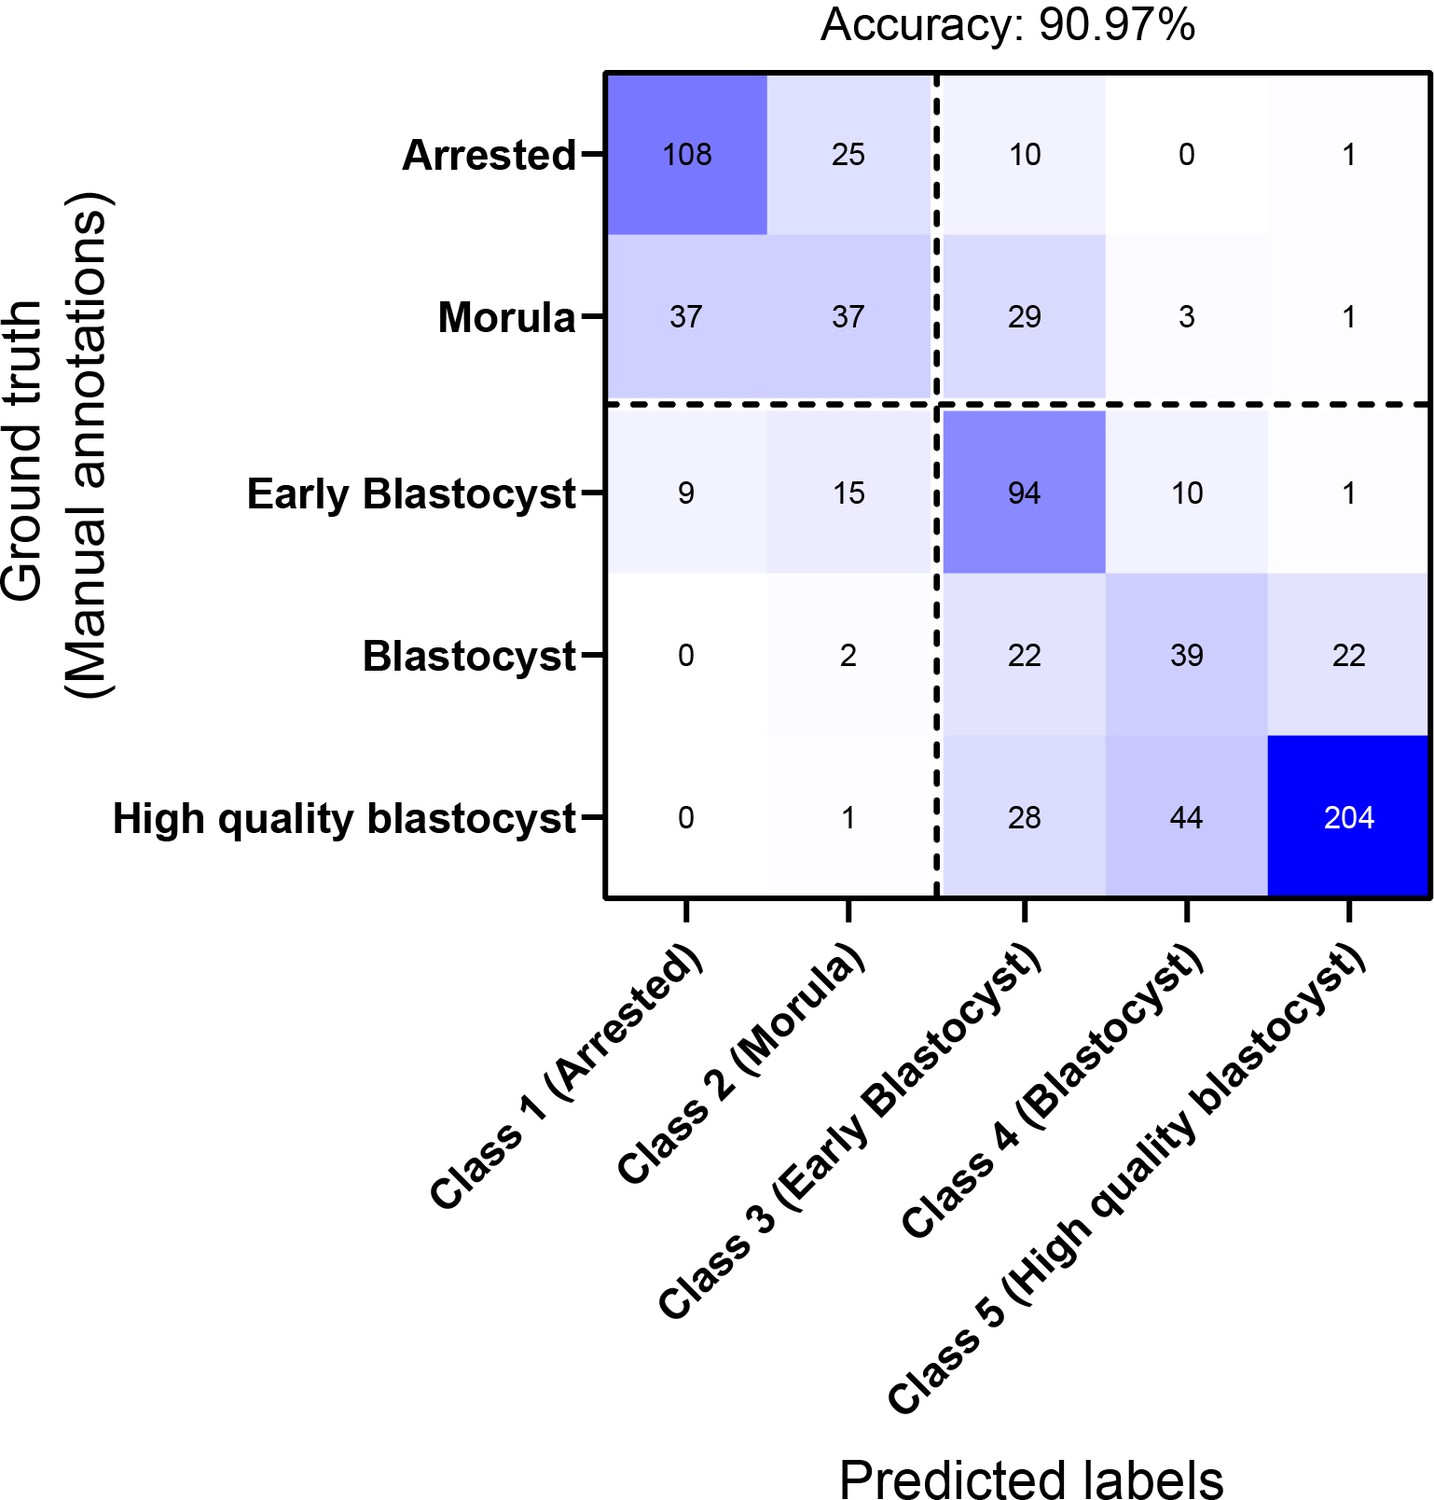
Confusion matrix of the network in classifying embryos based on their morphological quality.
The matrix provides the network’s confusion between the five training classes. The dotted lines represent the separation between non-blastocysts (classes 1 and 2) and blastocysts (classes 3, 4, and 5). The reported accuracy is the binary classification performance accuracy of the CNN in differentiating between the two inference classes (non-blastocysts and blastocysts).
Figure 3 with 1 supplement

Performance in identifying embryos based on implantation outcomes.
(A) The performance of the neural network system in identifying embryos that implanted compared to the baseline historical implantation for the image set (n = 29). The error-bar represents the Clopper-Pearson exact binomial 95% confidence interval. (B) The performance of the neural network system in identifying euploid embryos that implanted compared to the performance of 15 embryologists in identifying implanting embryos (n = 97). The error-bar represents the 95% confidence interval of the embryologists’ performance in identifying implanting embryos.
Figure 3—figure supplement 1
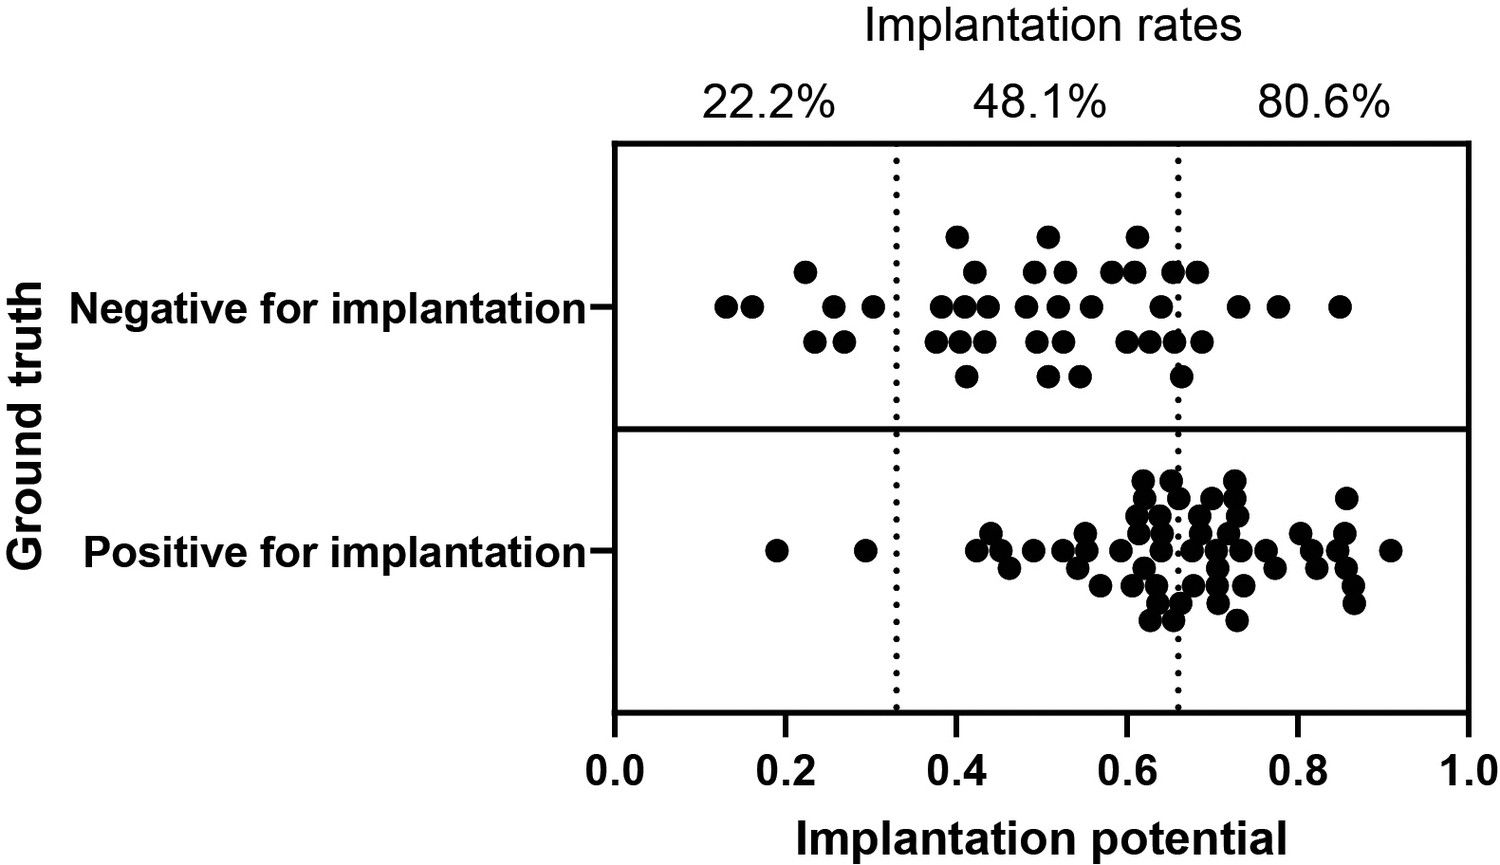
Implantation potential and the relative implantation rates using the euploid embryo test set.
The scatter plot illustrates the implantation potential of the euploid embryos evaluated in this study as measured by the neural network (n = 97). The ground truth represents actual clinical transfer outcomes.
Additional files
-
Supplementary file 1
Patient and Cycle characteristics.
(A) Patient population characteristics. All embryo images (except the PGT screened embryos) utilized for experiments reported in the study were obtained from cycles that belong to the presented distribution of parameters. All values in table are presented as median along with the range unless noted otherwise. (B) Total number of transfer outcomes for embryos selected by the network. A total of 102 fresh-transfer embryos had known implantation outcomes (45 embryos implanted). Twenty-eight frozen transfers were performed by the clinic where 18 implanted. The table lists only embryos which were selected by the network with known outcomes for both fresh cycles and in frozen subsequent transfers. (C) Cycle characteristics of the euploid test set. Embryos used in the euploid embryo differentiation experiment based on the implantation outcomes, originated from cycles that belong to presented distribution of characteristics. These cycles are independent of the original 97 patient cohort test set and also the training data sets. All values in table are presented as median along with the range unless noted otherwise.
- https://cdn.elifesciences.org/articles/55301/elife-55301-supp1-v2.docx
-
Transparent reporting form
- https://cdn.elifesciences.org/articles/55301/elife-55301-transrepform-v2.pdf
Download links
A two-part list of links to download the article, or parts of the article, in various formats.
Downloads (link to download the article as PDF)
Open citations (links to open the citations from this article in various online reference manager services)
Cite this article (links to download the citations from this article in formats compatible with various reference manager tools)
Performance of a deep learning based neural network in the selection of human blastocysts for implantation
eLife 9:e55301.
https://doi.org/10.7554/eLife.55301


