Cell and molecular transitions during efficient dedifferentiation
- MRC Laboratory for Molecular Cell Biology and Department of Cell and Developmental Biology, University College London, United Kingdom
- Ludwig-Maximilians-University Munich, Germany
- CRUK Beatson Institute, Garscube Estate, Switchback Road, Bearsden, United Kingdom
Figures
Figure 1
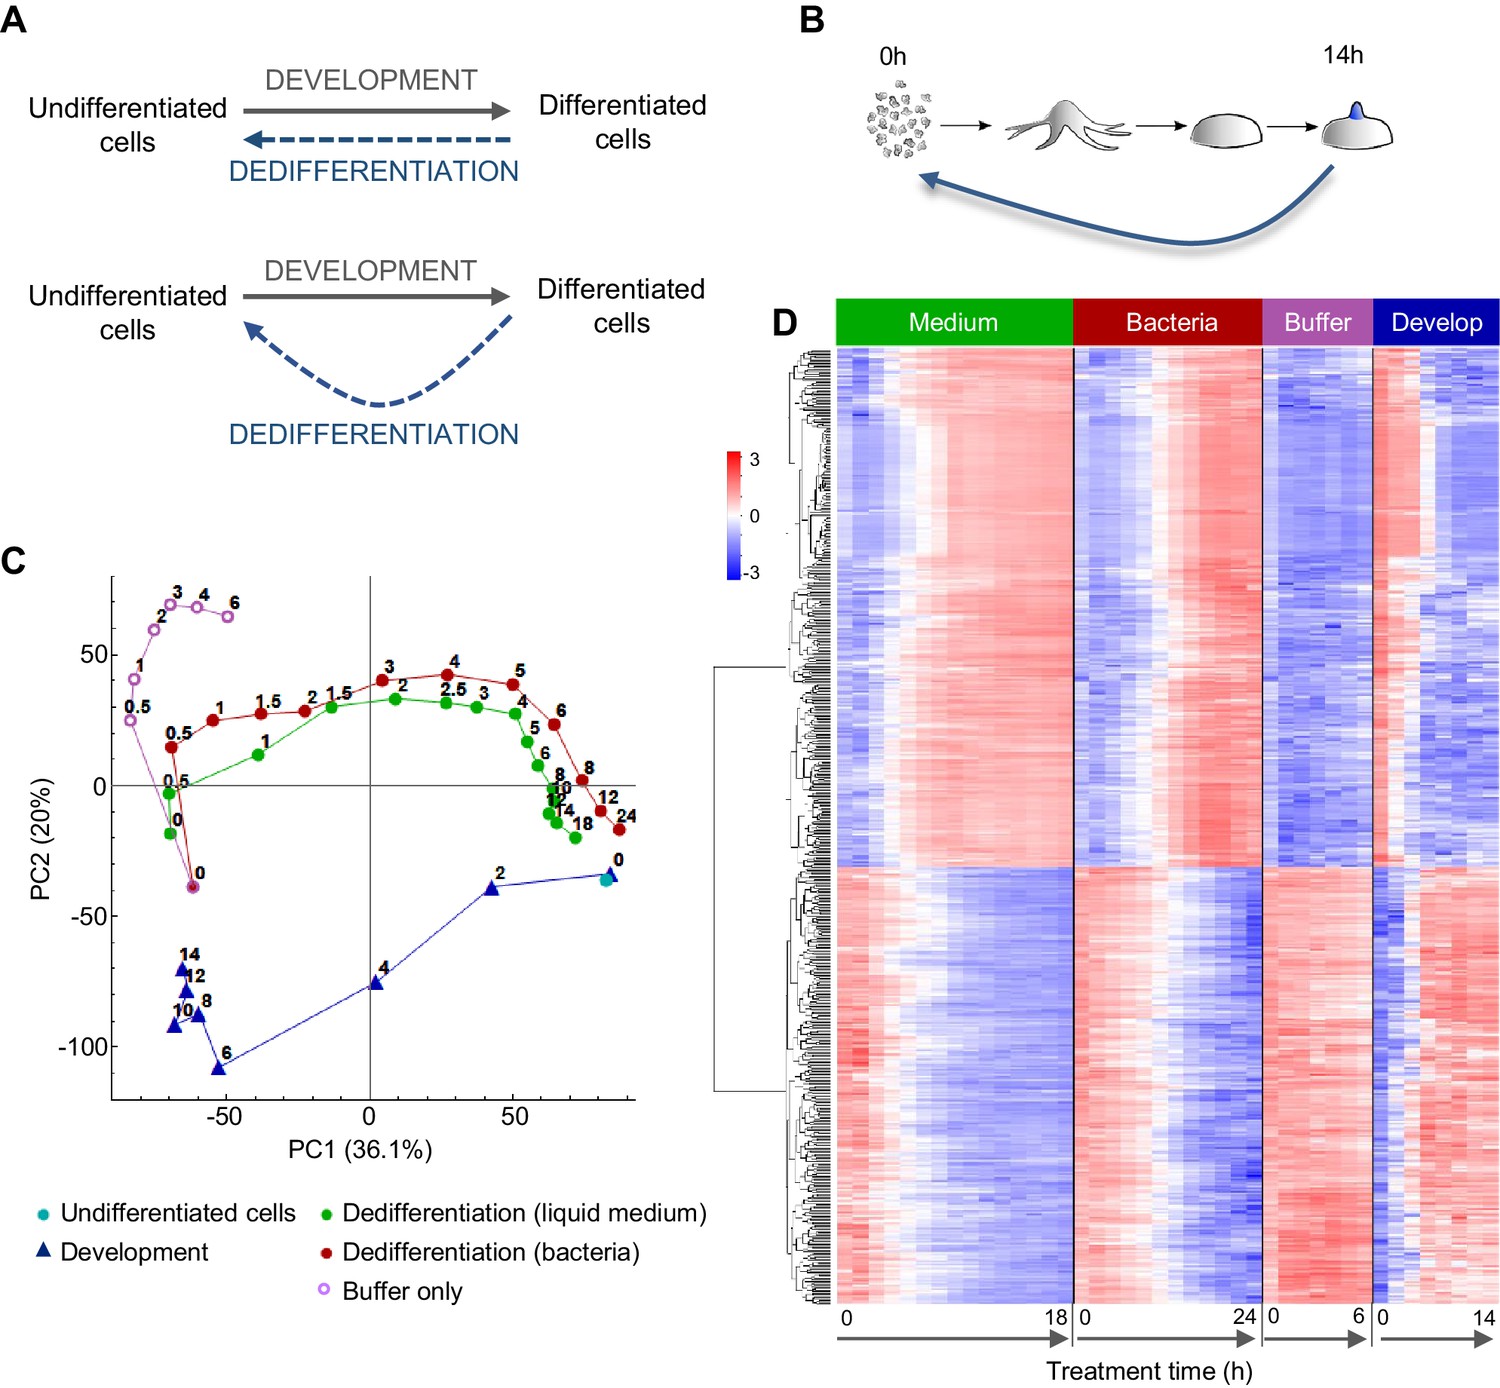
Comparing the gene expression trajectories of dedifferentiation and development.
(A) Schematics of different dedifferentiation scenarios. Top: dedifferentiation is a simple reverse of forward development. Bottom: dedifferentiation visits distinct cell states during reversal. (B) Dictyostelium dedifferentiation is initiated by disaggregation of multicellular aggregates (after 14 hr of development) and transfer of the cells into nutrition (liquid medium or bacteria). (C) Dedifferentiation follows distinct gene expression trajectories compared to forward development. The figure shows principal component analysis (PCA) of RNAseq timecourse data from dedifferentiation in liquid medium and bacteria, forward development, mock dedifferentiation (buffer only) and a control undifferentiated sample captured alongside the dedifferentiation. Each point is the average of two replicates. Numbers on the plot represent time of sampling during dedifferentiation or development. (D) Hierarchical clustering of expression profiles of the 580 genes with highest contribution to the variance described by PC1. Expression changes over time during dedifferentiation in liquid medium and bacteria, buffer only and development are shown. Colour indication based on z-score of log2 read counts with high expression in red and low expression in blue.
Figure 2 with 9 supplements
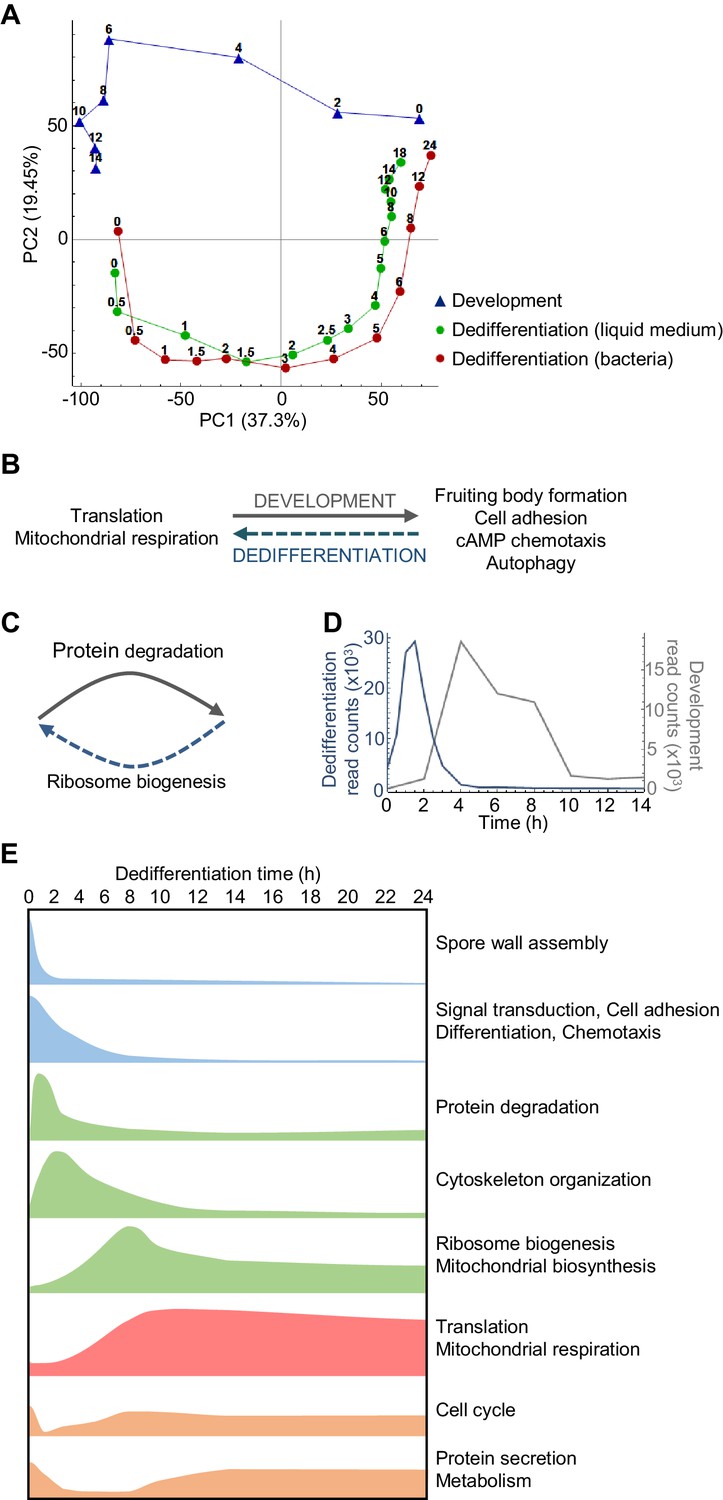
Overlapping and distinct transitions during dedifferentiation and development.
(A) Simplified PCA: RNAseq timecourse data from forward development and dedifferentiation in liquid medium and bacteria. (B) Summary of gene expression transitions during dedifferentiation showing direct reversal of forward development. (C) Summary of gene expression transitions during dedifferentiation distinct from changes during development. (D) Rapid re-induction of a developmental gene during dedifferentiation. Dedifferentiation RNAseq counts in blue, with developmental counts in grey. (E) The major gene expression transitions of dedifferentiation. Data show time series of the changes in transcript read counts for different functional gene classes. Gene classes were determined by GO analysis of clusters of genes showing stereotypical temporal behaviour, identified by hierarchical clustering (refer to Figure 2—figure supplement 5, 6, 7, 8 and 9).
Figure 2—figure supplement 1
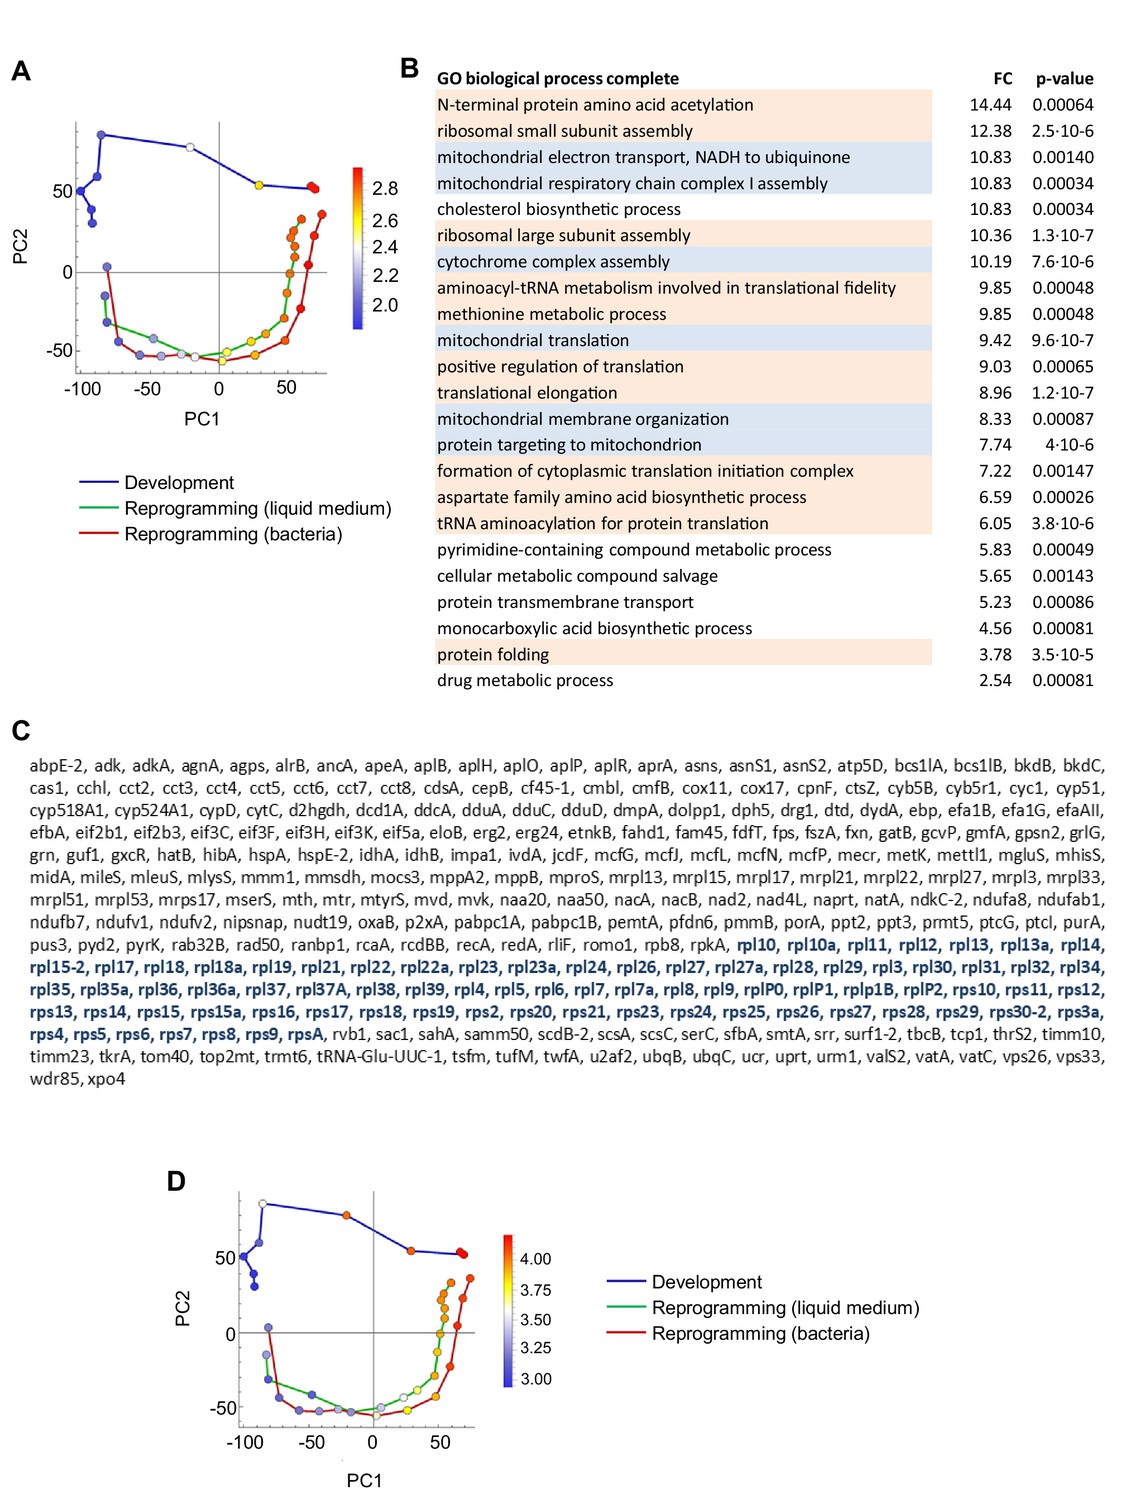
Genes induced during dedifferentiation and repressed during development.
(A) Overlay of genes used for GO analysis onto the PCA plot of population RNAseq data from Figure 2A. The genes selected were the top positively contributing genes to PC1 variance (594 genes). Colour indications on PCA plot based on mean of log10 counts. (B) Significantly enriched GO terms (p<0.05). The majority of terms relate to translation (orange) and mitochondrial respiration (blue). (C) Strong enrichment of ribosome proteins in the strong positive PC1 loadings. Only genes with annotated names are shown in this list. (D) Same PCA plot as in A, overlaid with expression of ribosomal protein genes.
Figure 2—figure supplement 2
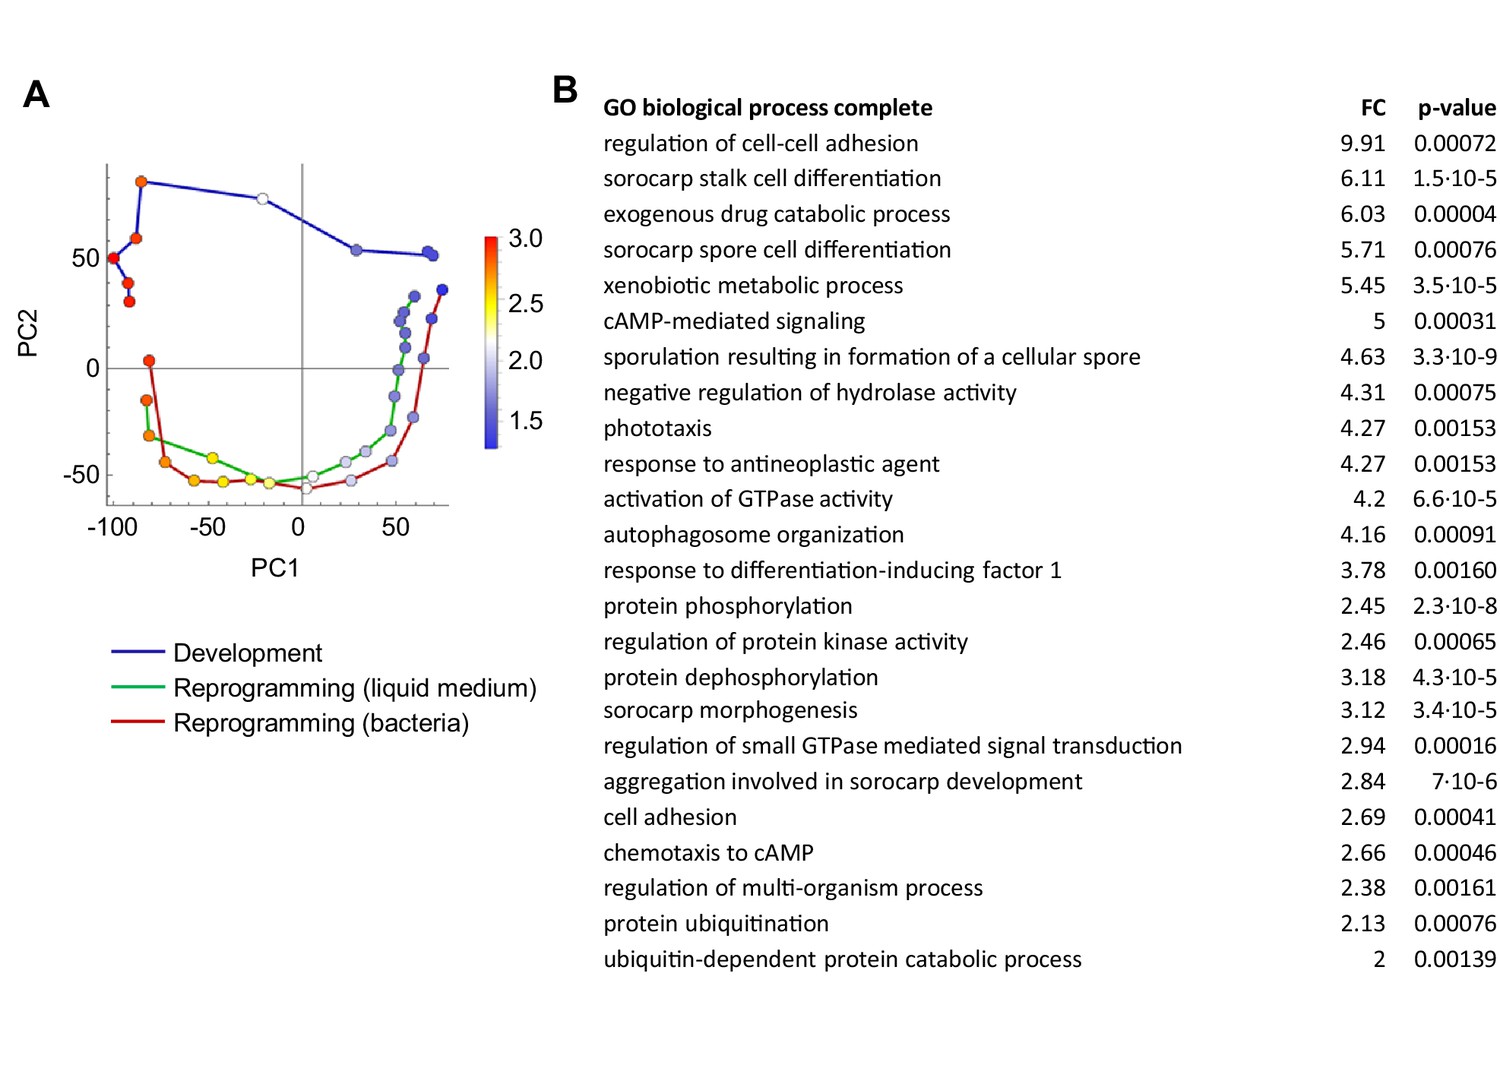
Genes repressed during dedifferentiation and induced during development.
(A) Overlay of genes used for GO analysis onto the PCA plot of population RNAseq data from Figure 2A. The genes selected were the top negatively contributing genes to PC1 variance (924 genes). Colour indications on PCA plot based on mean of log10 counts. (B) Significantly enriched GO terms (p<0.05). The majority of terms relate to development: adhesion, cAMP signalling, terminal differentiation and autophagy.
Figure 2—figure supplement 3

Genes specific to development, not dedifferentiation.
(A) Overlay of genes used for GO analysis onto the PCA plot of population RNAseq data from Figure 2A. The genes selected were the top positively contributing genes to PC2 variance (547 genes). Colour indications on PCA plot based on mean of log10 counts. (B) Significantly enriched GO terms (p<0.05). Enriched terms relate to secretion, transcription and proteasome. (C) Enrichment of proteasomal genes (blue) in the strong positive PC2 loadings. Only genes with annotated names are shown in this list. (D) Same PCA plots as in A, overlaid with expression of proteasomal genes.
Figure 2—figure supplement 4
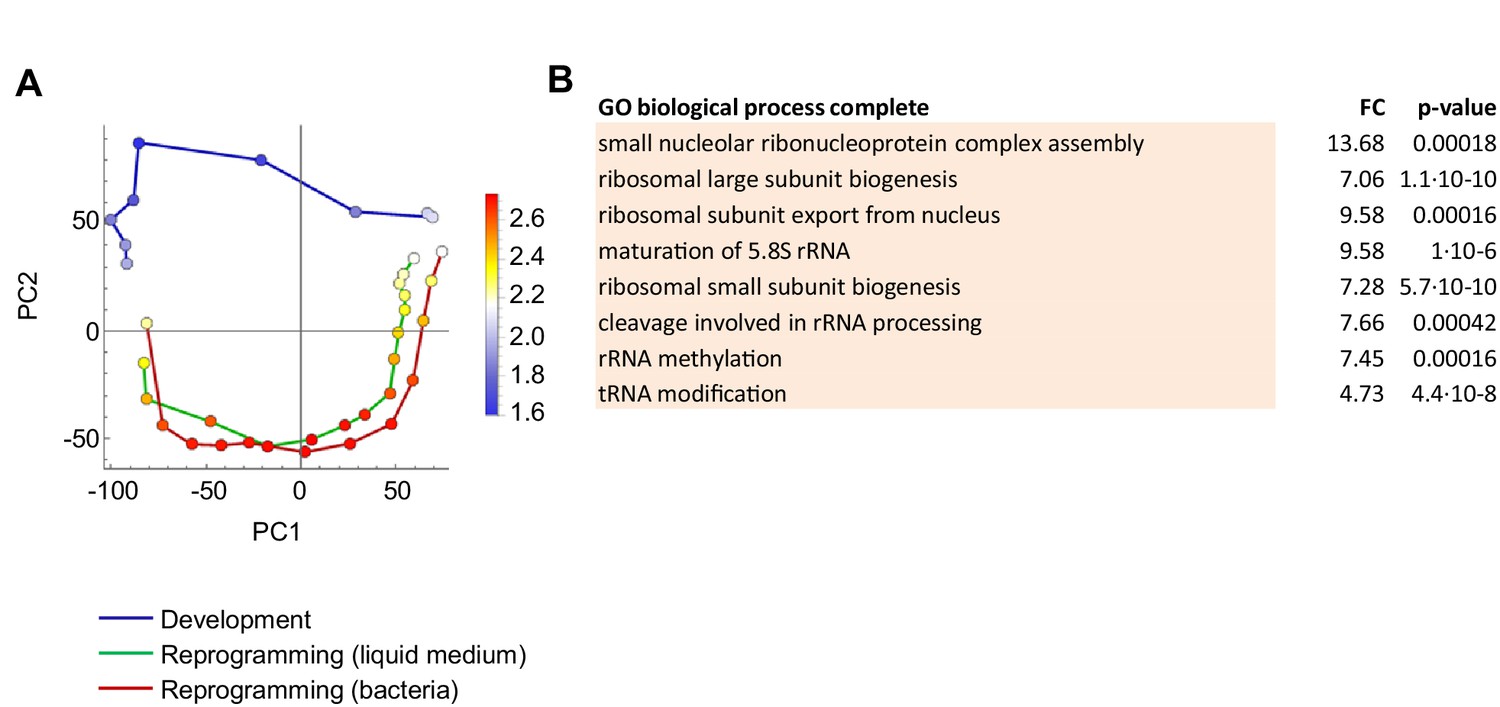
Genes specific to dedifferentiation, not development.
(A) Overlay of genes used for GO analysis onto the PCA plot of population RNAseq data from Figure 2A. The genes selected were the top negatively contributing genes to PC2 variance (673 genes). Colour indications on PCA plot based on mean of log10 counts. (B) Significantly enriched GO terms (p<0.05). All terms relate to ribosome biogenesis.
Figure 2—figure supplement 5
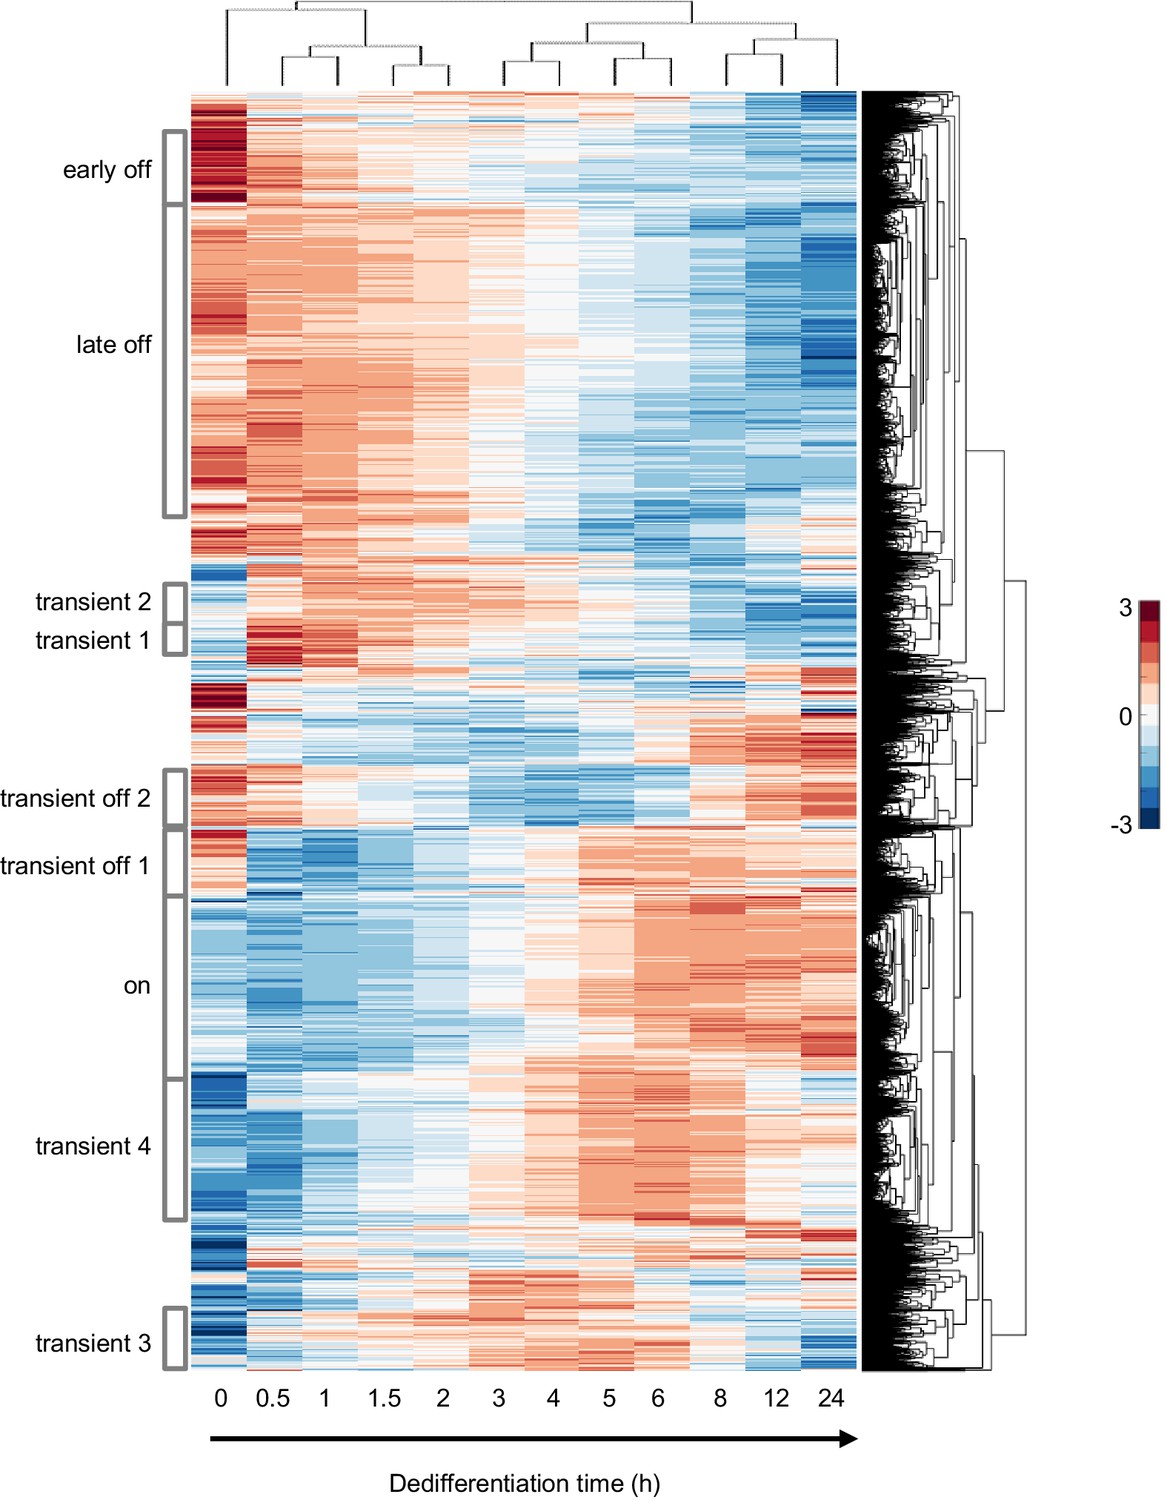
Different classes of gene expression profile during dedifferentiation.
Two-way hierarchical clustering of gene expression changes during dedifferentiation on bacteria. The horizontal axis represents time during dedifferentiation and the vertical axis represents genes, with major branches in the clustering tree used as the basis to identify discrete clusters with specific dynamic trends: ‘early off’, ‘late off’, ‘transient 1–4’, ‘on’ and ‘transient off 1 and 2’. Colour indication based on z-score of log2 counts.
Figure 2—figure supplement 6

Functional enrichment analysis of genes repressed during dedifferentiation.
Left panels show enlarged segments of Figure 2—figure supplement 5 showing (A) ‘early off’ (412 genes) and (B) ‘late off’ (1774) clusters. The accompanying GO tables are shown on the right, with ‘early off’ genes enriched for terminal differentiation terms and ‘late off’ genes enriched for signalling, adhesion, differentiation and chemotaxis terms.
Figure 2—figure supplement 7
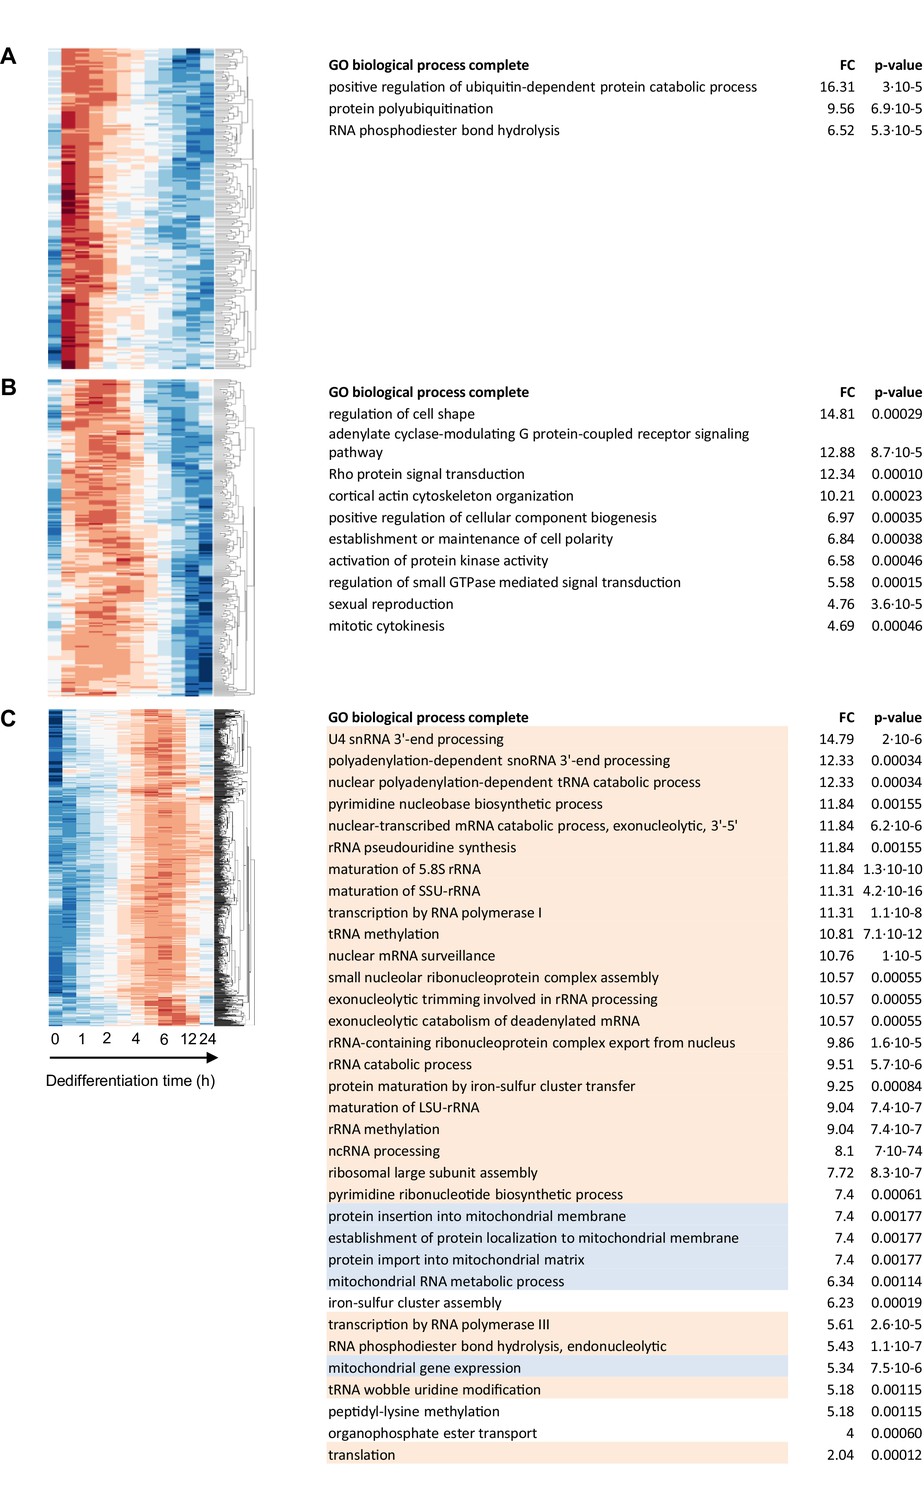
Functional enrichment analysis of genes transiently induced during dedifferentiation.
Left panels show enlarged segments of Figure 2—figure supplement 5 showing (A) ‘transient 1’ (188 genes), (B) ‘transient 2’ (218) and (C) ‘transient 4’ (867) clusters. The accompanying GO tables are shown on the right, with ‘transient 1’ genes enriched for protein degradation, ‘transient 2’ enriched for cytoskeletal organisation and ‘transient 4’ enriched for ribosome biogenesis (orange) and mitochondrial biosynthesis (blue). There were no significantly enriched terms for the ‘transient 3’ cluster (324).
Figure 2—figure supplement 8

Functional enrichment analysis of genes induced during dedifferentiation.
Left panels show enlarged segment of Figure 2—figure supplement 5 showing the ‘on’ cluster (990 genes). The accompanying GO table is shown on the right, with the genes enriched for translation (orange) and mitochondrial respiration (blue).
Figure 2—figure supplement 9
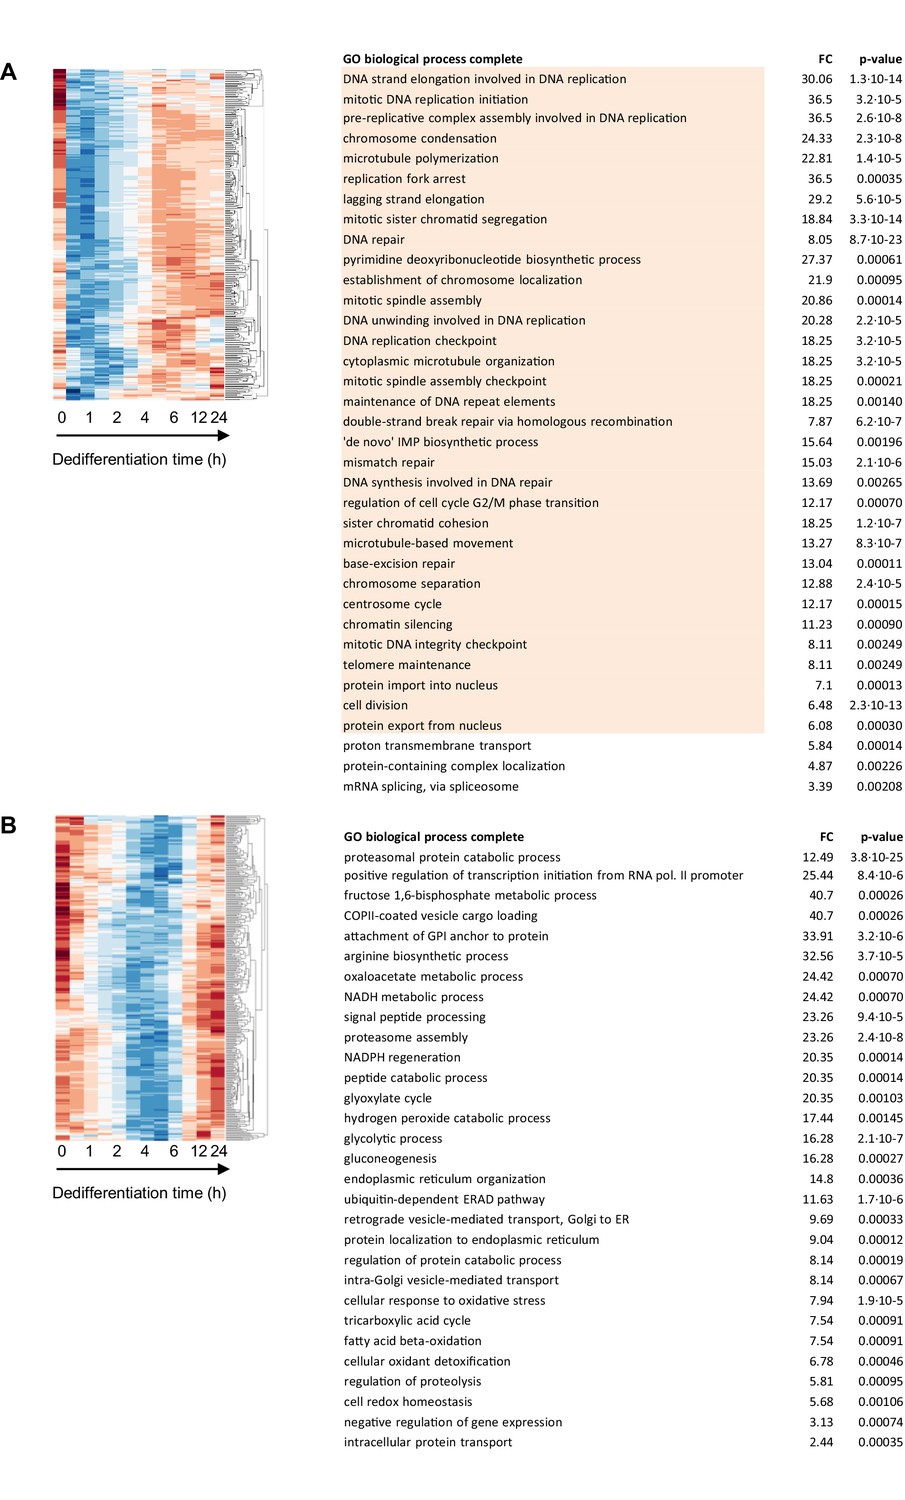
Functional enrichment analysis of genes transiently repressed during dedifferentiation.
Left panels show enlarged segments of Figure 2—figure supplement 5 showing (A) ‘transient off 1’ (313 genes) and (B) ‘transient off 2’ (349) clusters. The accompanying GO tables are shown on the right, with ‘transient off 1’ genes enriched for cell cycle terms (orange) and ‘transient 2’ genes enriched for protein secretion and metabolism.
Figure 3 with 1 supplement

Molecular regulation of dedifferentiation.
(A) Testing the importance of transcription factors expressed early in dedifferentiation. Expression of bzpS and mybD during dedifferentiation in liquid medium alongside their developmental profiles (left). Right: PCA of transcriptome changes during dedifferentiation of wild type and bzpS and mybD mutants. See Table 1 for details of additional mutants. (B) Disrupted gene expression during dedifferentiation in forG- and rasS- mutants. Northern blots of PCNA, HspE and Rpl15 expression during dedifferentiation in wild-type, forG- and rasS- cells, with RNA loading indicated by 26S rRNA. PCNA blots representative of three experiments. (C) PCA of transcriptome changes during the dedifferentiation of forG- and wild-type cells. PCA carried out on the mean read counts of two biological replicates. (D) Onset of fluid uptake during dedifferentiation of wild-type (AX2) cells in liquid medium, measured as a fraction of the fluid uptake by undifferentiated cells. Data are the mean and SD of four replicates, except for 30 hr, with three replicates. (E) Rapid changes in phosphorylation of nutrient response markers during dedifferentiation in liquid culture. Phospho-western blotting of AMPKα and 4E-BP1 phosphorylation. UD = undifferentiated cell sample. Equal amounts of protein loaded, with histone H3 used as a standard (three replicates).
Figure 3—figure supplement 1
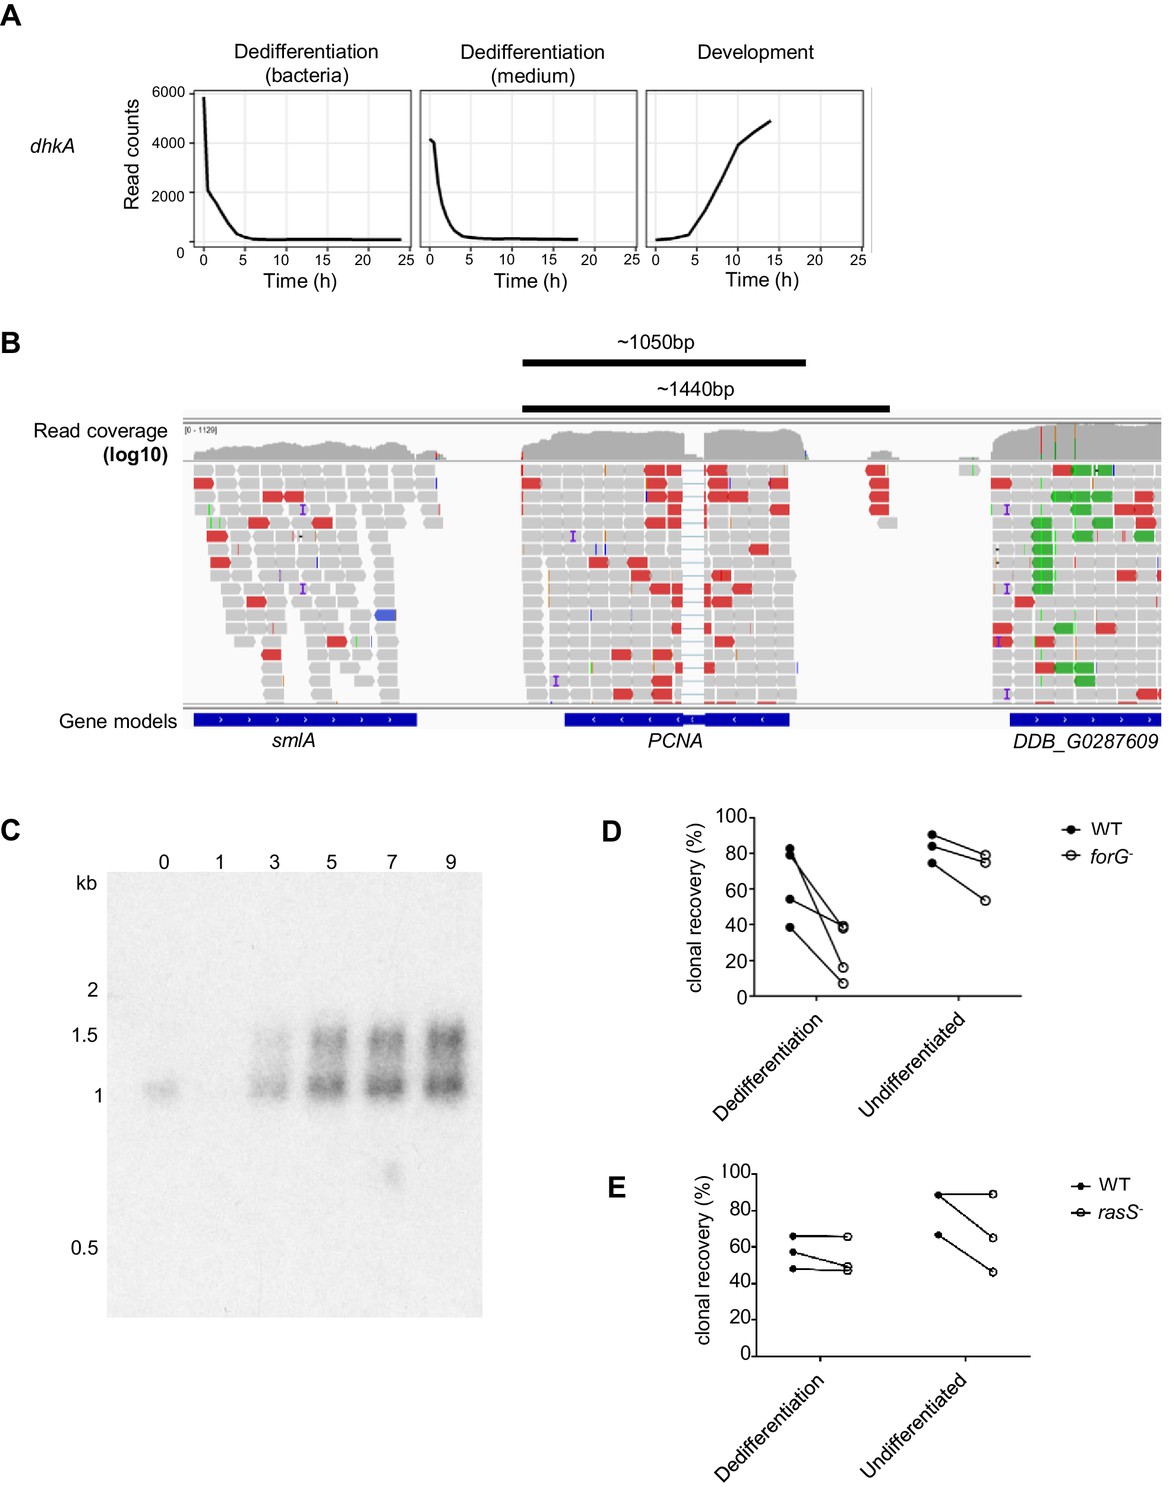
Analysis of candidate regulators of dedifferentiation.
(A) DhkA mRNA expression is strongly repressed during dedifferentiation. Expression of dhkA during dedifferentiation in bacteria and liquid medium alongside its developmental profile. (B) Schematic showing genomic location of mapped RNAseq reads at the PCNA locus. In the representative example shown from AX2 cells in liquid medium, read count within the PCNA gene is ~250, read count in upstream intergenic region is ~5 reads. (C) Northern blot showing size of transcripts detected in PCNA doublet. Samples are from wild-type (DH1) cells at 0, 1, 3, 5, 7 and 9 hr of dedifferentiation. (D) and E) Clonal recovery success of differentiating forG- and rasS- cells. Clonal recovery of single cells dedifferentiating on bacteria is shown for WT and mutant cells, alongside clonal recovery of undifferentiated WT cells. (D) ForG-: four experiments, using at least 150 input cells, undifferentiated data from 3 days, at least 150 input cells. (E) For rasS- cells. Data show three repeats of at least 150 input cells. For D and E, paired data indicated by lines joining the points.
-
Figure 3—figure supplement 1—source data 1
Fluid uptake and clonal recovery data.
Related to Figure 3D and Figure 3—figure supplement 1D,E.
- https://cdn.elifesciences.org/articles/55435/elife-55435-fig3-figsupp1-data1-v2.xlsx
Figure 4 with 1 supplement
Single cell analysis of the coupling between events of dedifferentiation.
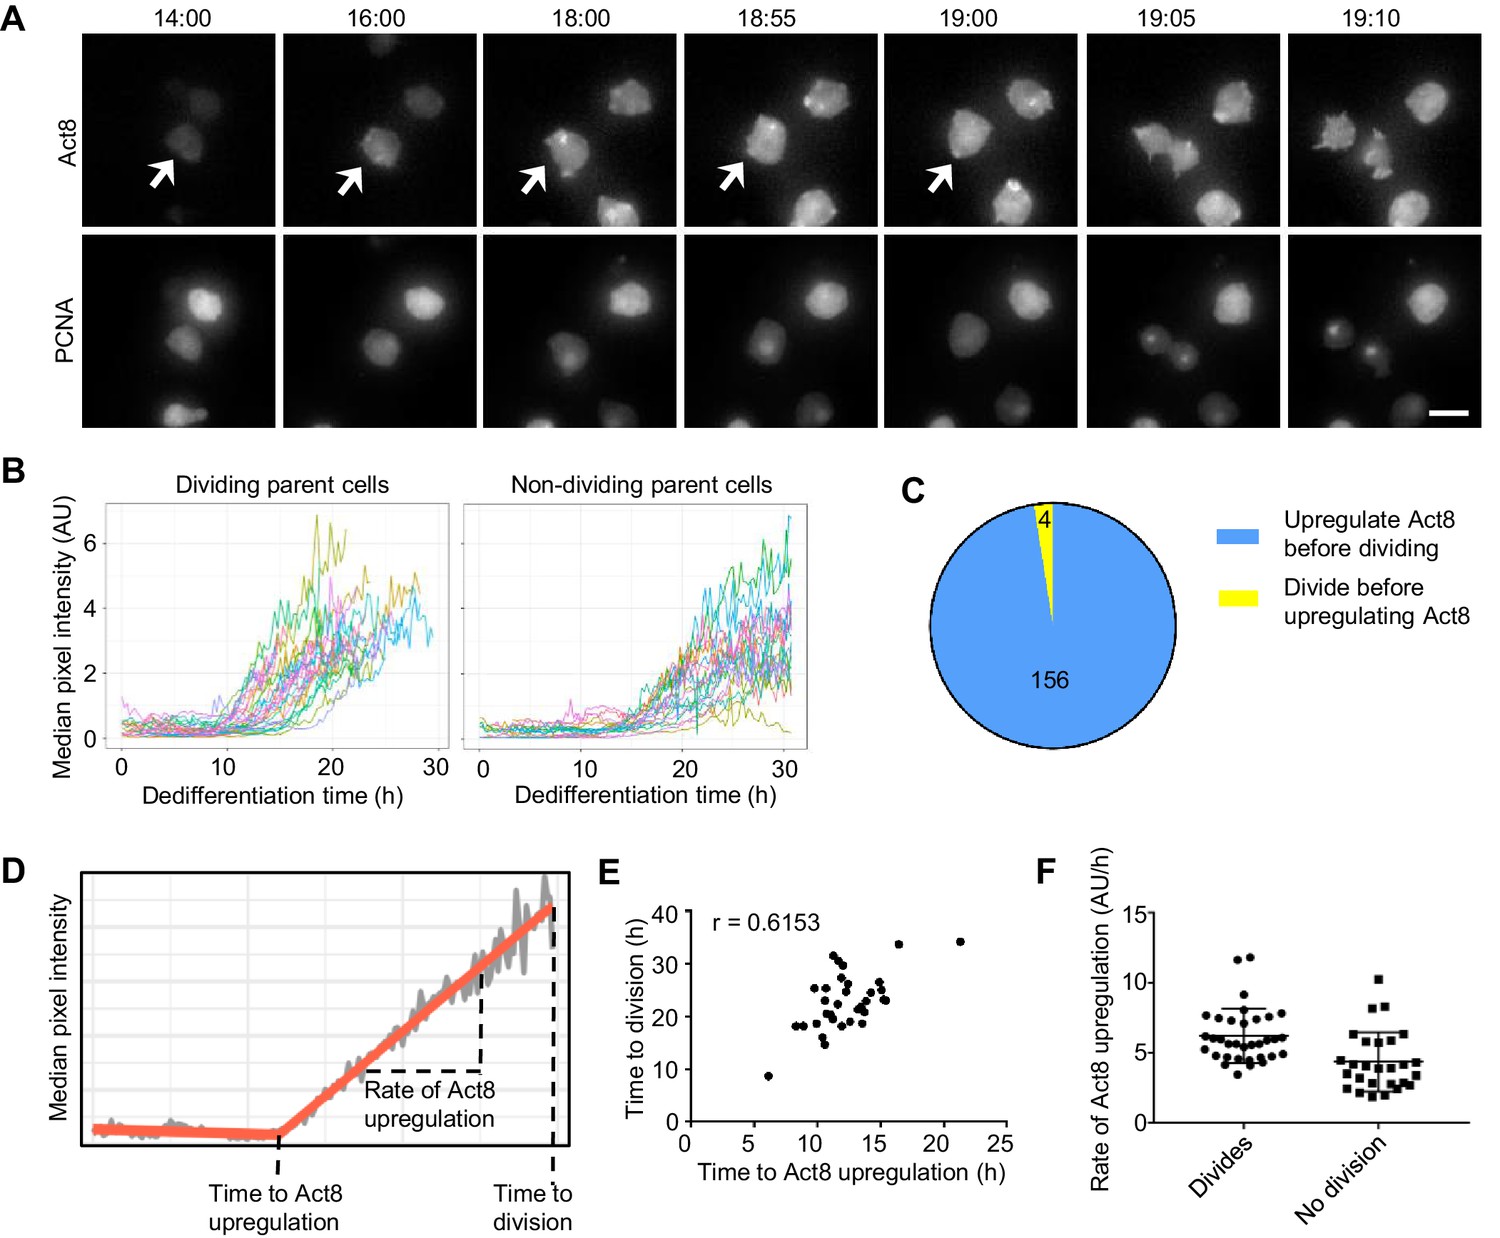
(A) Example time lapse showing dedifferentiating amoebae expressing Act8 and PCNA reporters. Arrow indicates dividing cell. Scale bar = 10 μm. Time is hr:min. (B) Act8 reporter expression is induced earlier in dividing cells. Data from one representative experiment (354 cells over four experiments). (C) Proportion of cells that divided before or after onset of Act8 reporter expression, cell numbers indicated. (D) Schematic (based on real data) showing parameters extracted from Act8 expression traces and their relationship to the first cell division during dedifferentiation. (E) Correlation between time of Act8 expression onset and first division. Data from one experiment (36 divisions), representative of four independent experiments (160 divisions total, mean r = 0.5877). (F) Rate of increase of Act8 expression is higher in dividing than non-dividing cells. Data shown (36 dividing cells, 27 non-dividing) representative of four independent experiments (354 cells total). Mann-Whitney p value = 0.0002. Mean and SD are shown.
Figure 4—figure supplement 1
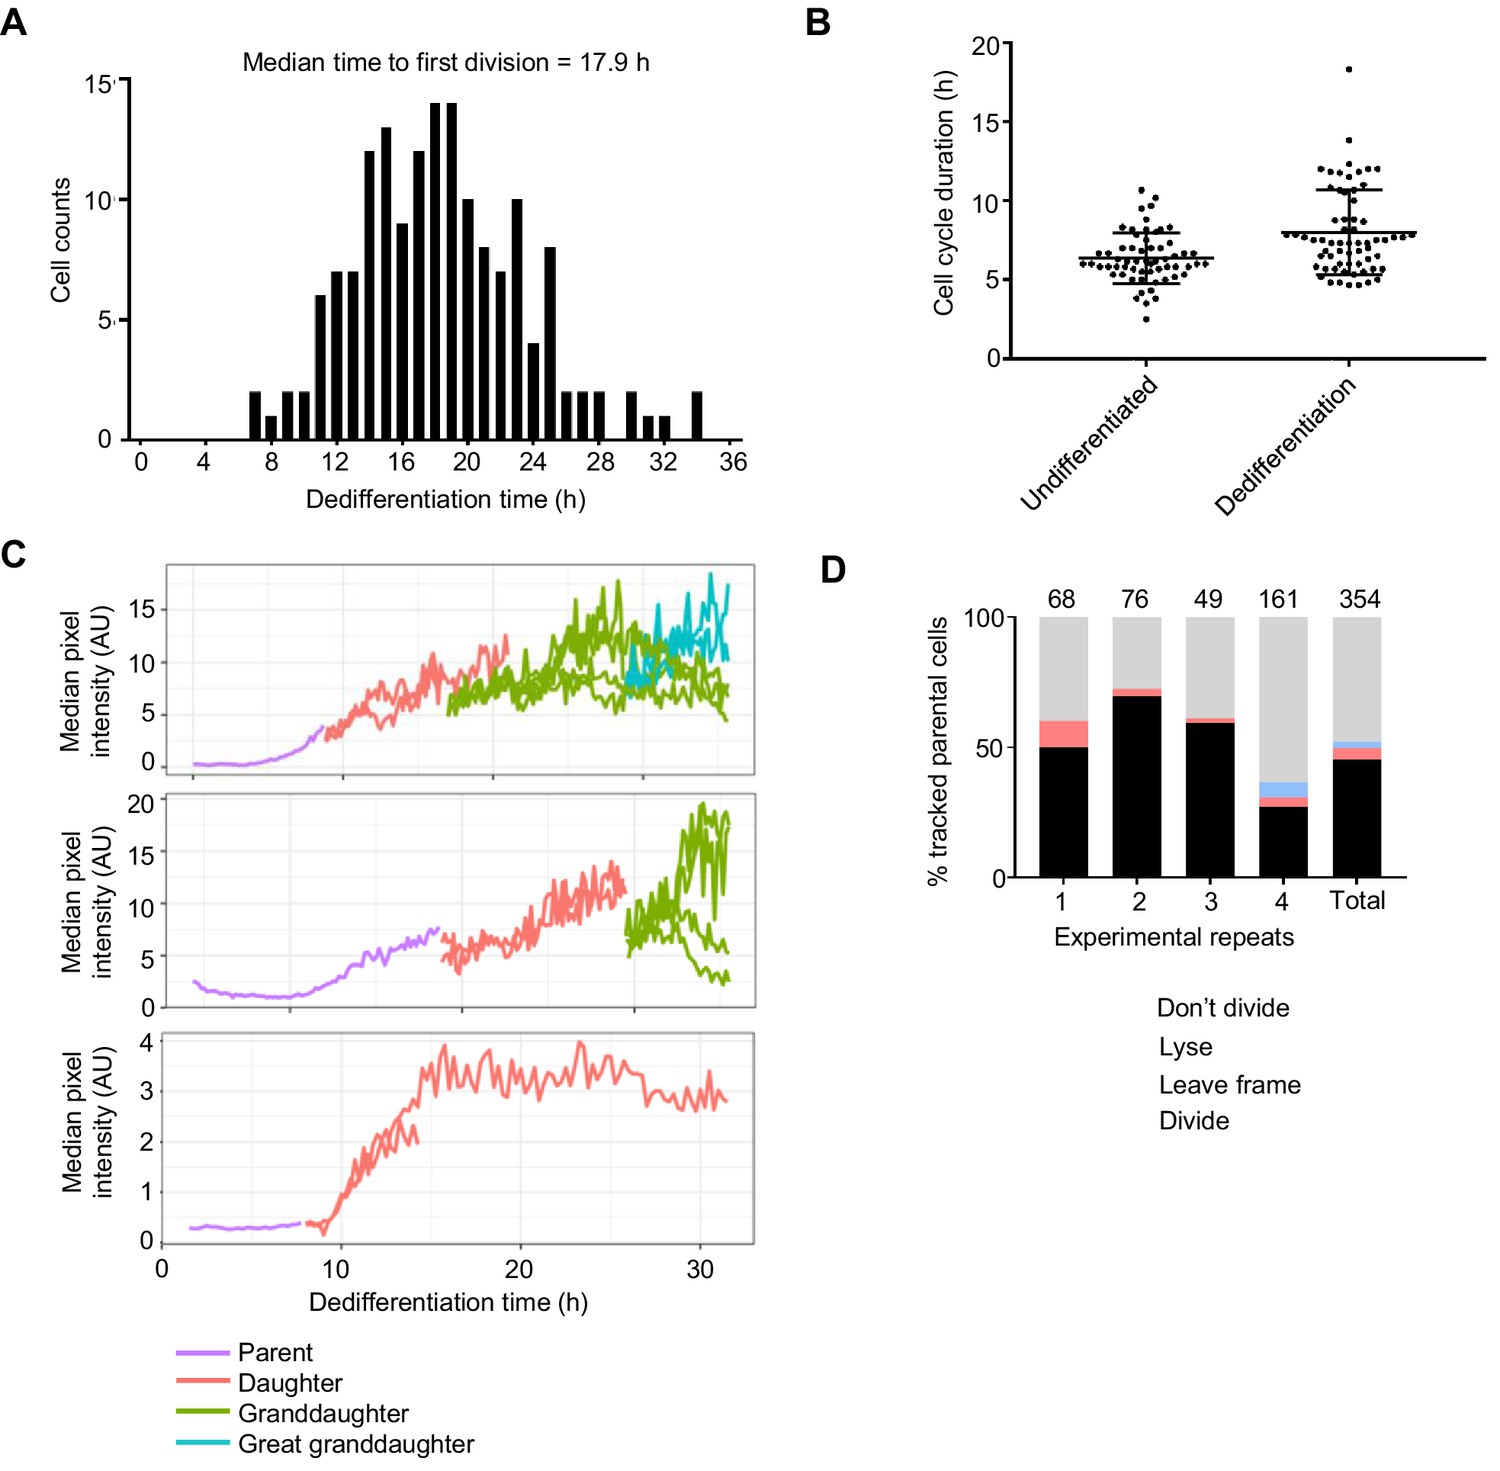
Timing of gene expression changes and cell division during dedifferentiation in single cells.
(A) Distribution of times to first division (160 dividing cells pooled from four experiments). (B) Comparing cell cycle duration of dedifferentiating cells (n = 64, four replicates) with undifferentiated cells (n = 60, two replicates). The cell cycle duration plotted here is the first complete cycle after onset of dedifferentiation (the cycle after the first mitosis). Plot shows mean and SD. Mann-Whitney p=0.0005. (C) Examples of Act8 reporter expression in lineages of dedifferentiating cells. Onset of Act8 induction occurs before division in the majority of cases, but expression often continues to increase in daughter and granddaughter cells. In the bottom panel is an example of a cell dividing before the increase in Act8 reporter expression. (D) Summary statistics of single cell tracking for 354 dedifferentiating cells, with individual experiments and pooled data shown.
-
Figure 4—figure supplement 1—source data 1
Act8 reporter intensity tracks, cell fate data, Act8 reporter induction measurements, and cell cycle duration measurements.
Related to Figure 4B–F and Figure 4—figure supplement 1.
- https://cdn.elifesciences.org/articles/55435/elife-55435-fig4-figsupp1-data1-v2.xlsx
Figure 5 with 1 supplement
Coupling between cell motility and rate of dedifferentiation.
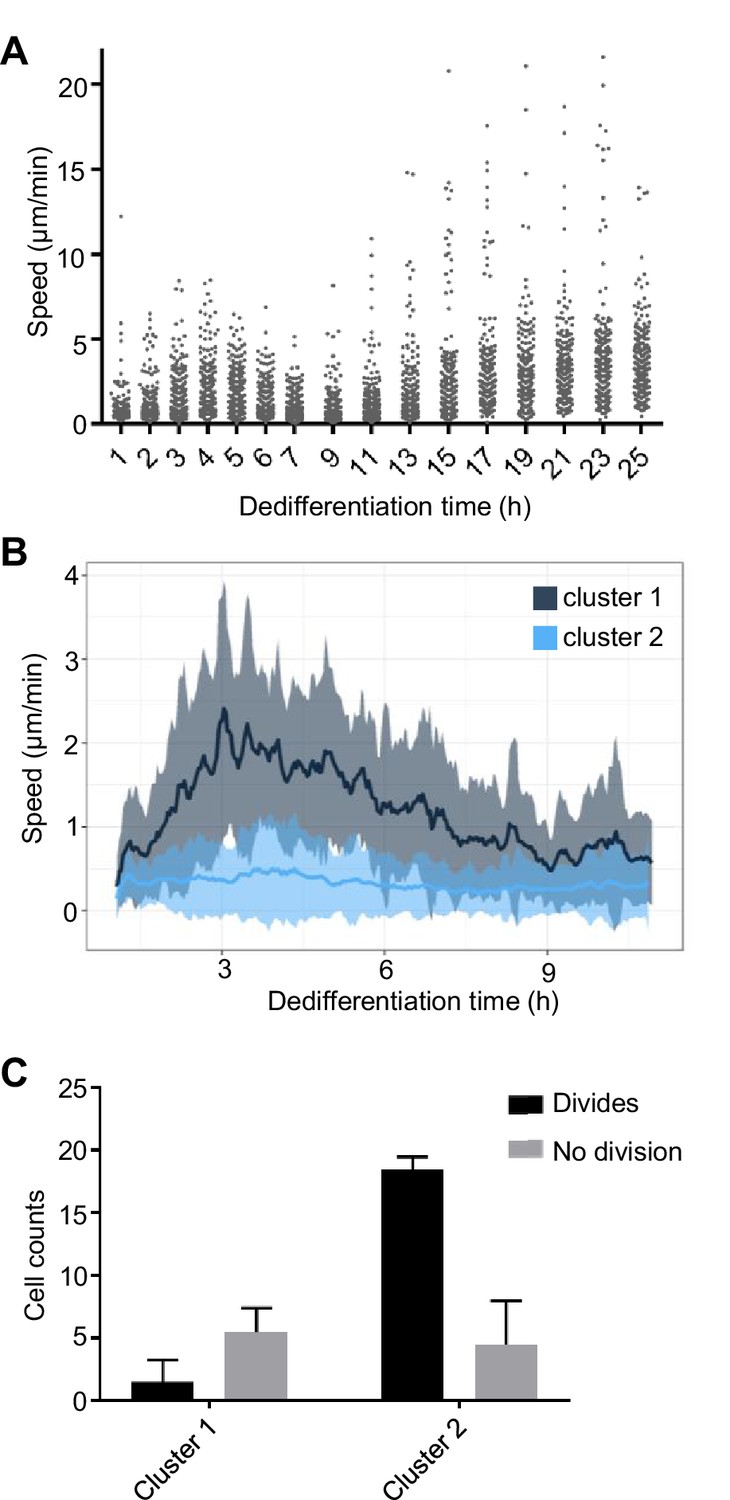
(A) Regulation of cell motility during dedifferentiation. Cell speed was measured over 20 min windows, with image capture at 30 s intervals. 244–250 cells were captured for each time point, pooled from four replicates. (B) Distinct cell motility behaviours of cells during dedifferentiation. Two distinct clusters of cell speed profiles were identified. Speed is shown as a rolling average using a 10 min window. Line shows mean speed. Shaded area shows SD. Tracking used the same data as A, but cells were tracked continuously for the period shown rather than at intervals (120 tracks). (C) Slower cells are more likely to divide. Cells in the fast and slow moving clusters were scored for division or no division. The less motile cluster showed a greater tendency to divide during the period of image capture (25 hr). four independent imaging experiments, 30 cells per experiment. Mean and SD are shown. χ2p<0.0001.
-
Figure 5—source data 1
Cell speed, persistence and division data for motility experiments.
Related to Figure 5 and Figure 5—figure supplement 1.
- https://cdn.elifesciences.org/articles/55435/elife-55435-fig5-data1-v2.xlsx
Figure 5—figure supplement 1
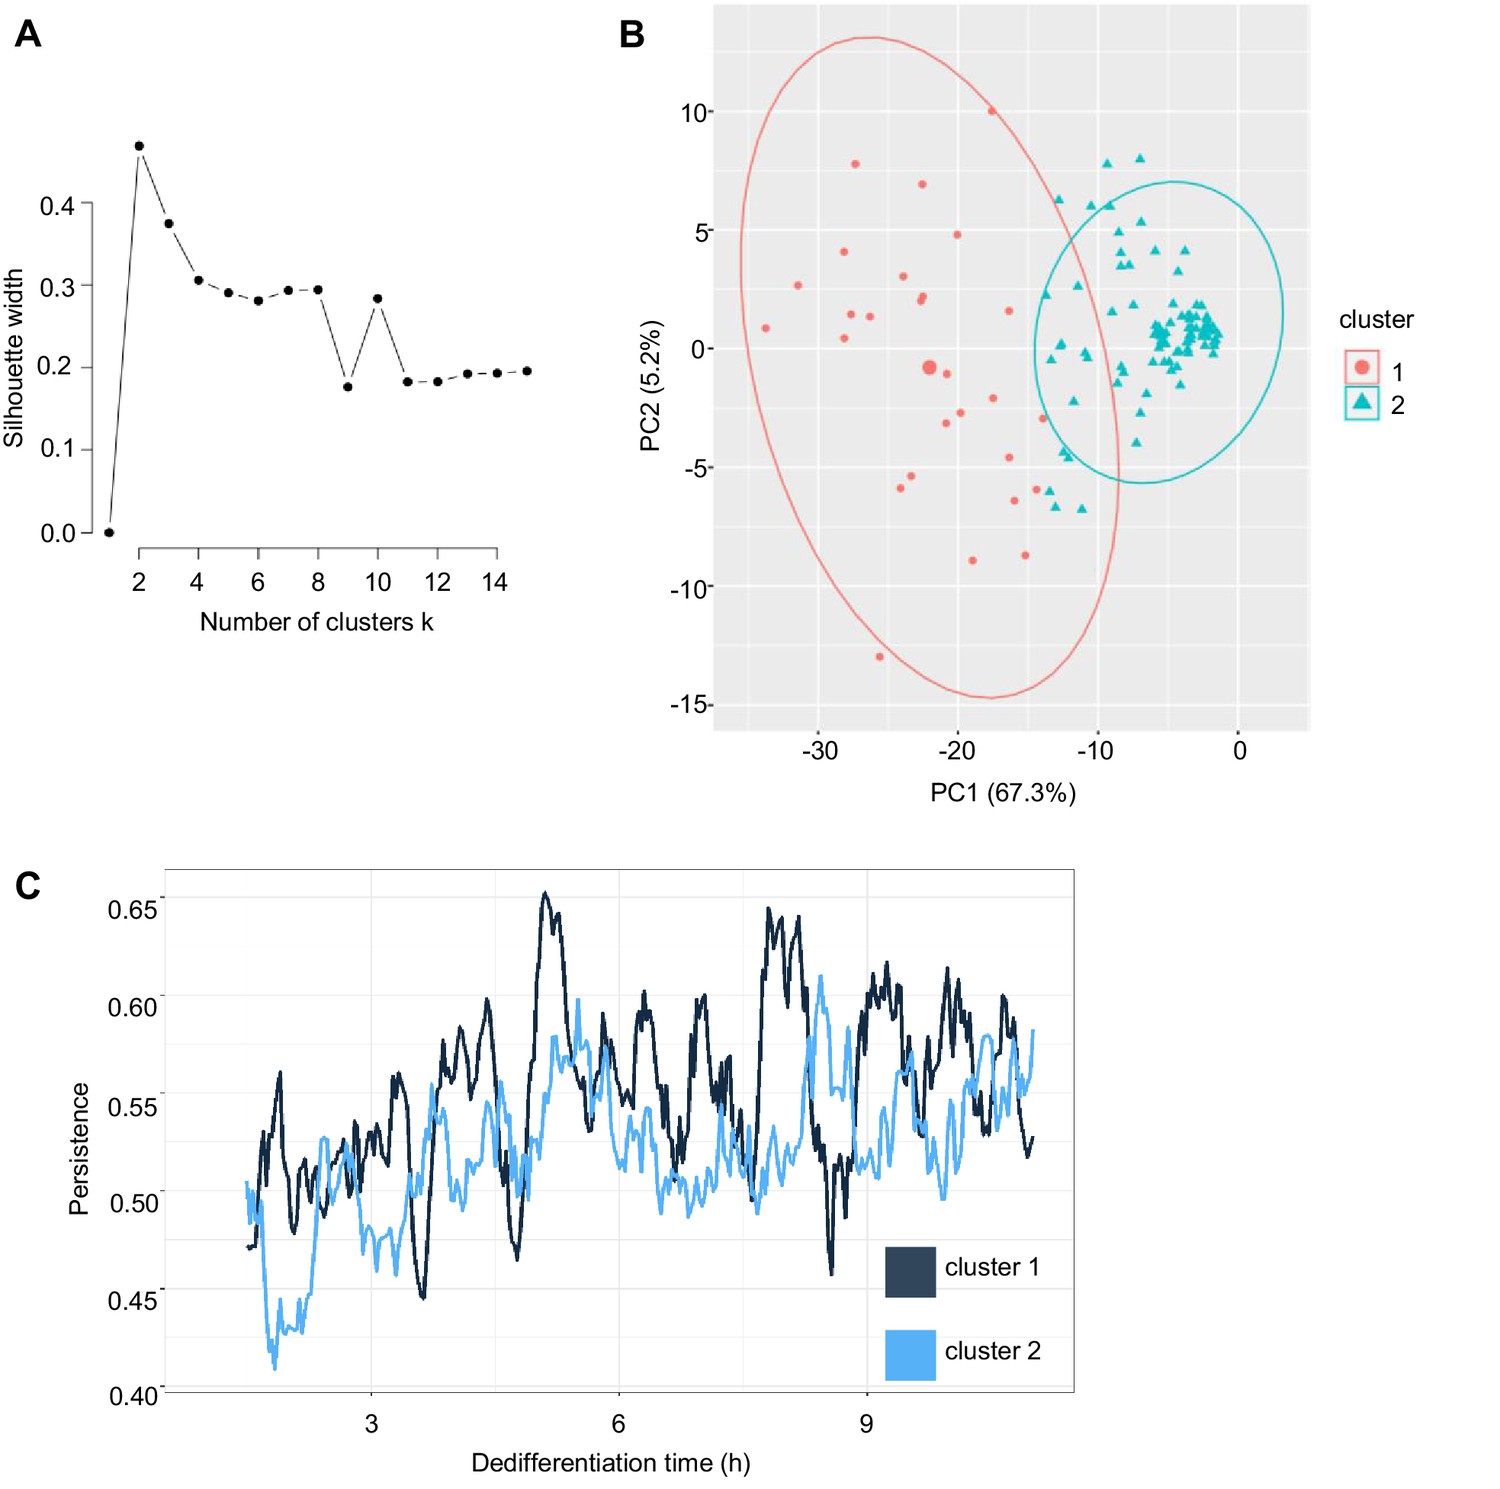
Heterogeneity in cell motility during dedifferentiation.
(A) Defining the number of motility clusters using silhouette criteria. Average silhouette width for different numbers of clusters in k-means clustering of cell speed profiles. Two clusters were chosen on the basis of maximum silhouette width. (B) Principal component analysis of cell speed profiles highlighting cell clusters. Small circles and triangles show individual cells, large circle and triangle indicate cluster centre. (C) Persistence of motility during the first 11 hr of dedifferentiation, for cells clustered on the basis of speed; cluster 1 (28 cells), cluster 2 (92 cells). Persistence defined as accumulated distance/Euclidean distance and was calculated for a sliding window of 30 min for each cell. Data pooled from four independent experiments.
Figure 6 with 1 supplement

Rapid convergence of dedifferentiation trajectories.
(A) The expression of the prestalk reporter (CryS-mNeonGreen) does not predict division probability during dedifferentiation. Reporter intensity at the beginning of dedifferentiation shows no significant difference between dividing and non-dividing cells (KS test p=0.134). Plots show mean and SD. One of two replicates shown (261 cells). (B) Initial fate and division time are not related. Relationship between initial CryS intensity and division time during dedifferentiation. One of two replicates shown (n = 124 divisions, r = 0.0864 mean of replicates). (C) Initial fate and motility are not correlated. Relationship between initial CryS expression and speed during the first 4 hr of dedifferentiation (442 cells). Vertical line indicates 80th percentile of CryS:mNeonGreen intensity. Mean r for two replicates = 0.0481. (D) Expression of different gene sets during dedifferentiation in 925 single cells (experimental replicate shown in Figure 6—figure supplement 1). PCA of scRNAseq overlaid with expression of a set of 303 developmentally induced genes (left panel), 276 genes turned off during development (centre panel) with 81 ribosome protein genes also shown (right panel). Each dot represents a cell. Cells were pooled from samples taken each hour during dedifferentiation (0–6 hr). (E) Schematic of the inferred path of cells during dedifferentiation. (F) Cell type specific gene expression during dedifferentiation. The same PCA plots as in D, but overlaid with the expression of sets of 42 prespore or 48 prestalk genes. (G) Cell type specific expression is more clearly delineated by PC3. The same expression data as in F plotted in PC1/PC3 space. (H) Convergence of cell type specific gene expression trajectories during dedifferentiation. Same plot as G, highlighted to show the inferred trajectories of cells with different starting fates. PCA colour scale indicates mean of log10 counts.
-
Figure 6—source data 1
CryS reporter intensity, cell division and cell speed data.
Related to Figure 6A–C.
- https://cdn.elifesciences.org/articles/55435/elife-55435-fig6-data1-v2.xlsx
Figure 6—figure supplement 1

Convergence of dedifferentiation trajectories.
Data shown are from the independent replicate of the scRNAseq experiment displayed in Figure 5. (A) Expression of different gene sets during dedifferentiation in 2415 single cells. PCA of scRNAseq overlaid with expression of a set of 303 developmentally induced genes (left panel), 276 genes turned off during development (centre panel) with 81 ribosome protein genes also shown (right panel). Each dot represents a cell. Cells were pooled from samples taken each hour during dedifferentiation (0–6 hr). (B) Cell type specific gene expression during dedifferentiation. The same PCA plots as in A, but overlaid with the expression of sets of 42 prespore or 48 prestalk genes. (C) Cell type specific expression is more clearly delineated by PC3. The same expression data as in B are replotted in PC1/PC3 space. (D) Northern blot data showing peak csaA expression 2 hr after the induction of dedifferentiation, with loading indicated by 26S rRNA. (E) Expression of csaA in PC1/PC3 space for replica 1 and replica 2.
Tables
Table 1
Gene expression in cells lacking candidate regulators of dedifferentiation.
Analysis of the gene expression phenotypes of cell lines mutated for candidate dedifferentiation regulators. Gene expression during dedifferentiation was assessed using a variety of methods, as indicated. For each assay one replicate was carried out unless stated otherwise.
| Gene | Description | Assay | Notes |
|---|---|---|---|
| bzpS | BZIP transcription factor | RNAseq | By PCA, slight delay at 2 hr. Other timepoints wild type. |
| mybD | MYB domain transcription factor | RNAseq | By PCA, slight delay at 2 hr. Other timepoints wild type. |
| nfyA | CCAAT-binding transcription factor | RNAseq | By PCA, developmental effect seen at 0 hr. Later time points wild type. |
| DDB_G0269374 | Putative DNA binding protein | RNAseq | By PCA, very slight delay at 2 hr. Other timepoints wild type. |
| DDB_G0272386 | F-box domain kelch repeat protein | RNAseq | By PCA, developmental effect seen at 0 hr. Later time points wild type. |
| DDB_G0281091 | Acidic nuclear phosphoprotein | RNAseq | By PCA, all timepoints wild type. |
| bzpI | BZIP transcription factor | Act8 reporter expression by flow cytometry | Wild type |
| eriA | Putative RNAase III | Act8 reporter expression by flow cytometry | One clone retained larger than wild type Act8 reporter uninduced population. Not replicated in independent clone. |
| fslN | Frizzled and smoothened-like protein | Act8 reporter expression by flow cytometry | Wild type |
| gbpD | cGMP binding protein, RapGEF | Act8 reporter expression by flow cytometry | Wild type |
| jcdA | Jumonji domain transcription factor | Act8 reporter expression by flow cytometry | Wild type |
| nfaA | RasGAP | Act8 reporter expression by flow cytometry | Wild type |
| ptpB | Protein tyrosine phosphatase | Act8 reporter expression by flow cytometry | Wild type |
| DDB_G0277531 | EGF-like domain protein | Act8 reporter expression by flow cytometry | Wild type |
| ctnB | Countin | Northern blot (PCNA, csaA, hspE) | PCNA and hspE wild type. Slightly increased csaA expression. |
| gefAA | LRR protein, RasGEF | Northern blot(PCNA) | Wild type |
| gefS | RasGEF | Northern blot (PCNA, csaA, hspE) | Wild type |
| gtaN | GATA transcription factor | Northern blot (PCNA, csaA, hspE) | PCNA wild type. Weak induction in hspE. Slight delay in down-regulation of csaA. |
| krsB | STE20 family protein kinase | Northern blot (PCNA, csaA, hspE) | Weak PCNA expression in one clone, not replicated in independentclone. csaA and hspE wild type. |
| omt5 | o-methyltransferase | Northern blot (PCNA, csaA, hspE, rpl15) | Wild type |
| pakE | p21-activated kinase | Northern blot(PCNA, csaA, hspE) | Wild type |
| rasG | Ras GTPase | Northern blot (PCNA, csaA, hspE, H2Bv1, sodC) | Slight delay switching off csaA. Others wild type. |
| sigB | SrfA-induced gene | Northern blot (PCNA) | Wild type. |
| sodC | Superoxide dismutase | Northern blot (PCNA, csaA, hspE, rpl15) | Wild type |
| tagA | ABC transporter B family protein | Northern blot (PCNA) | Weak PCNA expression in one clone, not replicated in independent clone. |
| xacB | RacGEF, RacGAP | Northern blot (PCNA, csaA, hspE) | Wild type |
| zakA | Dual-specificity protein kinase | Northern blot(PCNA, csaA, hspE, rpl15) | Wild type |
| DDB_G0268696 | Putative leucine zipper transcriptional regulator | Northern blot (PCNA) | Wild type |
| DDB_G0269040 | IPT/TIG, EGF-like, C-type lectin domains | Northern blot (PCNA) | Weak PCNA expression in one clone, not replicated in independent clone. |
| DDB_G0270436 | Putative RNA binding protein | Northern blot (PCNA, csaA, hspE) | Slight delay in down-regulation of csaA. Otherwise wild type. |
| DDB_G0270480 | Northern blot (PCNA) | Wild type | |
| DDB_G0272364 | EGF-like domain-containing protein | Northern blot (PCNA) | Wild type |
| DDB_G0272434 | Notch/Crumbs orthologue | Northern blot (PCNA) | Wild type |
| DDB_G0274177 | EGF-like domains | Northern blot (PCNA) | Wild type |
| DDB_G0275621 | SET domain-containing protein | Northern blot (PCNA, rpl15) | Wild type |
| DDB_G0276549 | Putative RapGAP | Northern blot (PCNA) | Wild type |
| DDB_G0278193 | Orthologue of asparagine synthetase domain containing protein 1 | Northern blot (PCNA) | Wild type |
| DDB_G0279851 | GCN5-related N-acetyltransferase | Northern blot (PCNA, rpl15) | Weak PCNA expression in one clone, not replicated in independent clone. rpl15 wild type. |
| DDB_G0280067 | Protein phosphatase 2C-related | Northern blot (PCNA) | Wild type. Bacterial grown cells due to liquid growth defect. |
| DDB_G0283057 | Putative RapGAP | Northern blot (PCNA, rpl15) | Wild type |
| DDB_G0288203 | Ifrd1 orthologue | Northern blot(PCNA, rpl15) | Weak PCNA expression in one clone, not replicated in independent clone. rpl15 wild type. |
| DDB_G0289907 | EGF-like, C-type lectin domains | Northern blot (PCNA) | Wild type |
| DDB_G0292302 | F-box, Zn-finger protein | Northern blot (PCNA, csaA, hspE, rpl15) | Wild type |
| DDB_G0293078 | Orthologue of FAM119B | Northern blot (PCNA) | Wild type |
| DDB_G0293562 | LYAR zinc finger protein | Northern blot (PCNA, csaA, hspE, rpl15) | Wild type |
| forG | Formin | Northern blot (PCNA, hspE, rpl15), clonal recovery, RNAseq | Defect in expression of PCNA doublet upper band, observed in 3 independent clones. Slightly increased hspE at early timepoints. Defect in clonal recovery (4 replicates). Bacterial grown cells due to axenic defect. |
| rasS | Ras GTPase | Northern blot(PCNA, hspE, rpl15), clonal recovery | Defect in expression of PCNA doublet upper band (3 replicates). Slightly increased in hspE and rpl15 at early timepoints. Bacterial grown cells due to axenic defect. |
Additional files
-
Supplementary file 1
Key Resources Table.
- https://cdn.elifesciences.org/articles/55435/elife-55435-supp1-v2.docx
-
Transparent reporting form
- https://cdn.elifesciences.org/articles/55435/elife-55435-transrepform-v2.docx
Download links
A two-part list of links to download the article, or parts of the article, in various formats.
Downloads (link to download the article as PDF)
Open citations (links to open the citations from this article in various online reference manager services)
Cite this article (links to download the citations from this article in formats compatible with various reference manager tools)
Cell and molecular transitions during efficient dedifferentiation
eLife 9:e55435.
https://doi.org/10.7554/eLife.55435


