Enteric glia as a source of neural progenitors in adult zebrafish
- Development and Homeostasis of the Nervous System Laboratory, The Francis Crick Institute, United Kingdom
- Bionformatics & Biostatistics Science Technology Platform, The Francis Crick Institute, United Kingdom
- Electron Microscopy Science Technology Platform, The Francis Crick Institute, United Kingdom
- Neural Development Laboratory, The Francis Crick Institute, United Kingdom
- Department of Biology and Biochemistry, University of Bath, United Kingdom
- Clinical Pharmacology and Quantitative Pharmacology, Clinical Pharmacology and Safety Sciences, R&D, AstraZeneca, United Kingdom
Figures
Figure 1 with 1 supplement
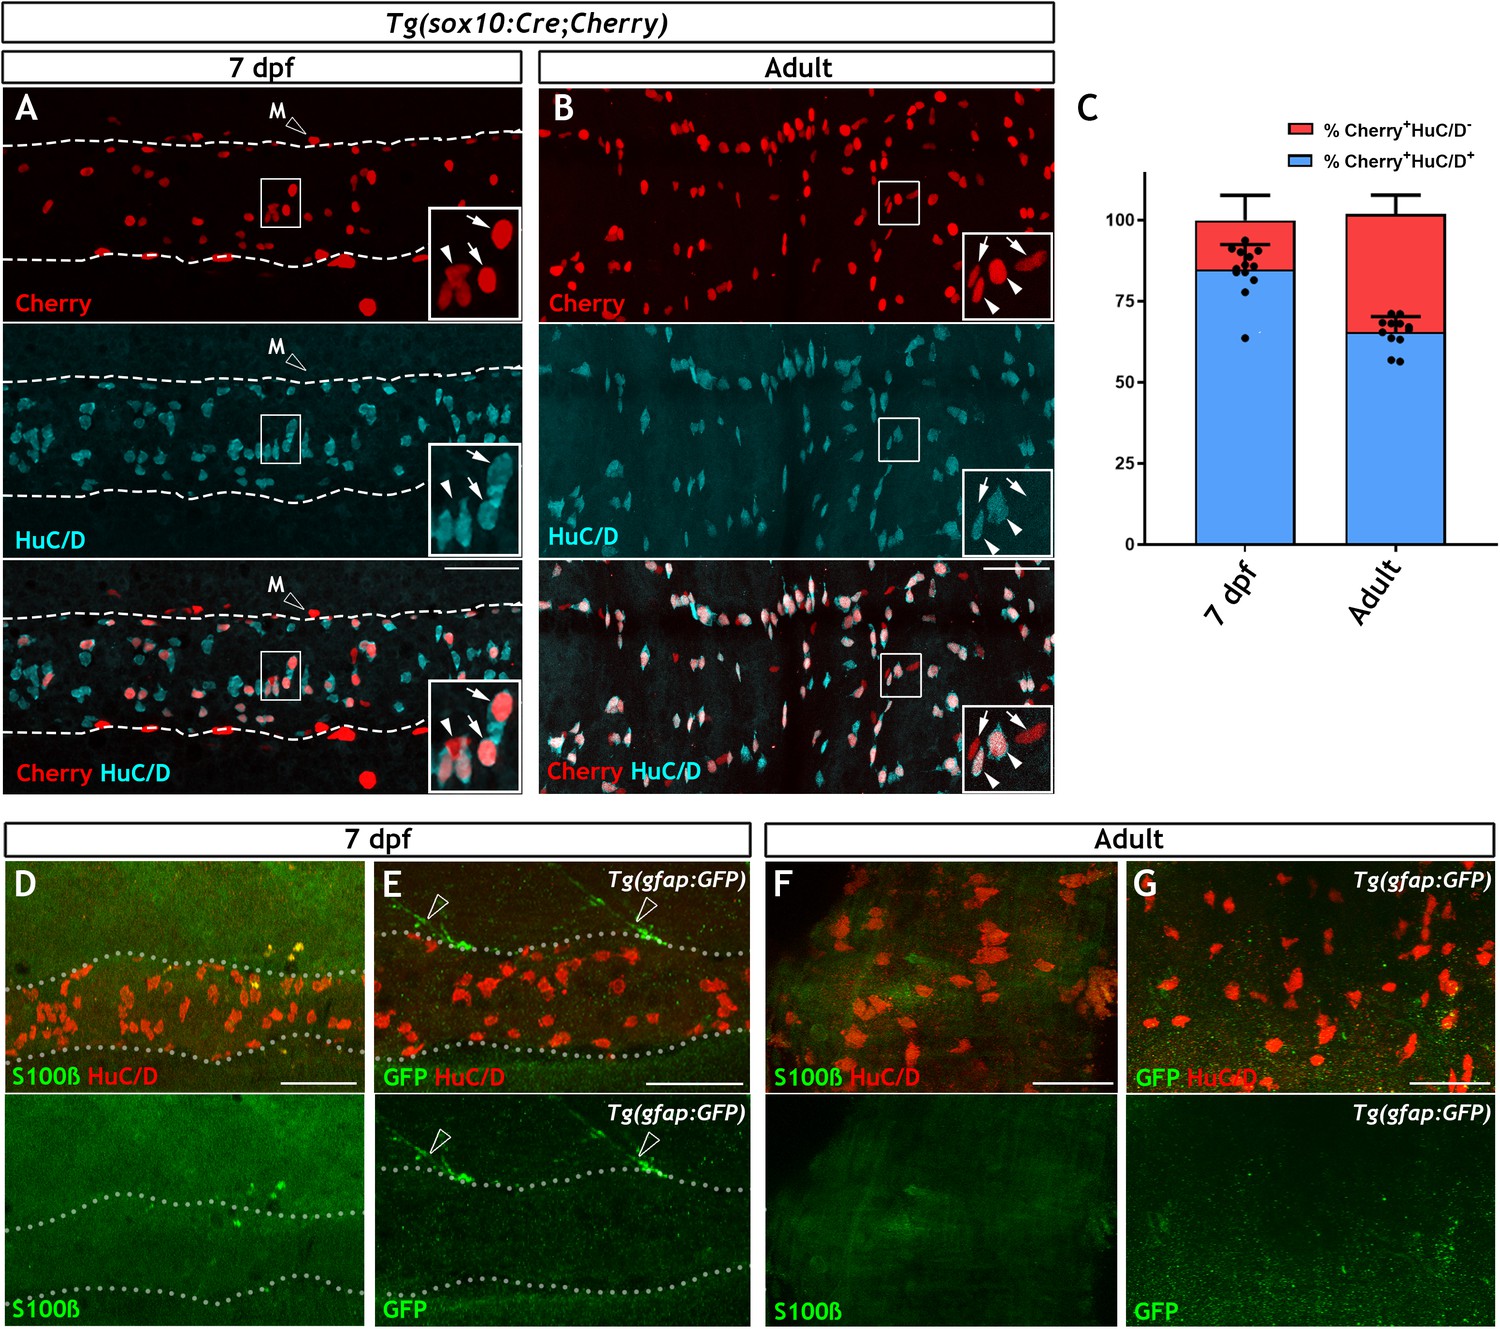
The non-neuronal compartment of the zebrafish ENS is relatively small and is not identified using canonical glial markers.
(A) Confocal images of the gut of 7 dpf Tg(sox10:Cre;Cherry) larvae immunostained for Cherry (red, top) and HuC/D (cyan, middle) (n = 13). The bottom panel is a merge of the Cherry and HuC/D signals. Inset shows a high magnification of the boxed area. Arrows point to Cherry+HuC/D+ cells and an arrowhead points to a Cherry+HuC/D- cell. Dotted line delineates the gut. Open arrowhead indicates a Cherry+ NC-derived melanocyte (M), which is present outside the intestine. (B) Confocal images of the ENS in adult zebrafish intestine immunostained for Cherry (red, top) and HuC/D (cyan, middle) (n = 13). The bottom panel is a merge of the Cherry and HuC/D signals. Inset shows a high magnification of the boxed area. Arrowheads point to Cherry+HuC/D+ cells and arrows point to Cherry+HuC/D- cells. (C) Quantification of the neuronal (Cherry+HuC/D+) and non-neuronal (Cherry+HuC/D-) cellular compartments within the sox10-lineage at 7 dpf and adult zebrafish, n = 13 biological replicates, data are given as mean ± SD. (D) Confocal images of the gut of 7 dpf zebrafish larvae immunostained for S100β (green) and HuC/D (red). No S100β signal was detected in the ENS, despite abundant neurons throughout the intestine (n = 30). (E) Confocal images of the gut of 7 dpf Tg(gfap:GFP) larvae immunostained for GFP (green) and HuC/D (red). No GFP signal was visible within the intestine despite abundant HuC/D+ neurons (n = 50). GFP+ fibres associated with spinal nerves are observed descending towards the gut but never enter the intestine (open arrowheads). Dotted lines in D and E delineate the gut. (F) Immunostaining of the ENS of adult zebrafish with S100β (green) and HuC/D (red) (n = 5). (G) Immunostaining of the ENS of adult Tg(gfap:GFP) zebrafish with GFP (green) and HuC/D (red) (n = 13). S100β (F) and GFP (G) signal was absent despite the presence of HuC/D+ neurons. All confocal images are max projections of short confocal stacks. 50 µm scale bars shown in merge panels.
Figure 1—figure supplement 1
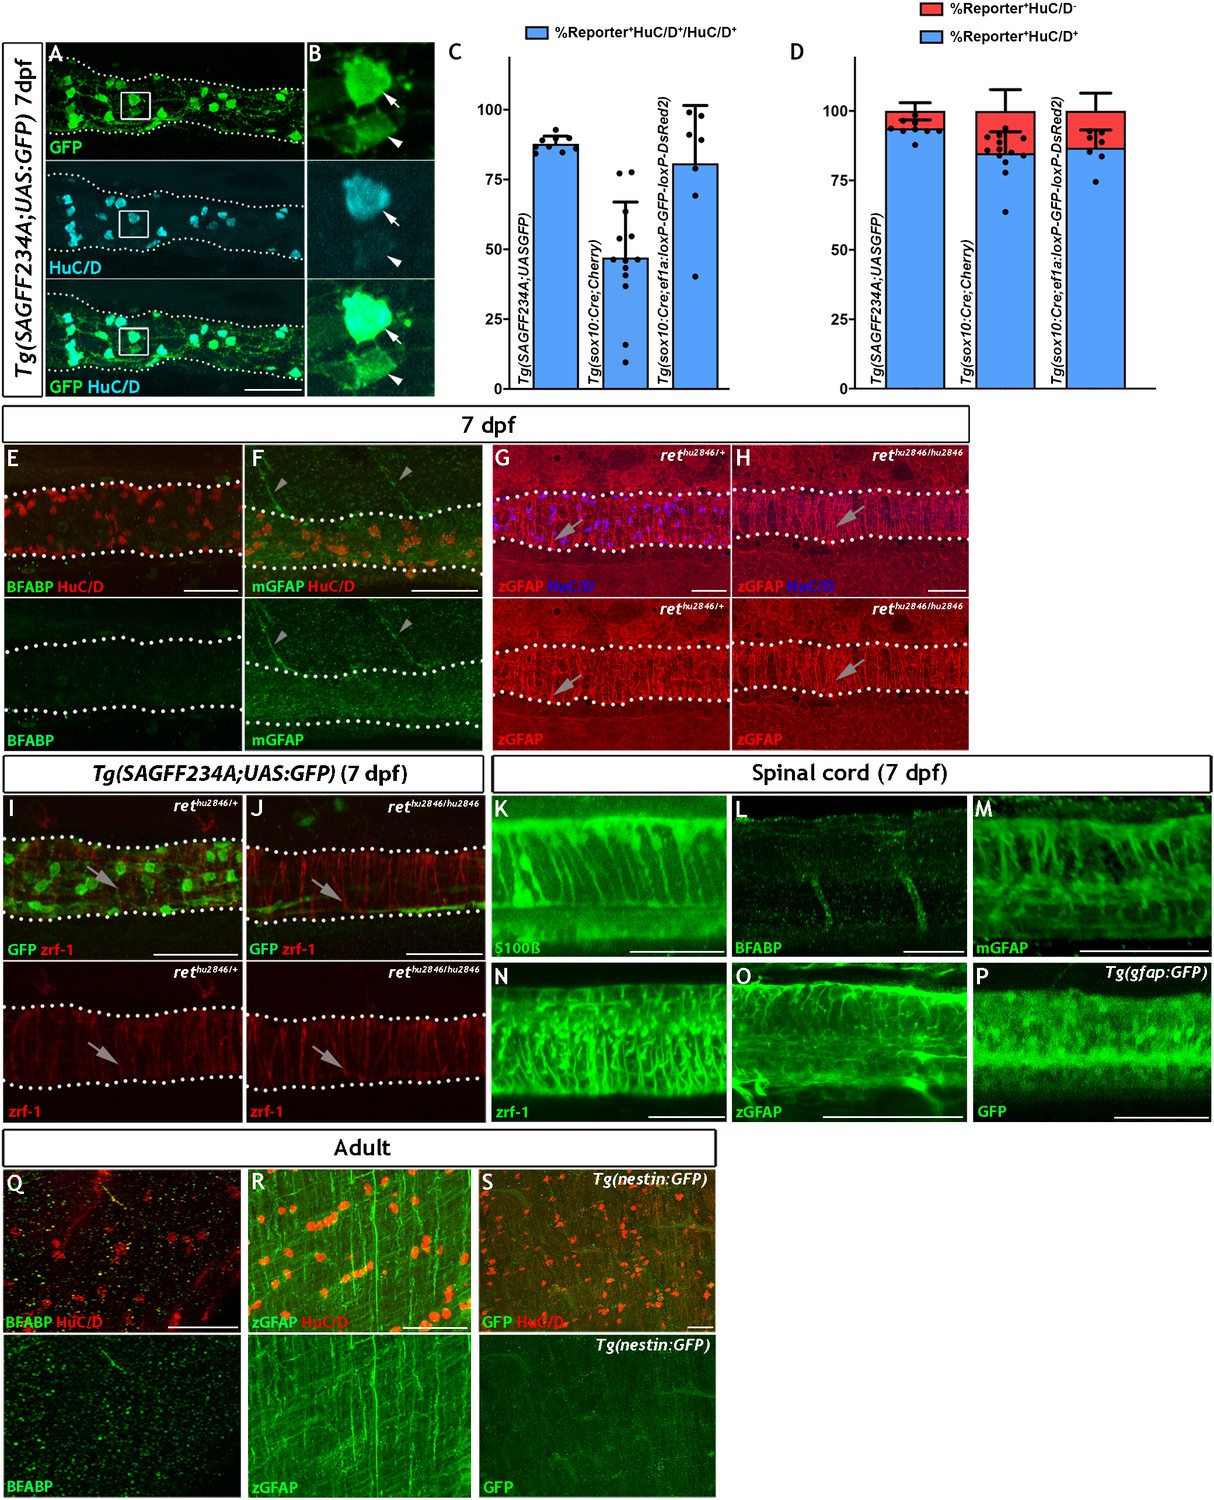
ENS lineage tracing shows that there is a small non-neuronal lineage that is not detectable using antibodies for the canonical glial markers BFABP, GFAP nor with transgenic reporters.
(A) Using the Tg(SAGFF234A;UAS:GFP) line at 7 dpf to label the ENS lineage with GFP (green), we observe that the majority of these cells are HuC/D+ neurons (cyan) (n = 9). (B) High magnification view of box in A, with arrows denoting the GFP+HuC/D+ ENS neurons and arrowheads indicating GFP+HuC/D- non-neuronal ENS cells. (C) Comparison of the efficiency of various transgenic reporter lines used in this study in their ability to label HuC/D+ ENS neurons within the 7 dpf larvae. Tg(SAGFF234A;UAS:GFP) labels 87.8% ± 2.8 of HuC/D+ ENS neurons, Tg(sox10Cre;Cherry) labels 47.1% ± 19.9 of HuC/D+ ENS neurons, and Tg(sox10:Cre;ef1a:loxP-GFP-loxP-DsRed2) labels 80.8% ± 7.8 of HuC/D+ ENS neurons. Data are given as mean ± SD, n = 9 biological replicates. (D) Comparison of the proportion of HuC/D+ ENS neurons (blue) vs. HuC/D- non-neuronal ENS cells (red) labelled by the various transgeneic reporter lines within the 7 dpf ENS lineage. The majority of cells labelled by either Tg(sox10Cre;Cherry) or Tg(sox10:Cre;ef1a:loxP-GFP-loxP-DsRed2) lineage reporter lines are neurons, each labelling approximately 85% HuC/D+ cells and 15% HuC/D- cells (84.8% ± 7.7% and 15.2% ± 7.7 vs. 86.8% ± 6.4 and 13.2 ± 6.4%, respectively), a non-significant difference (p=0.78). Tg(SAGFF234A;UAS:GFP) labels 93.7% ± 3.0 of HuC/D+ neurons and 6.2% ± 3.0 of HuC/D- cells, a significant difference in proportional cell type labelling efficiency relative to both sox10Cre-driven lineage reporters (p=0.0078 and p=0.09, respectively). Data are given as mean ± SD, n = 9 biological replicates. (E–J). The larval zebrafish ENS is not labelled with BFABP and GFAP antibodies. (E) BFABP (green) fails to mark EGCs in the 7 dpf intestine, despite HuC/D neurons (red) being readily detected (n = 20). (F) The mammalian GFAP antibody (mGFAP, green) does not detect cells in the 7 dpf gut, despite HuC/D positive neurons being detectable (red) (n = 26). Instead, mGFAP fibres are seen descending toward, but not entering, the gut (arrowheads). (G–H) An antibody raised against zebrafish GFAP (zGFAP) detects abundant circumferential fibres in the 7 dpf gut (red, arrows), positioned near HuC/D+ ENS neurons (blue). However identical staining is observed in wild type larvae that contain ENS neurons (G, n = 6) and rethu2846/hu2846 which lack an ENS due to a mutation in the Ret receptor tyrosine kinase and a failure of ENS progenitors to colonise the gut (H, n = 6) (HuC/D+ neurons only present in G, blue). (I–J) Immunostaining of 7 dpf Tg(SAGFF234A;UAS:GFP) larvae with another GFAP antibody raised against zebrafish GFAP (zrf-1) also reveals abundant circumferential fibres (red, arrows), in a pattern indistinguishable between wild type larvae containing ENS neurons (green) (I, n = 10) and rethu2846/hu2846 larvae lacking ENS neurons (green, J, n = 10), indicating that these fibres are not associated with the ENS lineage. (K–O) Antibodies tested in the above experiments to detect ENS glial cells are able to successfully label CNS glial cells in the 7 dpf spinal cord: S100b (K, n = 30), BFABP (L, n = 20), mGFAP (M n = 26), zrf-1 (N, n = 20,) zGFAP (O, n = 12). (P) The expected pattern of GFP+ cells are detected within the spinal cord of 7 dpf Tg(gfap:GFP) larvae (n = 50). (Q–S) Analysis of adult gut tissue using a variety of antibody and transgenic tools used to identify CNS glial cells. (Q) BFABP is not detected in the adult gut despite HuC/D (red) identifying HuC/D+ enteric neurons (n = 9). (R) Although signal is detected in the adult gut using the zGFAP antibody (green), the striated signal is not found in cell bodies, nor is it clearly associated with HuC/D neurons (red) and the staining pattern is reminiscent of the non-ENS associated staining seen at 7 dpf (n = 12). (S) GFP+ cells are not observed in adult Tg(−3.6nestin:GFP) gut tissue, despite the ready detection of HuC/D+ neurons (red) (n = 4). All confocal images are max projections of short confocal stacks. 50 µm scale bars in merge panels (A, E–J, Q–S) or single colour images (K–P).
Figure 2 with 3 supplements
Transcriptomic profiling of the adult zebrafish ENS.
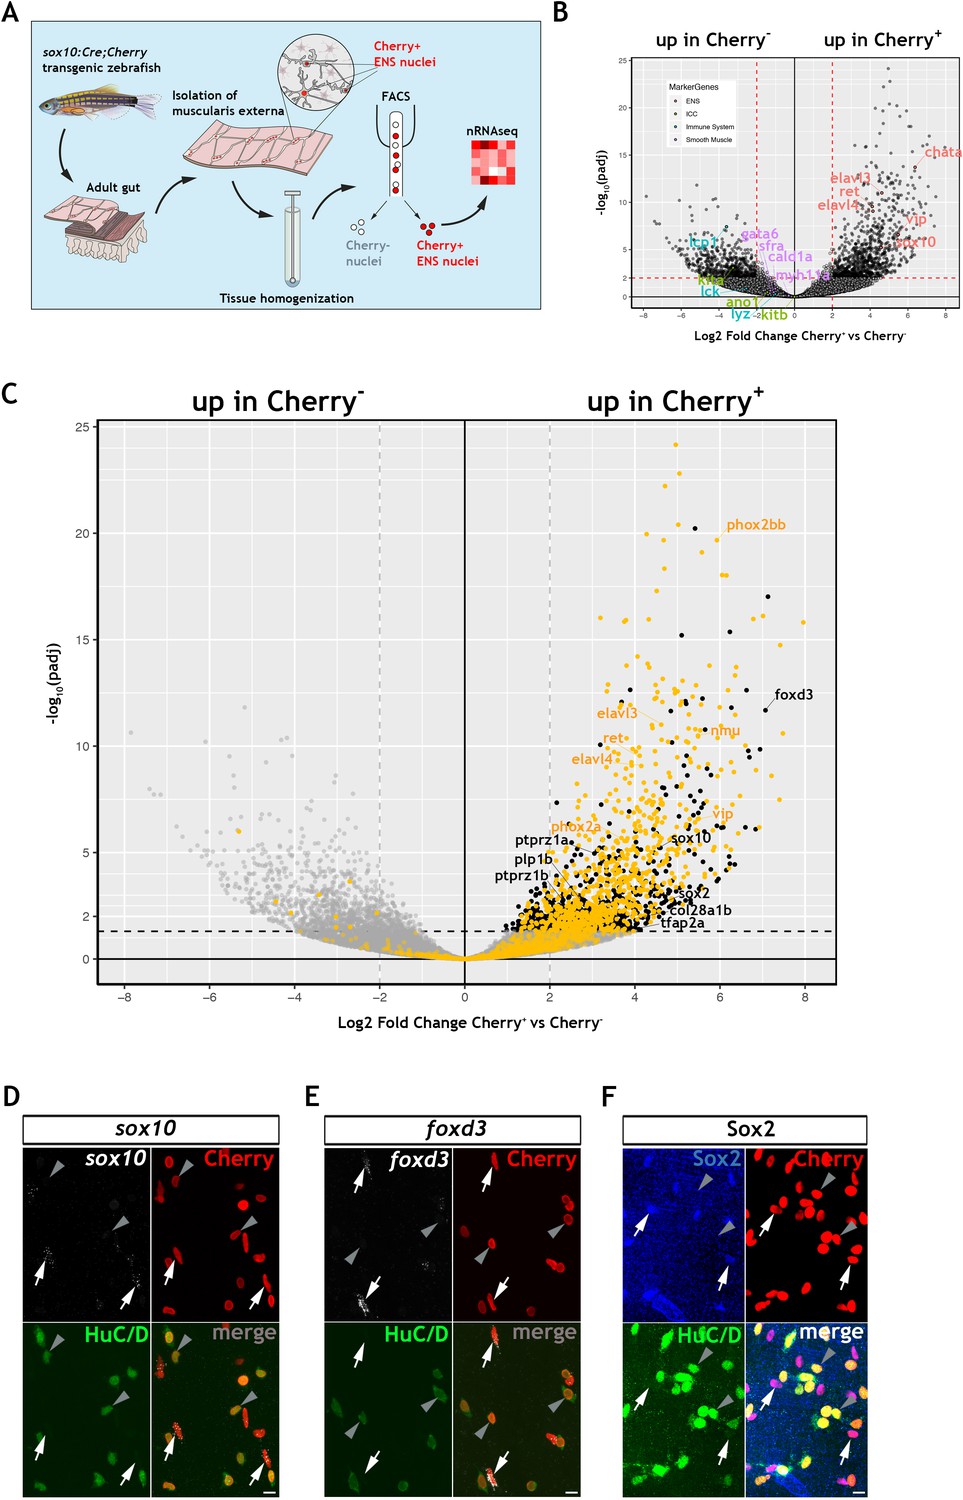
(A) Experimental strategy for the isolation of ENS nuclei from adult Tg(sox10:Cre;Cherry) guts and nuclear RNAseq. Five biological replicates were performed per condition. (B) Volcano plot shows mean log2 fold-change (x axis) and significance (-log10 adjusted p-value) (y axis) of genes differentially expressed in Cherry+ relative to Cherry- nuclei. Genes characteristic of the ENS are highlighted in red and are more abundant in Cherry+ nuclei, whereas genes characteristic of non-neuroectodermal lineages, such as smooth muscle (purple), interstitial cells of Cajal (green) and immune associated (blue), are more abundant in Cherry- nuclei. (C) Volcano plot (as in B) in which genes previously identified in a transcriptional characterization of larval ENS neurons (Roy-Carson et al., 2017) are shown in yellow. These include established neuronal markers, such as phox2bb, ret, elavl3, elavl4, vip, and nmu. Genes enriched in the Cherry+ nuclear population but absent from the larval ENS neuron transcriptome are shown in black. These include sox10, foxd3, sox2, plp1, the mammalian orthologues of which are expressed by mouse EGCs, tfap2a, a gene required for early NC development, col28a1b, whose mammalian orthologue is a peripheral glial marker, as well as ptprz1a, and ptprz1b, which have been identified in glioblastoma stem cells. Genes with padj <0.05 (Log10p-value<1.3) and/or log2FC < 0 are shown in grey. (D,E) Confocal images of fluorescent in situ hybridization (RNAscope) using probes for sox10 (D) and foxd3 (E) on adult Tg(sox10:Cre;Cherry) gut muscularis externa preparations immunostained for Cherry (ENS lineage) and HuC/D (ENS neurons). Signal for both sox10 and foxd3 (white arrows) corresponds to non-neuronal cells (Cherry+HuC/D-, arrows) but was absent from enteric neurons (Cherry+HuC/D+, arrowheads). (F) Immunostaining of adult Tg(sox10:Cre;Cherry) gut for Sox2 (blue), Cherry (red) and HuC/D (green). Sox2 is expressed specifically by non-neuronal ENS cells. Biological replicates: D, n = 4; E, n = 6; F, n = 5. All confocal images are max projections of short confocal stacks. 10 µm scale bars shown in merge panels.
Figure 2—figure supplement 1
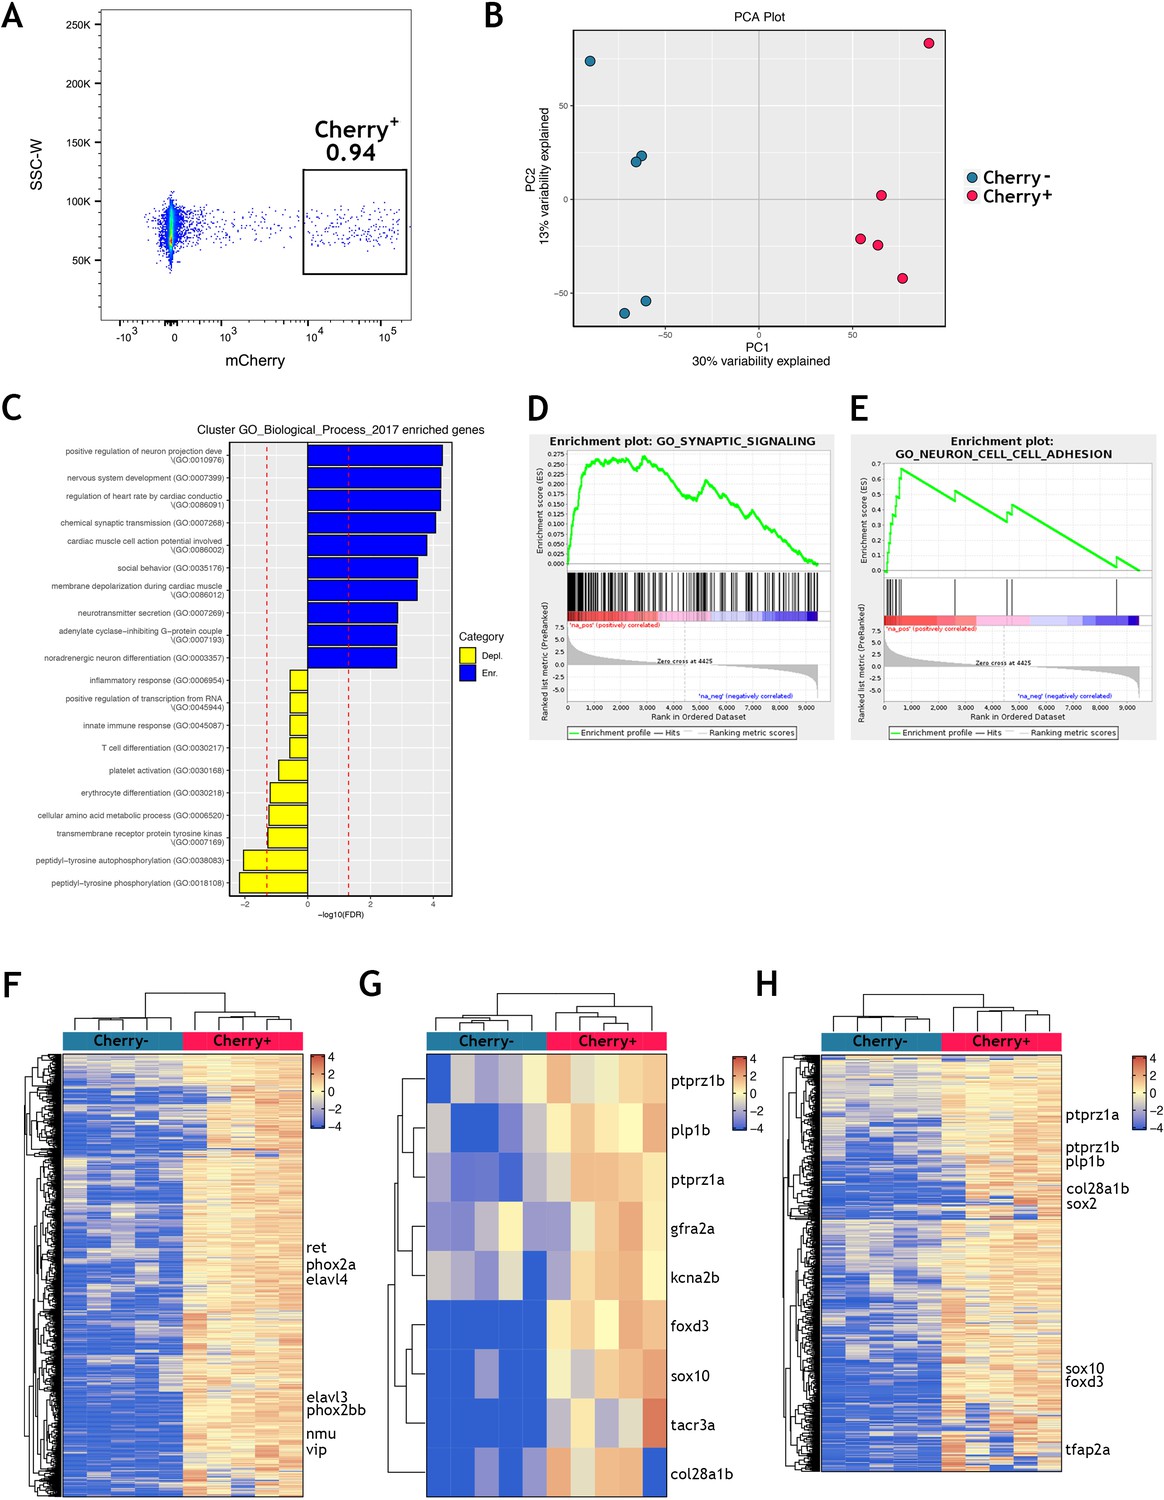
Transcriptional profiling of adult zebrafish ENS nuclei identifies profiles indicative of both neurons and glia.
(A) A representative FACS plot showing nuclei from the muscularis externa of adult Tg(sox10:Cre;Cherry) zebrafish guts gated on single intact DAPI+ nuclei. mCherry+ nuclei were collected, representing less than 1% of the starting population. An equivalent number of mCherry- nuclei were also collected. (B) Principal component analysis of the adult gut transcriptomes reveals segregation of the samples by Cherry+ vs. Cherry- expression (30% of variability explained in PC1, 13% in PC2). Five biological replicates of each condition. (C–H) Analysis of the adult gut Cherry+ vs Cherry- transcriptomic data by comparison to previously published data and publicly available reference data. The adult gut Cherry+ vs Cherry- transcriptomic data (Supplementary file 1) was filtered to select those genes with log fold-change >0 (in Cherry+ vs Cherry-) and with p-value<0.05. The resulting set is enriched for statistically significant zebrafish ENS-associated genes. (C) Gene set enrichment analysis shows that GO Biological Processes enriched in the Cherry+ population include nervous system associated terms. (D–E) Enrichment plots of representative gene sets (D) Synaptic Signalling and (E) Neuron cell-cell adhesion shows enrichment in Cherry+ samples. (F) Clustered heat map showing expression of a list of genes enriched in zebrafish larval ENS neurons (from Roy-Carson et al., 2017) that is analysed in our adult zebrafish gut transcriptomic data. We observe that > 750 of these neural expressed genes are enriched in the Cherry+ samples relative to Cherry- samples (Supplementary file 2), and these are candidate adult ENS neuron-associated genes. These include phox2bb, phox2a, ret, elavl3, elavl4, vip, and nmu. (G) Clustered heat map showing the top 25 genes identified as enriched in mammalian Plp1+ glial cells (Rao et al., 2015) that have zebrafish orthologues and which are upregulated in Cherry+ vs Cherry- samples, revealing nine candidate zebrafish ENS glial cell-associated genes. Cross-species comparisons (zebrafish to mouse) utilise publicly available homology assigning resources (see methods). (H) Clustered heat map showing expression of genes in the adult zebrafish ENS transcriptome after removing genes associated with zebrafish ENS neurons (from C, above). Over 600 unique genes are identified (Supplementary file 6), which are candidate adult ENS non-neuronal or ENS glial cell-associated genes. These include sox10, foxd3, tfap2a, sox2, col28a1b, plp1b, ptprz1a and ptprz1b.
Figure 2—figure supplement 2
Comparison of the zebrafish ENS transcriptome to a single cell transcriptomic dataset of mouse ENS neurons and ENS glia.
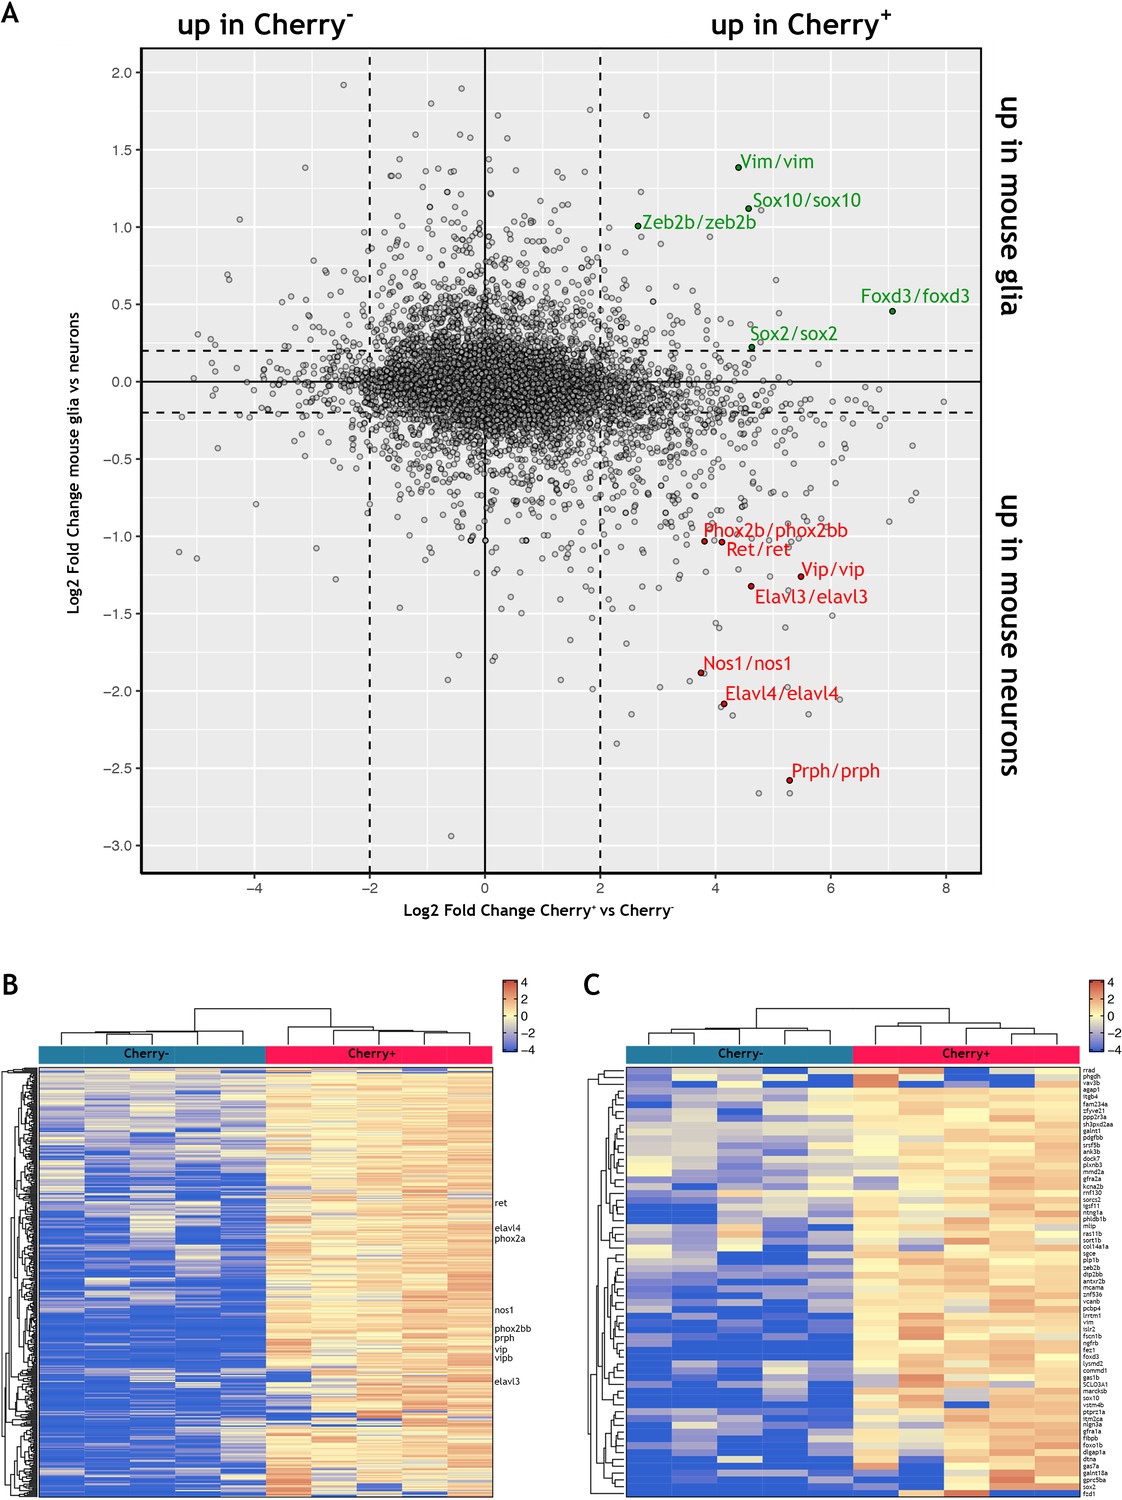
(A) Scatter plot displaying the log2-fold change of genes differentially expressed between Cherry+ and Cherry- samples in the adult zebrafish bulk transcriptomic study presented in this article (X axis) and the log2-fold change of genes differentially expressed between mouse ENS neuron and ENS glia in a published single cell dataset published by Zeisel and colleagues (Zeisel et al., 2018) (Y axis). Full data in Supplementary file 3 (see also Methods and Figure 2—figure supplement 3). Genes up in Cherry+ and up in mouse neurons are found in the lower right quadrant, with example genes highlighted in red. Genes up in Cherry+ and up in mouse glia are found in the upper right quadrant, with example genes highlighted in green. (B) Clustered heat map showing the list of 366 genes enriched in mouse ENS neurons (logFC >0.2 mouse neurons vs. glia) whose zebrafish orthologues are enriched in the Cherry+ population (logFC >0, p-value≤0.05) analysed in the adult zebrafish gut transcriptomic data of this study. Select genes shown (full gene list and corresponding data shown in Supplementary file 4). (C) Clustered heat map showing the list of 63 genes enriched in mouse ENS glia (logFC >0.2 mouse glia vs. neurons) whose zebrafish orthologues are enriched in the Cherry+ population (logFC >0, p-value≤0.05) analysed in the adult zebrafish gut transcriptomic data of this study (full gene list and corresponding data shown in Supplementary file 5).
Figure 2—figure supplement 3
Interrogation of a mouse single cell transcriptomic dataset to identify genes characterising mouse ENS neurons and ENS glia.
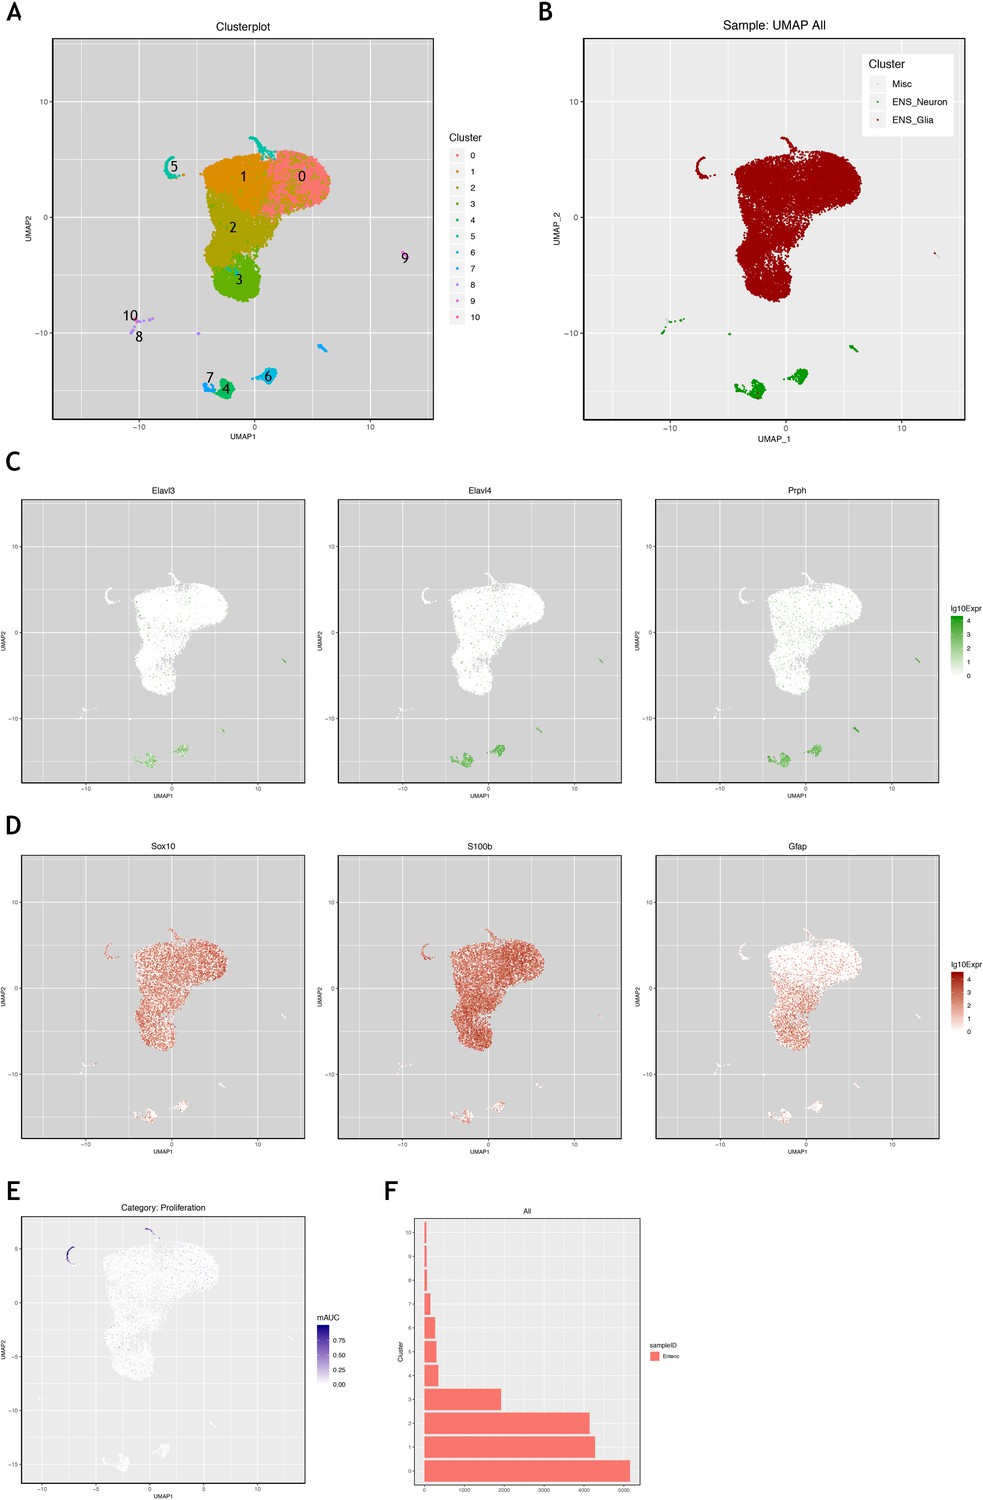
Using the mouse single cell transcriptomic data from Zeisel et al., 2018, which was downloaded from the Linnarsson lab website (https://storage.googleapis.com/linnarsson-lab-loom/l1_enteric.loom), the data were processed as described in the Methods methods section in order to determine differential gene expression between predominantly neuronal and glia clusters. Clusters shown in the UMAP (A) were labelled as neural or glial (B) based on expression of known neural expressed genes, Elavl3, Elavl4, Prph (C), or known glial expressed genes, Sox10, S100b and Gfap (D). (E) Examination of genes characteristic of proliferation (Top2A and Ki67 shown as examples here) indicates that cluster five is enriched for proliferative ENS glia. (F) Cluster five contains ~300 cells, representing 1.9% of the ~15,000 glial cells in this analysis of the dataset. This corresponds to the proliferative ENS glia cluster ENTG1 identified in the original Zeisel et al., 2018 publication, which comprised 1.6% of ENS glia.
Figure 3 with 1 supplement
The her4.3:EGFP transgene is a novel marker of the non-neuronal cell population in the adult zebrafish ENS.
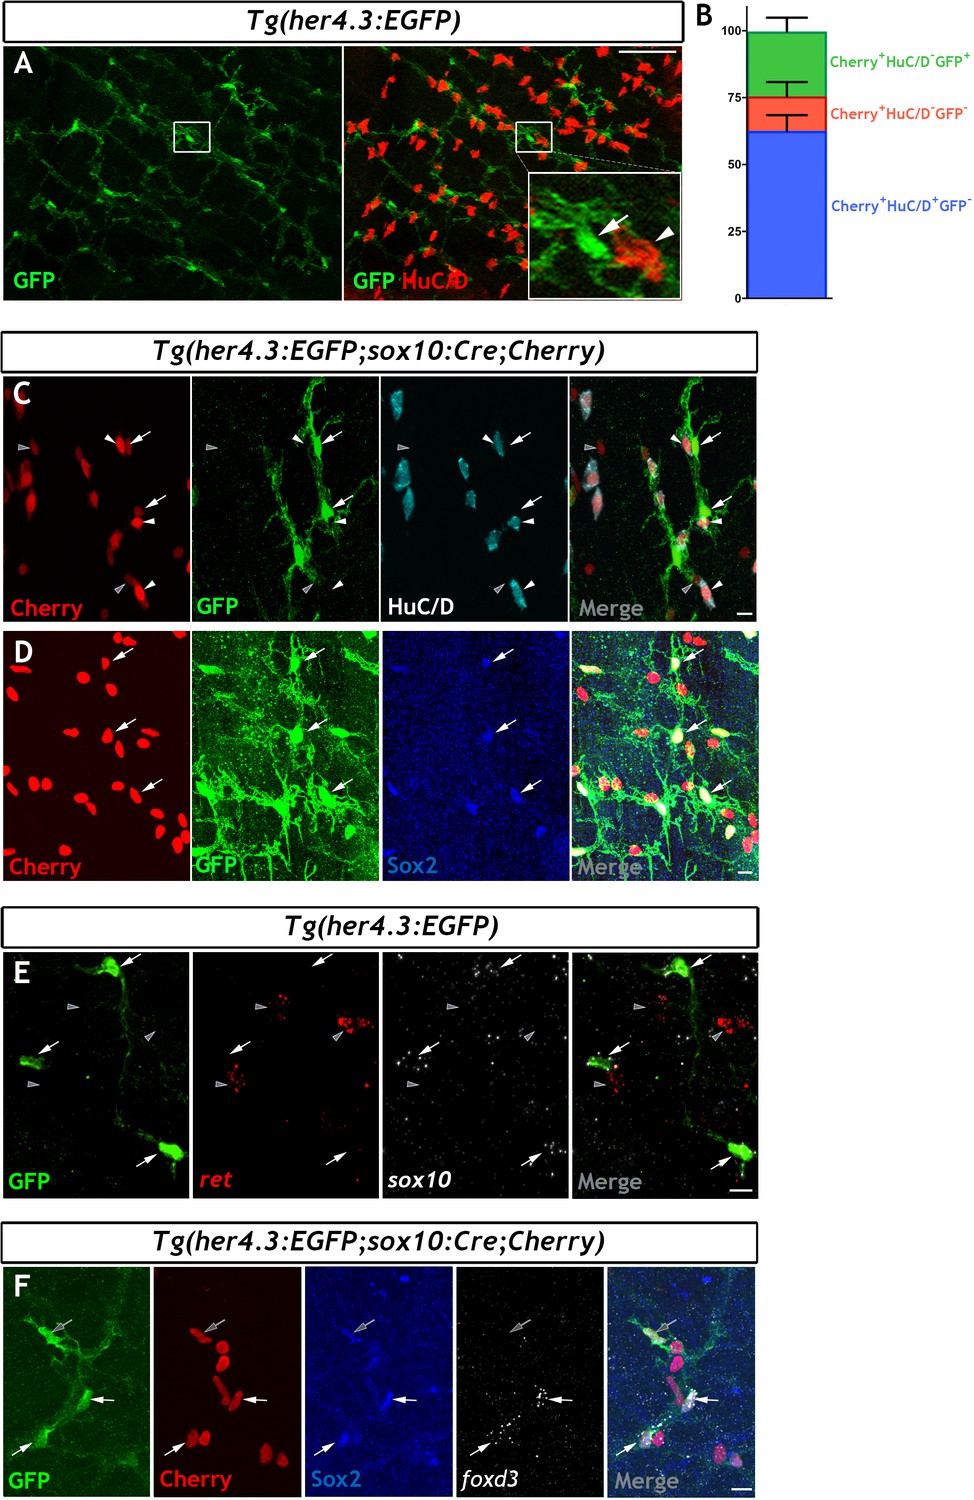
(A) Confocal images of adult Tg(her4.3:EGFP) zebrafish gut immunostained for GFP (green) and HuC/D (red). Inset is a high magnification of boxed area showing that GFP+ cells (arrow) are closely associated with HuC/D+ neurons (arrowhead) (n = 70). (B) Quantification of neuronal (Cherry+ HuC/D+GFP-, blue) and non-neuronal cell populations (Cherry+HuC/D-GFP+ and Cherry+HuC/D-GFP-, green and red, respectively) in the ENS of adult Tg(her4.3:EGFP;sox10:Cre;Cherry) zebrafish (n = 3). Data are given as mean ± SD. (C) Confocal images of the ENS from adult Tg(her4.3:EGFP;sox10:Cre;Cherry) zebrafish immunostained for Cherry (red), GFP (green) and HuC/D (cyan). Note the presence of Cherry+HuC/D-GFP+ (arrows) and Cherry+ HuC/D- GFP- (grey arrowheads) cells as well as the presence of Cherry+HuC/D+GFP- neurons (white arrowheads) (n = 3). Note that Cherry+ nuclei are of equivalent size in Cherry+HuC/D-GFP+ (arrows), Cherry+ HuC/D- GFP- (grey arrowheads) cells, and Cherry+HuC/D+GFP- neurons (white arrowheads). (D) Immunostaining of adult Tg(her4.3:EGFP;sox10:Cre;Cherry) gut with antibodies for Cherry (red), GFP (green) and Sox2 (blue). Arrows point to cells expressing all three markers (n = 3). (E) RNAscope analysis for ret (red) and sox10 (white) on ENS preparations from adult Tg(her4.3:EGFP) zebrafish guts immunostained for GFP (green). Note that GFP+ cells (arrows) express sox10 and are found in close proximity to ret+GFP- enteric neurons (grey arrowheads) (n = 4). (F) Combined RNA scope for foxd3 and immunostaining for GFP, Cherry and Sox2 on adult Tg(her4.3:EGFP;sox10:Cre;Cherry) gut shows that foxd3 and Sox2 are co-expressed in some ENS cells (white arrows), other GFP+ cells express only Sox2 (grey arrows). All confocal images are max projections of short confocal stacks. Scale bars in merge panels: (A) 50 µm (C–E) 10 µm.
Figure 3—figure supplement 1
Her4.3GFP transgenic line identifies cells with morphologies indicative of distinct subtypes of EGCs in the adult ENS.
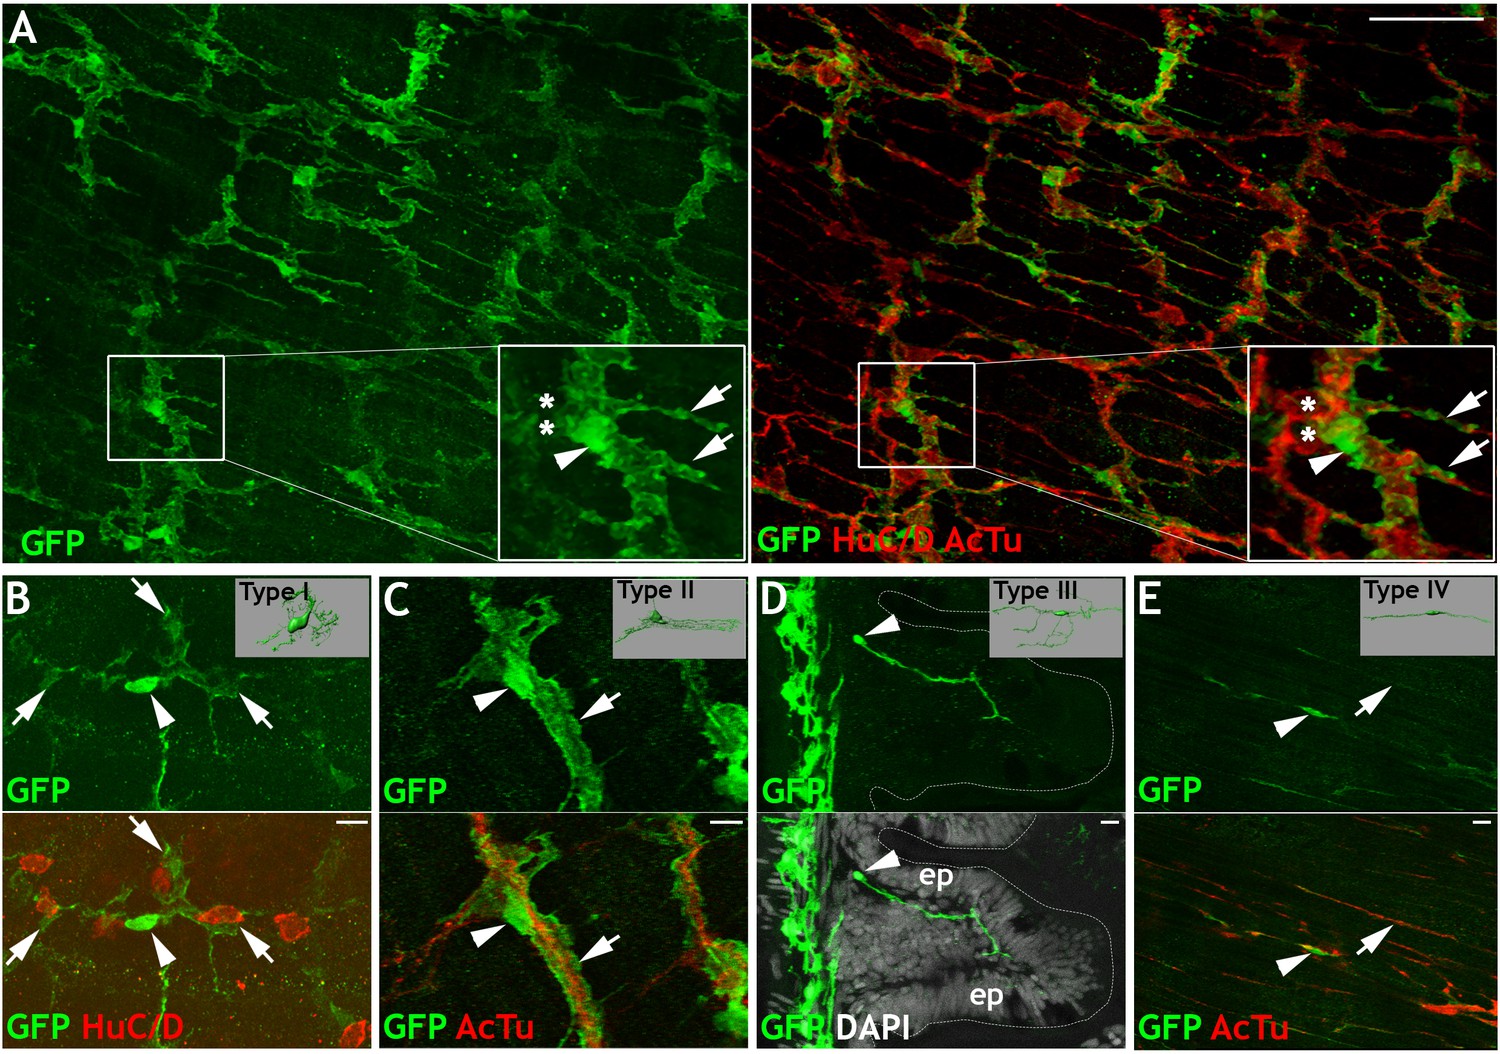
Immunohistochemistry of adult guts from of Tg(her4.3:EGFP) allow characterization the cellular morphology of GFP+ cells and comparisons to mammalian EGC subtypes (Boesmans et al., 2015). (A) GFP expressing cells (green) show close association with neurons, which express HuC/D in cell bodies and AcTu in cell processes (red) (n = 70). Inset shows high magnification view of boxed region, marking neurons (asterisks), GFP expression (arrowhead), and highly branched GFP expressing cellular processes (arrows). (B–E) Four distinct morphological cell types can be observed in Tg(her4.3:EGFP)+ cells: (B) GFP+ cells in the myenteric layer (arrowhead) with processes that appear to wrap around HuC/D+ cell bodies (red, asterisk), similar to Type I mammalian EGCs (inset), (C) GFP+ cells in the myenteric layer (arrowhead) with elongated processes (arrow) that follow AcTu+ neuronal processes (red), similar to Type II mammalian EGCs (inset), (D) GFP+ cells close to the mucosal layers (arrowhead), such as mucosal epithelia (ep, with DAPI highlighted nuclei in grey), similar to mammalian Type III EGCs (inset), and (E) Bipolar GFP+ cells within the muscle layers (arrowhead), associated with AcTu+ neuronal fibres (red, arrow), similar to Type IV mammalian EGCs (inset). Inset pictures adapted from Boesmans et al., 2015. All confocal images are max projections of short confocal stacks. Scale bars in merge panels: 50 µm (A) and 10 µm (B–E).
Figure 4 with 1 supplement
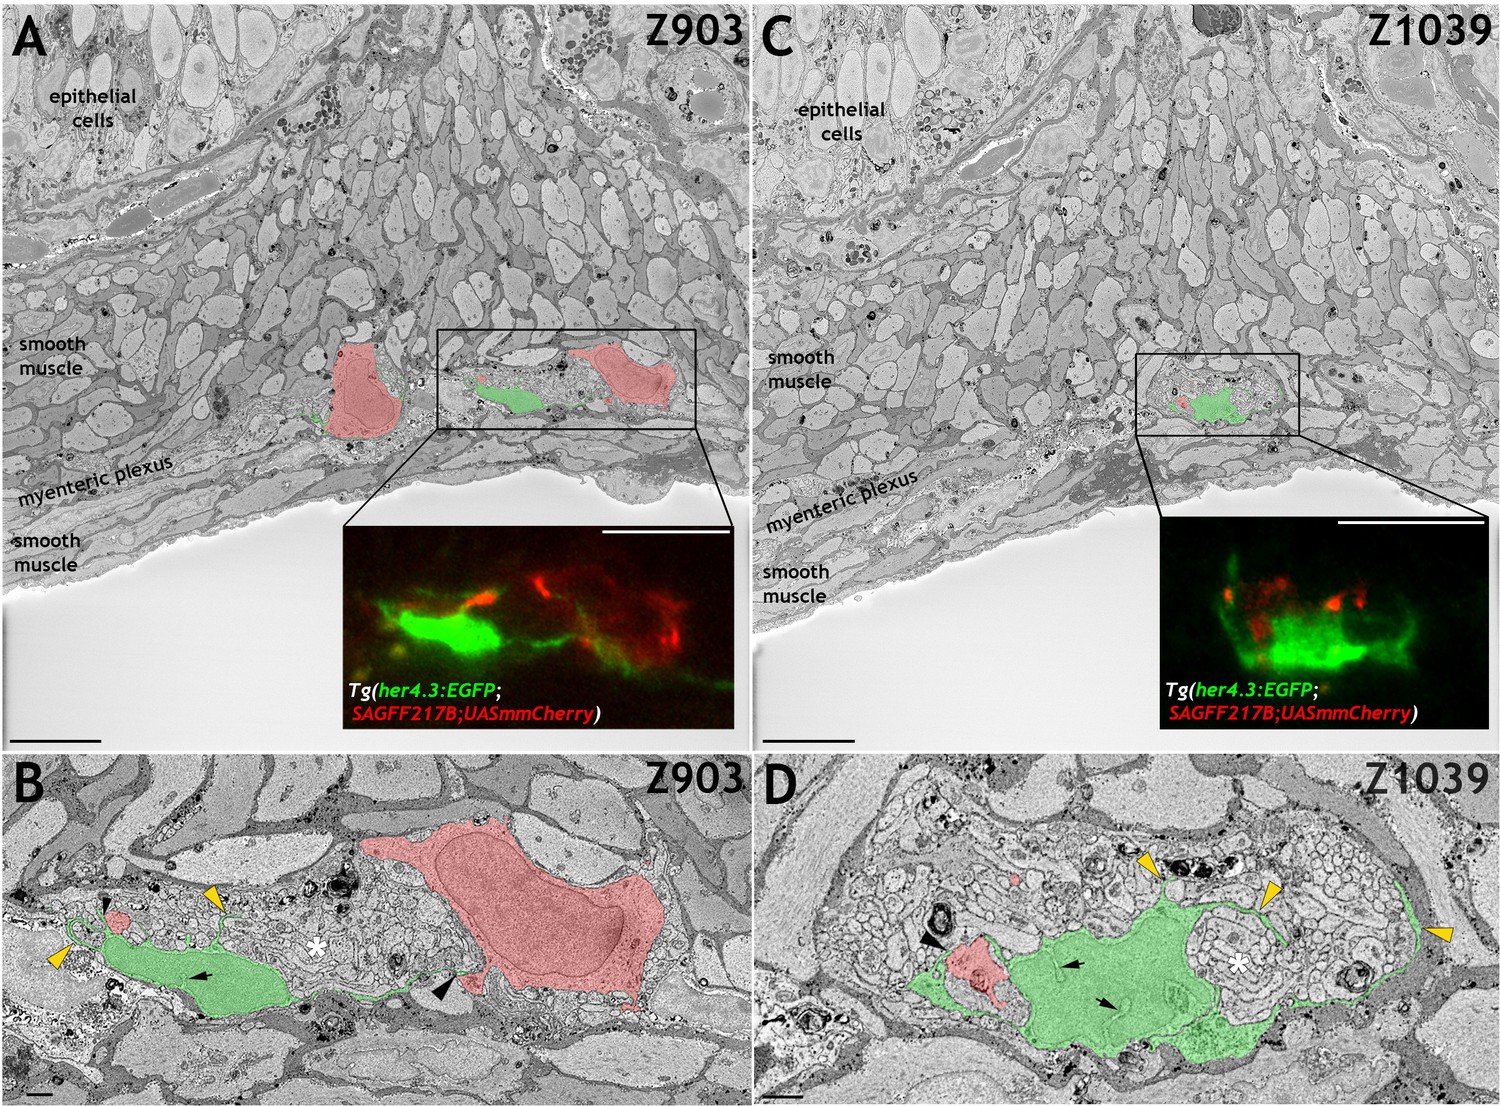
her4.3:EGFP expressing cells in the adult zebrafish ENS share with mammalian enteric glia characteristic ultrastructural features.
(A and C) Electron micrographs (z-stack # 903 in A and #1039 in C) from a 3D region of interest from the midgut of adult Tg(her4.3:EGFP;SAGFF217;UAS:mmCherry) zebrafish. Insets shows super-resolution light microscopy images of EGFP+ non-neuronal cells and mmCherry+ neurons that correspond to the boxed areas of the electron micrograph. The EGFP+ cells have a cell soma size of ~79.6 µm3 (A) and ~79.1 µm3 (C) with projection lengths that range from sheet-like processes of 4 µm to longer extensions of up to 18 µm. For comparison, the mmCherry+ neurons have cell soma size of ~398.8 µm3 (A, left) and 229.7 µm3 (A, right) with projection lengths that range from 16 µm to 55 µm. (B and D) High-resolution images of the boxed areas shown in A (B) and C (D). The EGFP+ cells are pseudocoloured in green and enteric neurons in red. Black arrowheads indicate points of contact between EGFP+ processes and mmCherry+ neurons. Yellow arrowheads indicate GFP+ sheet-like extensions that compartmentalise axon bundles (white asterisks). Nuclear crenelations in nuclei of EGFP+ cells are indicated with black arrows. Representative images of six regions of interest scanned from two adults. All images are a single z plane. Scale bars: 10 µm (A, C and insets A,C) and 1 µm (B,D).
Figure 4—figure supplement 1
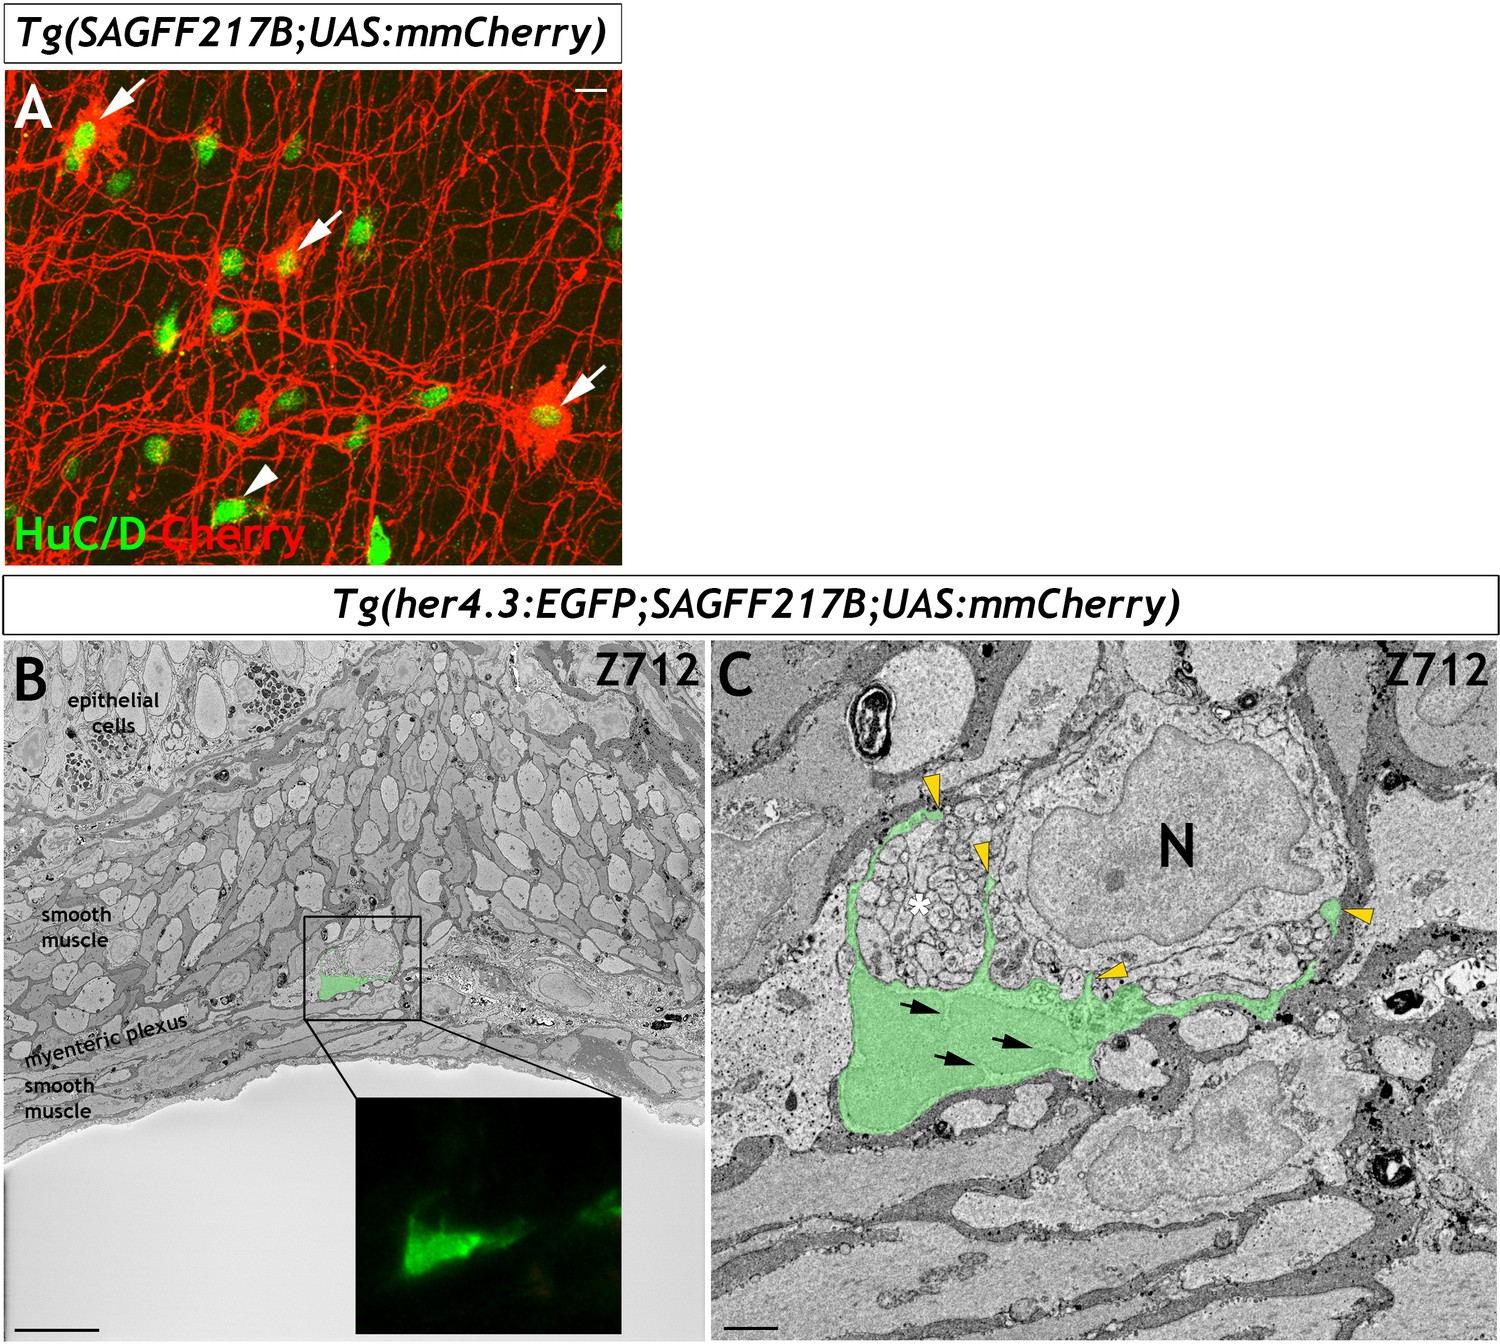
Correlative light-electron microscopy identifies glial like features of adult Tg(her4.3:EGFP) expressing cells.
(A) In the adult zebrafish, a subpopulation of HuC/D+ ENS neurons (green) are highlighted by Tg(SAGFF217;UAS:mmCherry), and Cherry expression (red, arrows) fills both the cell bodies and the abundant processes of expressing cells (red). The remaining proportion on HuC/D+ cells (green) do not express Cherry (arrowhead) (n = 12). Confocal image is a max projection of a short confocal stacks. (B) Electron microscopy image of a section from an adult Tg(her4.3:EGFP;SAGFF217;UAS:mmCherry) gut with tissue layers denoted, false coloured to depict the position of the GFP+ cell shown in the super resolution image shown in inset. Note the neuron and axons in this section are not Cherry+ neurons. Images depict a single z plane. (C) High magnification view of the boxed region, showing crenelated nuclei (arrows) and radial extensions that separate axon bundles (yellow arrowheads, asterisk denotes axon bundle), and many which contact the neuronal cell body (neuronal cell body denoted with N). The EGFP+ cell has a cell soma size of 79.1 µm3 and longest projection length of 9 µm. Representative images of six regions of interest scanned from two adults. Scale bars: 10 µm (A,B) and 1 µm (C).
Figure 5 with 1 supplement
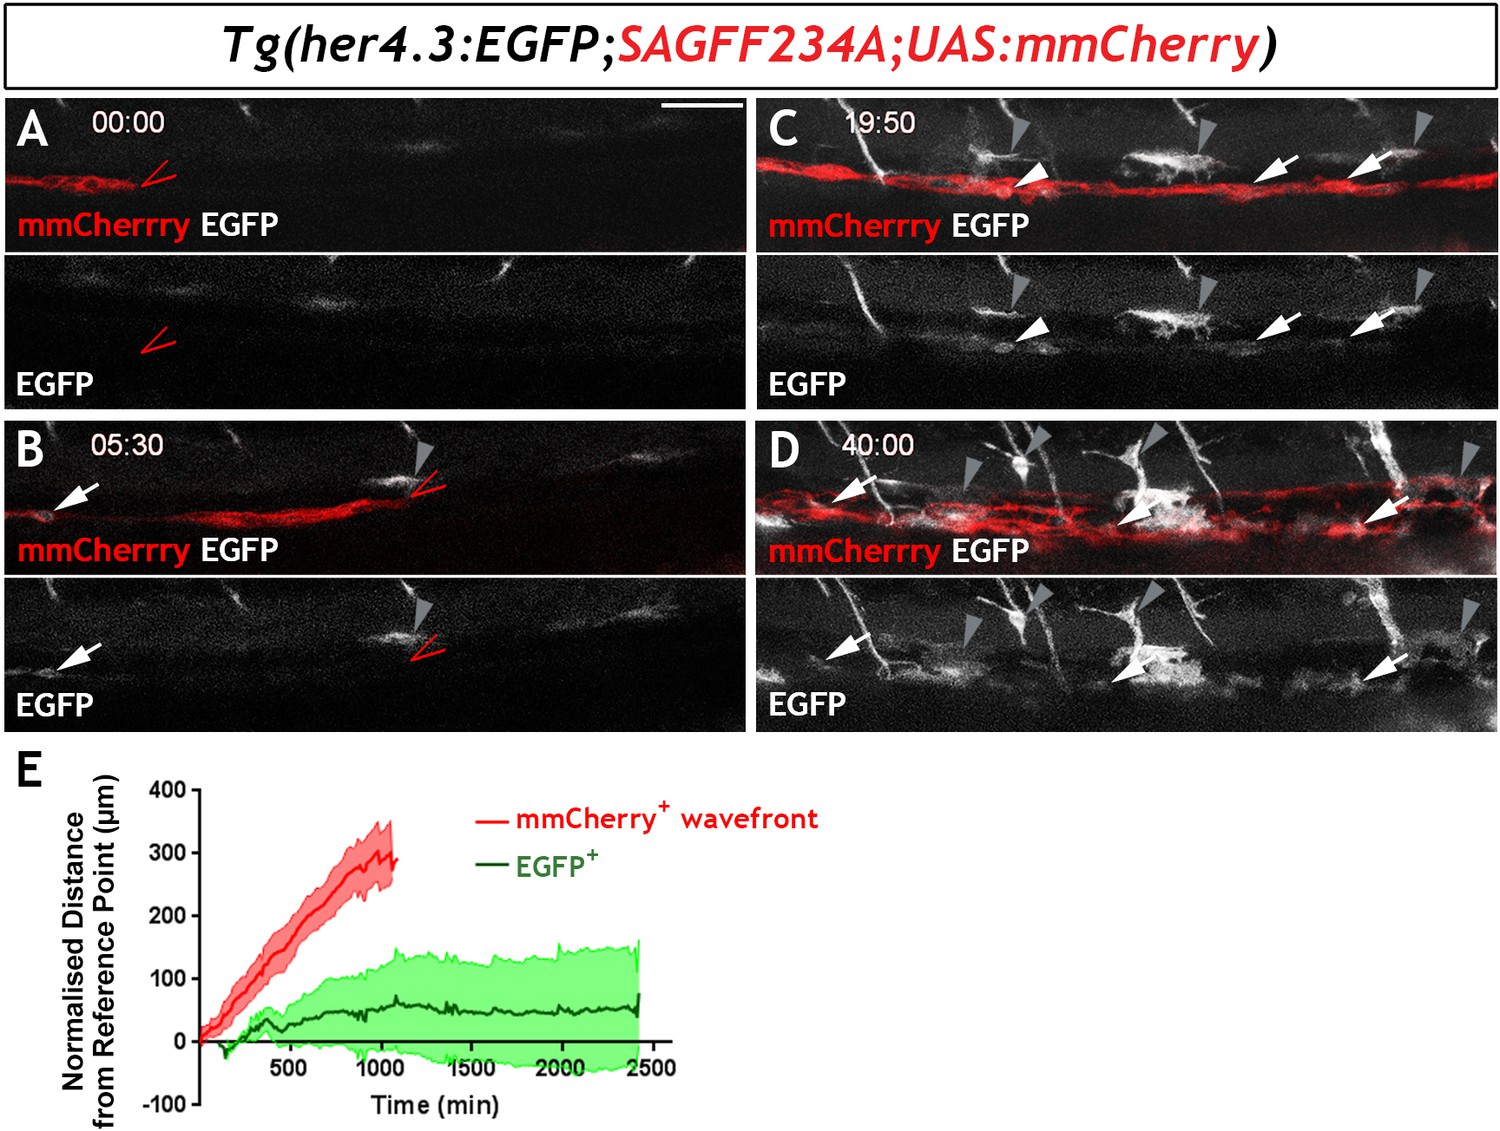
Live imaging of Tg(her4.3:EGFP)+ cell ontogenesis in the developing zebrafish ENS.
(A–D) Still images from time-lapse recording of a Tg(her4.3:EGFP;SAGFF234A;UAS:mmCherry) embryo imaged from 56 hpf (denoted as 00:00) until 96 hpf (40:00), a representative example of n = 18 biological replicates. At 00:00 (A) the mmCherry+ wavefront of NC cells (red, red arrowhead) is at the rostral side of the field of view (FOV) and no EGFP+ cells (grey) are present. At 05:30 (B), the first EGFP+ cells (grey, arrow) appear within the mmCherry+ NC cell column (red), behind the migratory wavefront. Bright GFP+ melanocytes are designated (grey arrowheads). (C) At 19:50 the NC cell column extends throughout the FOV and the number of EGFP+ cells (grey, arrows) has increased. White arrowhead points to an EGFP+ cell exhibiting a rounded morphology, which can be seen to divide in subsequent time lapse images. An increasing number of bright GFP+ melanocytes appear (grey arrowheads), and are relatively static in the time lapse recordings. (D) At the end of the recording (40:00), EGFP+ cells (grey) can be found throughout the gut (white arrowheads). Abundant brightly GFP+ melanocytes are present in the gut region (grey arrowheads), whose characteristic morphology is apparent. (E) Quantification of cell displacement (normalised distance from reference point/time) of the mmCherry+ wavefront (red) and EGFP+ cells (green), data describing 132 cells from four fish. Data are given as mean ± SD. All confocal images are max projections of short confocal stacks. 50 µm scale bar in A.
Figure 5—figure supplement 1
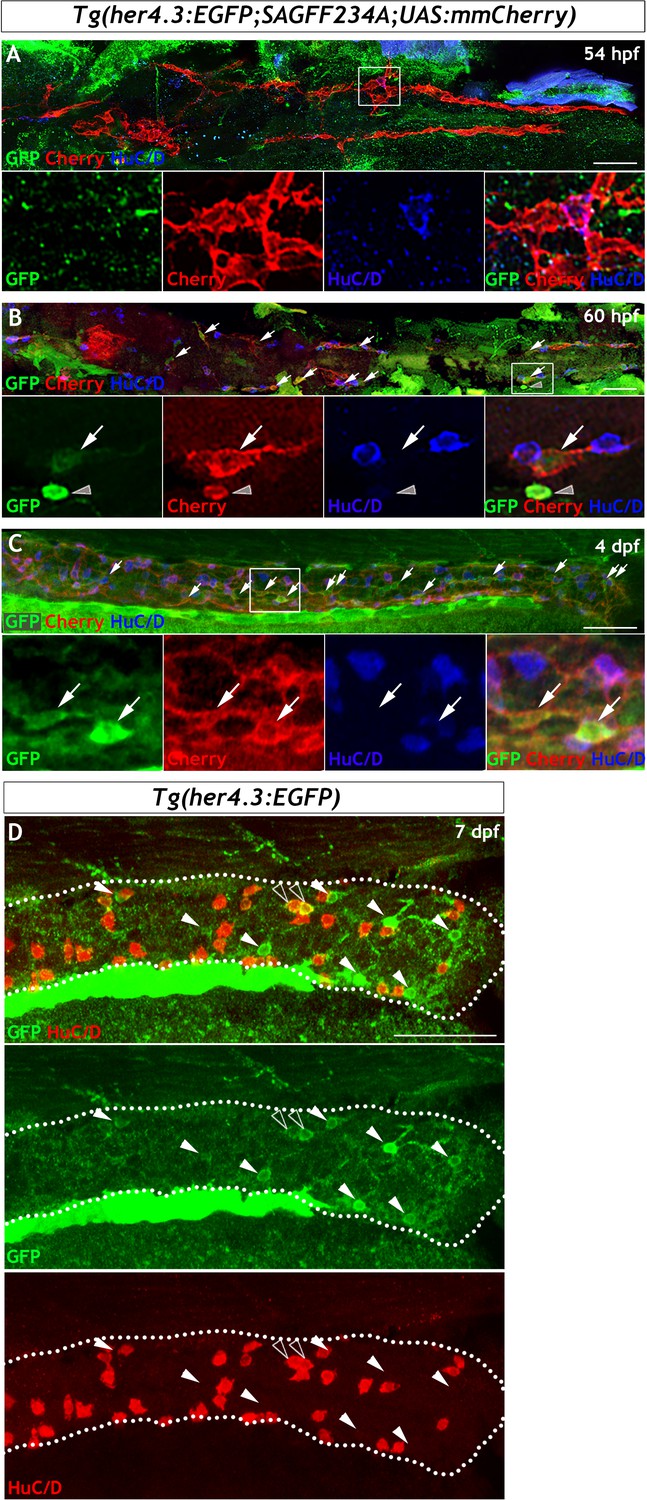
Lineage analysis reveals that Tg(her4.3:EGFP) expressing cells are derived from the embryonic NC cell population that gives rise to the ENS.
(A–C) Analysis using Tg(her4.3:EGFP;SAGFF234A;UAS:mmCherry) allows her4.3:EGFP+ cells to be examined relative to the Cherry+ migrating NC cell population that colonises the gut during development. (A) At 54 hpf, no GFP+ cells (green) are present in the gut and none are detected within the population of migrating NC cells (red), although NC cell-derived HuC/D+ ENS neurons are present at this time (blue). Single channels shown in high magnification view of boxed region (n = 30). (B) At 60 hpf, small numbers of weakly GFP expressing cells (green, arrows) can be seen within the streams of NC cells colonising the gut (red). GFP+ cells are seen in proximity to HuC/D+ cells (blue). Note strongly GFP expressing cells can be detected, but these cells do not form part of the NC cell migratory streams (red) and are outside of the gut (grey arrowhead), and are likely to be melanocytes (n = 30). Single channels shown in high magnification view of boxed region. (C) At 4 dpf, an increased number of both strongly and weakly GFP expressing cells (green, arrows) are found within the stream of migratory NC cells (red). Single channels shown in high magnification view of boxed region (n = 20). (D) At 7 dpf Tg(her4.3:EGFP) larvae GFP expressing cells (green, arrowheads) are closely associated with, but distinct from, HuC/D+ positive neurons (red) (n = 45). Occasionally HuC/D is seen to overlap with cells expressing low levels of GFP (open arrowheads). All confocal images are max projections of short confocal stacks. Scale bars in merge panels: 50 µm.
Figure 6 with 3 supplements
Proliferation and neurogenic differentiation of adult her4.3:EGFP+ ENS cells during homeostasis.
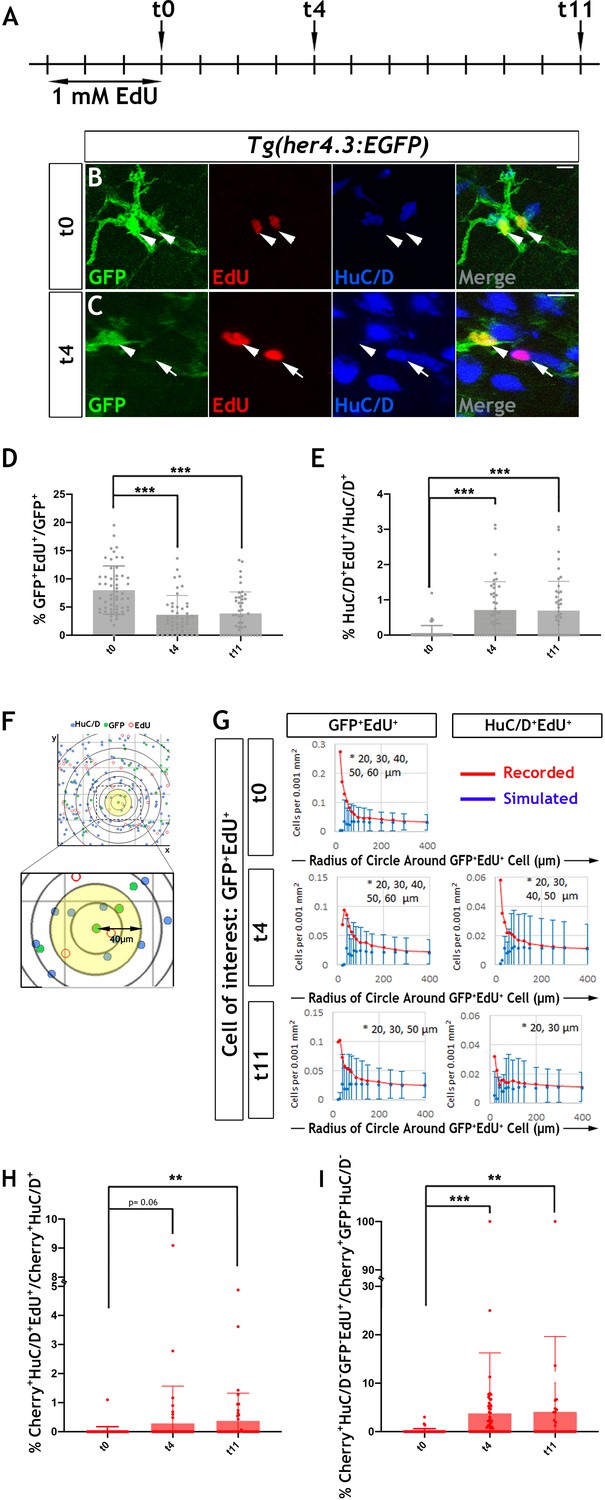
(A) Schematic representation of experimental design. Adult Tg(her4.3:EGFP) zebrafish were immersed in 1 mM EdU for three days and analysed at 0 (t0), 4 (t4) or 11 (t11) days after EdU pulse. (B–C) GFP (green) and HuC/D (blue) immunostaining of intestines from EdU (red) pulsed animals harvested at t0 (B) and t4 (C). Arrowheads (in B and C) point to GFP+HuC/D-EdU+ cells. Arrow (in C) indicates a GFP-HuC/D+EdU+ neuron. 10 µm scale bars in B-C merge panels. All confocal images are max projections of short confocal stacks. (D) Quantification of the percentage of GFP+ cells labelled with EdU at t0, t4 and t11 (mean ± SD). (E) Quantification of the percentage of EdU-labelled enteric neurons at t0, t4 and t11, with biological replicates t0 n = 6, t4 n = 5, t11 n = 5 (mean ± SD.) (F) Strategy for computational analyses of the density of EdU-labelled HuC/D+ and EGFP+ cells. EdU+GFP+ cells were positioned at the centre of concentric circles of increasing radius and the density of EdU+GFP+ and EdU+HuC/D+ cells within each circle was calculated. An example of a 40 μm radius circle (yellow) is shown in higher magnification. (G) Recorded (red graph) and simulated (blue graph) densities of EdU+HuC/D+ and EdU+GFP+ cells (y axis) in concentric circles of increasing radius (x axis) around EdU+GFP+ cells. Monte Carlo simulation of random distribution of EdU+HuC/D+ or EdU+GFP+ cells were performed >2000 times for each dataset in order to establish baseline densities arising in randomly mixed populations. Error bars represent mean ±90% confidence intervals. At all time-points analysed, recorded densities of EdU+HuC/D+ and EdU+GFP+ cells were above the confidence interval (bars) of the simulated densities in 20-60 μm circles (indicated by asterisk). (H, I) Quantification of the percentage of EdU-labelled Cherry+HuC/D+ neurons (H) and Cherry+GFP-HuC/D- cells (I) at t0, t4 and t11 in the intestine of her4.3:gfp;sox10:Cre;Cherry transgenics pulse-labelled with EdU according to the protocol shown in panel A, with biological replicates: t0 n = 6; t4, n = 5; t11 n = 6 (mean ± SD). *p<0.05, **p<0.01, ***p<0.001.
Figure 6—figure supplement 1

The Tg(her4.3:EGFP) cells are actively proliferating in adult homeostasis.
(A) Adult Tg(her4.3:EGFP) zebrafish flattened intestines immunostained for GFP (green) and the cell-cycle marker MCM5 (red). Actively proliferating GFP+MCM5+ cells were observed (arrows) throughout the intestine. The majority of the GFP+ population remains quiescent (arrowheads). Confocal images are max projections of short confocal stacks. Scale bar: 10 µm in merge panel. (B) Quantification of the percentage of GFP+MCM5+ cells over the total GFP+ population (n = 3). Data are given as mean ± SD.
Figure 6—figure supplement 2
Adult Tg(her4.3:EGFP) cells take up EdU and appear in doublets.
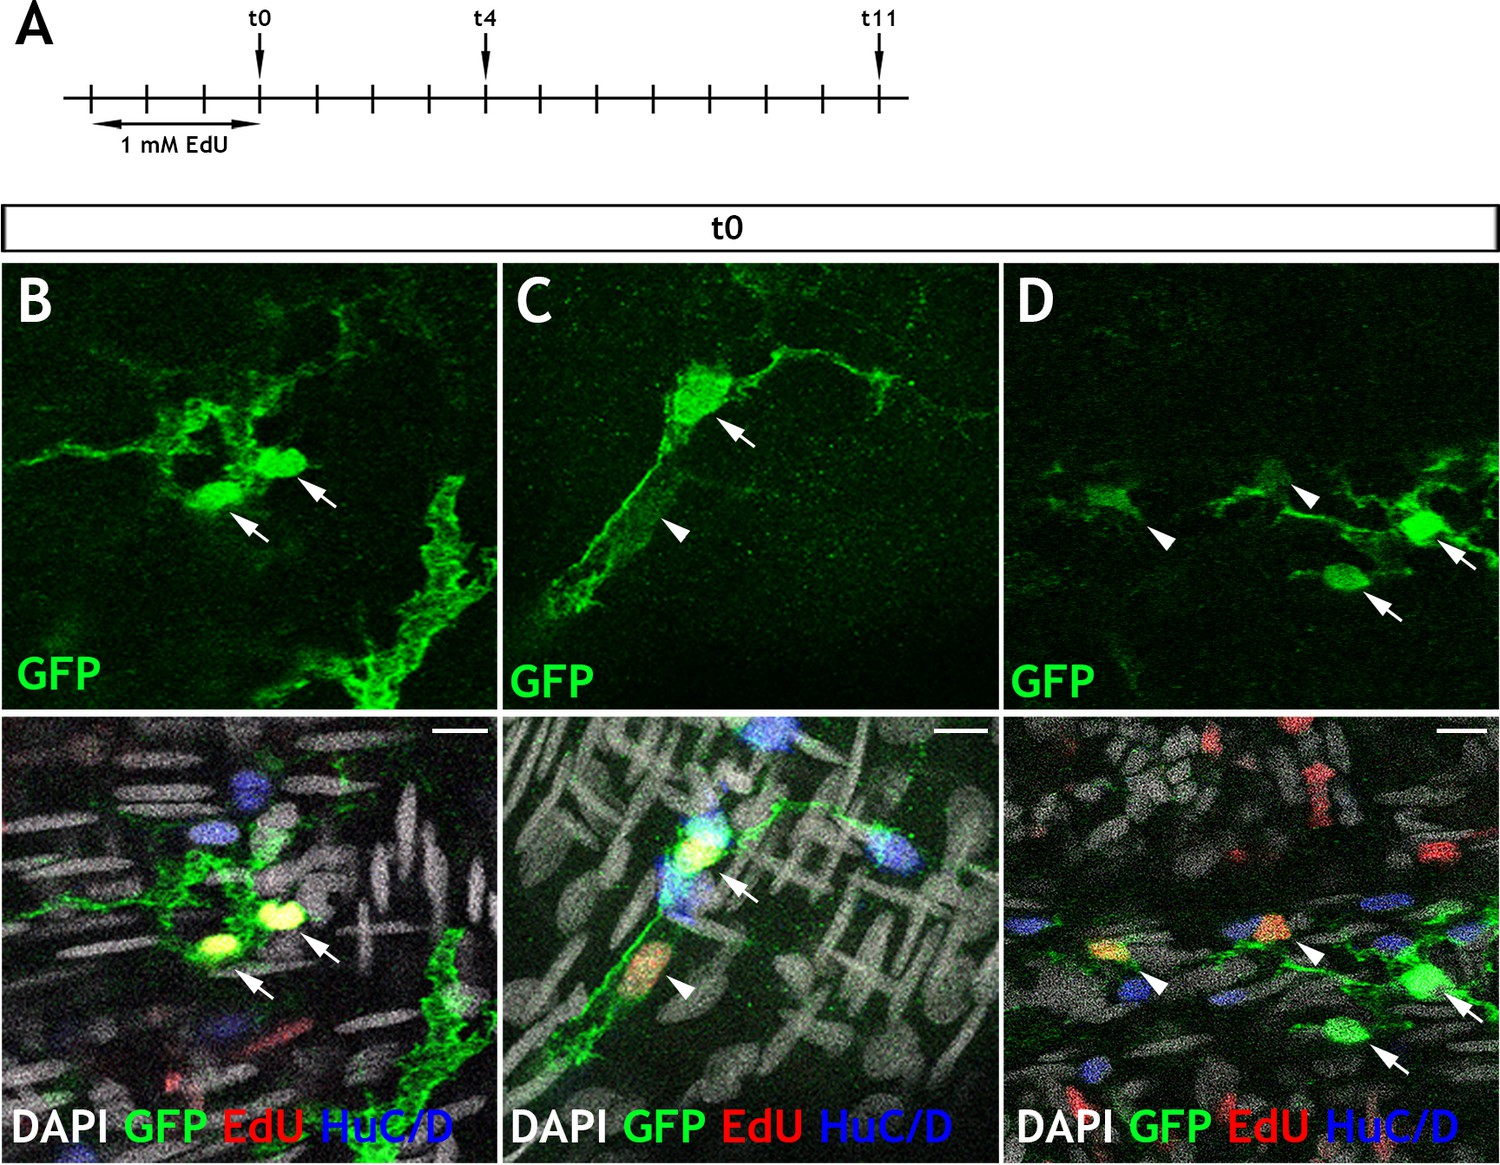
(A) Schematic of experimental design: Immersion of 3 month old adult Tg(her4.3:EGFP) zebrafish in 1 mM EdU pulse for three days was followed by a return to normal zebrafish water. Animals were then culled after chase periods of 0 days (t0), 4 days (t4) or 11 days (t11) and analysed for EdU incorporation (t0 n = 6, t4 n = 5, t11 n = 5). (B–D) At 0 days chase, the majority of EdU labelled GFP+ (yellow) cells are found in doublets (two labelled cells in close proximity). These cells are either: (B) both expressing high levels of GFP (green, arrows), (C) appear with one high GFP expressing cell (arrow) and one low GFP expressing cell (arrowhead), (D) in larger groupings, where EdU labelling is associated with cells exhibiting lower levels of GFP expression (arrowhead) and not observed in high GFP expressing cells (arrows). Confocal images are max projections of short confocal stacks. Scale bars in merge panels: 10 µm (B–D).
Figure 6—figure supplement 3

Working model of enteric glia acting as a source of neural progenitors in adult zebrafish during homeostatic conditions.
Given the similarities between Tg(her4.3:EGFP)+ EGCs and Tg(her4.3:EGFP)+ RGCs, we propose that like RGCs, EGCs may exist in two forms: Tg(her4.3:EGFP)+ quiescent EGCs (qEGCs) and Tg(her4.3:EGFP)+ activated EGC (aEGCs), the latter of which are proliferative and can take up EdU in our experiments (indicated in blue). We suggest that aEGCs are a self-renewing population, which may also revert to the quiescent state. The proliferative aEGC population can give rise to enteric neuronal progenitors (eNP; cells committed to the neurogenic lineage), which can retain EdU but are Tg(her4.3:EGFP)- and will not yet express HuC/D. These cells would correspond to the Cherry+GFP-HuC/D-EdU+ cells quantified in Figure 6I, which increase during the EdU labelling period of our experiments. Finally, neural progenitors undergo full neuronal differentiation (eN), can be detected with HuC/D and are also EdU+ in our experiments. These cells correspond to the Cherry+GFP-HuC/D+EdU+ quantified in Figure 6H, which also increase during the course of our EdU labelling experiments.
Figure 7 with 1 supplement
Notch signalling regulates the activation and differentiation of adult zebrafish EGCs.
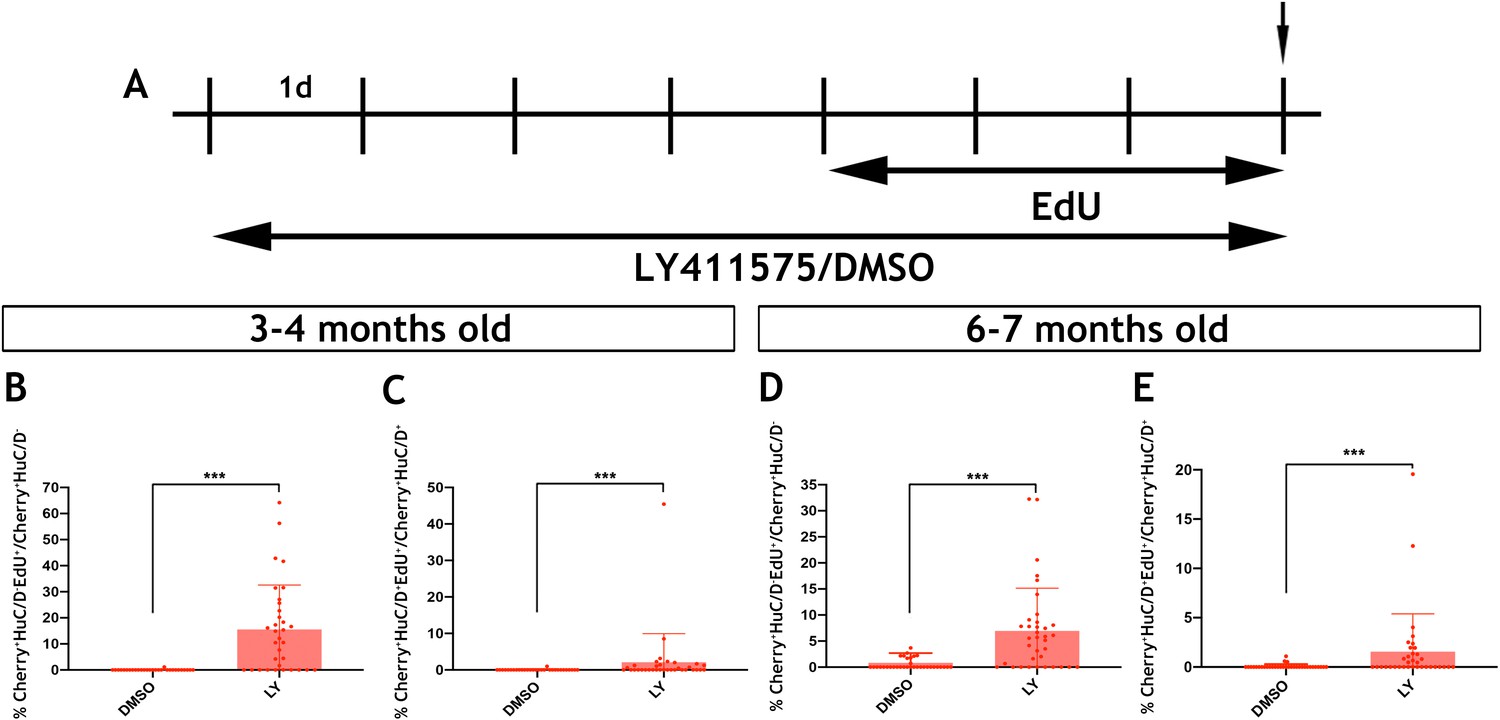
(A) Schematic representation of experimental protocol for LY/EdU treatment of adult zebrafish. (B–E) Quantification of the effect of Notch inhibition on the proliferation (B and D) and neuronal differentiation (C and E) of EGCs in 3–4 month old (B and C) and 6–7 month old (D and E) animals. N = 4 biological replicates per condition. Data are given as mean ± SD. ***p<0.001.
Figure 7—figure supplement 1

Notch inhibition in adults leads to loss of GFP expression from the Tg(her4.3:EGFP) transgene.
(A) After 7 days of DMSO treatment, the Tg(her4.3:EGFP) transgene (green) is clearly visible within the adult ENS, along with HuC/D+ neurons (red) (see also high magnification insets). (B) After 7 days of treatment with the γ-secretase inhibitor LY411575 led to a specific reduction of Tg(her4.3:EGFP) expression was observed (see also high magnification insets). Images are max projections of short confocal stacks. Left insets in the B merge panel show a single z plane of the image in B and demonstrate that GFP staining highlights multiple interconnected GFP+ cells, with several distinct Dapi+GFP+ nuclei shown (arrows). n = 4 biological replicate per condition. Scale bars in merge panels: 50 µm.
Videos
Video 1
Correlative light and electron microscopy (CLEM) analysis of the adult Tg(her4.3:EGFP;SAGFF234A;UASmmCherry) gut.
Mapping of the super-resolution light microscopy volume into the cropped SBF SEM volume using Bigwarp confirmed the identification and localisation of EGFP+ non-neuronal cells and mmCherry+ neurons within a 3D region of interest from the midgut of Tg(her4.3:EGFP;SAGFF217;UAS:mmCherry) zebrafish. The EGFP+ cells and mmCherry+ neurons that were false coloured in Figure 4 and Figure 4—figure supplement 1 are indicated with green and red arrows, respectively, showing that each forms numerous complex extensions through the volume. Data are shown at 10 frames per second, with 100 nm pixels in XY (cropped to represent a horizontal frame width of 80.5 µm) and 50 nm pixels in Z (representing a depth of 64.8 µm).
Video 2
Representative time-lapse image from a Tg(her4.3:EGFP;SAGFF234A;UASmmCherry) embryo.
Time-lapse imaging revealed that Tg(her4.3:EGFP)+ cells (grey, white arrowheads) are found within the mmCherry+neural crest cells (red) that are colonising the developing gut, but the EGFP+ cells appear behind the wavefront of migration (red arrowheads). Time given is shown as hh:mm from the start of recording. See methods for details.
Video 3
Representative recording of de novo EGFP expression in time-lapse recording from Tg(her4.3:EGFP;SAGFF234A;UASmmCherry) embryos.
De-novo her4.3:EGFP transgene expression (grey) within the enteric nervous system (red) is observed during time lapse recordings of developing Tg(her4.1:EGFP;SAGFF234A;UAS:mCherry) embryos (arrow).
Tables
Key resources table
| Reagent type (species) or resource | Designation | Source or reference | Identifiers | Additional information |
|---|---|---|---|---|
| Genetic reagent (Danio rerio) | Tg(SAGFF234A) | Asakawa et al., 2008; Kawakami et al., 2010 | SAGFF(LF)234A | zTrap Resource from Koichi Kawakami Lab |
| Genetic reagent (Danio rerio) | Tg(UAS:GFP) | Kawakami et al., 2010 | Resource from Koichi Kawakami Lab | |
| Genetic reagent (Danio rerio) | Tg(−4.7sox10:Cre) | Rodrigues et al., 2012 | Tg(−4.7sox10:Cre)ba74 | |
| Genetic reagent (Danio rerio) | Tg(βactin-LoxP-STOP-LoxP-hmgb1-mCherry) | Wang et al., 2011b | Tg(bactin2:loxP-STOP-loxP-hmgb1-mCherry)jh15 | |
| Genetic reagent (Danio rerio) | rethu2846 | ZIRC; Knight et al., 2011 | ZL3218 | |
| Genetic reagent (Danio rerio) | Tg(gfap:GFP) | ZIRC; Bernardos and Raymond, 2006 | ZL1070 | |
| Genetic reagent (Danio rerio) | Tg (−3.9nestin:GFP) | EZRC; Lam et al., 2009 | 15206 | |
| Genetic reagent (Danio rerio) | Tg(her4.3:EGFP) | Yeo et al., 2007 | ZDB-ALT-070612–3 | |
| Genetic reagent (Danio rerio) | Tg(SAGFF217B) | Kawakami et al., 2010 | zTrap Resource from Koichi Kawakami Lab | |
| Genetic reagent (Danio rerio) | Tg(UAS:mmCherry) | this paper | ||
| Antibody | anti-HuC/D (Mouse monoclonal) | Thermofisher | A21272; RRID:AB_2535822 | 1:200 |
| Antibody | anti-Cherry (Goat polyclonal) | Antibodies online | ABIN1440057 | 1:500 |
| Antibody | anti-GFP (Chick polycloonal) | Abcam | ab13970; RRID:AB_300798 | 1:500 |
| Antibody | anti-S100ß (Rabbit polyclonal) | Dako | Z0311; RRID:AB_10013383 | 1:500 |
| Antibody | anti-mouse GFAP (Rabbit polyclonal) | Sigma | G9269; RRID:AB_477035 | 1:500 |
| Antibody | anti-zebrafish GFAP (Rabbit polyclonal) | Genetex | GTX128741; RRID:AB_2814877 | 1:500 |
| Antibody | zrf-1 anti-zebrafish GFAP (Mouse mononclonal) | Abcam | ab154474; RRID:AB_10013806 | 1:200 |
| Antibody | anti-BFABP (Rabbit polyclonal) | Merck | ABN14; RRID:AB_10000325 | 1:500 |
| Antibody | anti-AcTu (Mouse monoclonal) | Sigma | T6793; RRID:AB_477585 | 1:1000 |
| Antibody | anti-MCM5 | gift from Soojin Ryu | 1:500 | |
| Commercial assay or kit | RNAscope Flourescent Multiplex Kit | Advanced Cell Diagnostics | 320850 | |
| Commercial assay or kit | RNAscope Probe-Dr-sox10 | Advanced Cell Diagnostics | 444691-C3 | |
| Commercial assay or kit | RNAscope Probe-Dr-foxd3 | Advanced Cell Diagnostics | 444681-C3 | |
| Commercial assay or kit | RNAscope Probe-Dr-ret | Advanced Cell Diagnostics | 579531 | |
| Chemical compound, drug | Notch inhibitor LY411575 | Cambridge Bioscience | 16162 |
Additional files
-
Supplementary file 1
Table containing the analysed data from the adult zebrafish gut transcriptome comparing expression in Cherry+ vs Cherry- populations.
Log fold change (logFC) of Cherry+ vs Cherry- populations is shown in column F (logFC_PE_SOX10_vs_PE_neg) and adjusted p-value (padj) is shown in column H. Significant differentially expressed genes were taken as those with logFC >2 or < −2, and padj ≤0.5. Gene names and Ensembl gene IDs found in columns A and B, respectively. See graphical depiction of this data in the volcano plot in Figure 2A.
- https://cdn.elifesciences.org/articles/56086/elife-56086-supp1-v2.xlsx
-
Supplementary file 2
Table containing the order of heatmap genes and values for Figure 2—figure supplement 1F.
Genes displayed in the heat map depicting the nRNASeq data of this study were selected as follows: genes with a logFC (Cherry+ vs Cherry-)>0, padj (Cherry+ vs Cherry-)<0.05 and an average TPM of 3. We intersected this selection with the 2,561 genes identified in ‘Additional File 2: Supplementary file 1 of Roy-Carson et al., 2017 as upregulated in 7 dpf phox2b:EGFP+ gut cells relative to EGFP- gut. This selection highlights 758 genes depicted in Figure 2—figure supplement 1F. Gene names and Ensembl gene IDs found in column K.
- https://cdn.elifesciences.org/articles/56086/elife-56086-supp2-v2.xlsx
-
Supplementary file 3
Comparison of the Cherry+ transcriptomic dataset to a single cell transcriptomic dataset of mouse ENS neurons and glia.
Comparison of the Cherry+ transcriptomic dataset to a single cell transcriptomic dataset published by Zeisel et al., 2018, describing mouse ENS neuronal and glial transcriptomes. Genes differentially expressed in the Zeisel dataset were determined as described in the Materials and Methods (logFC >0.2 in neurons vs. glia or glia vs. neurons, and p-value≤0.05). Orthologues of those genes were determined using Ensembl biomart, as described in the Materials and methods. This analysis was used to generate the data presented in Figure 2—figure supplement 2A–C and Supplementary files 4 and 5.
- https://cdn.elifesciences.org/articles/56086/elife-56086-supp3-v2.xlsx
-
Supplementary file 4
Table containing the order of heatmap genes and values for Figure 2—figure supplement 2B.
Genes displayed in the heat map depicting the nRNASeq data of this study were selected as follows: genes with a logFC (Cherry+ vs Cherry-)>0, padj (Cherry+ vs Cherry-)<0.05 and an average TPM of 3, and genes enriched in neurons in the Zeisel et al., 2018 dataset (logFC neuron vs. glia >0.2 and p-value<0.05). This analysis identifies 366 mouse ENS neuron-enriched genes that have orthologues present in our zebrafish Cherry+ transcriptome dataset, including phox2bb, ret, elavl3, elavl4, prph, vip, nos1, and likely reflect the neuronal component of our bulk dataset (See also Figure 2—figure supplement 2A,B).
- https://cdn.elifesciences.org/articles/56086/elife-56086-supp4-v2.xlsx
-
Supplementary file 5
Table containing the order of heatmap genes and values for Figure 2—figure supplement 2C.
Genes displayed in the heat map depicting the nRNASeq data of this study were selected as follows: genes with a logFC (Cherry+ vs Cherry-)>0, padj (Cherry+ vs Cherry-)<0.05 and an average TPM of 3, and genes enriched in neurons in the Zeisel et al., 2018 dataset (logFC glia vs. neurons > 0.2 and p-value≤0.05). This analysis identifies 63 mouse ENS glia-enriched genes that have orthologues present in our zebrafish Cherry+ transcriptome dataset, including sox10, foxd3, plp1b, zeb2b, vim and sox2. Significantly we do not observe canonical glial markers gfap, s100 and fabp7. Y and Z. (See also Figure 2—figure supplement 2A,C).
- https://cdn.elifesciences.org/articles/56086/elife-56086-supp5-v2.xlsx
-
Supplementary file 6
Table containing the order of heatmap genes and values for Figure 2—figure supplement 1H.
Genes displayed in the heat map depicting the nRNASeq data of this study were selected as follows: genes with a logFC (Cherry+ vs Cherry-)>0, padj (Cherry+ vs Cherry-)<0.05 and an average TPM of 3. We removed from this list the genes found in Supplementary file 1. This selection highlights 660 genes. Gene names and Ensembl gene IDs found in column K.
- https://cdn.elifesciences.org/articles/56086/elife-56086-supp6-v2.xlsx
-
Supplementary file 7
Zebrafish orthologues of the mouse genes identified in Table 1 of Rao et al., 2015 PMID:26119414 "'Top 25 genes enriched in PLP1+ enteric glia', generated using the ZFIN and Ensembl databases.
Column A shows the zebrafish gene names of the orthologues of the mouse genes shown in Column B
- https://cdn.elifesciences.org/articles/56086/elife-56086-supp7-v2.xlsx
-
Transparent reporting form
- https://cdn.elifesciences.org/articles/56086/elife-56086-transrepform-v2.docx
Download links
A two-part list of links to download the article, or parts of the article, in various formats.
Downloads (link to download the article as PDF)
Open citations (links to open the citations from this article in various online reference manager services)
Cite this article (links to download the citations from this article in formats compatible with various reference manager tools)
Enteric glia as a source of neural progenitors in adult zebrafish
eLife 9:e56086.
https://doi.org/10.7554/eLife.56086


