Positively selected modifications in the pore of TbAQP2 allow pentamidine to enter Trypanosoma brucei
Figures

Phylogenetic tree of Trypanosoma aquaporins.
The tree is a Neighbour-joining tree produced in Clustal Omega with the lengths of the horizontals proportional to the differences.

Sequence alignment and individual sequences of the T. congolense, T. b. brucei and T. suis.
The T. brucei and T. congolense sequences were obtained from tritrypDB, T. suis sequences (Kelly S, Gibson W and Carrington M. The genome of Trypanosoma suis. In preparation). The alignment was produced with Clustal Omega. The yellow highlighting indicates the N-terminus of the sequences used to determine non-synonymous v synonymous ratios. dN/dS. T brucei AQP1 v T. suis AQP1 0.21. T brucei AQP3 v T. suis AQP3 0.30. T brucei AQP2 v T. brucei AQP3 2.00.

The ratio of non-synonymous v synonymous (dN/dS) codon changes calculated for selected comparisons between T.
brucei and T. suis AQPs. The ratios were calculated using a region of high confidence alignments from ~amino acid 60 (highlighted in Figure 1—figure supplement 1) to the C-terminus.

The selectivity filter differences between TbAQP2 and TbAQP3 are largely responsible for their differences in pentamidine sensitivity and transport rates.
(A) Transport of 30 nM [3H]-pentamidine by tbaqp2/aqp3 null cells expressing TbAQP2-WT or one of the TbAQP2 mutants as indicated (blue bars). The corresponding brown bars are pentamidine transport in the control tbaqp2/aqp3 null cells assessed in parallel in each experiment. Transport was determined in the presence of 1 mM adenosine to block the TbAT1/P2 transporter. Bars represent the average and SEM of at least three independent experiments, each performed in triplicate. Blue stars: statistical significance comparison, by two-tailed unpaired Student’s tests, between the cells expressing TbAQP2WT and mutants; red stars: statistical comparison between the AQP2-expressing cells and control cells; NS, not significant. (B–F) EC50 values indicated test drugs, expressed as a percentage of the resistant control (tbaqp2/tbaqp3 null), against cell lines either expressing the indicated TbAQP2 mutant or TbAQP2WT (sensitive control). Red stars and green stars: comparison with tbaqp2/aqp3 null or TbAQP2WT-expressing cells, respectively, which were always assessed in parallel in each experiment. (G) Transport of 30 nM [3H]-pentamidine by tbaqp2/aqp3 null cells expressing TbAQP3 or an AQP3 mutant as indicated. (H) EC50 values of the indicated drugs against tbaqp2/aqp3 null cells expressing either TbAQP3 or a mutant thereof, expressed as percentage of tbaqp2/aqp3 null. All data for these graphs are contained in Figure 2—source data 1. All experiments are the average and SEM of at least three independent experiments. *, p<0.05; **, p<0.01; ***, p<0.001, ****, p<0.0001 by unpaired Student’s t-test, two-tailed.
-
Figure 2—source data 1
Individual and average EC50 values and transport rates for Figure 2A-H.
- https://cdn.elifesciences.org/articles/56416/elife-56416-fig2-data1-v3.xlsx

Mutational analysis of TbAQP2 residues I190 and W192.
(A) Transport of 30 nM [3H]-pentamidine by tbaqp2/tbaqp3 null cells or TbAQP2 variants expressed therein. Transport was expressed as a percentage of the rate of the AQP2WT control, performed in parallel. Blue stars are comparison with TbAQP2WT, red stars, comparison with the tbaqp2/tbaqp3 null control. NS, not significant. (B) EC50 values for the indicated drugs against tbaqp2/tbaqp3 null cells, and against TbAQP2WT and TbAQP2I190T expressed therein; values were expressed as % of the tbaqp2/tbaqp3 null (resistant) control. Red stars, comparison with the resistant control; green stars, comparison with the internal sensitive control (TbAQP2WT). The assays for all three strains and all three drugs were done simultaneously on at least three different occasions. (C) As B but for TbAQP2W192G. (D) As B but for TbAQP2I190T/W192G. All data for these graphs are contained in Figure 3—source data 1. *, p<0.05; **, p<0.01; ***, p<0.001, ****, p<0.0001 by unpaired Student’s t-test.
-
Figure 3—source data 1
Individual and average EC50 values and transport rates for Figure 3A-D and Figure 3—figure supplement 1.
- https://cdn.elifesciences.org/articles/56416/elife-56416-fig3-data1-v3.xlsx

Pentamidine transport analysis for TbAQP2I190T and TbAQP2WT.
(A) Transport of 30 nM [3H]-pentamidine by tbaqp2/tbaqp3 null cells expressing TbAQP2I190T, in the presence of unlabelled pentamidine at the indicated concentrations. Incubation time was 15 min, required to ensure sufficient radiolabel for accurate quantification, and uptake was linear and through zero over this period. The inhibition data were plotted to a double sigmoidal curve (Prism 7.0) with the bottom value fixed at 0. The high affinity component displayed an average an IC50 of 30.9 ± 12.2 nM (n = 3) and the lower affinity segment could be converted to a Michaelis-Menten plot for determination of Km and Vmax (inset), yielding an average Km of 59.9 ± 9.1 µM (n = 3), consistent with the Low Affinity Pentamidine Transporter (LAPT1; Bridges et al., 2007). The plot shown is one representative experiment in triplicate of three independent experiments. (B) Like (A) but with tbaqp2/tbaqp3 null cells expressing TbAQP2WT. Incubation time was 20 s (linear phase). The high affinity phase had statistically identical EC50 (41 ± 17 nM; p>0.05) as TbAQP2I190T. The inset shows a zoom-in on the low-affinity part of the curve (LAPT1 contribution), with the dotted line representing a theoretical sigmoid plot for one inhibitor, with the upper limit fixed at the value obtained for 10 μM pentamidine. The low affinity component was also statistically identical in the two strains (TbAQP2-WT Km = 82.7 ± 17.5 µM (n = 3; p>0.05)). Note that the amount of [3H]-pentamidine taken up by the low affinity component is highly similar for the mutant (A) and control (B) cell lines, at approximately 0.0005 pmol(107 cells)−1 s−1. Both frames show one representative experiment of three repeats, each performed in triplicate. Error bars are SEM, when not shown, fall within the symbol. All data for these graphs are contained in Figure 3—source data 1.

Analysis of TbAQP2 variants with a leucine-to-tryptophan or leucine-to-methionine substitution near the cytoplasmic end of the pore.
(A) Pentamidine EC50 values (nM) for mutant and WT TbAQP2 expressed in tbaqp2/tbaqp3 cells (aqp2-3 null). The mutants are either a Trp (dark blue bars) or Met (orange bars) substitution at the indicated positions. The resistant control (aqp2-3 null) and sensitive control (AQP2WT) for the separate datasets (Trp or Met) are indicated as hatched bars in the same colours. (B) As (A) but showing transport of 30 nM [3H]-pentamidine by the same cell lines, expressed as percentage of the transport rate in the TbAQP2 control cells. (C) Pentamidine EC50 values for the same mutants as in (A) but expressed in the tbaqp1-2-3 null cells, performed in parallel with the determination of EC50 values for SHAM, shown in (D). As all cell lines were done simultaneously, the resistant and sensitive strain control values are identical for the Trp and Met mutants in this series. All bars represent the average and SEM of at least three independent replicates. *, p<0.05; **, p<0.01; ***, p<0.001, ****, p<0.0001 by unpaired Student’s t-test; ns, not significant; nd, not determined. All data for these graphs are contained in Figure 4—source data 1.
-
Figure 4—source data 1
Individual and average EC50 values and transport rates for Figure 4A-E and Figure 4—figure supplement 1.
- https://cdn.elifesciences.org/articles/56416/elife-56416-fig4-data1-v3.xlsx

EC50 values for Cymelarsan, diminazene aceturate and phenylarsine oxide (PAO) against the tbaqp2-tbaqp3 null cell line.
AQP2-WT and various mutant versions thereof (indicated) were expressed in this cell line. EC50 values were determined using the alamar blue (resazurin) assay. Bars represent the average and SEM for at least three determinations. nd, not done. All data for these graphs are contained in Figure 4—source data 1.

Correlation of the EC50 value with the rate of pentamidine transport for all 19 cell lines expressing a wild-type or mutant TbAQP2 in the aqp2/3 null T. b. brucei line.
All EC50 values are expressed as percentage of the resistant control, aqp2/3 null transfected with an empty vector (no TbAQP2). 2T1 is the parental cell line of the aqp2/3 null. All values are the average of at least three independent determinations; the sensitive and resistant control cell lines were included in each independent experiment and the percentages taken are from the internal control rather than from the grand average over all experiments. All data for these graphs are contained in Figure 4—source data 1.

Disabling endocytosis does not reduce uptake of pentamidine.
(A) qRT-PCR of CRK12, normalised to housekeeping gene GPI-8 (n = 3). (B) Transport of 0.025 µM [3H]-Pentamidine measured in control (non-induced) and CRK12 cell after exactly 12 hr of tetracycline induction; incubation time with label was 30 s. Bar is average and SEM of 5 independent determinations, each performed in triplicate. NS, not significant by unpaired Student’s t-test. (C) As frame B but uptake of 0.25 µM [3H]-suramin over 15 min; average and SEM of 5 independent determinations, each in quadruplicate. **, p=0.0027 by Student’s unpaired, two-tailed t-test. All data for these graphs are contained in Figure 5—source data 1.
-
Figure 5—source data 1
mRNA abundance for Figure 5A plus transport rates for Figure 5B, C and Figure 5—figure supplement 1.
- https://cdn.elifesciences.org/articles/56416/elife-56416-fig5-data1-v3.xlsx

Growth Curve of CRK12 RNAi cells in full HMI-9 medium at 37°C/5% CO2, in the presence or absence of 1 μg/ml tetracycline (tet).
Cell counts were performed with a haemocytometer and the average of duplicate determinations is shown. All data for these graphs are contained in Figure 5—source data 1.

Quantification of western blots of 3×HATbAQP2.
Cells were induced for expression of 3×HATbAQP2, pretreated with cyclohexidine and subsequently with 25 nM pentamidine (5× EC50). Western blots (Figure 6—figure supplement 1) were performed using anti-HA antiserum in order to quantify the relative amount of TbAQP2 in the cells. The two datasets were not significantly different by Kolmogorov-Smirnov test (p=0.77) and data points at each time point were also not significantly different by Student’s t-test (p>0.05). All data for these graphs are contained in Figure 6—source data 1.
-
Figure 6—source data 1
Densitometry readings with Western blotting of TbAQP2 turnover, normalised to 0 h.
- https://cdn.elifesciences.org/articles/56416/elife-56416-fig6-data1-v3.xlsx

Western blots for a 3xHAAQP2 turnover assay in untreated T. brucei 2T1 cells, or in the presence of pentamidine 25 nM.
Two independent experiments are shown. HA, haemagglutinin; tub, β-tubulin; CHX, cycloheximide; α-HA, anti-HA serum. All data for these graphs are contained in Figure 6—source data 1.

High affinity pentamidine uptake in T. b. brucei is sensitive to ionophores.
(A) Uptake of 25 nM [3H]-pentamidine in s427WT bloodstream forms was measured in the presence of 1 mM adenosine to block the P2 transporter, and in the further presence of various ionophores at the indicated concentrations in µM. Incubation with radiolabel was 5 min after a 3 min pre-incubation with ionophore. Accumulation of radiolabel was expressed as a percentage of the control, being a parallel incubation in the absence of any ionophore. Bars represent the average of 3–5 independent determinations (each performed in quadruplicate) and SEM. (B) Uptake of 0.25 µM [3H]-suramin by T. b. brucei s427WT cells over 10 min. Cells were incubated in parallel, with or without the presence of 20 µM CCCP (plus 3 min pre-incubation). Saturation of the suramin-receptor interaction was demonstrated by including 100 µM unlabelled suramin (blue bars). Bars represent average and SEM or three independent experiments, each performed in quadruplicate. (C) Correlation plot of pentamidine transport rate versus protonmotive force (PMF), r2 = 0.93, p<0.05 by F-test. Concentrations in µM are indicated in the frame. CCCP is shown in red and not included in the regression analysis. Each data point is the average of 4 or more independent repeats performed in quadruplicate. The values for PMF were taken from de Koning and Jarvis, 1997b. (D) Uptake of 0.25 µM [3H]-glycerol by aqp1/aqp2/aqp3 null cells expressing TbAQP2-WT. Dose response with CCCP and pentamidine (PMD), using an incubation time of 1 min. The graph shown was performed in triplicate and representative of three independent repeats. (E) As D but using 0.025 µM [3H]-pentamidine and 30 s incubations. Representative graph in triplicate from three independent repeats. *, p<0.05; **, p<0.01; ***, p<0.001 by Student’s unpaired t-test. All data for these graphs are contained in Figure 7—source data 1.
-
Figure 7—source data 1
Individual and average transport rates and PMF values for Figure 7A-E.
- https://cdn.elifesciences.org/articles/56416/elife-56416-fig7-data1-v3.xlsx

Pentamidine binding in TbAQP2 and free-energy profile of permeation (Left).
(A) Docked conformation of pentamidine (blue) bound to the TbAQP2 (wheat). The protein and the ligand were modelled as described.4 The protein pore is shown in grey mesh, and the mutated positions described in the text are in magenta. (Right) Free-energy profile G(L) (solid blue line) along the pore axis of TbAQP2 (L). The membrane voltage of T. b. brucei gives rise to a voltage drop across the membrane (gray dotted line), which alters the free-energy profile (dashed blue line includes Vm effect) and reduces the free-energy of pentamidine exit into the intracellular bulk by ~22 kJ/mol as compared to the extracellular side (black arrow). (B) Close-up views comparing the bound positions of pentamidine (left) and melarsoprol (right) and showing the mutated sites and major interactions with the AQP2 pore lining.

Backbone RMSD of the protein inserted into a lipid bilayer showing convergence to ~3 Å in a simulation of 100 ns length.

Correlation between linker chain length and affinity to HAPT1.
(A) A series of pentamidine analogues with different methylene linker length was tested for inhibition of TbAQP2/HAPT1-mediated 25 nM [3H]-pentamidine transport (i.e. in the presence of adenosine to block the TbAT1/P2 transporter). The Ki values are listed in Table 1. All Ki values are shown as average and SEM of 3 or more independent experiments, each performed in triplicate. (B) The distance between the amidine carbon atoms in the lowest-energy conformation was calculated using density functional theory as implemented in Spartan’ 16 v2.0.7. Geometry optimisations were performed with the wB97XD functional and the 6–31G* basis set at the ground state in gas phase. Structures and distances shown represent the dication state that is overwhelmingly prevalent in aqueous solution at neutral pH. The numbered red data points correspond to the propamidine - octamidine series in frame A. (C) Repulsion between free electron pairs (double dots), indicated by curved blue lines for RT-52 in the cis-conformation, causing it to exist overwhelmingly in the anti-conformation. (D) Overview of SAR observations on the binding preferences of TbAQP2 for pentamidine and its analogues. All data for these graphs are contained in Figure 9—source data 1.
-
Figure 9—source data 1
Ki values for Figure 9A and B.
- https://cdn.elifesciences.org/articles/56416/elife-56416-fig9-data1-v3.xlsx

Correlation between the Resistance Factor (RF; EC50(aqp2/3 null)/EC50(TbAQP2-WT)) and the Ki value for inhibition of the High Affinity Pentamidine Transporter (HAPT1) encoded by TbAQP2.
The pentamidine value (bold) is the Km determined with radiolabeled pentamidine. The table lists the data points shown in the plot. The line was made by linear regression (Prism 6.0); correlation coefficient r2 is 0.037. F-test: slope is not significantly different from zero (p=0.33). All values are in µM. All data for these graphs are contained in Figure 9—source data 1.
Tables
Pentamidine analogues with an aliphatic linker.
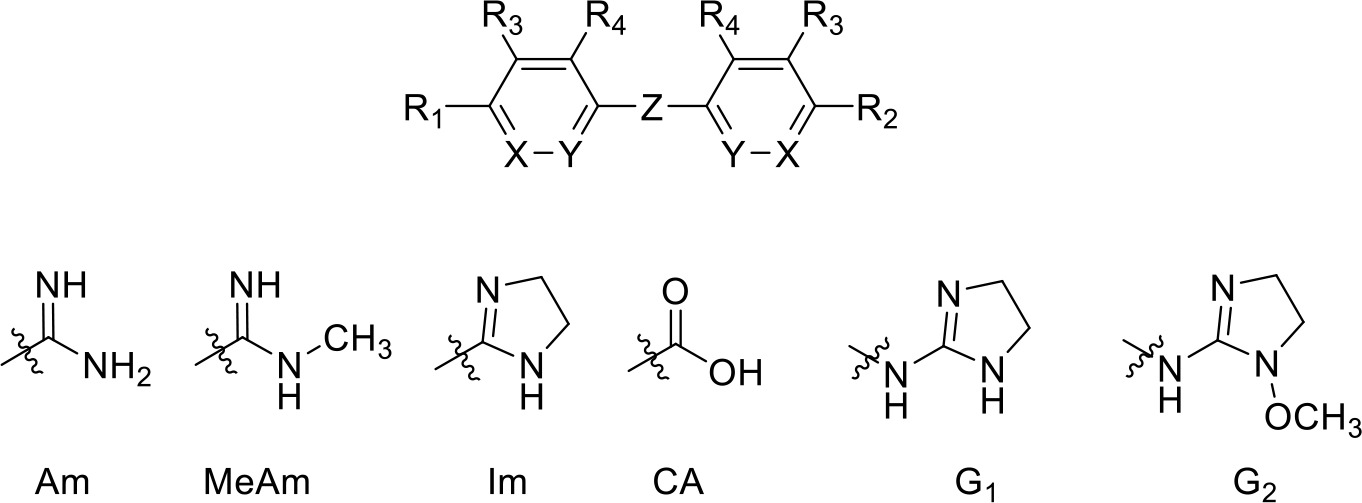 | |||||||||
|---|---|---|---|---|---|---|---|---|---|
| Compound | R1 | R2 | R3 | R4 | X | Y | Z | Ki (µM) | δ(ΔG0) PMD (kJ/mol) |
| Ethamidine | Am | Am | H | H | CH | CH | -O-(CH2)2-O- | >100 | >19.7 |
| Propamidine | Am | Am | H | H | CH | CH | -O-(CH2)3-O- | 6.63 ± 1.40 | 13.0 |
| Butamidine | Am | Am | H | H | CH | CH | -O-(CH2)4-O- | 3.87 ± 1.38 | 11.7 |
| Pentamidine (PMD) | Am | Am | H | H | CH | CH | -O-(CH2)5-O- | 0.036 ± 0.0006 | -- |
| Hexamidine | Am | Am | H | H | CH | CH | -O-(CH2)6-O- | 0.058 ± 0.011 | 1.3 |
| Heptamidine | Am | Am | H | H | CH | CH | -O-(CH2)7-O- | 0.123 ± 0.010 | 3.1 |
| Octamidine | Am | Am | H | H | CH | CH | -O-(CH2)8-O- | 2.16 ± 0.48 | 10.2 |
| RT-48 | Am | Am | H | H | CH | CH | -S-(CH2)5-S- | 2.01 ± 0.86 | 10.0 |
| RT-50 | Am | Am | H | H | CH | CH | -NH-(CH2)5-NH- | 6.27 ± 1.30 | 12.9 |
| RT-49 | Am | Am | H | H | CH | CH | -SO2-(CH2)5-SO2- | >150 | >20.7 |
| DB1699 | Am | Am | H | H | CH | CH | -O-(CH2)2-O-(CH2)2-O- | 16.6 ± 2.1 | 15.3 |
| RT-36 | Am | NH2 | H | H | CH | CH | -O-(CH2)5-O- | 0.43 ± 0.07 | 6.2 |
| CHI/1/72/1 | Am | CH3 | H | H | CH | CH | -O-(CH2)5-O- | 3.1 ± 0.7 | 10.7 |
| CHI/1/69/1 | Am | H | H | H | CH | CH | -O-(CH2)4-O- | 2.3 ± 0.5 | 10.4 |
| RT-38 | Am | CA | H | H | CH | CH | -O-(CH2)3-O- | NI, 100 | >19.7 |
| meta-PMD | H | H | Am | H | CH | CH | -O-(CH2)5-O- | 2890 ± 1050 | 28.1 |
| RT-32 | Im | Im | H | H | CH | CH | -O-(CH2)5-O- | 0.40 ± 0.08 | 6.0 |
| RT-30 | MeAm | MeAm | H | H | CH | CH | -O-(CH2)5-O- | 0.30 ± 0.07 | 5.3 |
| Stilbamidine | Am | Am | H | H | CH | CH | -CH = CH- | 54.8 ± 3.2 | 18.3 |
| FR39 | G1 | G1 | H | H | CH | CH | -(CH2)2- | 41.7 ± 15.2 | 17.6 |
| CRMI8 | G2 | G2 | H | H | CH | CH | -(CH2)2- | 52.8 ± 12.7 | 18.1 |
| RT-43 | Am | Am | H | Cl | CH | CH | -O-(CH2)5-O- | 0.51 ± 0.15 | 6.6 |
| Iodo-PMD | Am | Am | H | I | CH | CH | -O-(CH2)5-O- | 2.15 ± 0.04 | 8.4 |
| RT-46 | Am | Am | H | -C(O)NH2 | CH | CH | -O-(CH2)5-O- | >100 | >19.7 |
| RT-52 | Am | Am | H | H | CH | N | -O-(CH2)5-O- | 8.84 ± 0.88 | 13.7 |
| RT-53 | Am | Am | H | H | N | CH | -O-(CH2)5-O- | NI, 250 | >22 |
-
Am, amidine; MeAm, Methyl-amidine; Im, imidazole; CA, carboxylic acid; G1, 2-aminoimidazoline; G2, 1-methoxy-2-aminoimidazoline. PMD, pentamidine, NI, no inhibition at the indicated concentration in µM. Ki is the inhibition constant for [3H]-pentamidine transport by TbAQP2/HAPT1. δ(ΔG0) PMD is the difference in Gibbs Free Energy of interaction of the substrate with TbAQP2 with the same value for pentamidine (PMD). All Ki values are the average and SEM of at least 3–4 independent experiments.
Selection of diamidine analogues with aromatic linkers.
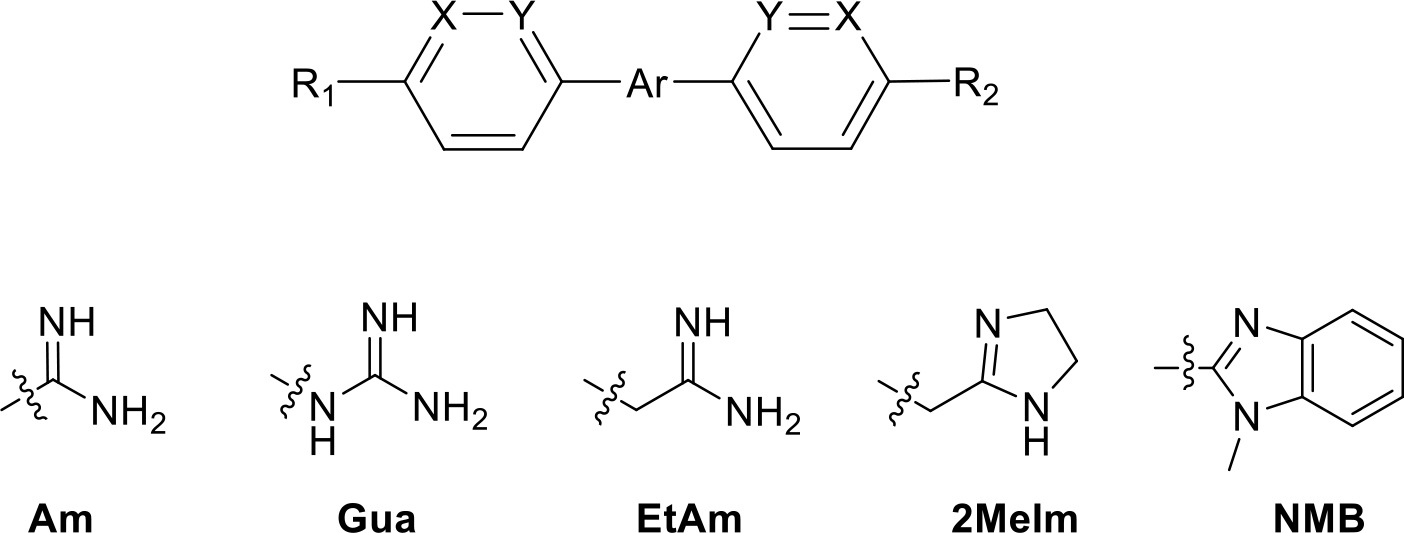 | |||||||
|---|---|---|---|---|---|---|---|
| Compound | R1 | R2 | Ar | X | Y | Ki (µM) | δ(ΔG0) PMD (kJ/mol) |
| DB75 | Am | Am | 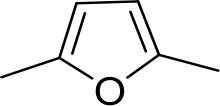 | CH | CH | 38.2 ± 10.2 | 17.3 |
| DB607 | Am | OCH3 | 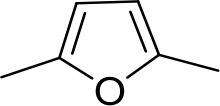 | CH | CH | 18.1 ± 1.9 | 15.5 |
| DB960 | Am | NMBa | 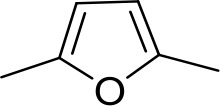 | CH | CH | 16.6 ± 3.5 | 15.3 |
| DB994 | Am | Am | 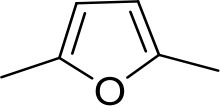 | N | CH | 167 ± 20 | 21.0 |
| DB829 | Am | Am |  | CH | N | 39.9 ± 8.0 | 17.4 |
| DB1061 | EtAm | EtAm | 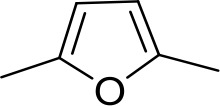 | CH | CH | 32.3 ± 6.0 | 16.9 |
| DB1062 | 2MeIm | 2MeIm | 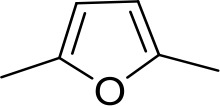 | CH | CH | 59.6 ± 11.2 | 18.4 |
| ER1004 | Am | Am | 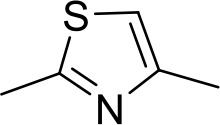 | CH | CH | 68.7 ± 16.0 | 18.8 |
| DB320 | Am | Am | 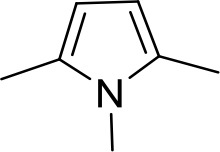 | CH | CH | 71.3 ± 12.1 | 18.9 |
| DB686 | Gua | Gua | 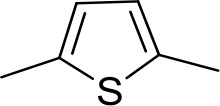 | CH | CH | 0.29 ± 0.11 | 5.2 |
| DB1063 | EtAm | EtAm |  | CH | CH | 0.40 ± 0.10 | 6.0 |
| DB1064 | 2MeIm | 2MeIm | 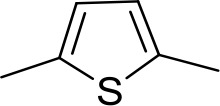 | CH | CH | 3.0 ± 0.82 | 11.0 |
| DB1213 | Am | Am |  | CH | CH | 0.72 ± 0.17 | 7.5 |
| DB1077 | Am | Am | 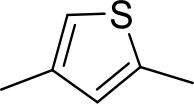 | CH | CH | 13.8 ± 3.1 | 14.8 |
| DB914 | Am | Am | 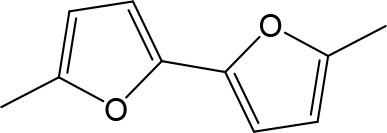 | CH | CH | 0.073 ± 0.013 | 1.8 |
-
Am, amidine; Im, imidazole; EtAm, ethylamidine; 2MeIm, 2-methylimidazoline; NMB, N-methyl benzimidazole. aThis compound lacks the second benzene ring and features the terminal NMB moiety instead. Ki is the inhibition constant for [3H]-pentamidine transport by TbAQP2/HAPT1. δ(ΔG0) PMD is the difference in Gibbs Free Energy of interaction of the substrate with TbAQP2 with the same value for pentamidine (PMD). All Ki values are the average and SEM of at least 3–4 independent experiments.
| Reagent type (species) or resource | Designation | Source or reference | Identifiers | Additional information |
|---|---|---|---|---|
| Cell line (Trypanosoma brucei) | 2T1 | David Horn | ||
| Cell line (Trypanosoma brucei) | aqp2/aqp3 null | David Horn | ||
| Cell line (Trypanosoma brucei) | aqp1-3 null | David Horn | ||
| Cell line (Trypanosoma brucei) | CRK12 RNAi | Tansy Hammarton | ||
| Recombinant DNA reagent | pRPa | David Horn | plasmid for expression in T. brucei | |
| Gene (Trypanosoma brucei) | AQP2 | TriTrypDB | Tb927.10.14170 | Sequence in Supplementary file 2 |
| Gene (Trypanosoma brucei) | TbAQP2S131P/S263A | This paper | Mutated TbAQP2; sequence in Supplementary file 2 | |
| Gene (Trypanosoma brucei) | TbAQP2L258Y | This paper | Mutated TbAQP2; sequence inSupplementary file 2 | |
| Gene (Trypanosoma brucei) | TbAQP2I110W | This paper | Mutated TbAQP2; sequence inSupplementary file 2 | |
| Gene (Trypanosoma brucei) | TbAQP2L264R | This paper | Mutated TbAQP2; sequence in Supplementary file 2 | |
| Gene (Trypanosoma brucei) | TbAQP2I110W /L264R | This paper | Mutated TbAQP2; sequence in Supplementary file 2 | |
| Gene (Trypanosoma brucei) | TbAQP2I190T | This paper | Mutated TbAQP2; sequence in Supplementary file 2 | |
| Gene (Trypanosoma brucei) | TbAQP2W192G | This paper | Mutated TbAQP2; sequence in Supplementary file 2 | |
| Gene (Trypanosoma brucei) | TbAQP2I190T/W192G | This paper | Mutated TbAQP2; sequence in Supplementary file 2 | |
| Gene (Trypanosoma brucei) | TbAQP2L84W | This paper | Mutated TbAQP2; sequence in Supplementary file 2 | |
| Gene (Trypanosoma brucei) | TbAQP2L84M | This paper | Mutated TbAQP2; sequence in Supplementary file 2 | |
| Gene (Trypanosoma brucei) | TbAQP2L118W | This paper | Mutated TbAQP2; sequence in Supplementary file 2 | |
| Gene (Trypanosoma brucei) | TbAQP2L118M | This paper | Mutated TbAQP2; sequence in Supplementary file 2 | |
| Gene (Trypanosoma brucei) | TbAQP2L218W | This paper | Mutated TbAQP2; sequence in Supplementary file 2 | |
| Gene (Trypanosoma brucei) | TbAQP2L218M | This paper | Mutated TbAQP2; sequence in Supplementary file 2 | |
| Gene (Trypanosoma brucei) | TbAQP2L84W/L118W | This paper | Mutated TbAQP2; sequence in Supplementary file 2 | |
| Gene (Trypanosoma brucei) | AQP3 | TriTrypDB | Tb927.10.14160 | Sequence in Supplementary file 2 |
| Gene (Trypanosoma brucei) | TbAQP3W102I/R256L | This paper | Sequence in Supplementary file 2 | |
| Gene (Trypanosoma brucei) | TbAQP3W102I/R256L/Y250L | This paper | Sequence in Supplementary file 2 | |
| Chemical compound, drug | All itemised in Supplementary file 1 | Custom inhibitors and pentamidine analogues | ||
| Chemical compound, drug | Pentamidine isethionate | Sigma-Aldrich | ||
| Chemical compound, drug | Diminazene aceturate | Sigma-Aldrich | ||
| Chemical compound, drug | Suramin | Sigma-Aldrich | ||
| Chemical compound, drug | Cymelarsan | gift from C. Michael Turner | ||
| Chemical compound, drug | [3H]-pentamidine | GE Healthcare Life Sciences | Radiochemical | |
| Chemical compound, drug | [3H]-Suramin | American Radiolabeled Chemicals | Radiochemical | |
| Chemical compound, drug | [3H]-glycerol | American Radiolabeled Chemicals | Radiochemical |
Additional files
-
Supplementary file 1
Table of all HAPT/TbAQP2 inhibitors used in this study.
- https://cdn.elifesciences.org/articles/56416/elife-56416-supp1-v3.xlsx
-
Supplementary file 2
Table with all sequences of TbAQP2 and the generated mutants thereof.
Mutated nucleotides and codons are indicated.
- https://cdn.elifesciences.org/articles/56416/elife-56416-supp2-v3.docx
-
Supplementary file 3
Synthesis of all new inhibitors used in this study.
- https://cdn.elifesciences.org/articles/56416/elife-56416-supp3-v3.docx
-
Supplementary file 4
List of primers used in the construction of mutations in TbAQP2.
- https://cdn.elifesciences.org/articles/56416/elife-56416-supp4-v3.docx
-
Supplementary file 5
Primers used for mutations in TbAQP3.
- https://cdn.elifesciences.org/articles/56416/elife-56416-supp5-v3.docx
-
Transparent reporting form
- https://cdn.elifesciences.org/articles/56416/elife-56416-transrepform-v3.docx


