Measuring protein stability in the GroEL chaperonin cage reveals massive destabilization
- Departments of Structural Biology, Weizmann Institute of Science, Israel
- Chemical and Biological Physics, Weizmann Institute of Science, Israel
Figures
Figure 1 with 2 supplements
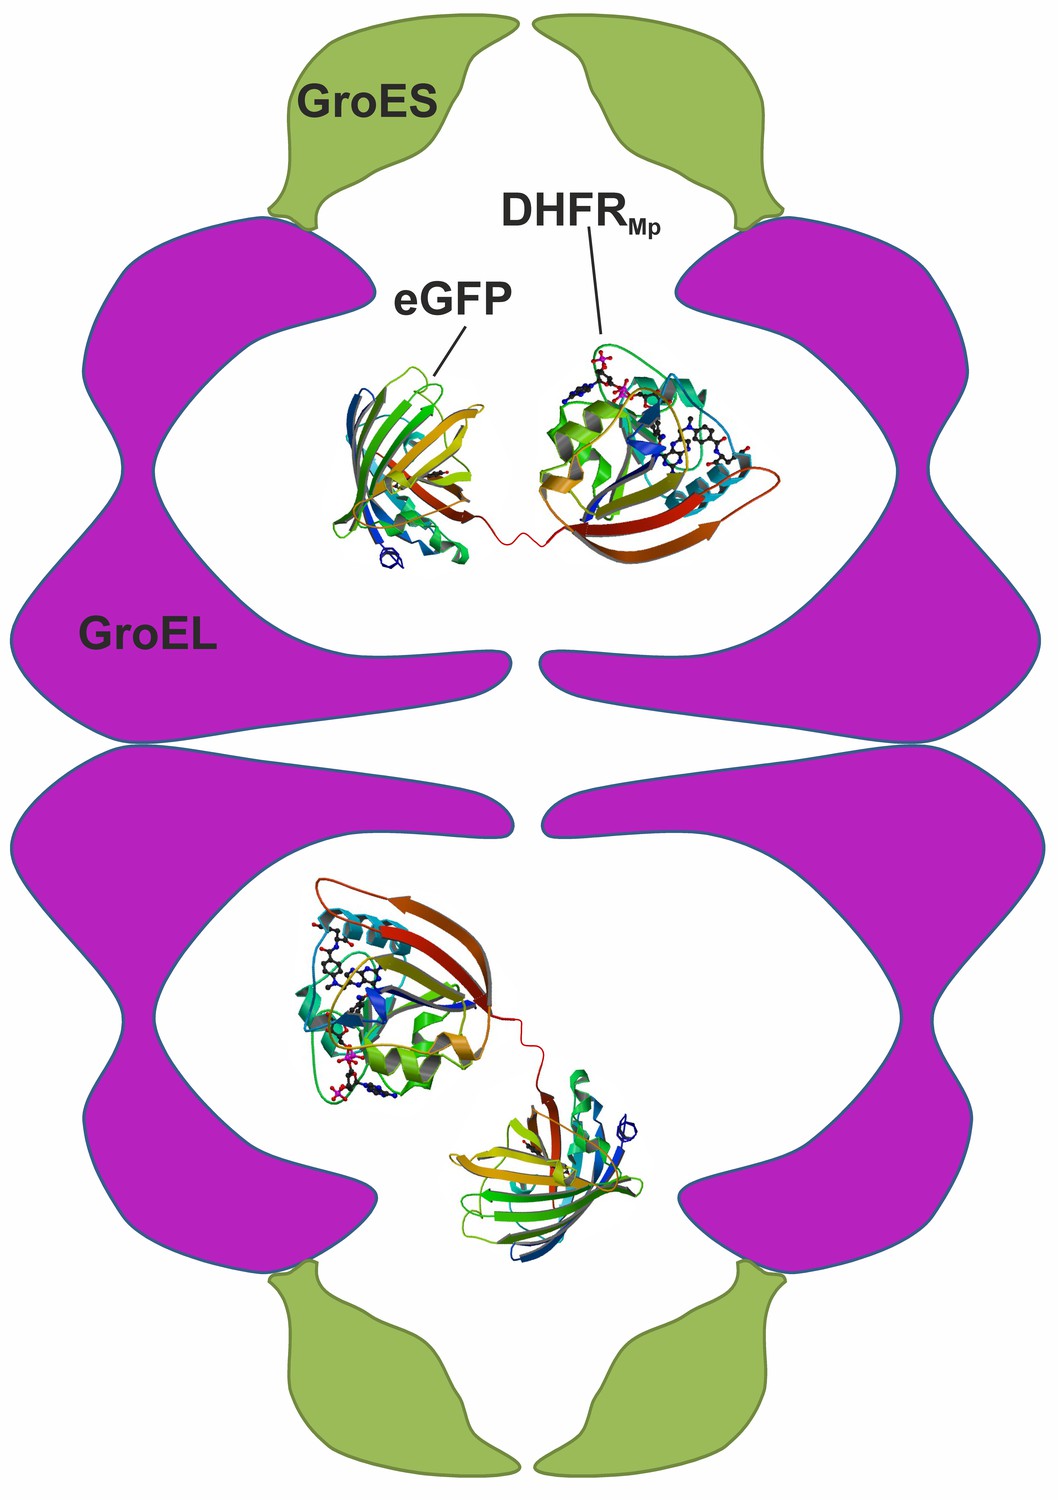
Scheme showing the experimental system used to measure protein stability in the chaperonin cage.
A chimera was formed by fusing dihydrofolate reductase from Moritella profunda (DHFRMp, PDB ID: 3IA4) to the C-terminus of eGFP (PDB ID: 2Y0G) via a linker. This chimera was then encapsulated in the cavity of the BeFx-stabilized football–shaped GroEL-GroES2 complex, which is depicted schematically with GroEL in purple and GroES in green. The cavity volume is about 175,000 Å3 whereas that of the chimera (which is not drawn to scale) is about 58,000 Å3 assuming 1.23 Å3 per Da.
Figure 1—figure supplement 1
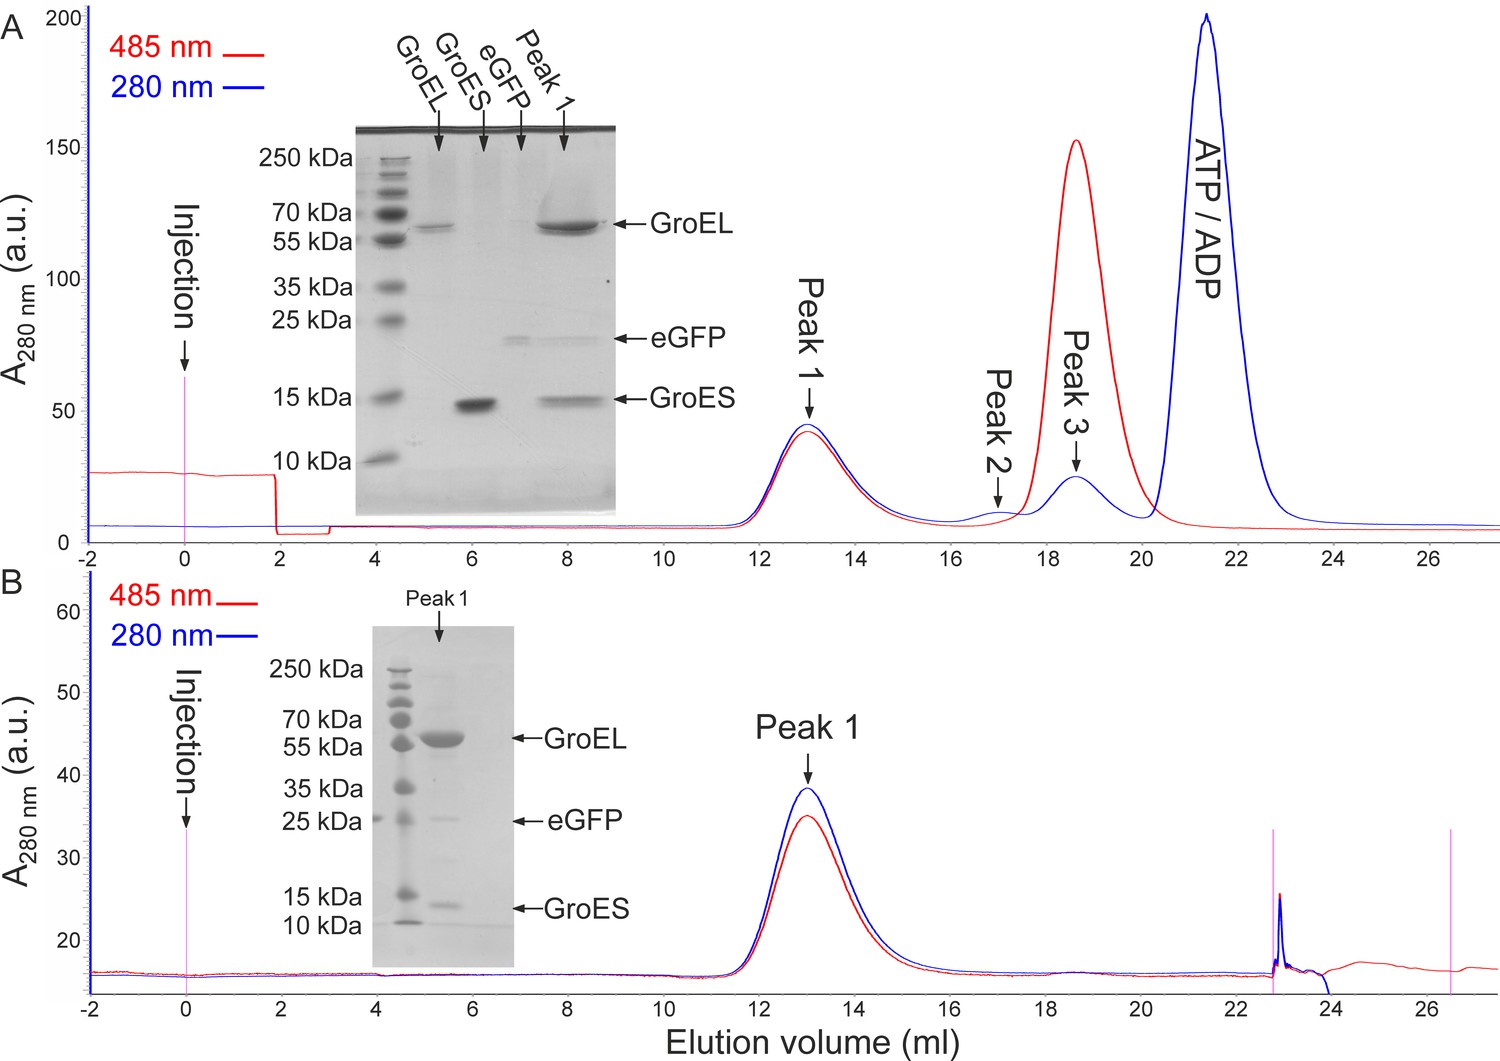
Isolation and stability of eGFP-containing GroEL-GroES2 football-shaped complexes.
(A) Freshly assembled eGFP-containing ‘football’ complexes were applied to a gel-filtration column and elution was monitored by measuring protein and eGFP absorbance at 280 and 485 nm, respectively. The inset shows SDS-PAGE analysis of a peak one fraction, which contains ‘football’ complexes with encapsulated eGFP. (B) A sample of ‘football’ complexes with encapsulated eGFP was kept at room temperature overnight and then analyzed by gel-filtration as above. Only one protein-containing fraction was observed and no free eGFP could be detected. SDS-PAGE analysis of this fraction (inset) showed that it contains GroEL, GroES and eGFP. Taken together, these results show that the GroEL-GroES2 football-shaped complexes remained intact and that eGFP did not escape outside during the overnight incubation. These experiments were repeated at least five times.
Figure 1—figure supplement 2

Isolation and stability of eGFP-containing single-ring GroEL in complex with GroES.
(A) Freshly assembled eGFP-containing single-ring GroEL (SR1) complexes with GroES were applied to a gel-filtration column. The fractions were analyzed by SDS-PAGE (inset). The first peak, which was found to contain GroEL, GroES and eGFP, corresponds to eGFP-containing SR1 in complex with GroES. (B) Samples of eGFP-containing SR1 in complex with GroES were kept at overnight at room temperature and then analyzed by gel-filtration. Most of the eGFP was found in fractions (peak 3) that contain no GroEL and GroES (inset), thereby indicating that eGFP escaped from the cavity of the complex of SR1 with GroES. These experiments were repeated twice.
Figure 2
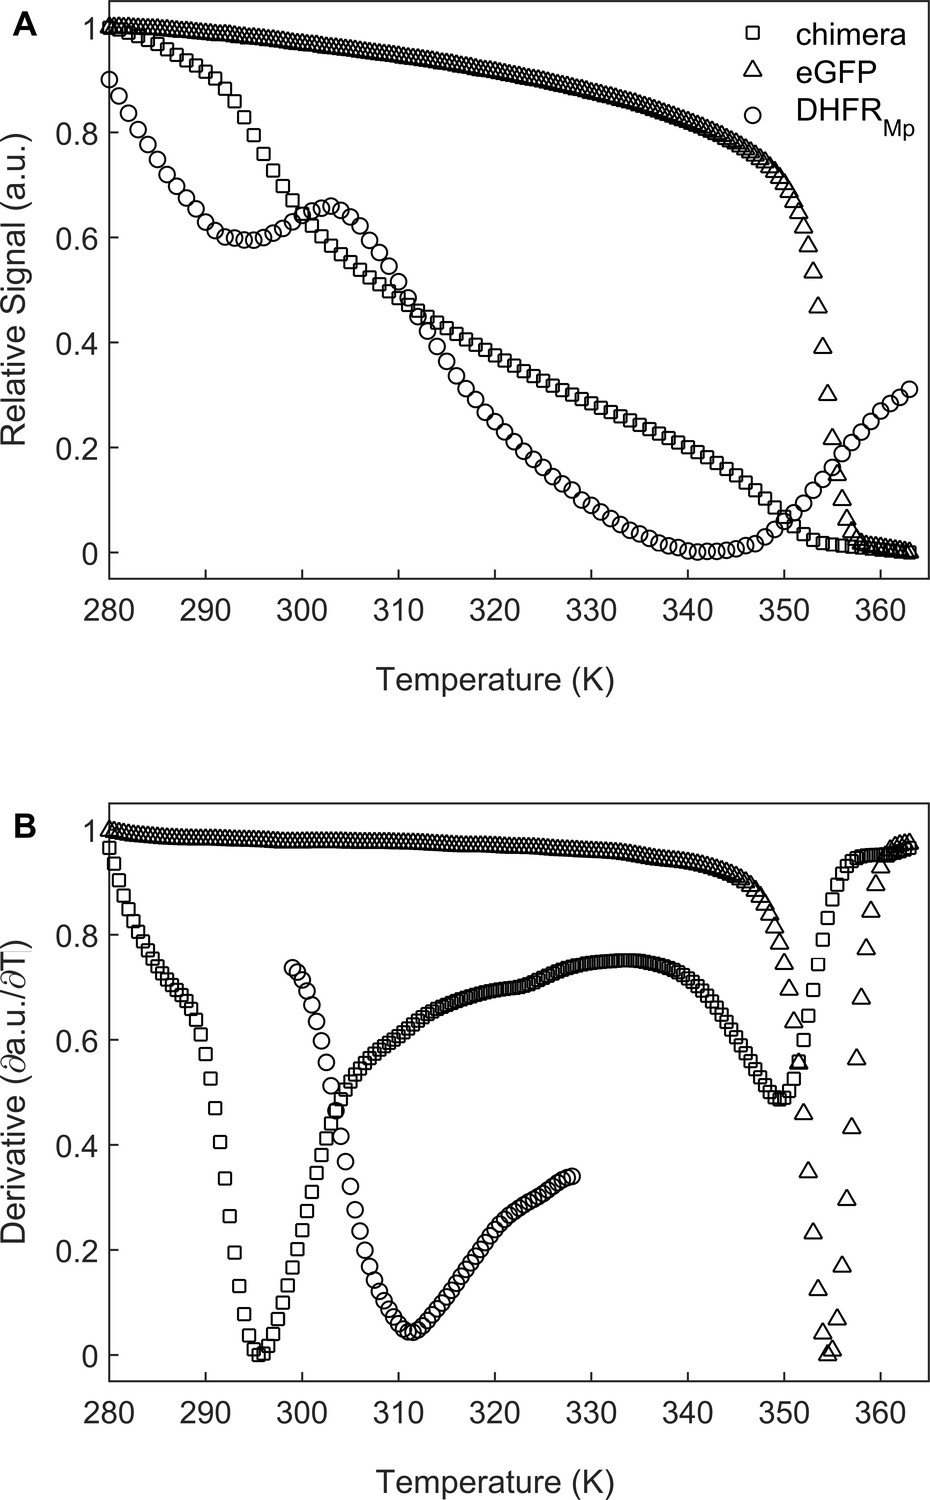
Melting temperature analysis of eGFP, DHFRMp and their chimera.
(A) DHFRMp, eGFP and a chimera of these proteins were subjected to temperature denaturation in bulk solution using a Real-Time PCR machine. Denaturation was monitored by measuring the change in fluorescence of the SYPRO Orange reagent. Each trace represents the average of at least six experiments. (B) Plots of the first derivatives of the denaturation curves as a function of temperature. Melting points were determined from these plots by using the StepOne Software v2.3.
-
Figure 2—source data 1
Temperature melts of eGFP, DHFRMpand their chimera.
- https://cdn.elifesciences.org/articles/56511/elife-56511-fig2-data1-v3.xlsx
Figure 3
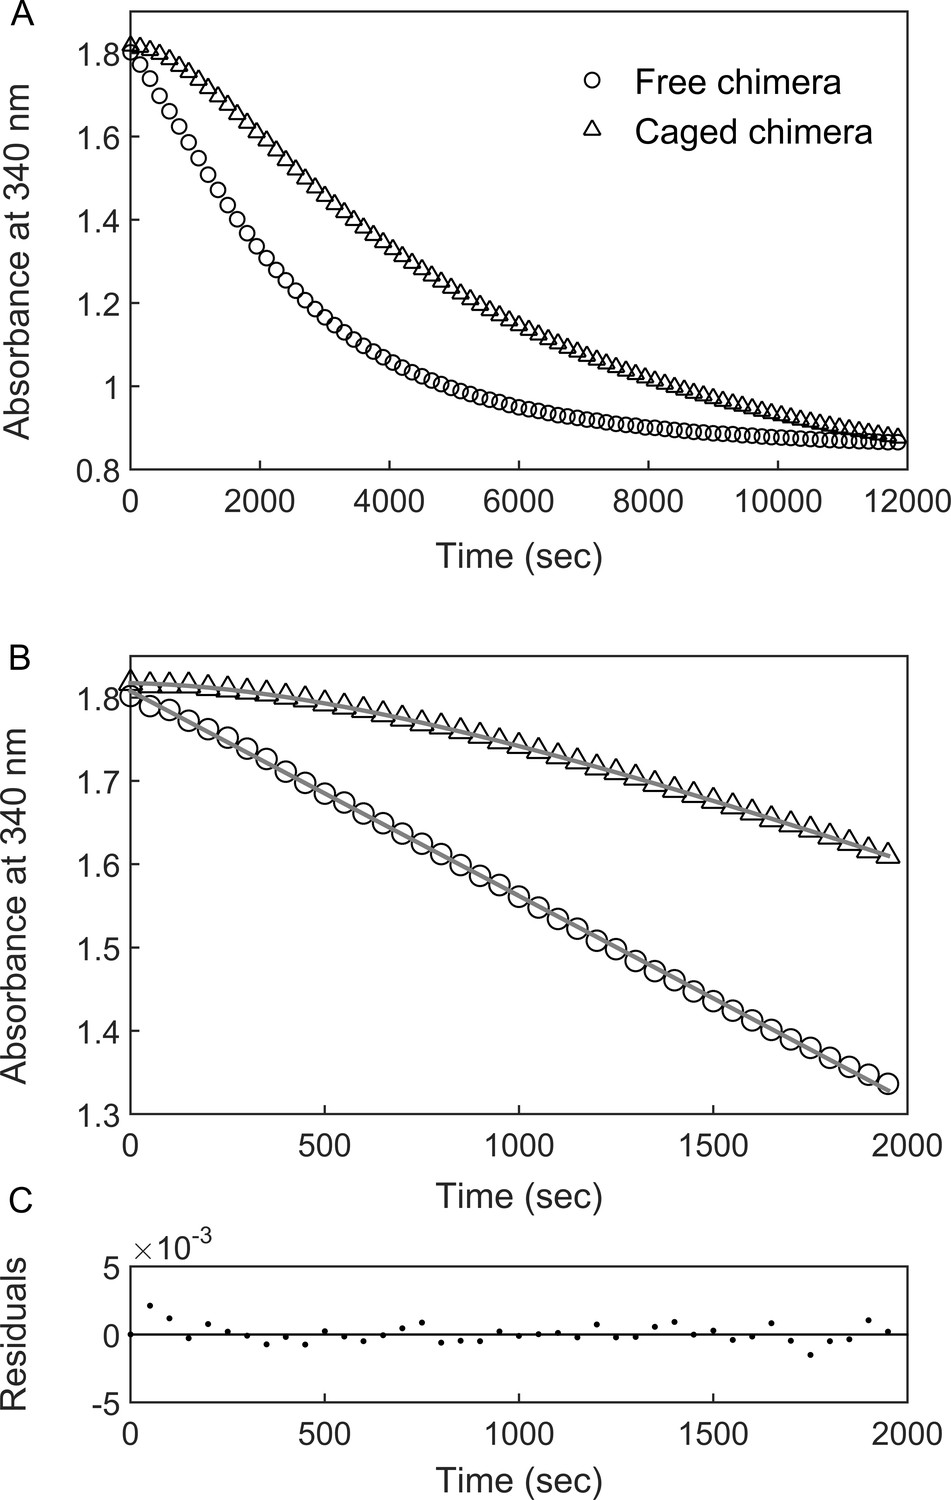
DHFRMp activity of the GroE-encapsulated chimera shows an initial lag phase.
(A) Representative traces are shown for the DHFRMp activities of free (29 nM) and GroE-encapsulated (40 nM) chimera upon addition of 250 μM dihydrofolic acid and 300 μM NADPH. The reactions were monitored by measuring the decrease in absorbance at 340 nm as a function of time. An initial lag phase is observed in the case of the encapsulated chimera but not the free one. (B) The lag and linear phases in the data for the encapsulated chimera were fitted to Equation 1. (C) Good fits were obtained as indicated by plots of the residuals with random deviations about zero. See Materials and methods for additional details.
-
Figure 3—source data 1
Representative reaction progress curves of free and caged chimera in the presence of 250 μM DHF.
- https://cdn.elifesciences.org/articles/56511/elife-56511-fig3-data1-v3.xlsx
Figure 4 with 2 supplements
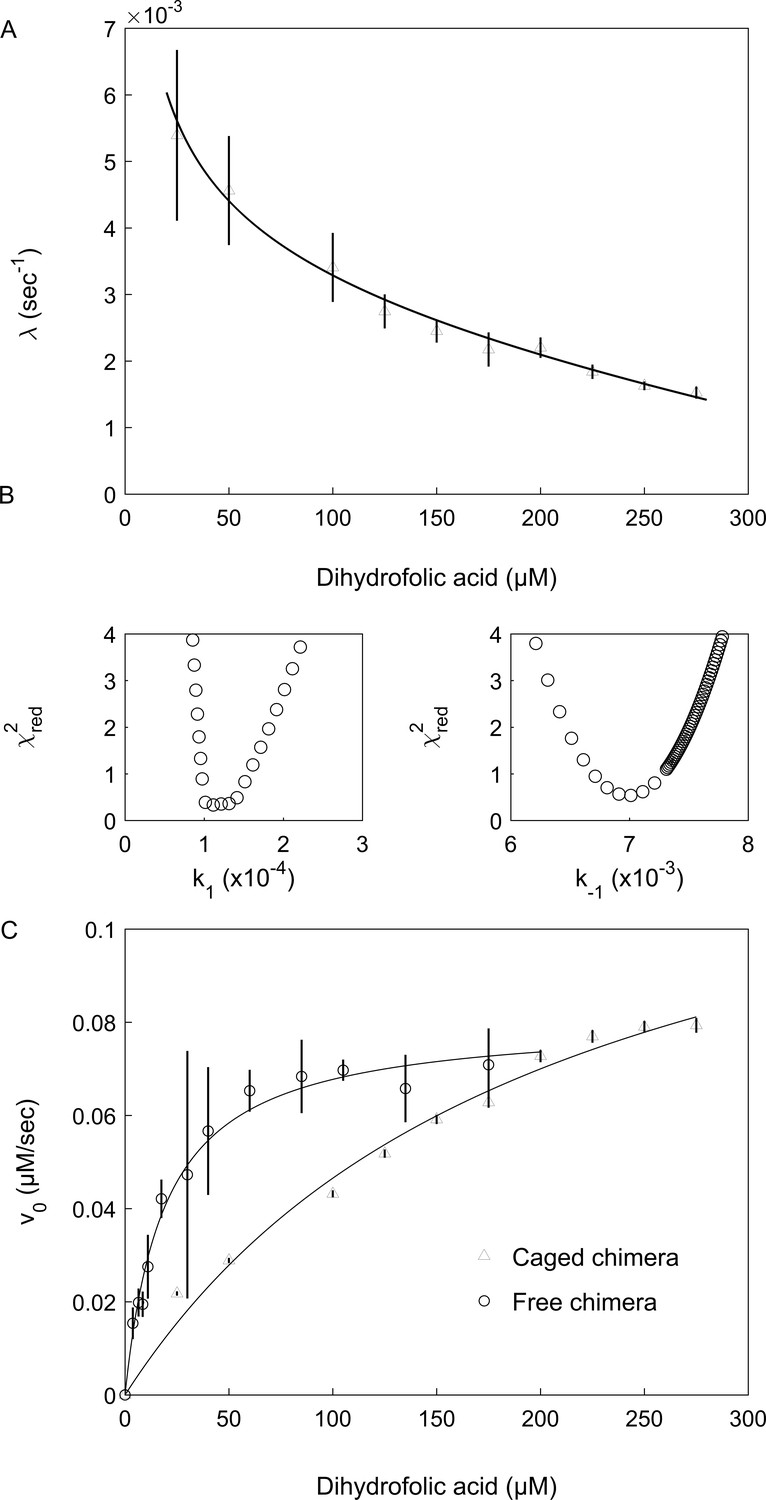
Encapsulation in the GroE cavity affects folding and enzyme activity of the DHFRMp part of the chimera.
(A) Plot of the observed folding rate constant, λ, of the DHFRMp part of the chimera inside the cavity as a function of the DHF concentration. The data were fitted to Equation 2, thereby yielding estimates of the folding and unfolding rate constants. These experiments were carried out in duplicate. (B) Reduced χ2 surfaces for the folding and unfolding rate constants k1 and k-1, respectively. The relatively steep chi-squared surfaces suggest that the extracted parameters are well defined with relatively narrow confidence intervals. (C) Plot of the initial enzyme velocity of the DHFRMp part of the chimera inside the cavity and in bulk solution, as a function of the DHF concentration. The data were fitted to the Michaelis-Menten equation. In the case of the encapsulated chimera, the initial enzyme velocities were obtained by fitting the data of decrease in absorption at 340 nm as a function of time to Equation 1. Error bars in both panels represent standard errors.
-
Figure 4—source data 1
Reaction progress curves of caged chimera in the presence of different concentrations of DHF.
- https://cdn.elifesciences.org/articles/56511/elife-56511-fig4-data1-v3.xlsx
-
Figure 4—source data 2
Reaction progress curves of free chimera in the presence of different concentrations of DHF.
- https://cdn.elifesciences.org/articles/56511/elife-56511-fig4-data2-v3.xlsx
Figure 4—figure supplement 1
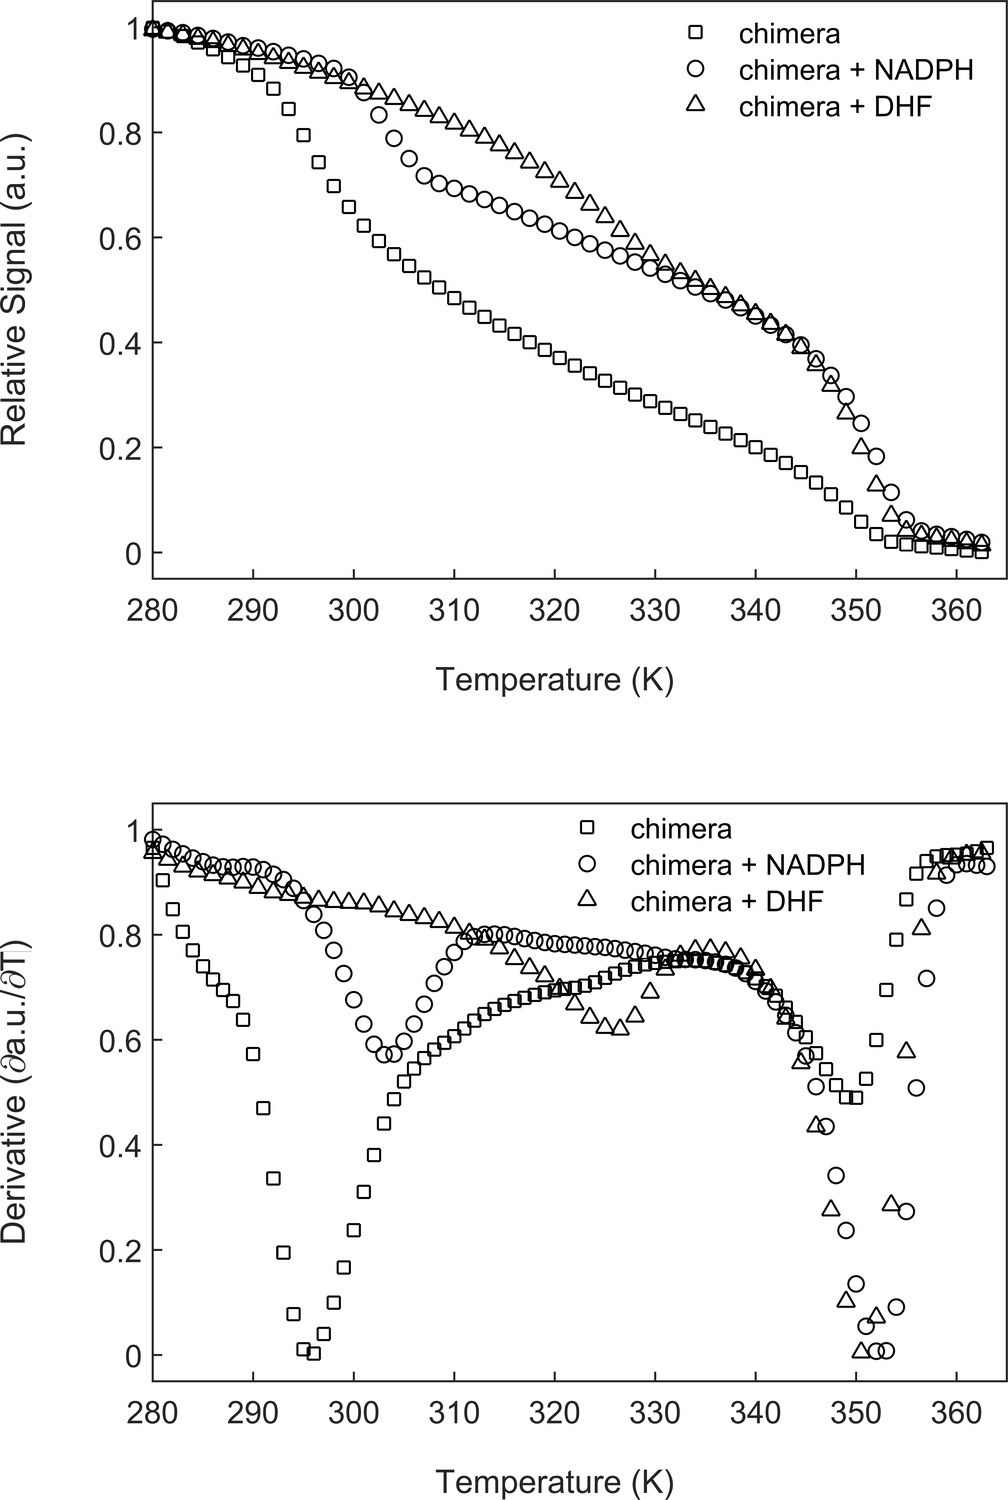
The melting temperature of DHFRMp increases in the presence of its substrates.
(A) The chimera (5 µM) alone or in the presence of 500 µM NADPH or DHF was subjected to temperature denaturation using a Real-Time PCR machine as described under Materials and methods. Each trace represents the average of at least six experiments. (B) Plots of the first derivatives of the denaturation curves as a function of temperature. Melting points were determined from these plots by using the StepOne Software v2.3. Under the conditions here, the melting temperature of the DHFRMp part of the chimera increases, in the presence of NADPH and DHF, by about 8°C and 31°C, respectively.
-
Figure 4—figure supplement 1—source data 1
Temperature melts of the chimera in the absence and presence of DHF or NADPH.
- https://cdn.elifesciences.org/articles/56511/elife-56511-fig4-figsupp1-data1-v3.xlsx
Figure 4—figure supplement 2

Stability measurements of the DHFRMp part of the chimera in bulk solution.
(A) The stability of the DHFRMp part of the chimera was determined as a function of GuHCl concentration at different fixed concentrations of NADPH. Shown are representative data for denaturation in the presence of 0.05 and 2.9 µM NADPH. The data were fitted using Equation 3. (B) Plot of the free energies of unfolding, in the absence of GuHCl, as a function of the concentration of NADPH. The data were fitted using Equation 4. The m-values are essentially independent of the concentration of NADPH and were found to have an average value of 1.4 (±0.1) kcal mol−1 M−1. Error bars represent standard errors.
-
Figure 4—figure supplement 2—source data 1
Free energies of folding of the DHFR part of the free chimera in the presence of different concentrations of NADPH.
- https://cdn.elifesciences.org/articles/56511/elife-56511-fig4-figsupp2-data1-v3.xlsx
Figure 5 with 1 supplement
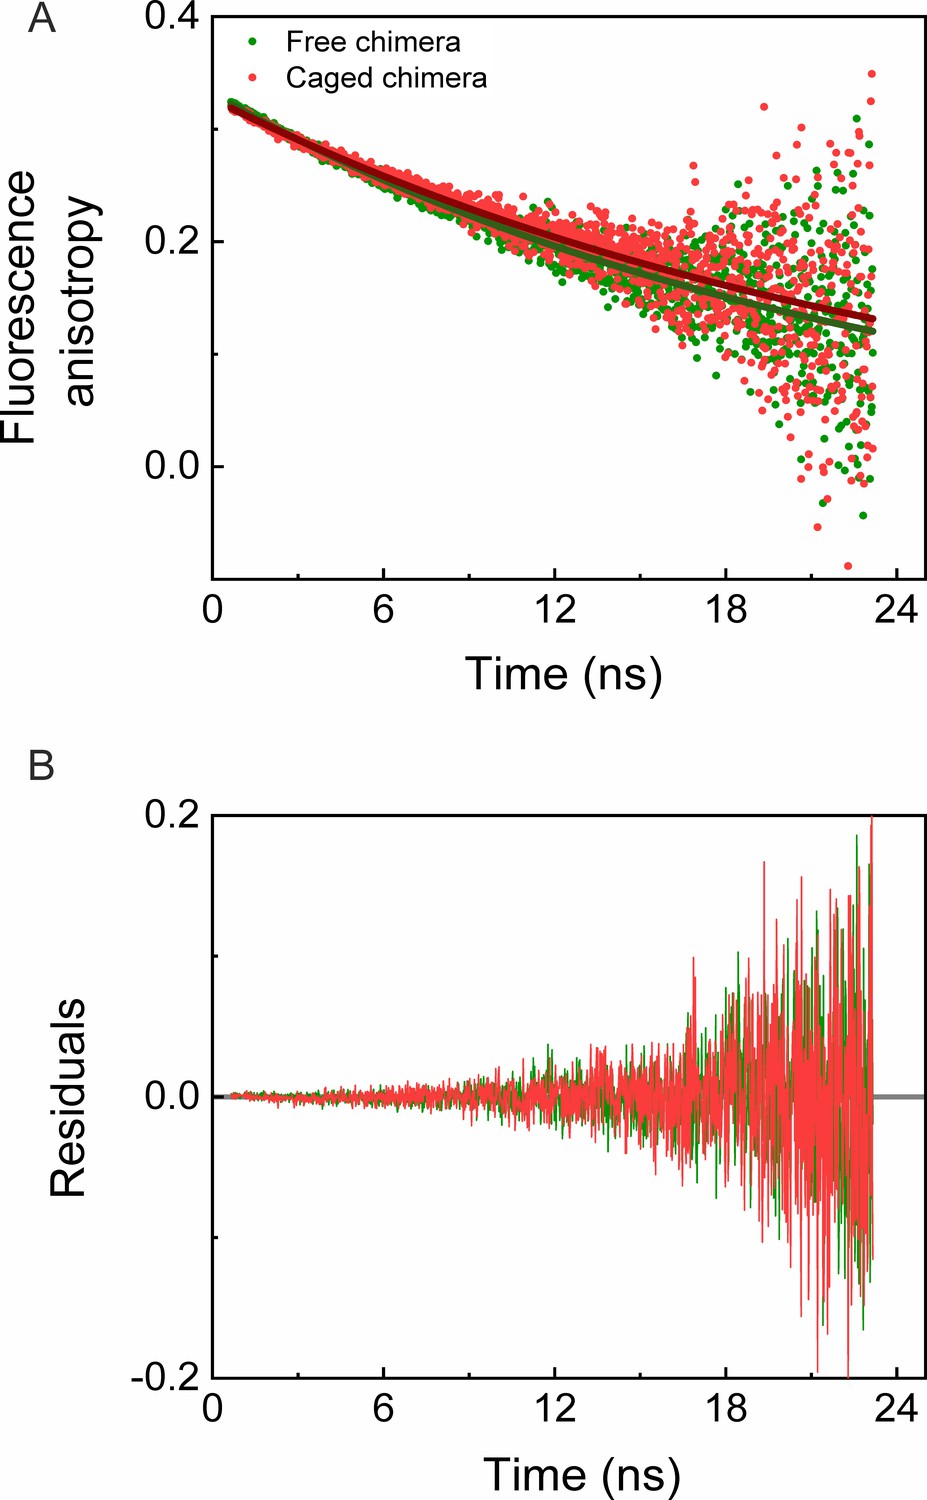
Time-resolved fluorescence anisotropy measurements of free and GroEL-caged chimera.
(A) Fluorescence anisotropy decay curves of free (green) and caged (red) chimeras were measured as described in the Materials and methods. Fits of the decay curves for free and caged chimera to a single exponential (green and red solid lines, respectively) yielded rotational times of 22.85 (±0.30) ns and 25.40 (±0.45) ns, respectively. The results indicate no restriction on the mobility of the chimera inside the GroEL football complex. Each experiment was carried out in duplicate. (B) Plots of the residuals for the fits in panel A.
-
Figure 5—source data 1
Time-resolved fluorescence anisotropy measurements of free and caged eGFP.
- https://cdn.elifesciences.org/articles/56511/elife-56511-fig5-data1-v3.xlsx
Figure 5—figure supplement 1

Time-resolved fluorescence anisotropy measurements of free and caged eGFP.
(A) Fluorescence anisotropy decay curves of free (green) and GroEL-caged (red) eGFP were measured as described in the Materials and methods. Fits of the fluorescence anisotropy decay curves for free and caged eGFP to a single exponential (black and blue solid lines, respectively) yielded rotational times of 14.38 (±0.20) ns and 15.90 (±0.25) ns, respectively, in agreement with previous work (Striker et al., 1999). These results indicate no restriction mobility of eGFP inside the GroEL football complex. Each experiment was carried out in duplicate. (B) Plots of the residuals for both curves.
-
Figure 5—figure supplement 1—source data 1
Time-resolved fluorescence anisotropy measurements of free and caged chimera.
- https://cdn.elifesciences.org/articles/56511/elife-56511-fig5-figsupp1-data1-v3.xlsx
Tables
Key resources table
| Reagent type (species) or resource | Designation | Source or reference | Identifiers | Additional information |
|---|---|---|---|---|
| Recombinant DNA reagent | Pet21d plasmid for expressing DHFRMp | Gift from Prof. S. Fleishman | ||
| Recombinant DNA reagent | Pet21a plasmid for expressing eGFP | PMID:29066625 | ||
| Strain, strain background (Escherichia coli) | E. coli Rosetta cells | Novagen | ||
| Strain, strain background (Escherichia coli) | E. coli BL21 cells | PMID:3537305 | ||
| Sequence-based reagent | TEV site insertion -forward | This work | PCR primer | 5’-ACTCGAGCACCACCACCACCACCACTGA-3’ |
| Sequence-based reagent | TEV site insertion -reverse | This work | PCR primer | 5’-GCTGTATAAGGGCAACCTGTATTTTCAGGGCACTCGAGCACCACC-3’ |
| Sequence-based reagent | DHFRMp cloning -forward | This work | RF cloning primer | 5’-CCTGTATTTTCAGGGCATGATCGTAAGCATGATTGCCGCACTGGCG-3’ |
| Sequence-based reagent | DHFRMp cloning -reverse | This work | RF cloning primer | 5’-GGTGGTGGTGGTGCTCGAGTTCACTCGAGTTTGACTCTTTCAAGTAGAC-3’ |
| Chemical compound, drug | SYPRO Orange protein gel stain | Sigma | Cat#S5692 | Used at a dilution of 1:5000 |
| Software, algorithm | MATLAB 2015b | MathWorks | ||
| Other | HisTrap 5 ml columns | GE Healthcare | Cat#17-5248-02 | |
| Other | PD 10 desalting columns | GE Healthcare | Cat#17-0851-01 | |
| Other | Superdex 75 10/300 column | GE Healthcare | Cat#29-1487-21 | |
| Other | Superose 6 10/300 column | GE Healthcare | Cat#17-5172-01 | |
| Other | Q Sepharose column | GE Healthcare | Cat#17-1014-01 |
Additional files
Download links
A two-part list of links to download the article, or parts of the article, in various formats.
Downloads (link to download the article as PDF)
Open citations (links to open the citations from this article in various online reference manager services)
Cite this article (links to download the citations from this article in formats compatible with various reference manager tools)
Measuring protein stability in the GroEL chaperonin cage reveals massive destabilization
eLife 9:e56511.
https://doi.org/10.7554/eLife.56511


