Reconstitution reveals two paths of force transmission through the kinetochore
- Department of Biochemistry, University of Washington, United States
- Department of Structural Biology, Genentech Inc, United States
- Department of Physiology and Biophysics, University of Washington, United States
Figures
Figure 1 with 1 supplement

Reconstitution of a kinetochore from individually purified parts and an optical trap-based assay to test for self-assembly of functional chains of kinetochore subcomplexes.
(A) Schematic of the protein complexes of the budding yeast kinetochore. (B) Coomassie-stained SDS-PAGE gel of heterologously expressed budding yeast kinetochore proteins. The asterisk indicates a contaminating E. coli protein or degradation product. (C) Schematic of the optical trap assay used to test for assembly and microtubule attachment prior to quantification of load-bearing ability. (D) Representative force vs. time traces for ruptures in the force-ramp assay.
-
Figure 1—source data 1
Plasmids used in this study.
- https://cdn.elifesciences.org/articles/56582/elife-56582-fig1-data1-v2.docx
Figure 1—figure supplement 1
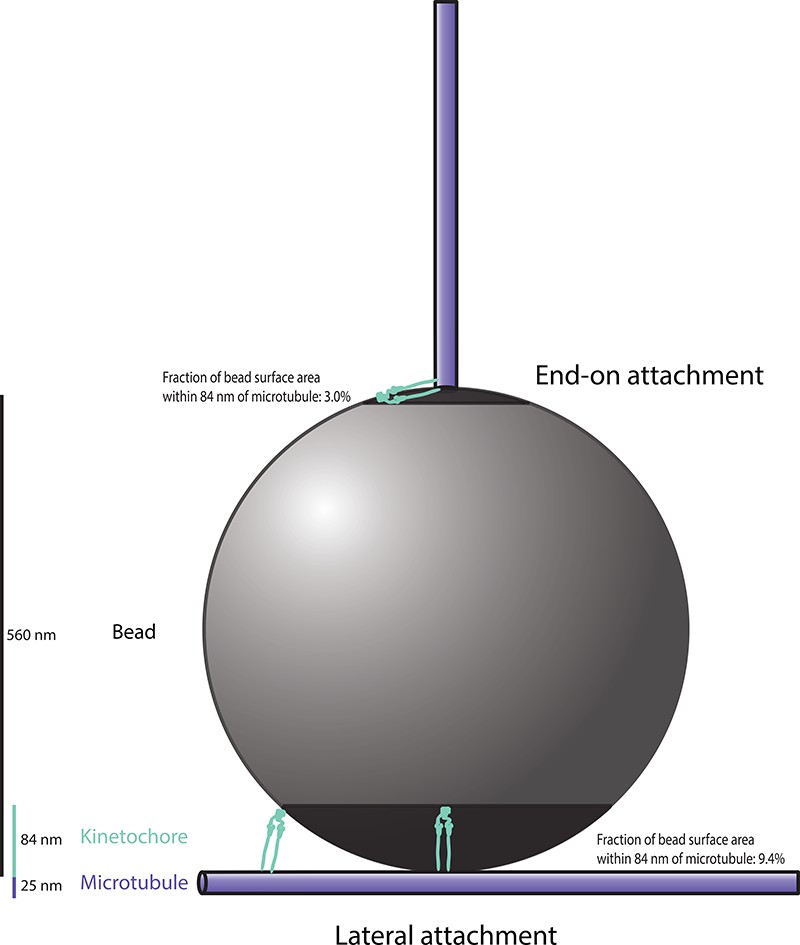
Schematic diagram, drawn approximately to scale, showing two possible bead-microtubule configurations.
Our rupture force assay quantifies the strength of end-on attachments. In this configuration, reconstituted kinetochores on only ~ 3.0% of the bead surface are capable of simultaneously binding to the microtubule. Assuming that the ~ 2900 protein complexes on each bead are evenly distributed,~86 would be capable of binding the microtubule surface. Lateral attachments likely predominate in our self-assembly and microtubule-binding assay. In this configuration, the bead rests against the side of a filament whose tip extends well past the point of contact, maximizing the amount of bead surface in close proximity to the microtubule. Thus, it provides an upper limit for the fraction of bead surface within 84 nm of the microtubule. Reconstituted kinetochores on ~ 9.4% of the bead surface,~270 protein complexes, would be capable of simultaneously binding to the microtubule in this lateral configuration.
Figure 2
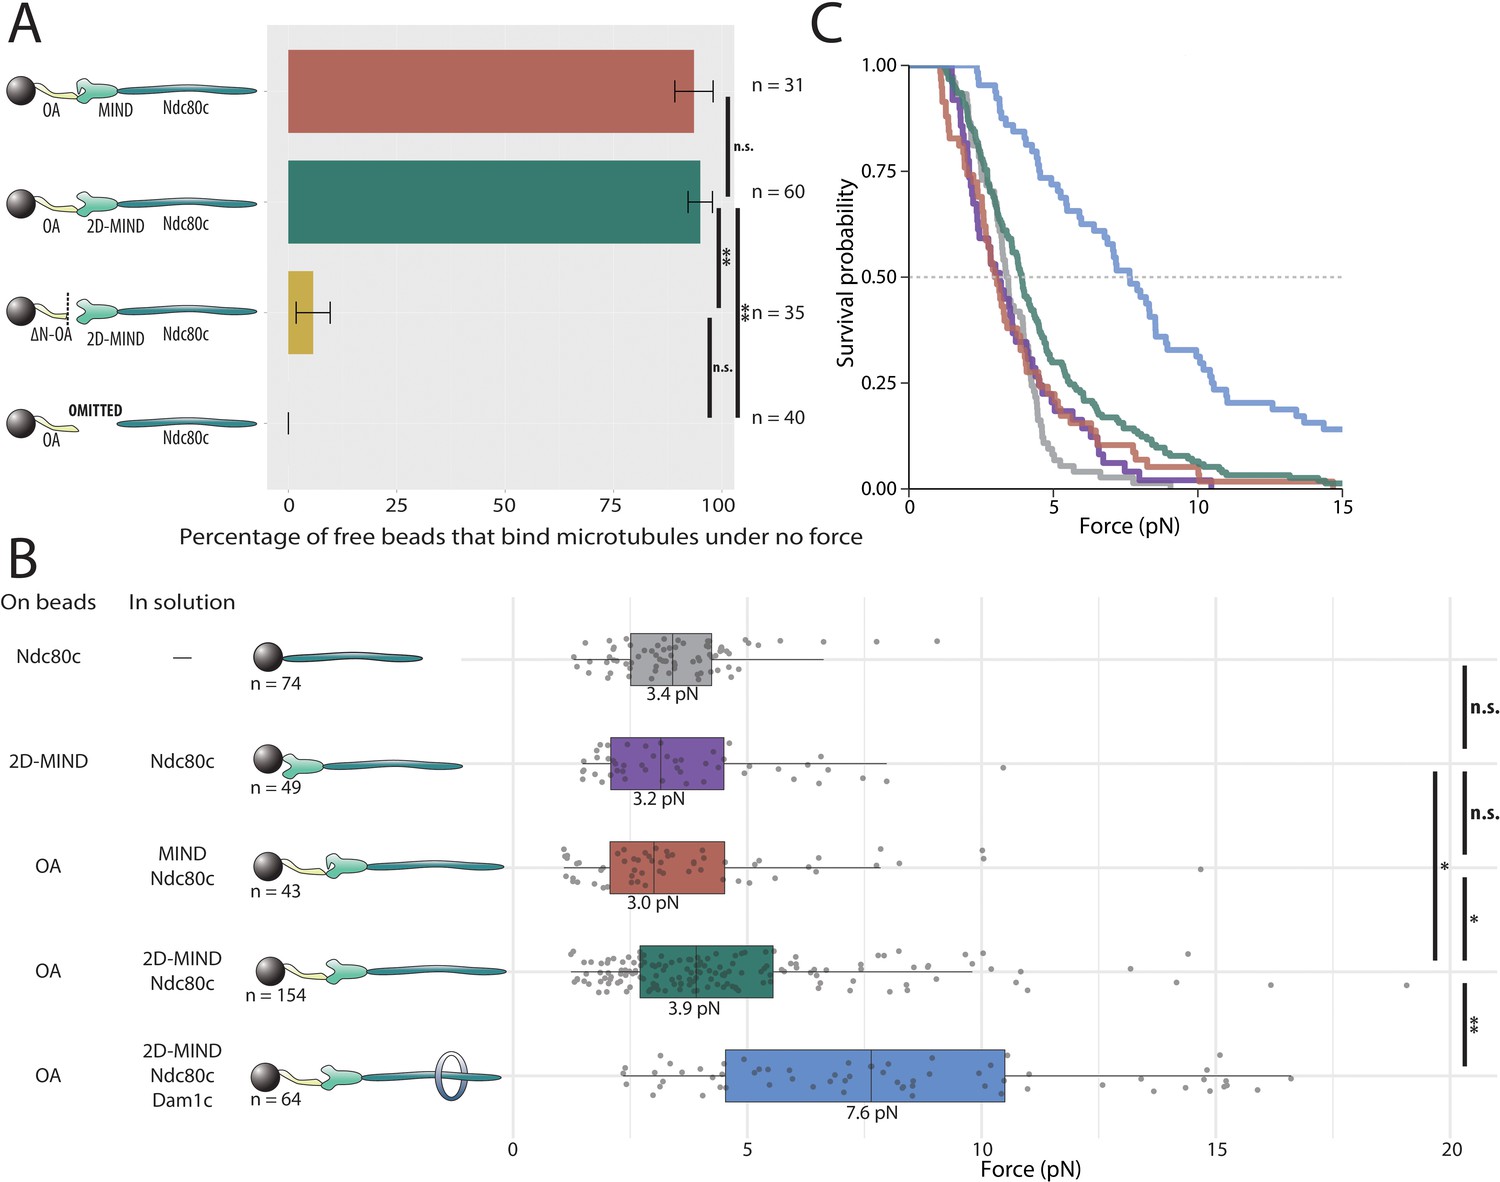
OA-based chains assemble spontaneously and form load-bearing attachments to dynamic microtubules.
(A) Percentages of free beads that bound microtubules under no external force. Error bars indicate the standard error of the sample proportion. Barnard’s test was used to compare contingency tables. n.s. indicates p>0.05. * indicates p<0.05. ** indicates p<0.01. (B) Boxplot of rupture forces observed with reconstituted kinetochores of increasing length. Each shaded circle is an individual rupture event. Boxes extend from the lower quartile to the upper quartile. Whiskers extend to 1.5 times the interquartile range beyond each quartile. A Kolmogorov-Smirnov test was used to compare probability distributions and calculate p-values. n.s. indicates p>0.05. * indicates p<0.05. ** indicates p<0.01. (C) Survival curves for Ndc80c linkages (grey), MIND/Ndc80c linkages (purple), OA/MIND/Ndc80c linkages (pink), OA/2D-MIND/Ndc80c linkages (turquoise), and OA/2D-MIND/Ndc80c/Dam1c linkages (blue). The dashed horizontal line indicates 50% survival (median rupture force). Raw data of all rupture events are included in Figure 2—source data 1. Exact p-values are included in Figure 2—source data 2.
-
Figure 2—source data 1
Raw rupture force data for OA-based linkers.
- https://cdn.elifesciences.org/articles/56582/elife-56582-fig2-data1-v2.xlsx
-
Figure 2—source data 2
Exact p-values for all comparisons of rupture force distributions.
- https://cdn.elifesciences.org/articles/56582/elife-56582-fig2-data2-v2.xlsx
Figure 3
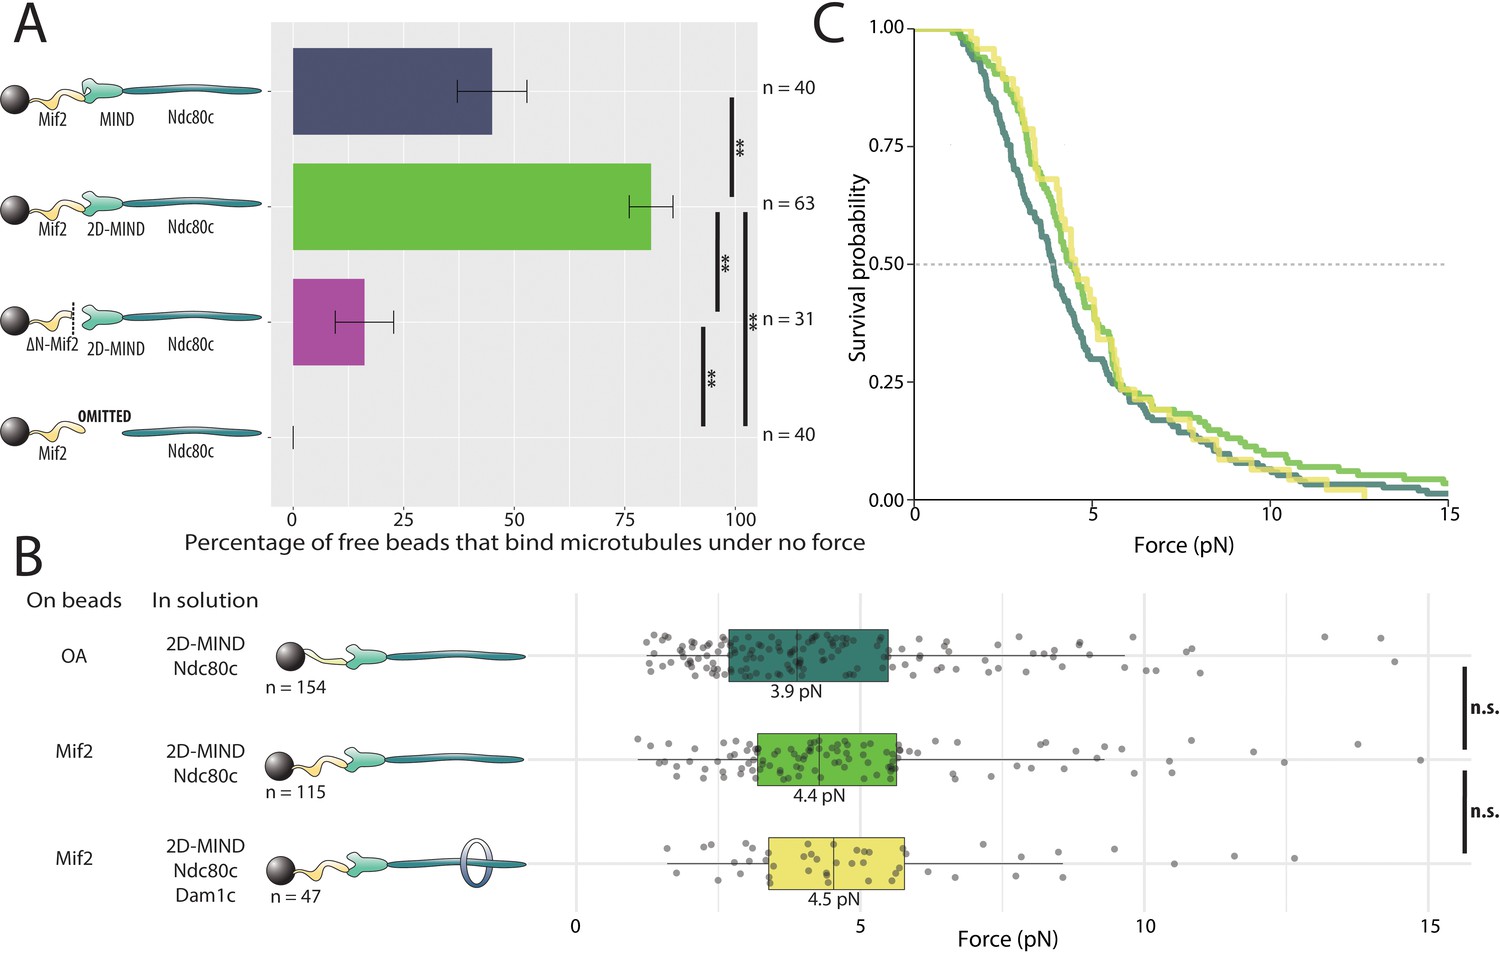
Mif2-based chains also assemble spontaneously and form load-bearing attachments to dynamic microtubule tips.
(A) Percentages of free beads that bound microtubules under no force. Error bars indicate the standard error of the sample proportion. Barnard’s test was used to compare contingency tables. n.s. indicates p > 0.05. * indicates p < 0.05. ** indicates p < 0.01. “2D” indicates that two phosphomimetic mutations (S240D, S250D) have been made to the MIND component Dsn1. (B) Boxplot of rupture forces observed with reconstituted kinetochores. Each shaded circle is an individual rupture event. Boxes extend from the lower quartile to the upper quartile. Whiskers extend to 1.5 times the interquartile range beyond each quartile. A Kolmogorov-Smirnov test was used to compare probability distributions and calculate p-values. n.s. indicates p > 0.05. * indicates p < 0.05. ** indicates p < 0.01. (C) Survival curves for OA/2D-MIND/Ndc80c linkages (turquoise) (repeated from Figure 2 for comparison), Mif2/2D-MIND/Ndc80c linkages (green), and Mif2/2D-MIND/Ndc80c/Dam1c linkages (yellow). The dashed horizontal line indicates 50% survival (median rupture force). Raw data of all rupture events are included in Figure 3—source data 1".
-
Figure 3—source data 1
Raw rupture force data for Mif2-based linkers.
- https://cdn.elifesciences.org/articles/56582/elife-56582-fig3-data1-v2.xlsx
Figure 4 with 1 supplement

OA strengthens the Mif2/2D-MIND interface.
(A) Boxplot of rupture forces observed with reconstituted kinetochores. Each shaded circle is an individual rupture event. Boxes extend from the lower quartile to the upper quartile. Whiskers extend to 1.5 times the interquartile range beyond each quartile. A Kolmogorov-Smirnov test was used to compare probability distributions and calculate p-values. n.s. indicates p>0.05. * indicates p<0.05. ** indicates p<0.01. (B) Survival curves for Mif2/OA/2D-MIND/Ndc80c linkages (orange), Mif2/OA/2D-MIND/Ndc80c/Dam1c linkages (teal), and Mif2/ΔN-OA/2D-MIND/Ndc80c (maroon). The dashed horizontal line indicates 50% survival (median rupture force). Raw data of all rupture events are included in Figure 4—source data 1.
-
Figure 4—source data 1
Raw rupture force data for linkers containing both OA and Mif2.
- https://cdn.elifesciences.org/articles/56582/elife-56582-fig4-data1-v2.xlsx
Figure 4—figure supplement 1
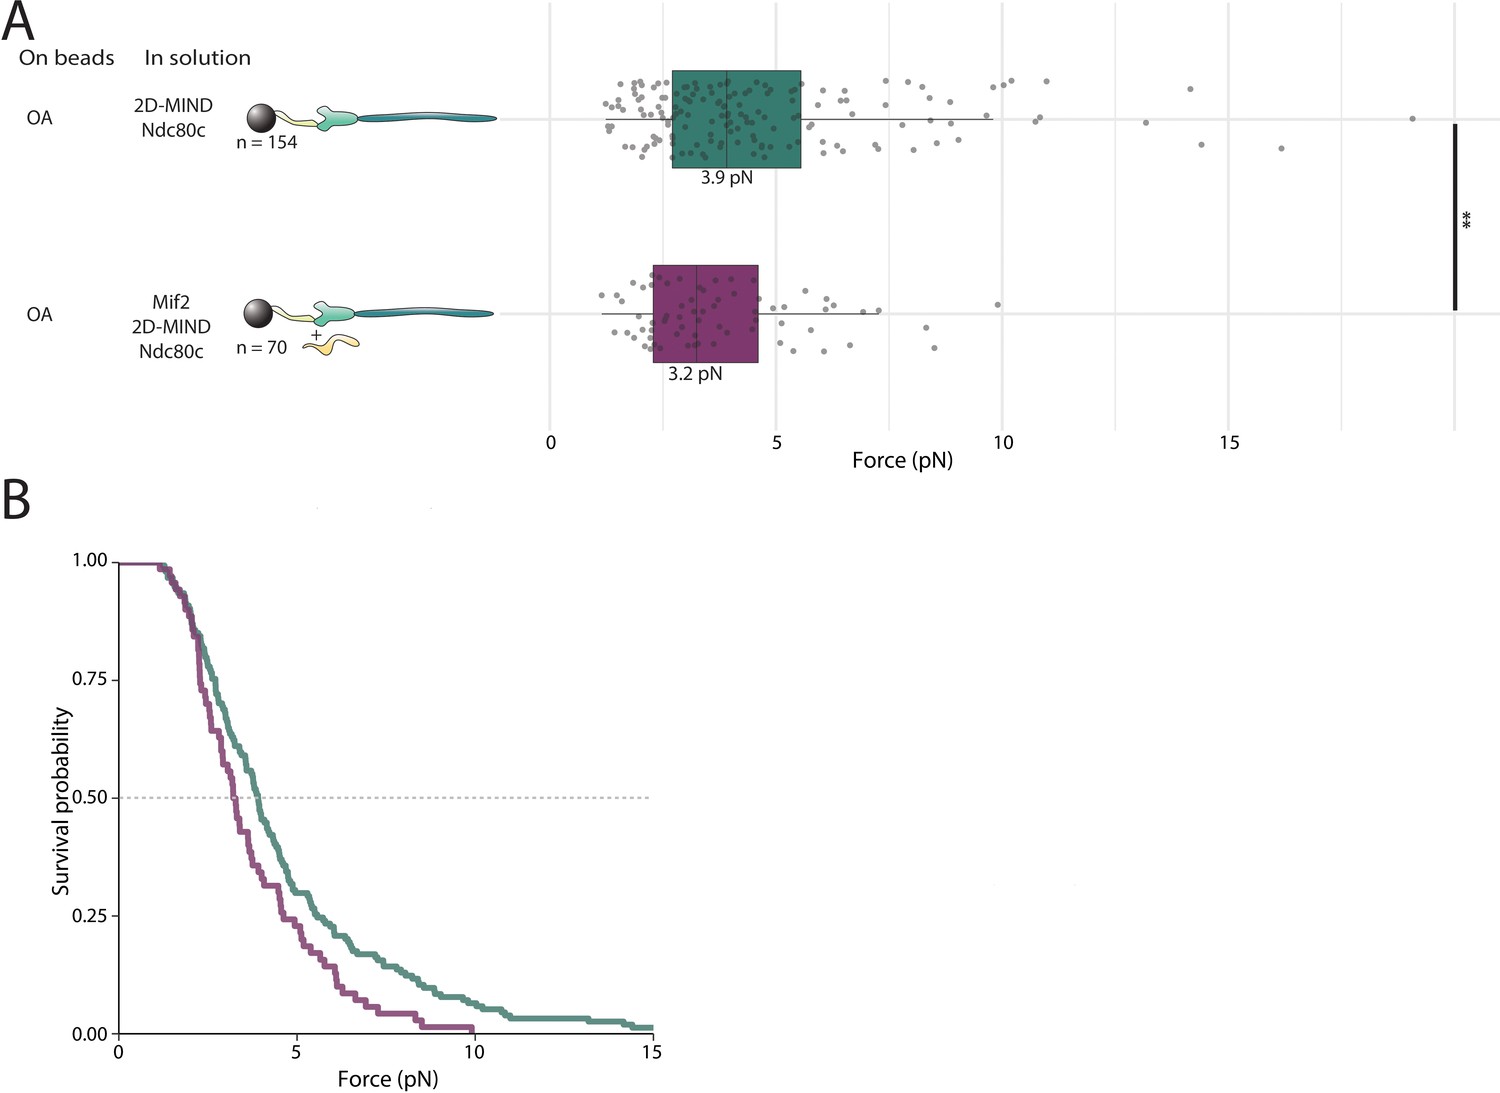
Mif2 does not strengthen the OA/2D-MIND interface.
(A) Boxplot of rupture forces observed with reconstituted kinetochores. Each shaded circle is an individual rupture event. Boxes extend from the lower quartile to the upper quartile. Whiskers extend to 1.5 times the interquartile range beyond each quartile. A Kolmogorov-Smirnov test was used to compare probability distributions and calculate p-values. * indicates p<0.05. (B) Survival curves for OA/2D-MIND/Ndc80c linkages (turquoise) and OA/Mif2/2D-MIND/Ndc80c linkages (purple). The dashed horizontal line indicates 50% survival (median rupture force). Raw data of all rupture events are included in Figure 4—source data 1.
Figure 5 with 2 supplements
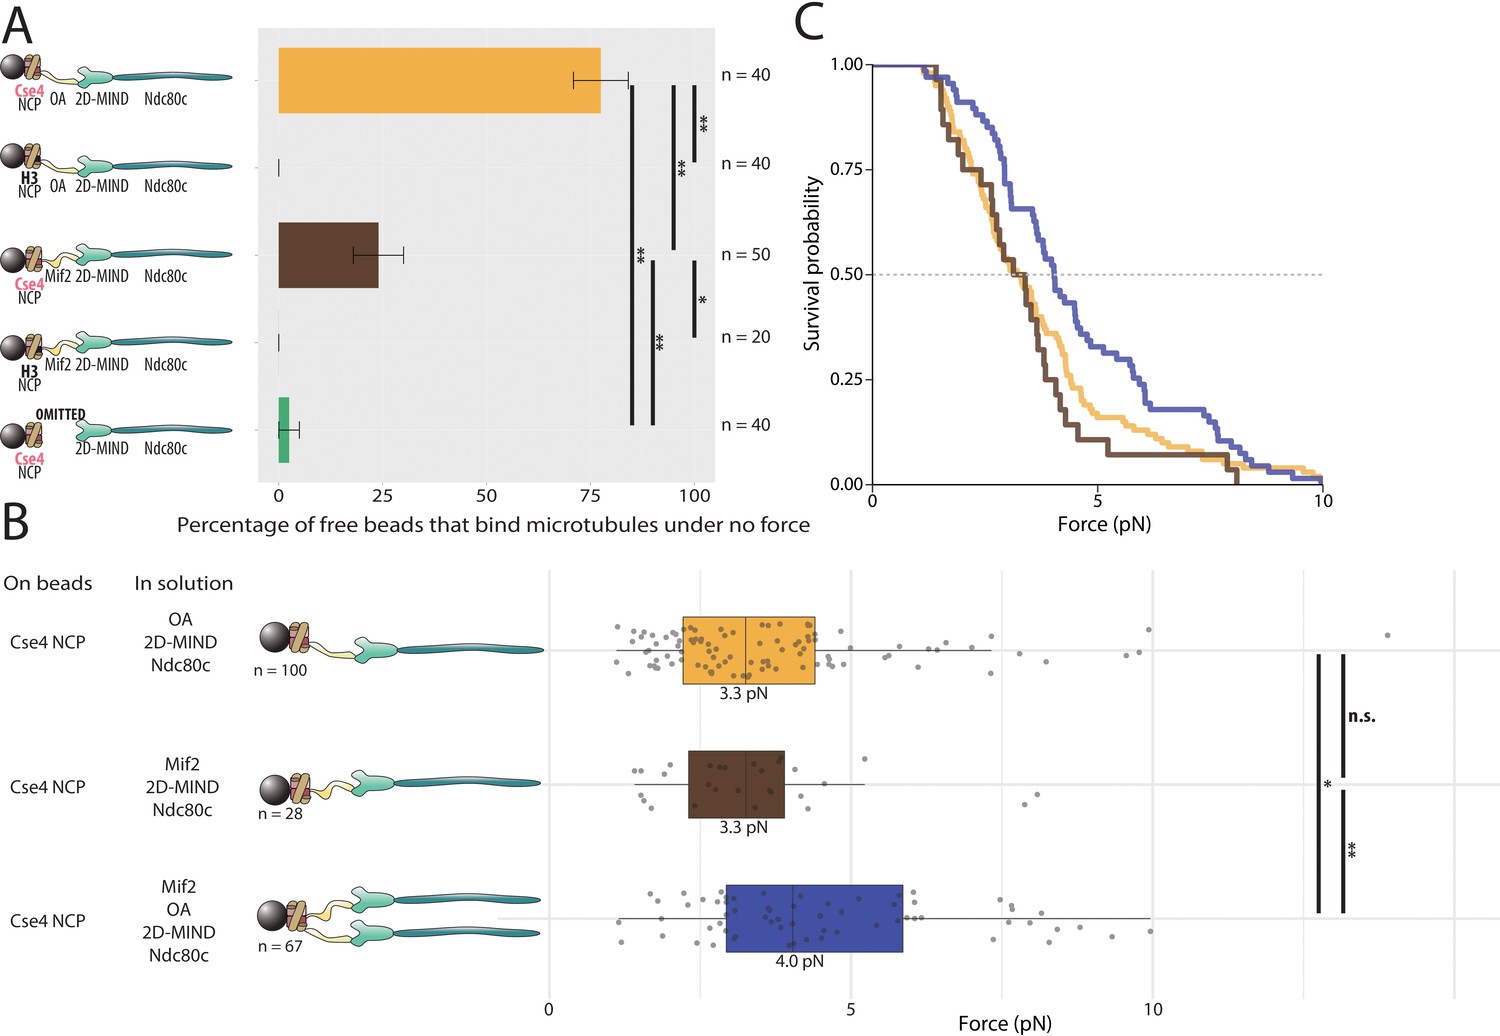
Assemblies based on centromeric nucleosomes form load-bearing microtubule attachments through OA or Mif2 or both.
(A) Percentages of free beads that bound microtubules under no force. Error bars indicate the standard error of the sample proportion. Barnard’s test was used to compare contingency tables. n.s. indicates p>0.05. * indicates p<0.05. ** indicates p<0.01. (B) Boxplot of rupture forces observed with reconstituted kinetochores. Each shaded circle is an individual rupture event. Boxes extend from the lower quartile to the upper quartile. Whiskers extend to 1.5 times the interquartile range beyond each quartile. A Kolmogorov-Smirnov test was used to compare probability distributions and calculate p-values. n.s. indicates p>0.05. * indicates p<0.05. ** indicates p<0.01. (C) Survival curves for Cse4 NCP/OA/2D-MIND/Ndc80c linkages (yellow), Cse4 NCP/Mif2/2D-MIND/Ndc80c linkages (brown), and Cse4 NCP/OA/Mif2/2D-MIND/Ndc80c linkages (purple). Raw data of all rupture events are included in Figure 5—source data 1.
-
Figure 5—source data 1
Raw rupture force data for nucleosome core particle-based linkers.
- https://cdn.elifesciences.org/articles/56582/elife-56582-fig5-data1-v2.xlsx
Figure 5—figure supplement 1
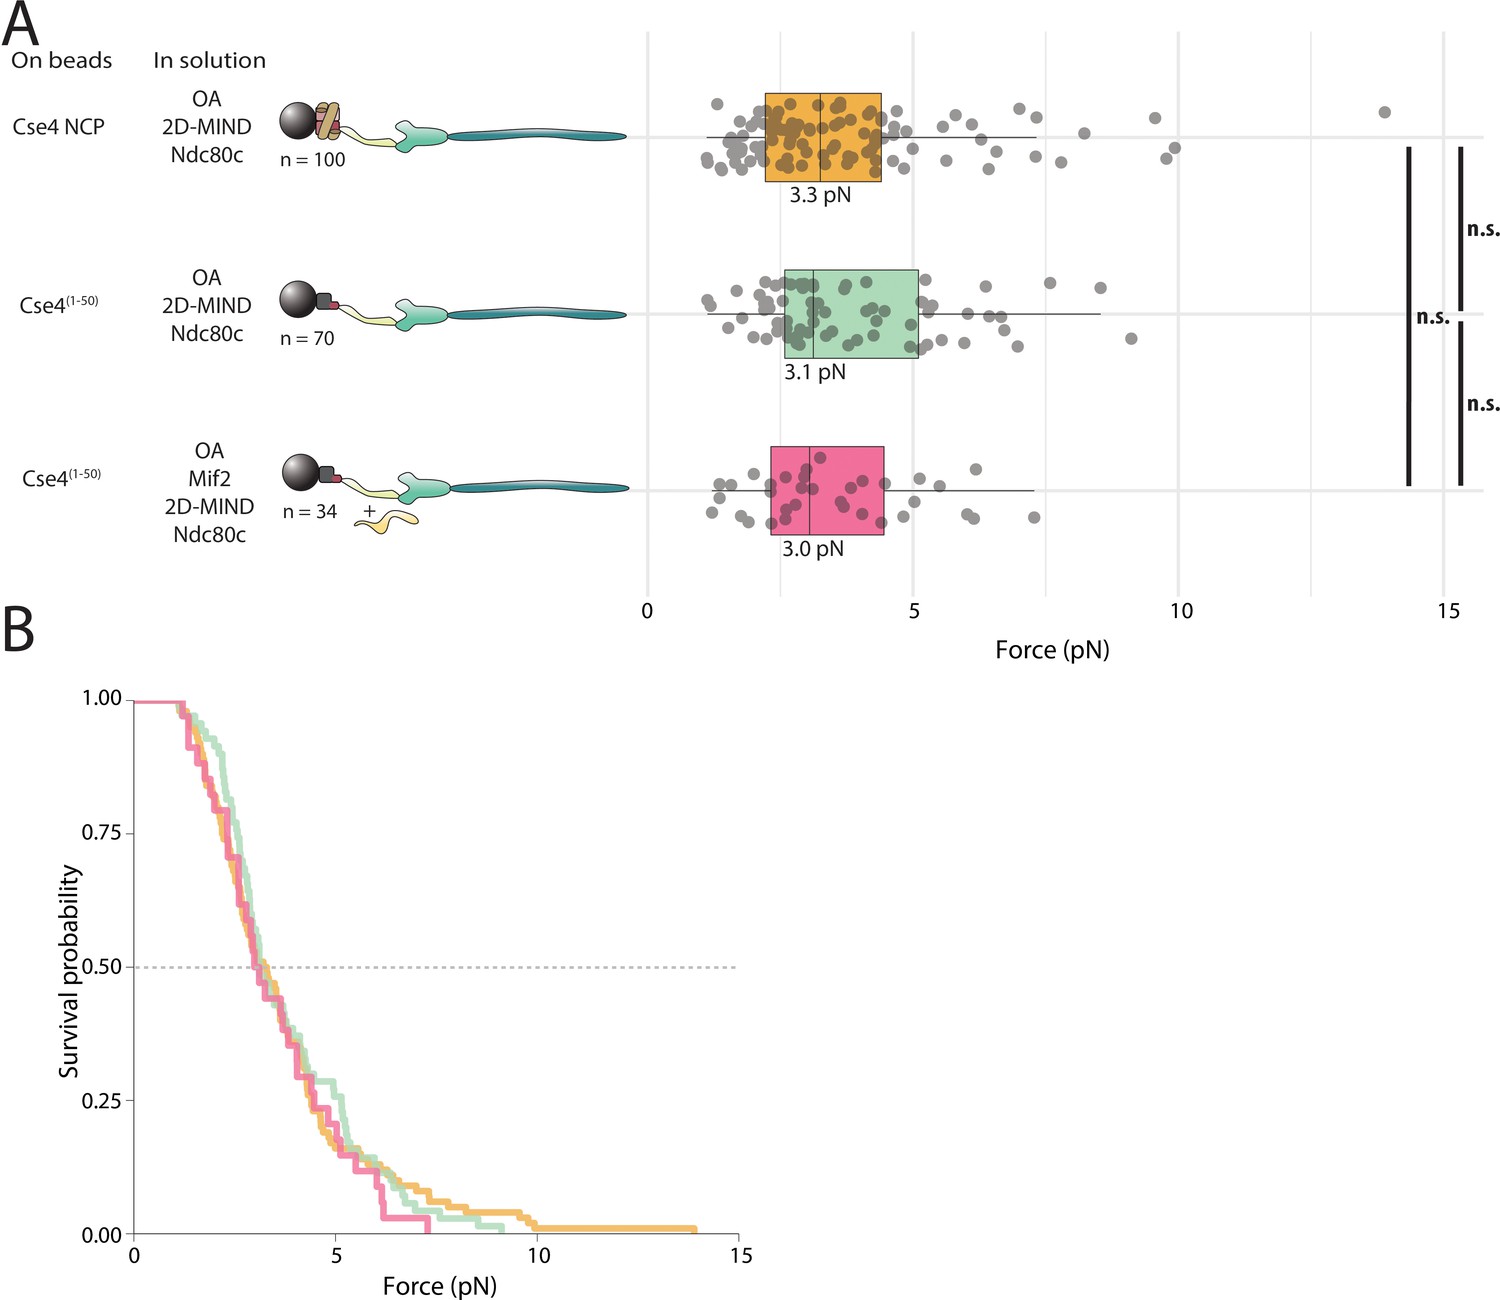
Load-bearing attachments between OA and Cse4-NCPs occur through the N-terminus of Cse4.
(A) Boxplot of rupture forces observed with reconstituted kinetochores. Each shaded circle is an individual rupture event. Boxes extend from the lower quartile to the upper quartile. Whiskers extend to 1.5 times the interquartile range beyond each quartile. A Kolmogorov-Smirnov test was used to compare probability distributions and calculate p-values. * indicates p < 0.05. (B) Survival curves for Cse4-NCP/ OA/2D-MIND/Ndc80c linkages (yellow), Cse4(1-50)/OA/2D-MIND/Ndc80c linkages (green), and Cse4(1-50)/ Mif2/ OA/ 2D-MIND/Ndc80c linkages (pink). The dashed horizontal line indicates 50% survival (median rupture force). Raw data of all rupture events are included in Figure 5—source data 1.
Figure 5—figure supplement 2
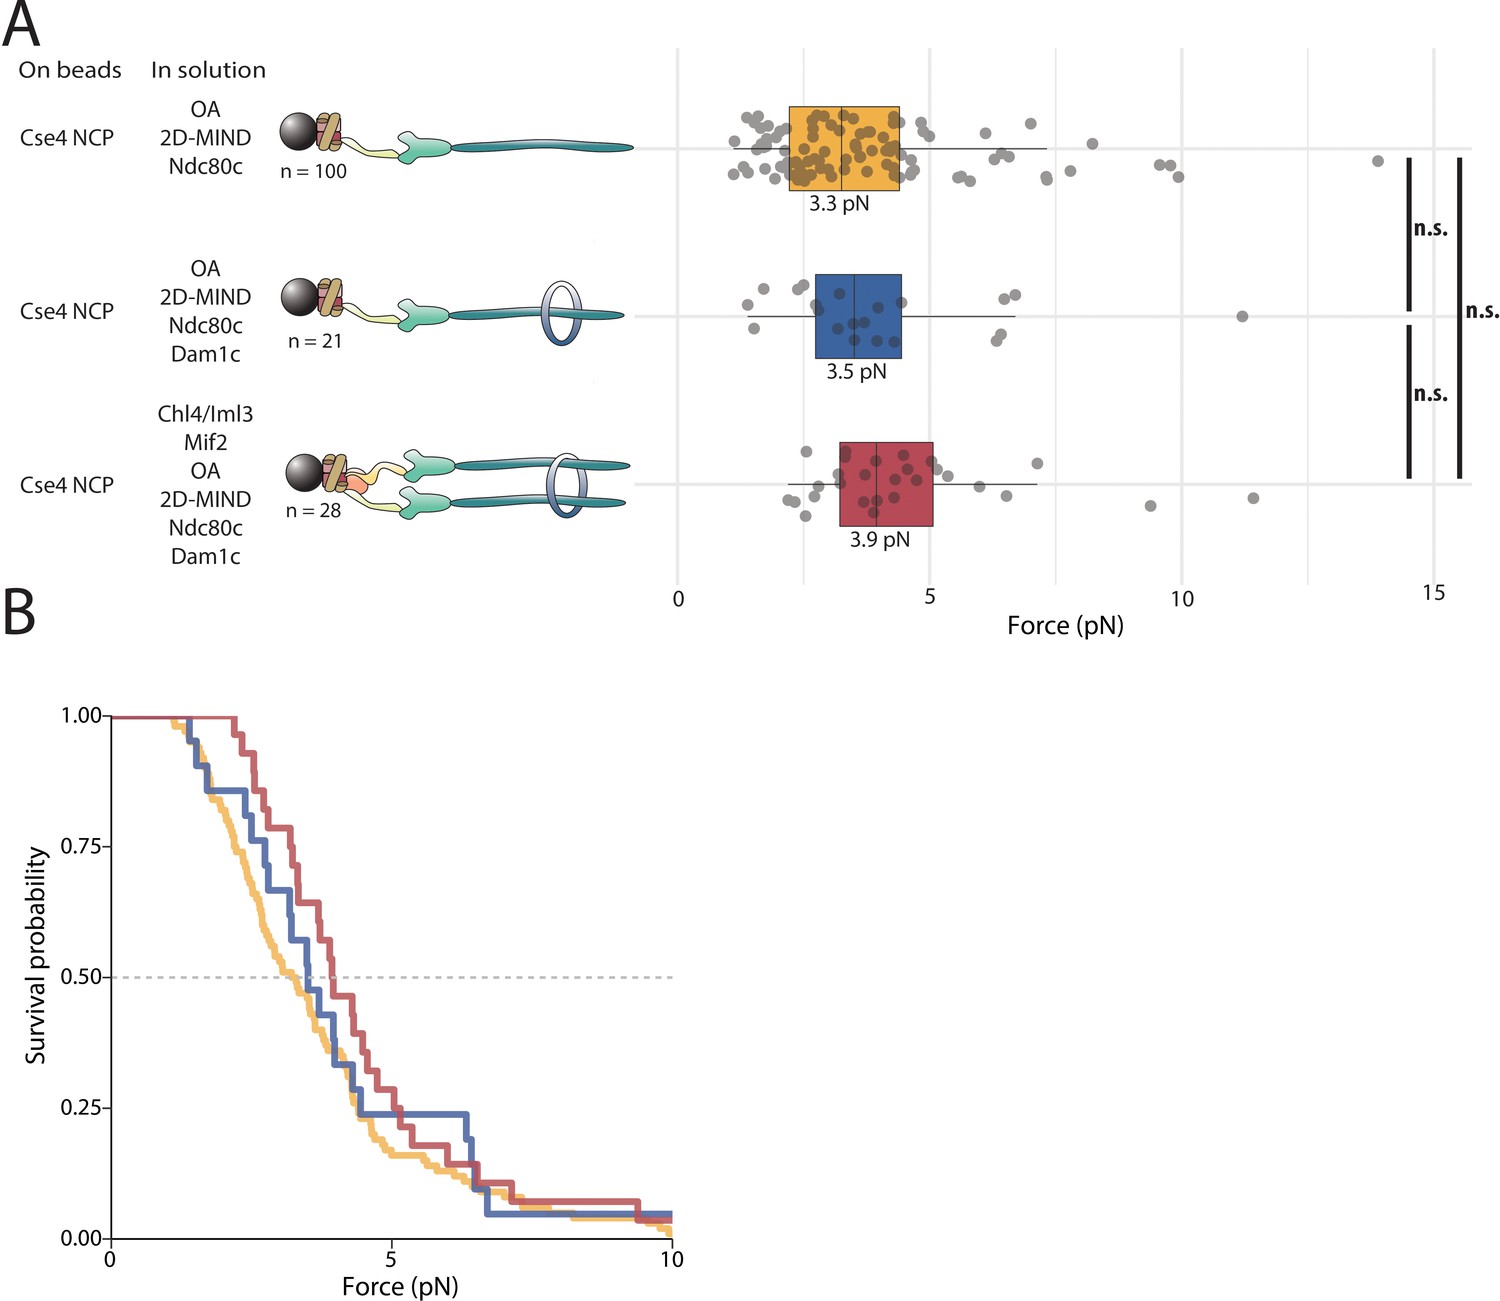
Neither Dam1c nor CI increases the rupture force of NCP-containing linkers.
(A) Boxplot of rupture forces observed with reconstituted kinetochores. Each shaded circle is an individual rupture event. Boxes extend from the lower quartile to the upper quartile. Whiskers extend to 1.5 times the interquartile range beyond each quartile. A Kolmogorov-Smirnov test was used to compare probability distributions and calculate p-values. * indicates p < 0.05. (B) Survival curves for Cse4-NCP/ OA/2D-MIND/Ndc80c linkages (yellow), Cse4-NCP/OA/2D-MIND/Ndc80c/Dam1c linkages (blue), and Cse4-NCP/CI/ Mif2/ OA/ 2D-MIND/Ndc80c/Dam1c linkages (pink). The dashed horizontal line indicates 50% survival (median rupture force). Raw data of all rupture events are included in Figure 5—source data 1.
Tables
Table 1
Proteins of the kinetochore.
| S. cerevisiae | H. sapiens |
|---|---|
| Dam1c/DASH | Higher eukaryotic analog is the Ska complex |
| Ask1 (Associated with spindles and kinetochores) | |
| Dad1 (Duo1 and Dam1 interacting) | |
| Dad2 (Duo1 and Dam1 interacting) | |
| Dad3 (Duo1 and Dam1 interacting) | |
| Dad4 (Duo1 and Dam1 interacting) | |
| Dam1 (Duo1 and Mps1 interacting) | |
| Duo1 (Death upon overproduction) | |
| Hsk3 (Helper of Ask1) | |
| Spc19 (Spindle pole component) | |
| Spc34 (Spindle pole component) | |
| Functional analog is Dam1c | Ska Complex |
| Ska1 | |
| Ska2 | |
| Ska3 | |
| Spc105c | KNL1 complex |
| Spc105 (Spindle component) | KNL1 |
| Kre28 (Killer toxin resistant) | Zwint-1 |
| Ndc80c | Ndc80c |
| Ndc80 (Nuclear division cycle) | Hec1 |
| Nuf2 (Nuclear filamentous protein) | Nuf2 |
| Spc24 (Spindle pole component) | Spc24 |
| Spc25 (Spindle pole component) | Spc25 |
| MIND | Mis12c |
| Mtw1 (Mis Twelve-like) | Mis12 |
| Dsn1 (Dosage suppressor of NNF1) | Dsn1 |
| Nnf1 (Necessary for nuclear function) | Pmf1 |
| Nsl1 (NNF1 synthetic lethal) | Nsl1 |
| Cnn1c | CENP-TWSX |
| Cnn1 (Co-purified with Nnf1) | CENP-T |
| Wip1 (W-like protein) | CENP-W |
| Mhf1 (Mph1-associated histone-fold protein) | CENP-S |
| Mhf2 (Mph1-associated histone-fold protein) | CENP-X |
| OA | CENP-QU |
| Okp1 (Outer kinetochore protein) | CENP-Q |
| Ame1 (Associated with microtubules and essential) | CENP-U |
| Mif2 | CENP-C |
| Mif2 (Mitotic fidelity of chromosome transmission) | CENP-C |
| CI | CENP-NL |
| Chl4 (Chromosome loss) | CENP-N |
| Iml3 (Increased minichromosome loss) | CENP-L |
| NN | |
| Nkp1 (Non-essential kinetochore protein) | No human homolog |
| Nkp2 (Non-essential kinetochore protein) | |
| CM | CENP-OP |
| Ctf19 (Chromosome transmission fidelity) | CENP-O |
| Mcm21 (Mini-chromosome maintenance) | CENP-P |
| No fungal homolog | CENP-R |
| Ctf3c | CENP-HIKM |
| Ctf3 (Chromosome transmission fidelity) | CENP-H |
| Mcm16 (Mini-chromosome maintenance) | CENP-I |
| Mcm22 (Mini-chromosome maintenance) | CENP-K |
| No fungal homolog | CENP-M |
| Centromeric histone | Centromeric histone |
| Cse4 (Chromosome segregation) | CENP-A |
Table 2
Plasmids used in this study.
| Protein complex | Plasmid name | Names used in this paper | Proteins expressed* | Vector | References |
|---|---|---|---|---|---|
| Mif2 | Sc_Mf_7 | Mif2 | Mif2-linker-(27-392)MBP-6XHis** | pLIC | This study |
| pGH52 | Mif2 | Mif2-linker-(27-392)MBP** | pLIC | This study | |
| Sc_Mf_5B | ΔN-Mif2 | (41-549)Mif2-linker-(27-392)MBP | pLIC | This study | |
| OA | pGH3 | OA | Ame1-6XHis, Okp1 | pST39 | This study |
| pGH4 | OA | Ame1-FLAG, Okp1 | pST39 | This study | |
| pGH42 | ΔN-OA | (21-324)Ame1-FLAG, Okp1 | pST39 | This study | |
| pGH15 | ΔN-OA | (21-324)Ame1-6XHis, Okp1 | pST39 | This study | |
| MIND | pGH63 | 2D-MIND | 6XHis-linker-Nsl1, S240D, S250D-Dsn1, Mtw1, Nnf1 | pST39 | This study |
| pGH62 | 2D-MIND | FLAG-Nsl1, S240D, S250D-Dsn1, Mtw1, Nnf1 | pST39 | This study | |
| pGH46 | MIND | Nsl1, FLAG-Dsn1, Mtw1, Nnf1 | pST39 | This study | |
| Ndc80c | pJT048 | Part of Ndc80c | Spc24-Flag, Spc25 | pRSFDuet | Kudalkar et al., 2015 |
| pEM033 | Part of Ndc80c | Spc24-6XHis, Spc25 | pRSFDuet | Scarborough et al., 2019 | |
| Ndc80/Nuf2 | Part of Ndc80c | Nuf2, Ndc80 | pETDuet | Wei et al., 2005 | |
| Dam1c | pJT044 | Dam1c | Dad1, Duo1, Spc34-FLAG, Dam1, Hsk3 and Dad4, Dad3, Dad2, Spc19, Ask1‡ | pST39 | Umbreit et al., 2014 |
| CI | pGH58 | CI | FLAG-Chl4, Iml3 | pLIC | This study |
| Histones | pScKl2 | Cse4-NCP | K.lactis 6XHis-H2A, K. lactis 6XHis-H2B, Cse4, K. lactis 6XHis-H4 | pLIC | Migl et al., 2020 |
| pScKl4 | H3-NCP | H3, 6XHis-H2A, H2B. K.lactis 6XHis-H4 | pLIC | Migl et al., 2020 | |
| pScHT4 | Cse4(1-50) | 6XHis-MBP-(1-50)Cse4 | pLIC | This study |
Key resources table
| Reagent type (species) or resource | Designation | Source or reference | Identifiers | Additional information |
|---|---|---|---|---|
| Strain, strain background (Escherichia coli) | Rosetta (DE3) pLys competent cells | Novagen | Cat#71403 | |
| Strain, strain background (Escherichia coli) | Rosetta (DE3) competent cells | Millipore Sigma | Cat#70954 | |
| Biological sample (Bos taurus) | Bovine brain tubulin | Lab purification | Protocol adopted from Castoldi and Popov, 2003 | |
| Antibody | Penta-HIS biotin conjugate, monoclonal mouse | Qiagen | Cat#34440 | |
| Chemical compound, drug | Glucose oxidase | Millipore Sigma | Cat#345386 | |
| Chemical compound, drug | Catalase | Millipore Sigma | Cat#219261 | |
| Chemical compound, drug | Biotinylated bovine serum albumin (BSA) | Vector laboratories | Cat#B-2007 | |
| Chemical compound, drug | Avidin DN | Vector laboratories | Cat#A-3100 | |
| Chemical compound, drug | TCEP | Thermo Fischer | Cat#T2556 | |
| Software, algorithm | Labview | National Instruments | RRID:SCR_014325 | |
| Software, algorithm | Igor Pro | Wavemetrics | RRID:SCR_000325 | |
| Software, algorithm | R | R Foundation for Statistical Computing |
Additional files
-
Supplementary file 1
Proteins of the kinetochore and plasmids used in this study.
- https://cdn.elifesciences.org/articles/56582/elife-56582-supp1-v2.docx
-
Transparent reporting form
- https://cdn.elifesciences.org/articles/56582/elife-56582-transrepform-v2.docx
Download links
A two-part list of links to download the article, or parts of the article, in various formats.
Downloads (link to download the article as PDF)
Open citations (links to open the citations from this article in various online reference manager services)
Cite this article (links to download the citations from this article in formats compatible with various reference manager tools)
Reconstitution reveals two paths of force transmission through the kinetochore
eLife 9:e56582.
https://doi.org/10.7554/eLife.56582


