Genome streamlining in a minute herbivore that manipulates its host plant
- School of Biological Sciences, University of Utah, United States
- Laboratory of Agrozoology, Department of Plants and Crops, Faculty of Bioscience Engineering, Ghent University, Belgium
- Department of Evolutionary and Population Biology, Institute for Biodiversity and Ecosystem Dynamics, University of Amsterdam, Netherlands
- Department of Plant Biotechnology and Bioinformatics, Ghent University, Belgium
- Center for Plant Systems Biology, VIB, Belgium
- Department of Human Genetics, University of Utah School of Medicine, United States
- Department of Plant and Environmental Sciences, University of Copenhagen, Denmark
- Centre for Microbial Ecology and Genomics, Department of Biochemistry, Genetics and Microbiology, University of Pretoria, South Africa
- Henry Eyring Center for Cell and Genome Science, University of Utah, United States
Figures
Figure 1
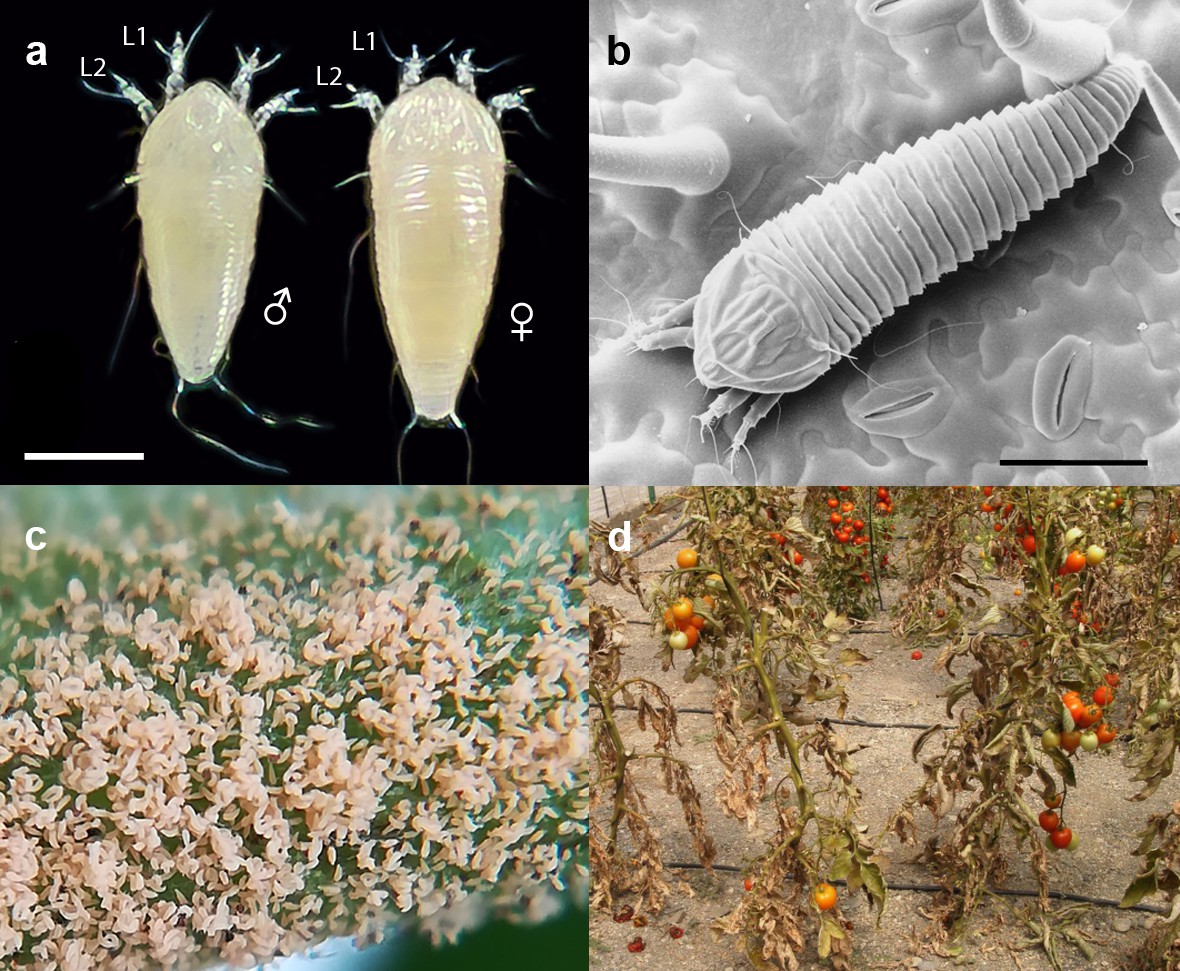
The tomato russet mite Aculops lycopersici is a devastating pest of tomato.
(a) Habitus of the eriophyoid mite A. lycopersici. Male (left) and female (right) mites are slender, worm-like animals bearing, in contrast to non-eriophyoid mites with four pairs of legs, only two pairs of small legs (indicated by L1 and L2). (b) Low temperature (LT) - scanning electron microscopy (SEM) image of A. lycopersici on a leaf of S. lycopersicum. (c) A. lycopersici populations can rapidly build to extremely large numbers on tomato stems and leaves. (d) A. lycopersici damage of heavily infested tomato plants is shown. Scale bars in panels a and b represent 0.05 mm.
Figure 2 with 6 supplements
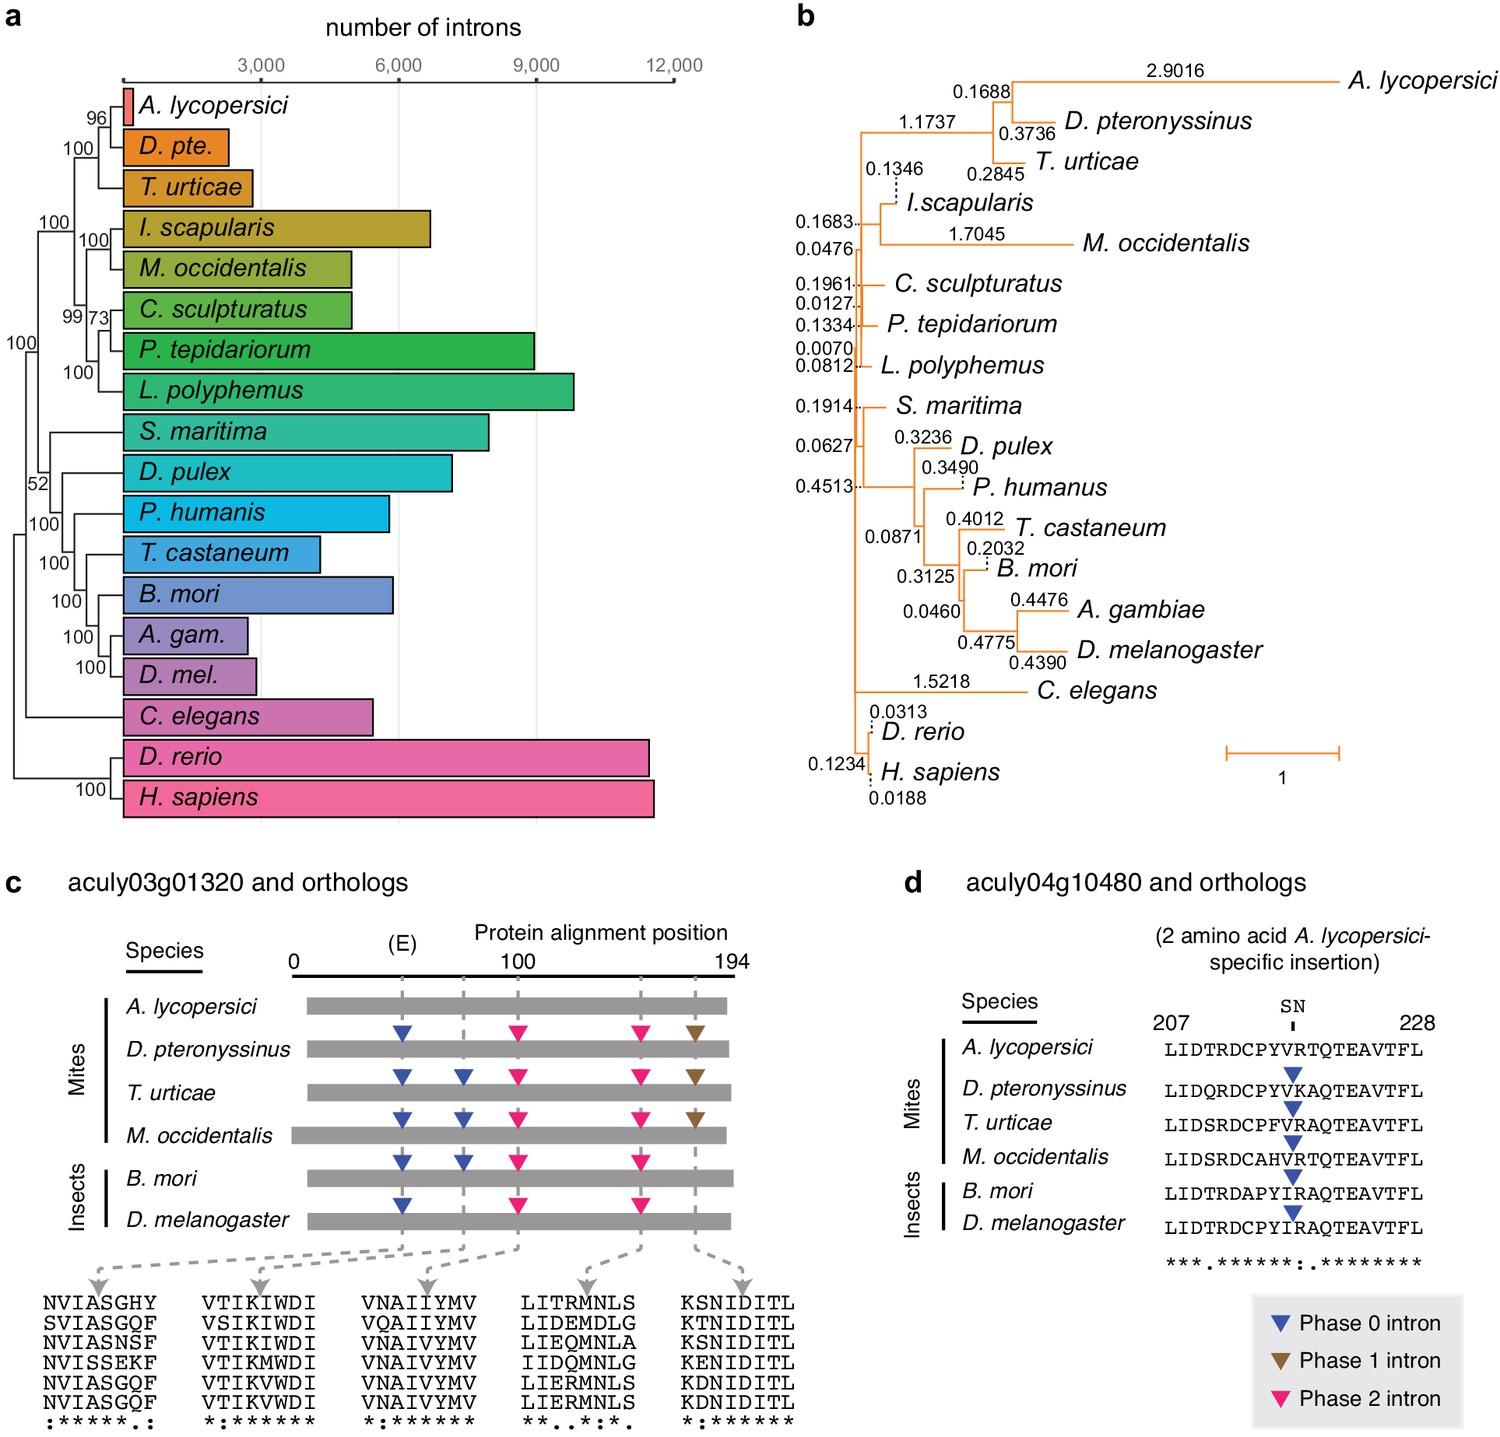
Number of conserved introns and intron loss rate across 18 metazoan species.
(a) Phylogenetic tree built from 147 single copy orthologues (left; numbers at nodes indicate bootstrap support), and a histogram of introns present at 29,447 conserved positions identified by the software package Malin (right). (b) Phylogenetic tree with branch lengths labeled and scaled to the intron loss rate calculated by Malin. The unedited tree in both panels is given in Figure 2—figure supplement 3, and was, together with 2371 orthologous protein clusters (Supplementary file 2), used as input for Malin. (c) Alignment of A. lycopersici aculy03g01320 (which encodes an ADP-ribosylation factor-like 8, or Arl8, protein) with single copy orthologues from five other mite and insect species as indicated. Analogous positions of phase 0, 1, and 2 introns are denoted by colored triangles (legend, bottom right), with amino acids at the analogous intronic positions indicated beneath (identity, similarity, and non-similarity are indicated by ‘*', ‘:', and ‘.', respectively, for aculy03g01320 and its orthologue from D. pteronyssinus, the most closely related genome; in descending order, the sequence identifiers are aculy03g01320.1, g8154.t1, tetur10g00460, rna18006, BGIBMGA010943-RA, and FBtr0339723). The letter ‘E’ indicates that this intron position is conserved across other model organisms in Eukaryota; Dictyostelium purpureum (GenBank Accession XM_003283650), C. elegans (NM_070390.9), H. sapiens (NM_018184.3), Monosiga brevicollis (XM_001744342.1), and A. thaliana (NM_114847.5). (d) Local protein alignment, after panel c, revealing a candidate imprecise intron loss event in aculy04g10480 (which encodes a polymerase delta-interacting protein) in A. lycopersici (insertion of S and N amino acid residues, top). Numbers denote positions in the A. lycopersici orthologue; sequence identifiers, in descending order, are aculy04g10480.1, g5664.t1, tetur01g12540, rna9399, BGIBMGA013121-RA, and FBtr0078681. Panels (c) and (d) are drawn based on Malin output. Other findings for intronic features and factors contributing to A. lycopersici’s genome reduction, and the supporting analyses, are presented in Figure 2—figure supplements 1, 2, 4, 5 and 6.
Figure 2—figure supplement 1
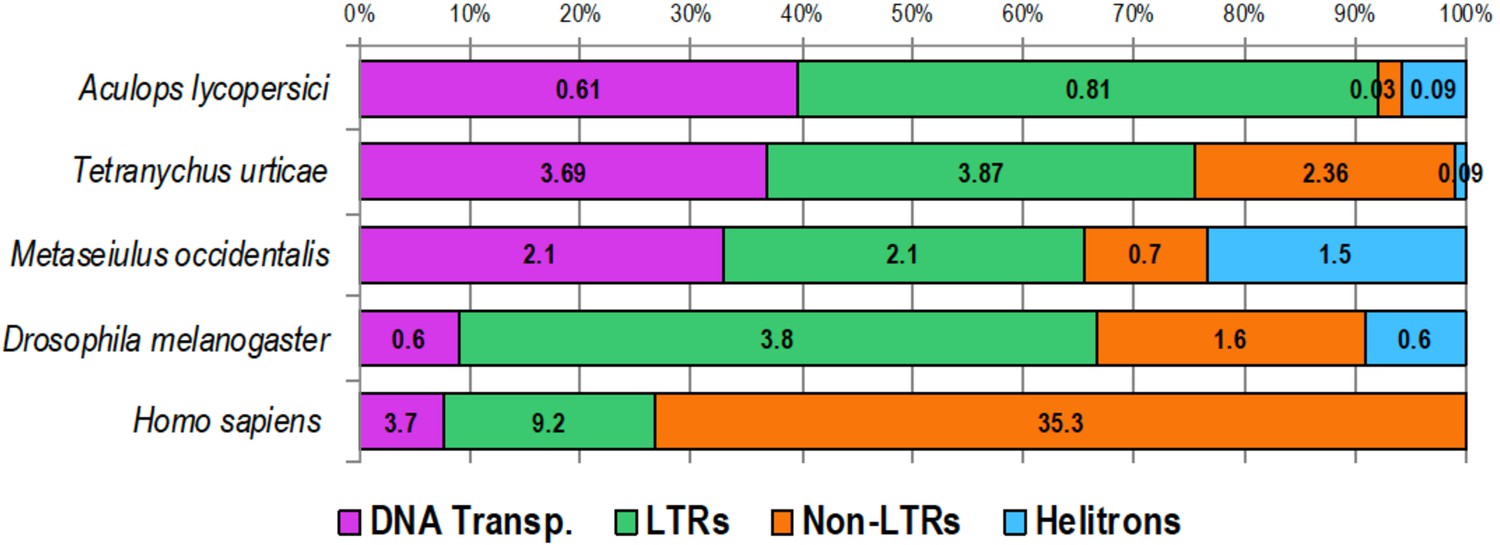
Transposable element (TE) composition of the genome of A. lycopersici as well as that of four other animals.
A horizontal stacked color bar chart shows TE class composition of A. lycopersici and four other metazoan species as indicated (left). The numbers within boxes represent the percentage of the genome occupied by the respective TE classes. For the other arthropods and the vertebrate analyzed the genome size estimates are as follows: T. urticae, 89.6 Mb (Grbić et al., 2011); M. occidentalis, 151.29 Mb (Hoy et al., 2016); D. melanogaster, euchromatin 120 Mb (Hoy et al., 2016); and Homo sapiens, 3,049.31 Mb (http://www.repeatmasker.org/species/hg.html). Transp: transposon; LTR: long terminal repeat.
Figure 2—figure supplement 2
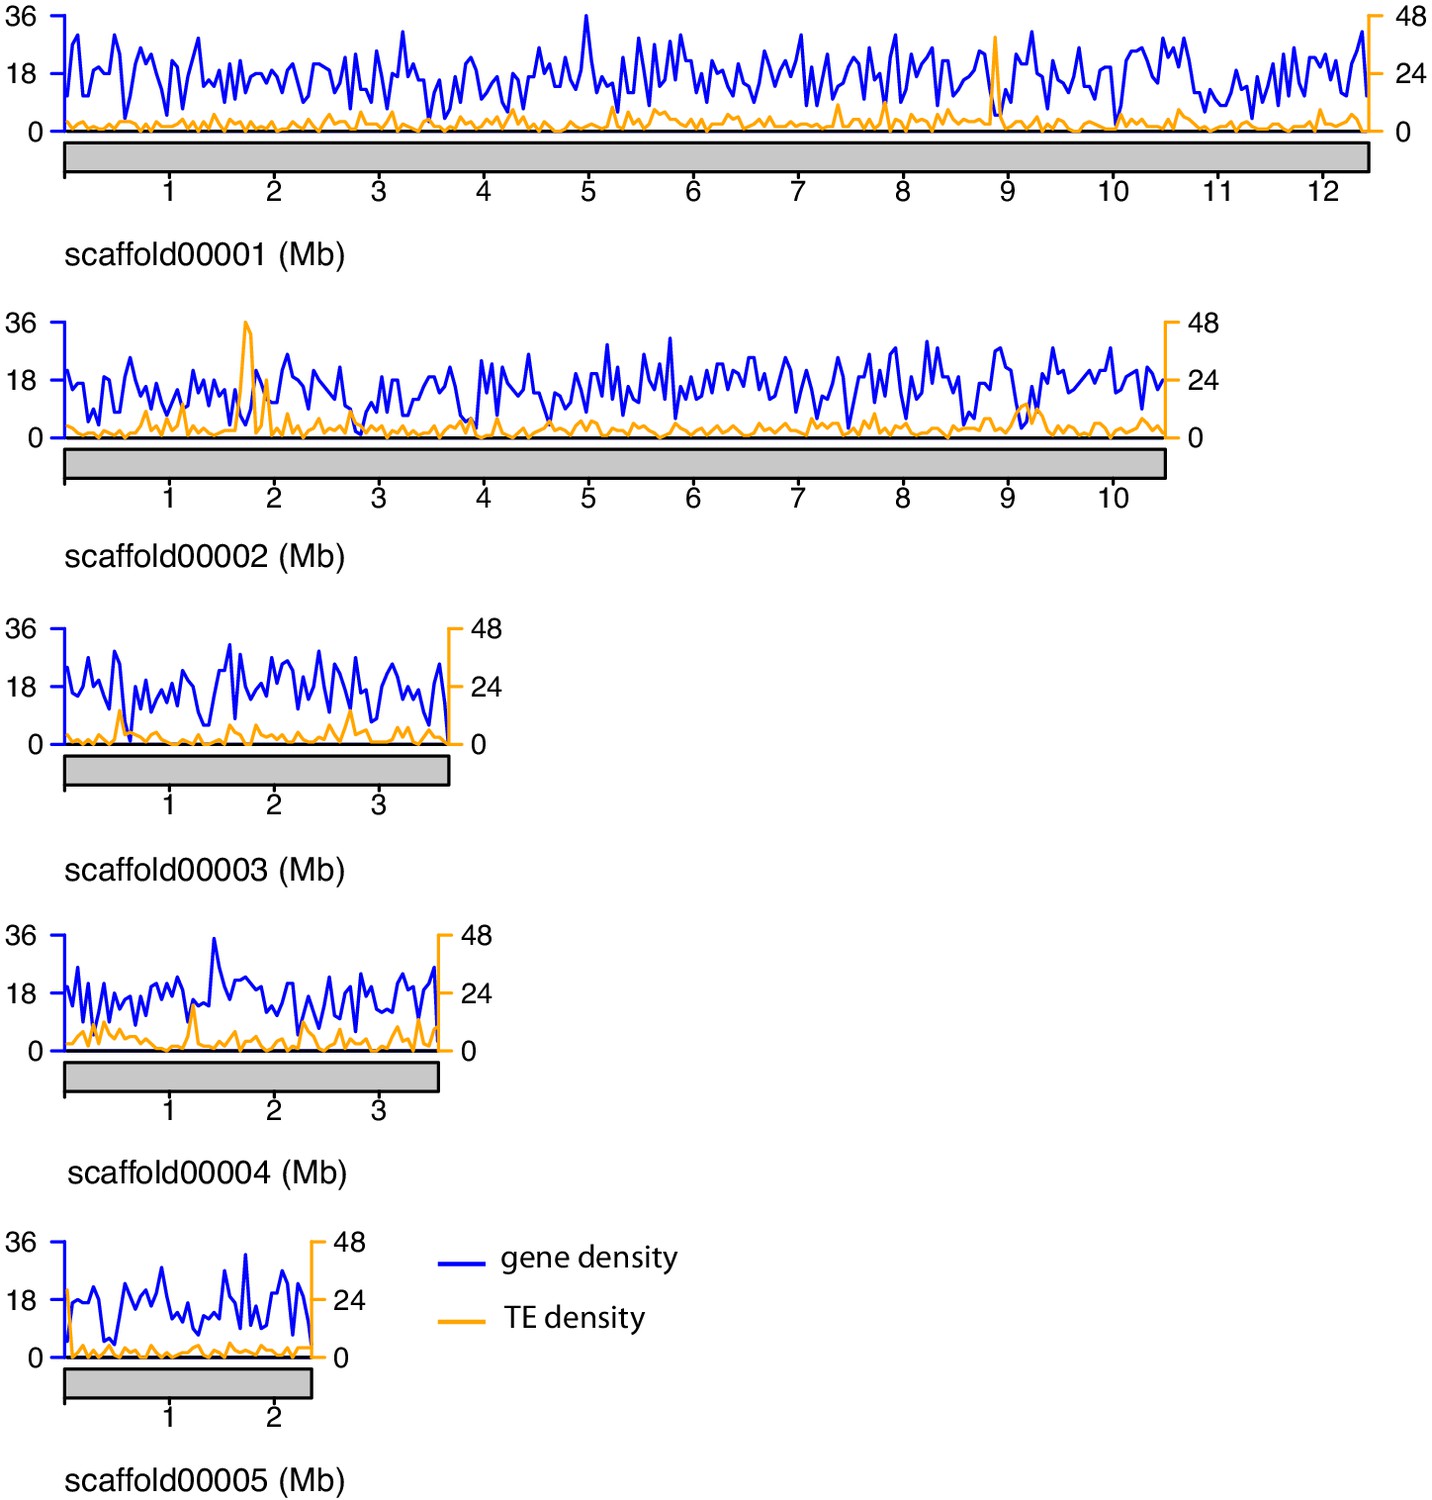
Gene and TE density along the major A. lycopersici genome scaffolds.
Gene density is shown based on the GFF3 annotation file of the A. lycopersici genome (Table 1—source data 1), while TE density was calculated using RepeatMasker output (Supplementary file 1 – Table S2). Density is plotted as number of features per window of 50 kb. Gene and TE density on scaffold 11 and 17 (each <6 kb) are not shown.
Figure 2—figure supplement 3
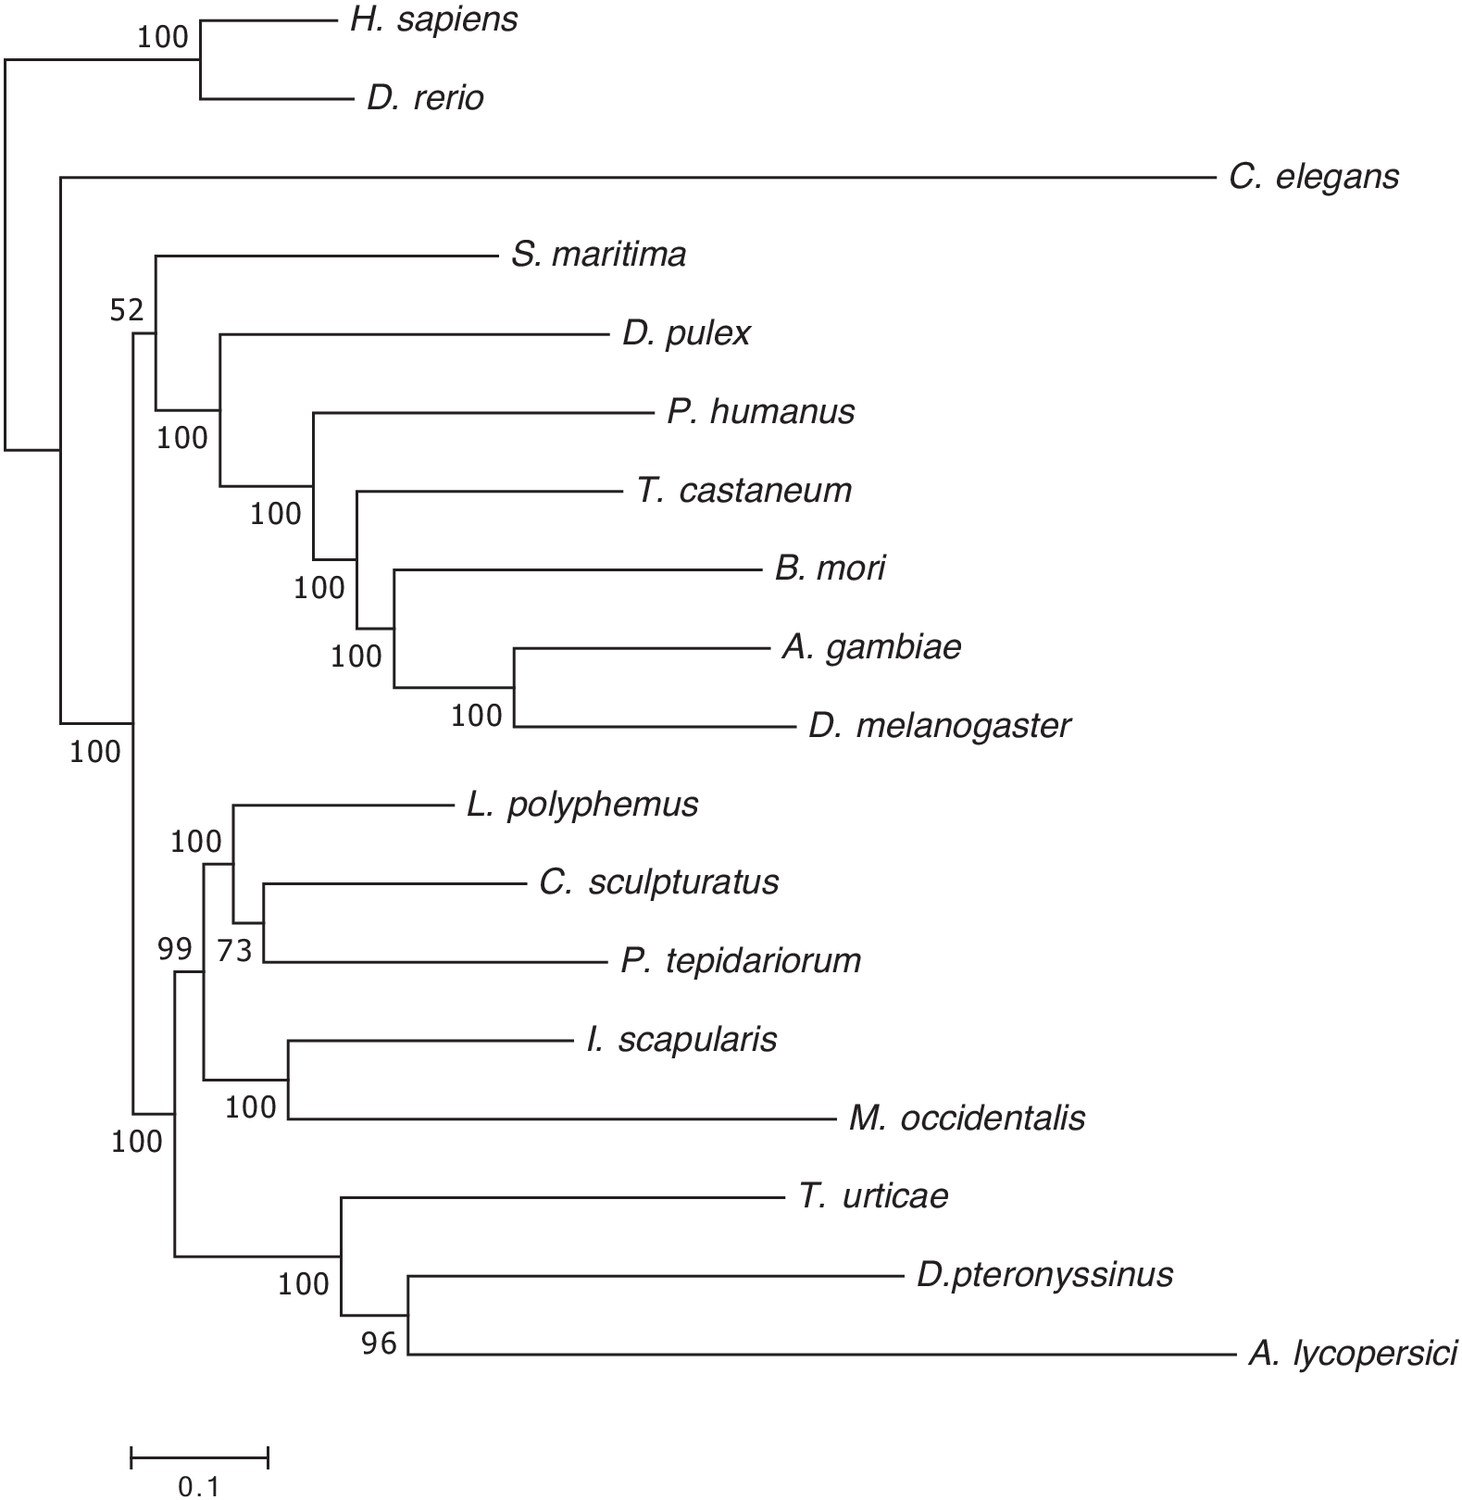
Maximum likelihood phylogenetic analysis of 18 metazoan species including A. lycopersici.
A maximum likelihood phylogenetic tree was constructed based on the concatenated alignment of 147 single-copy orthologues present in all 18 metazoan species included in the orthogroup analysis (see Materials and methods). The tree was rooted with vertebrates (Danio rerio and Homo sapiens), the scale bar represents 0.1 substitutions per site, and numbers at nodes indicate bootstrap support based on 1000 replicates. This tree, which shows branch lengths, is the basis of the condensed phylogeny shown in Figure 2; it was also used for the CAFE analysis shown in Figure 3 (see also Materials and methods and Results). The concatenated alignment of the 147 single-copy orthologues and the trimmed version, used for phylogenetic inference, can be found in Supplementary file 7.
Figure 2—figure supplement 4
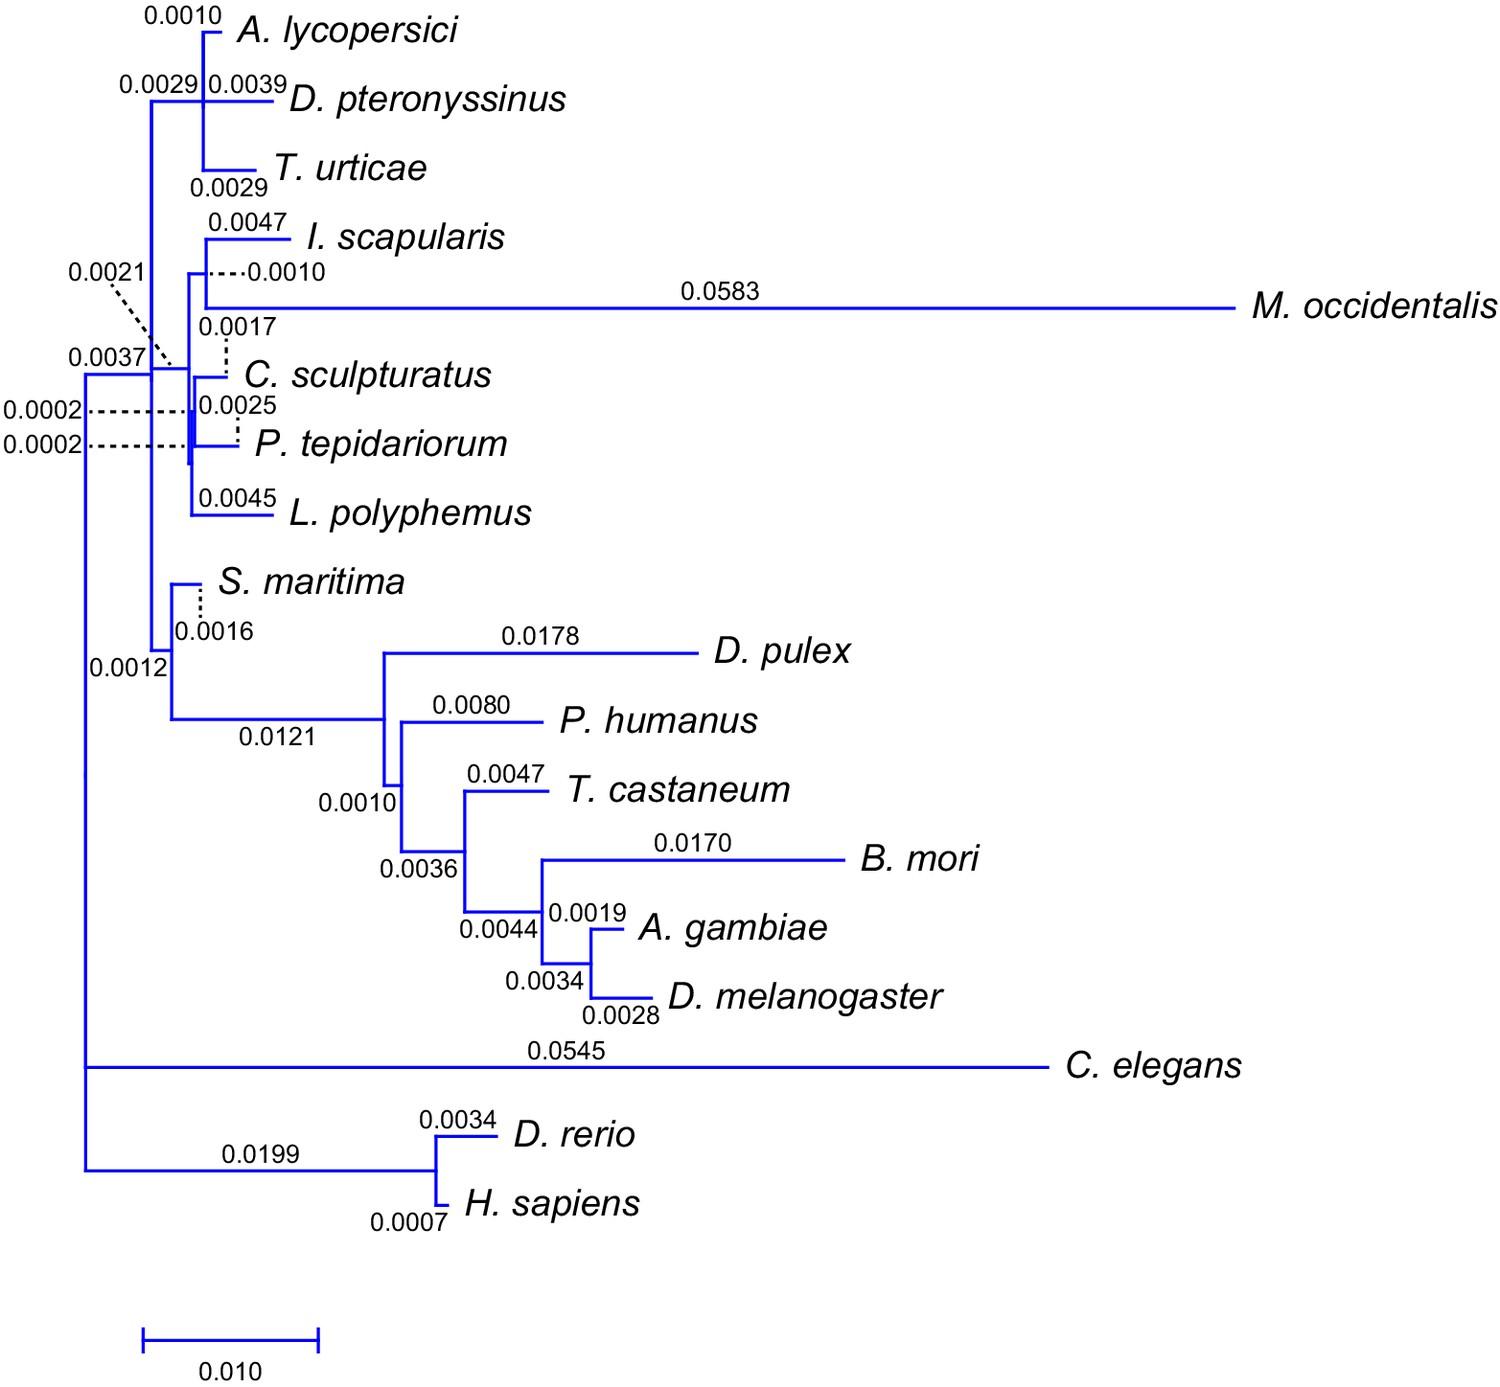
Intron gain rate across 18 metazoan species including A. lycopersici.
Shown is the phylogenetic tree from Figure 2—figure supplement 3 with branch lengths labeled and scaled to the intron gain rate as calculated using Malin (Csurös, 2008).
Figure 2—figure supplement 5
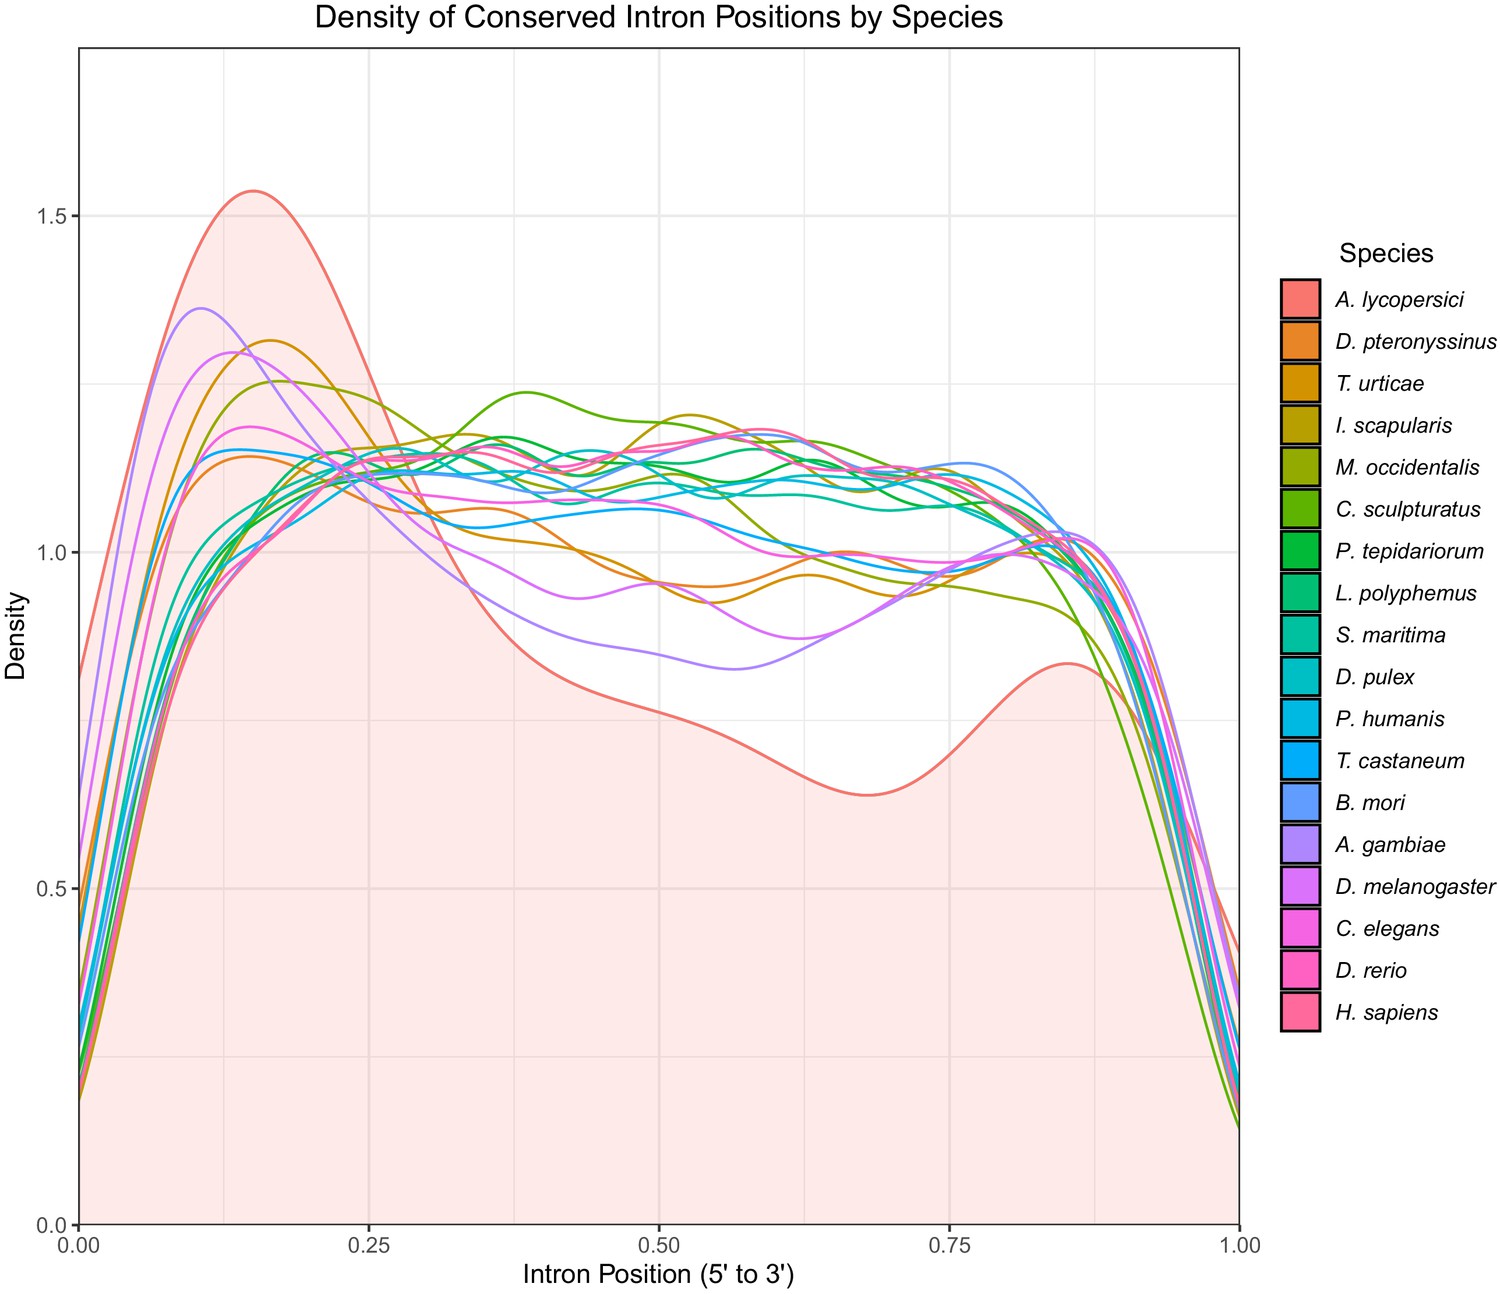
Density plot of conserved intron positions identified by Malin in 18 metazoan species.
Positions are scaled from 0 to 1 where 0 represents the 5’ end of the gene and 1 represents the 3’ end. The area under the density curve for A. lycopersici is filled in.
Figure 2—figure supplement 6
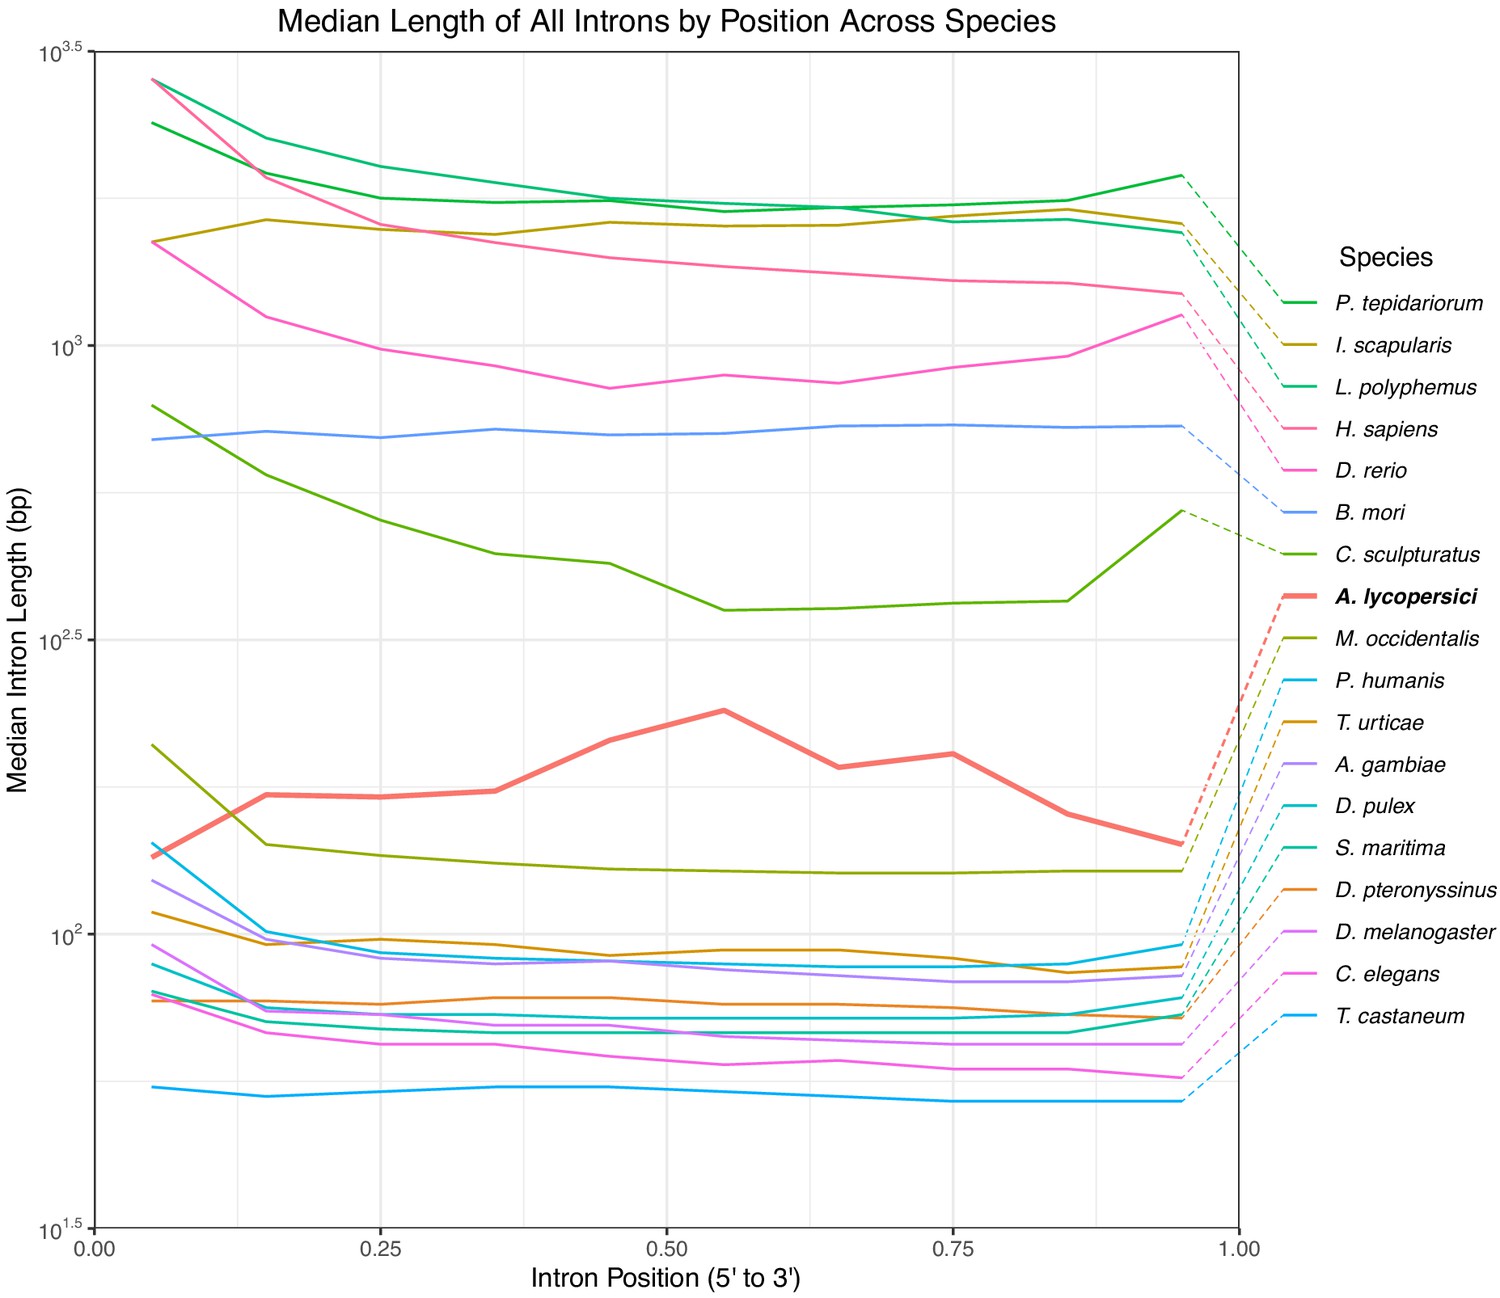
Median length of all introns in 18 metazoan species.
Positions are scaled from 0 to 1 where 0 represents the 5’ end of the gene and 1 represents the 3’ end and binned by decile. A. lycopersici is shown in red/bold, and has greater median intron lengths than for all but the large genome sized arthropods and vertebrates included in the analysis.
Figure 3
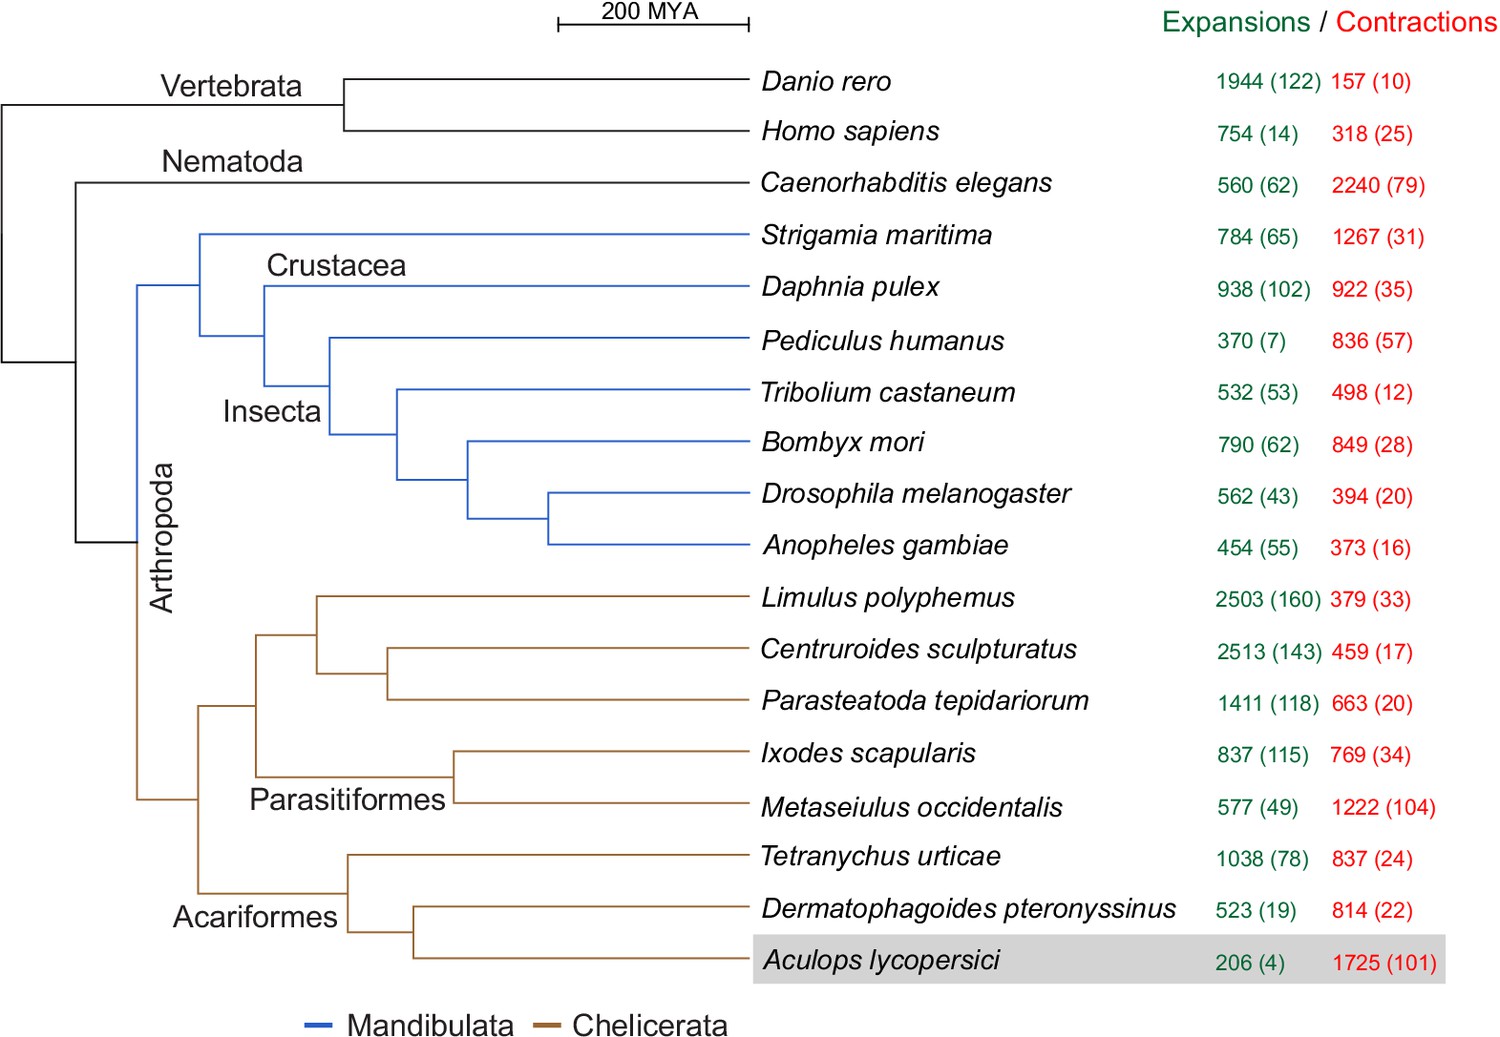
CAFE analysis of 6487 metazoan orthogroups.
The number of expanding orthogroups are indicated in green font, while contracting orthogroups are indicated in red font. The number of rapidly expanding or contracting orthogroups (p-value<0.05) is shown in parentheses and details regarding these orthogroups can be found in Supplementary file 1 — ‘Table S5’ Tab and ‘Table S7’ Tab.
Figure 4 with 20 supplements
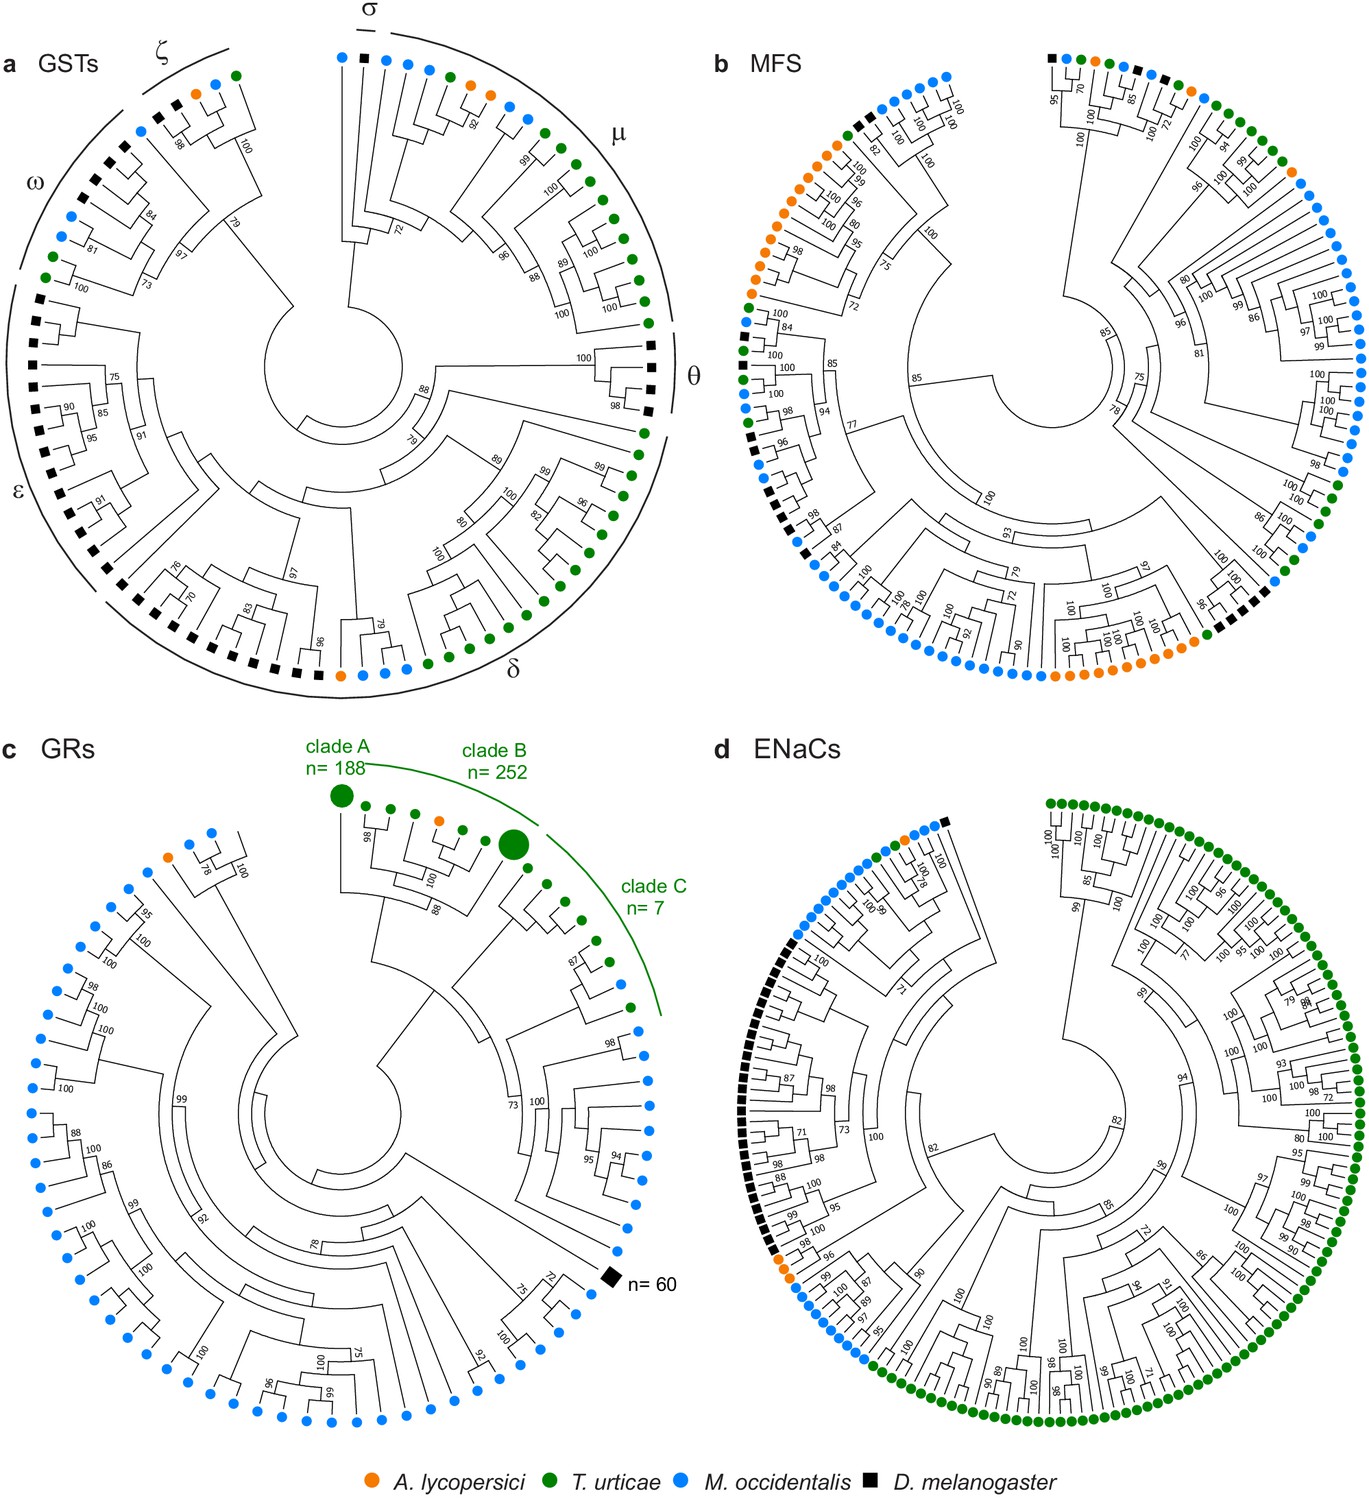
Gene family contractions and mini-expansions in A. lycopersici.
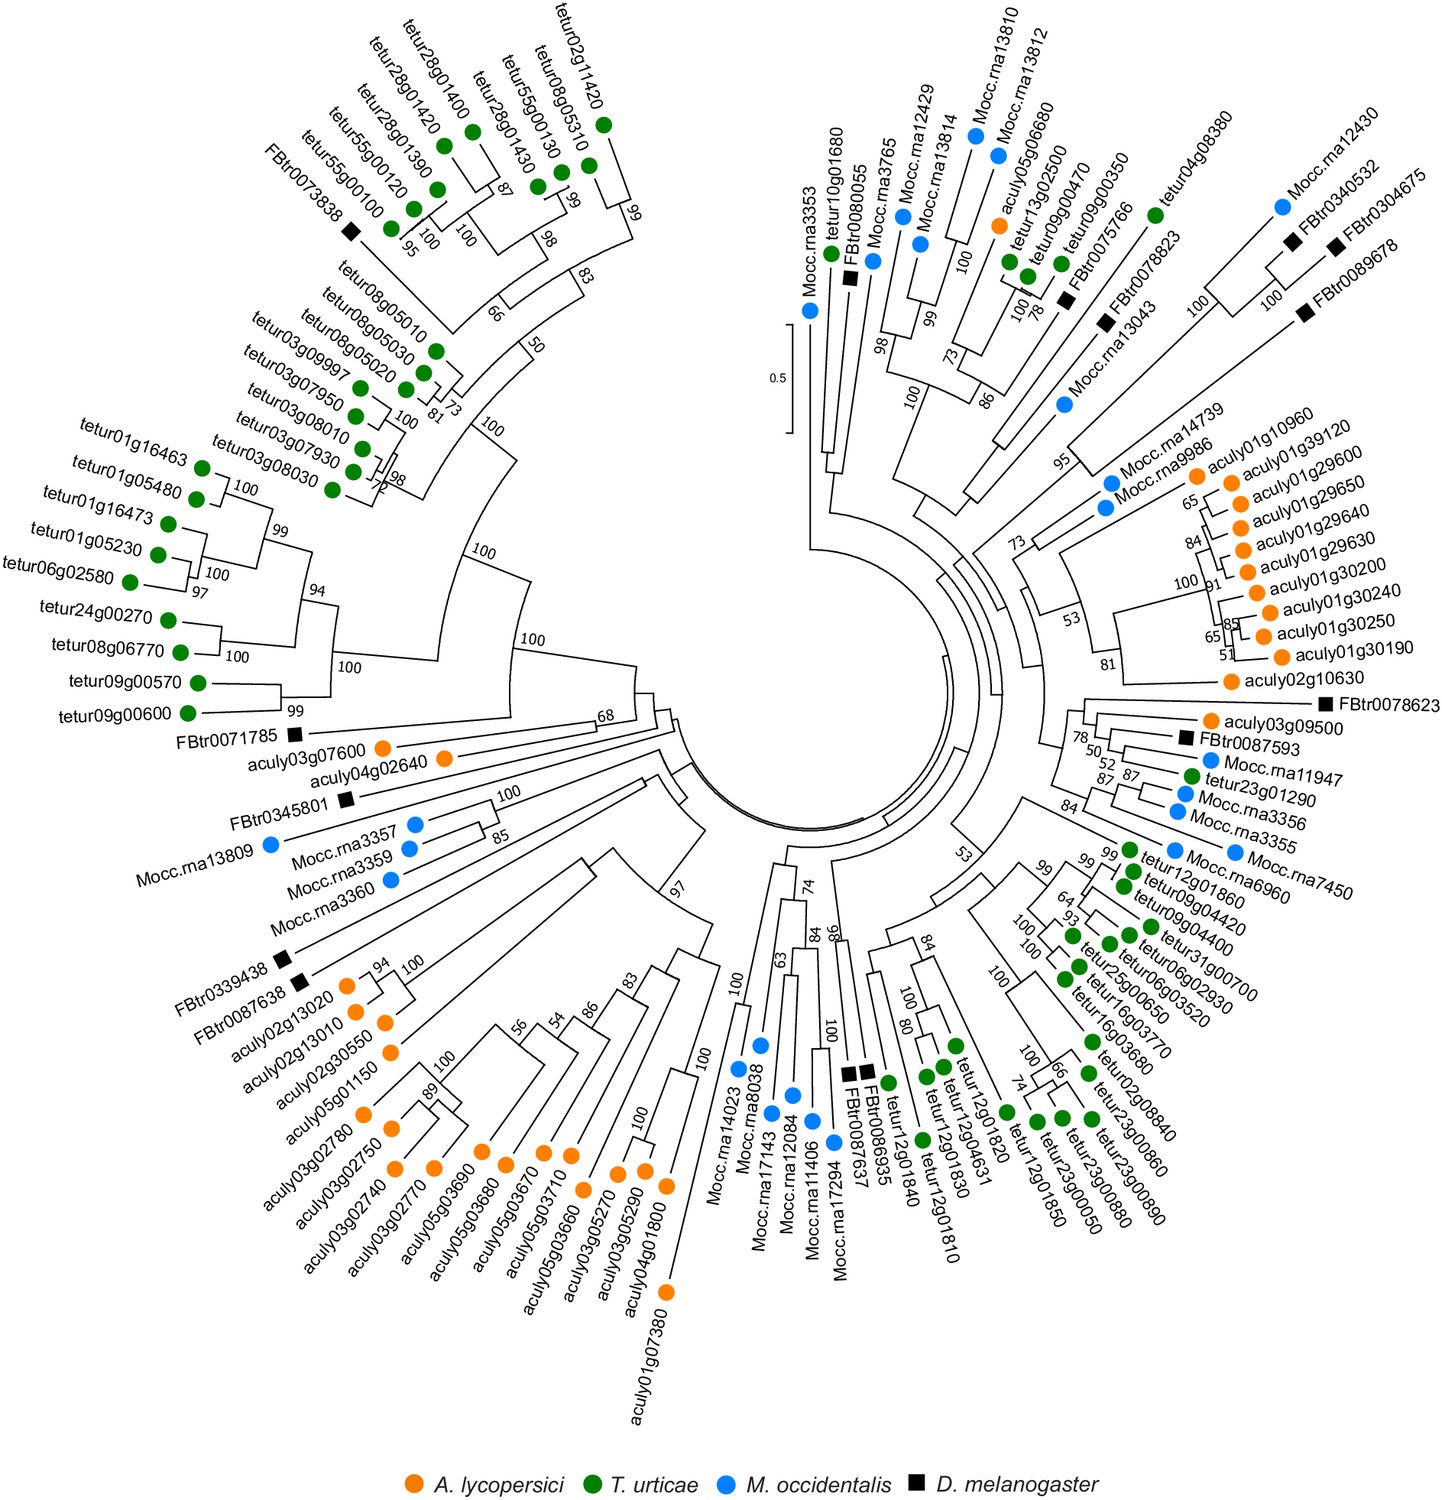
Maximum likelihood phylogenetic analysis of selected detoxification and chemosensory families among A. lycopersici, T. urticae, M. occidentalis and D. melanogaster. (a) Glutathione-S-transferases (GSTs); the different GST classes (zeta, theta, delta, epsilon, omega, mu, sigma) are indicated with arches. (b) Major facilitator superfamily (MFS). (c) Gustatory receptors (GRs). (d) Epithelial Na+ Channels (ENaCs). All trees are midpoint rooted and only topology is shown. Gustatory receptors for D. melanogaster as well as the species-specific class A and B expansions identified in T. urticae are collapsed for clarity. Only bootstrap values above 70 are shown. Phylogenetic reconstructions for gene families, or analyses of domain losses in A. lycopersici in arthropod conserved genes, are given in Figure 4—figure supplements 1–20. For panels a-d, the detailed versions for each tree, including sequence identifiers, can be found in Figure 4—figure supplements 1, 5, 6 and 7, respectively. The alignments used for phylogenetic inference can be found in Supplementary file 7.
Figure 4—figure supplement 1
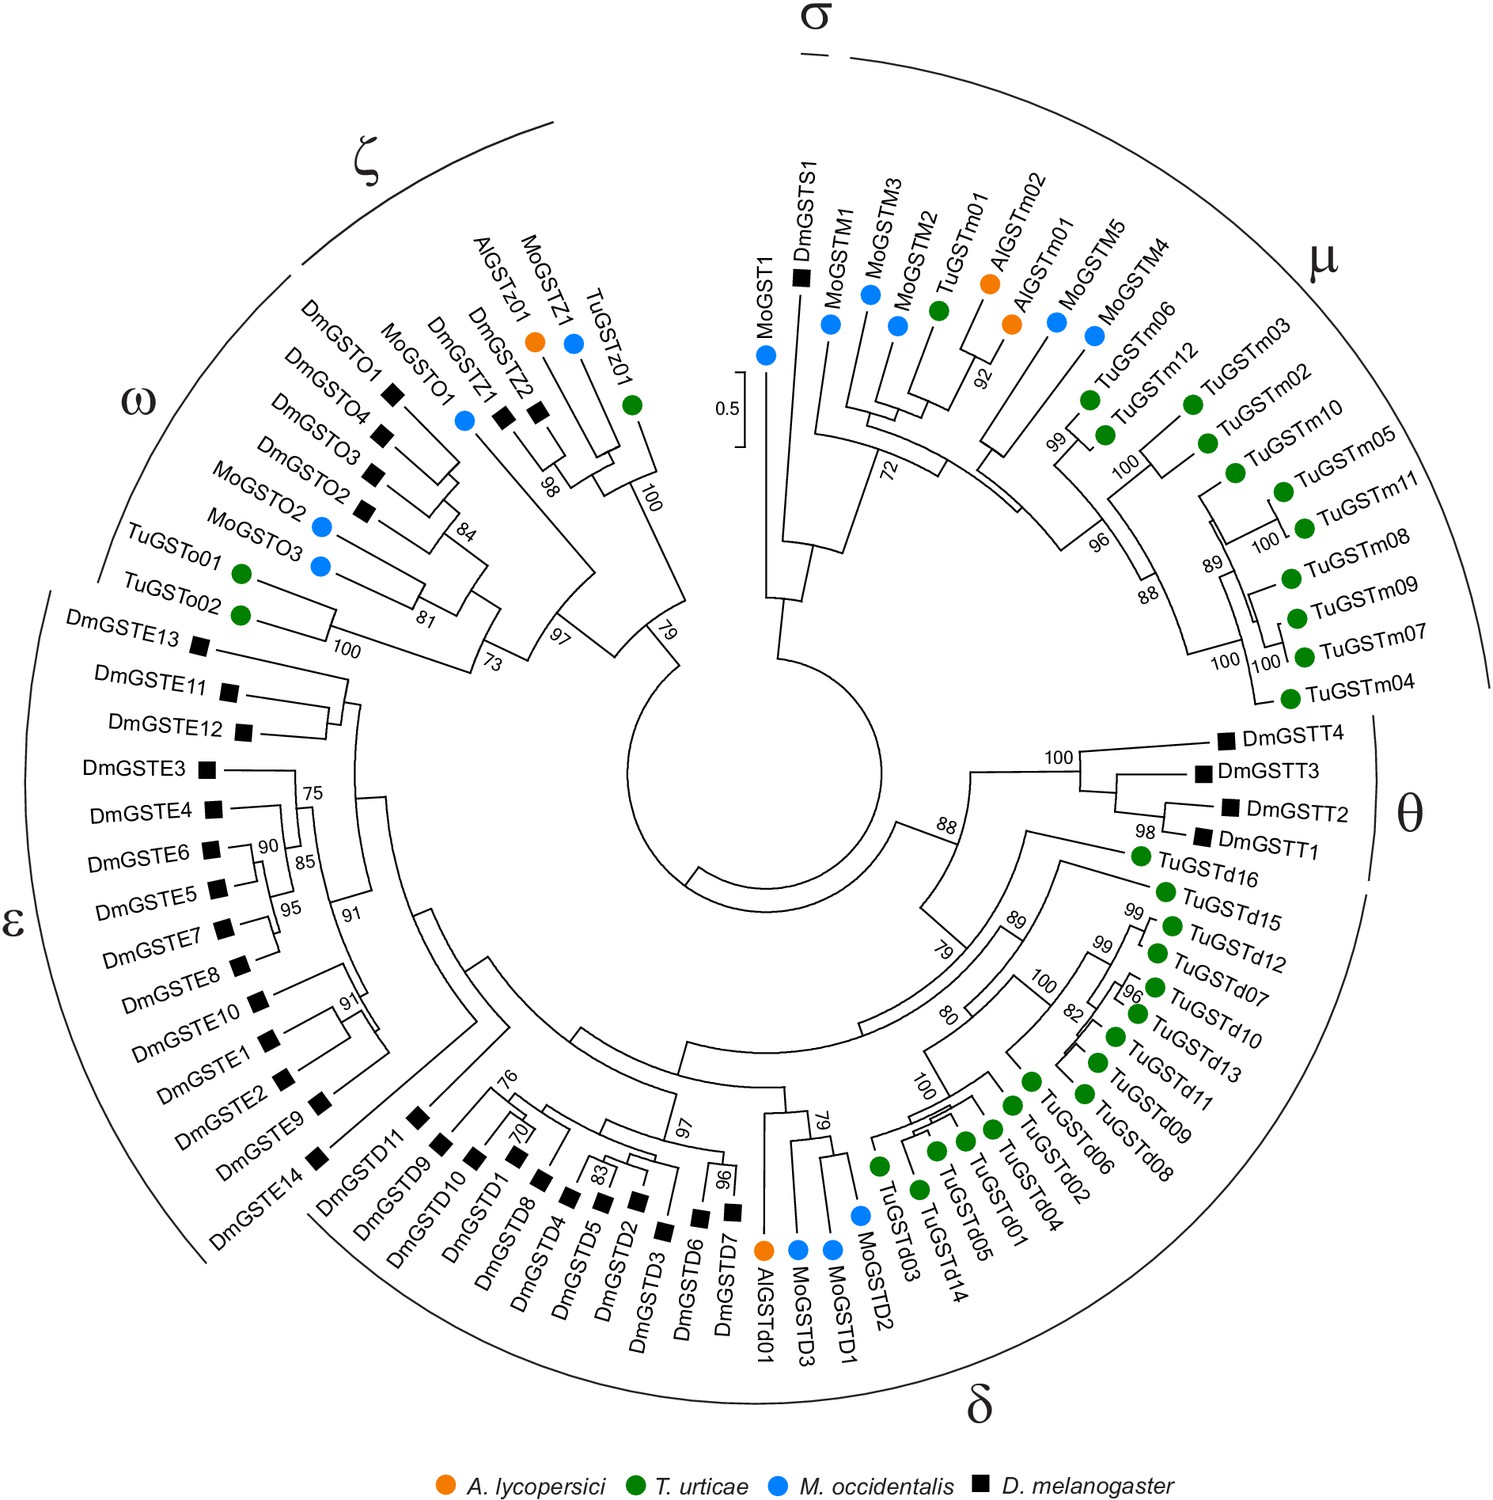
Phylogenetic analysis of GST protein sequences of A. lycopersici.
A midpoint rooted maximum likelihood tree is shown; the scale bar represents 0.5 substitutions per site, and numbers at nodes indicate bootstrap support based on 1000 replicates. Only bootstrap values above 70 are shown. The different GST classes are indicated with Greek letters (delta, epsilon, zeta, theta, omega, mu, and sigma). Species are denoted by color as indicated in the legend at bottom (circles, chelicerates; square, an insect). The alignment used for phylogenetic inference can be found in Supplementary file 7.
Figure 4—figure supplement 2
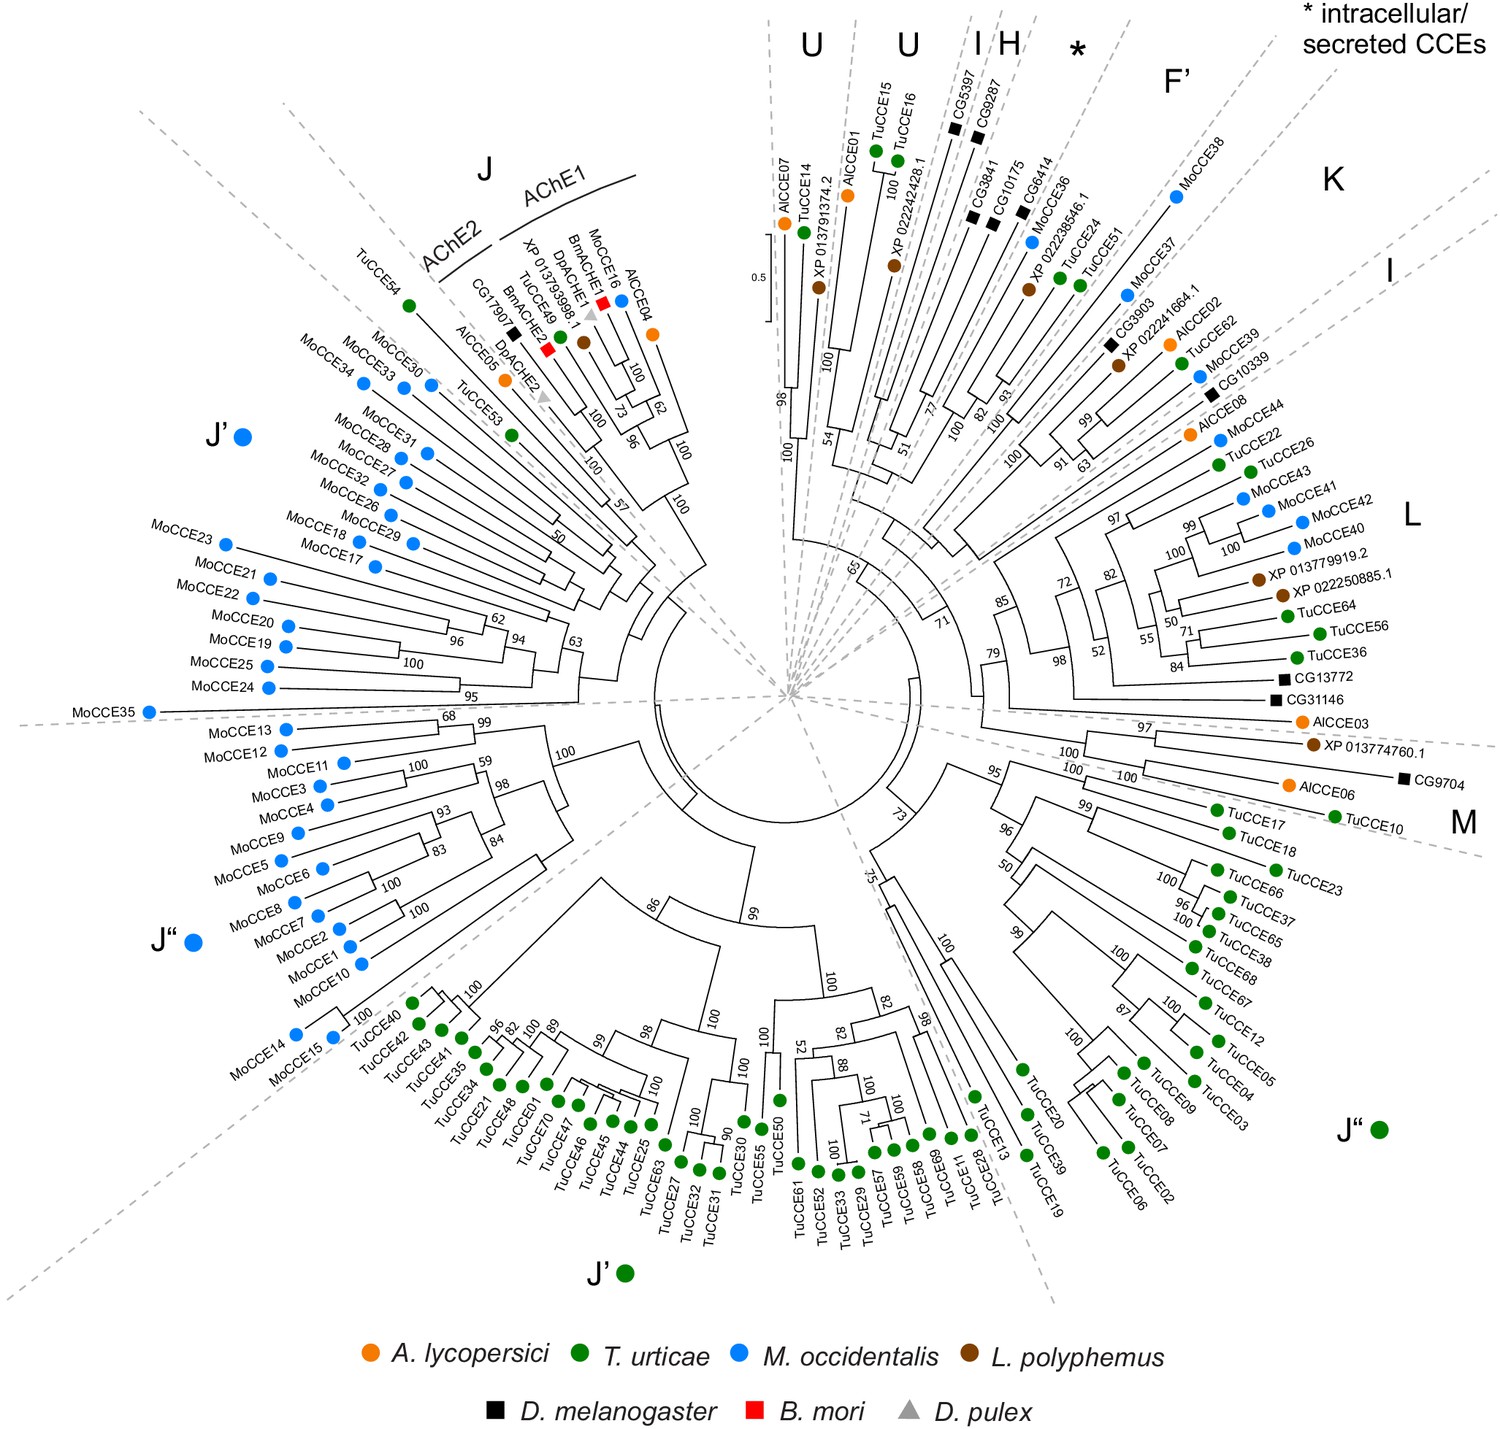
Phylogenetic analysis of CCE protein sequences of A. lycopersici.
A midpoint rooted maximum likelihood tree is shown; the scale bar represents 0.5 substitutions per site, while numbers at nodes indicate bootstrap support based on 500 replicates. Only bootstrap values above 50 are shown. The different CCE clades are indicated with single letters: Clade F’, Acari/Chelicerate juvenile hormone esterases; Clade H, glutactins; Clade J, AChEs; Clade K, gliotactin; Clade L, neuroligins; Clade M, neurotactin; Clade U, uncharacterized conserved clade in Acariformes/L. polyphemus, see Wei et al., 2020; I, uncharacterized conserved clade in insects; Claudianos et al., 2006; Clades J’ and J”: T. urticae and M. occidentalis specific CCE clades, see Grbić et al., 2011 and Wu and Hoy, 2016. Species are denoted by color as indicated in the legend at bottom (circles, chelicerates; squares, insects; triangle, crustacean). The alignment used for phylogenetic inference can be found in Supplementary file 7.
Figure 4—figure supplement 3
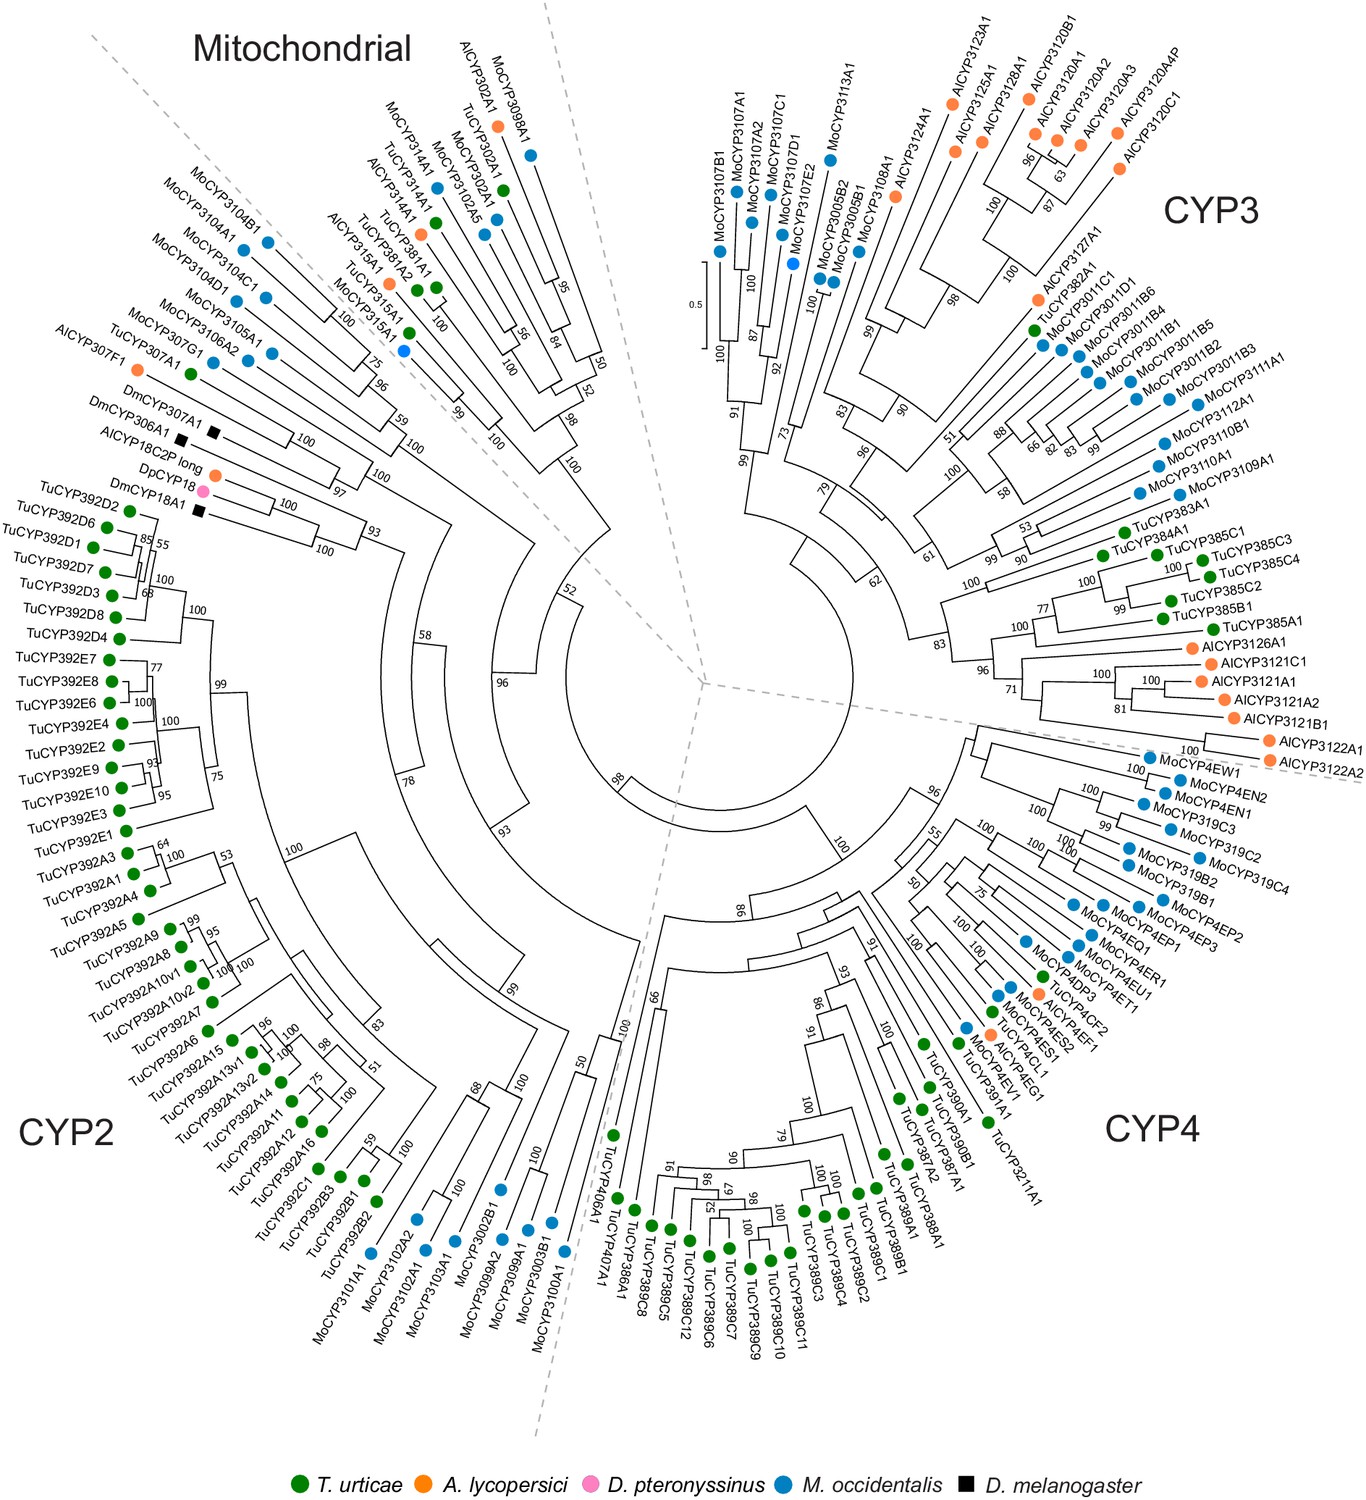
Phylogenetic analysis of CYP protein sequences of A. lycopersici.
A midpoint rooted maximum likelihood tree is shown; the scale bar represents 0.5 substitutions per site, while numbers at nodes indicate bootstrap support based on 1000 replicates. Only bootstrap values above 50 are shown. The four different CYP clans (Mitochondrial, CYP2, CYP3, and CYP4) are as indicated. Species are denoted by color as indicated in the legend at bottom (circles, chelicerates; square, an insect). The alignment used for phylogenetic inference can be found in Supplementary file 7.
Figure 4—figure supplement 4
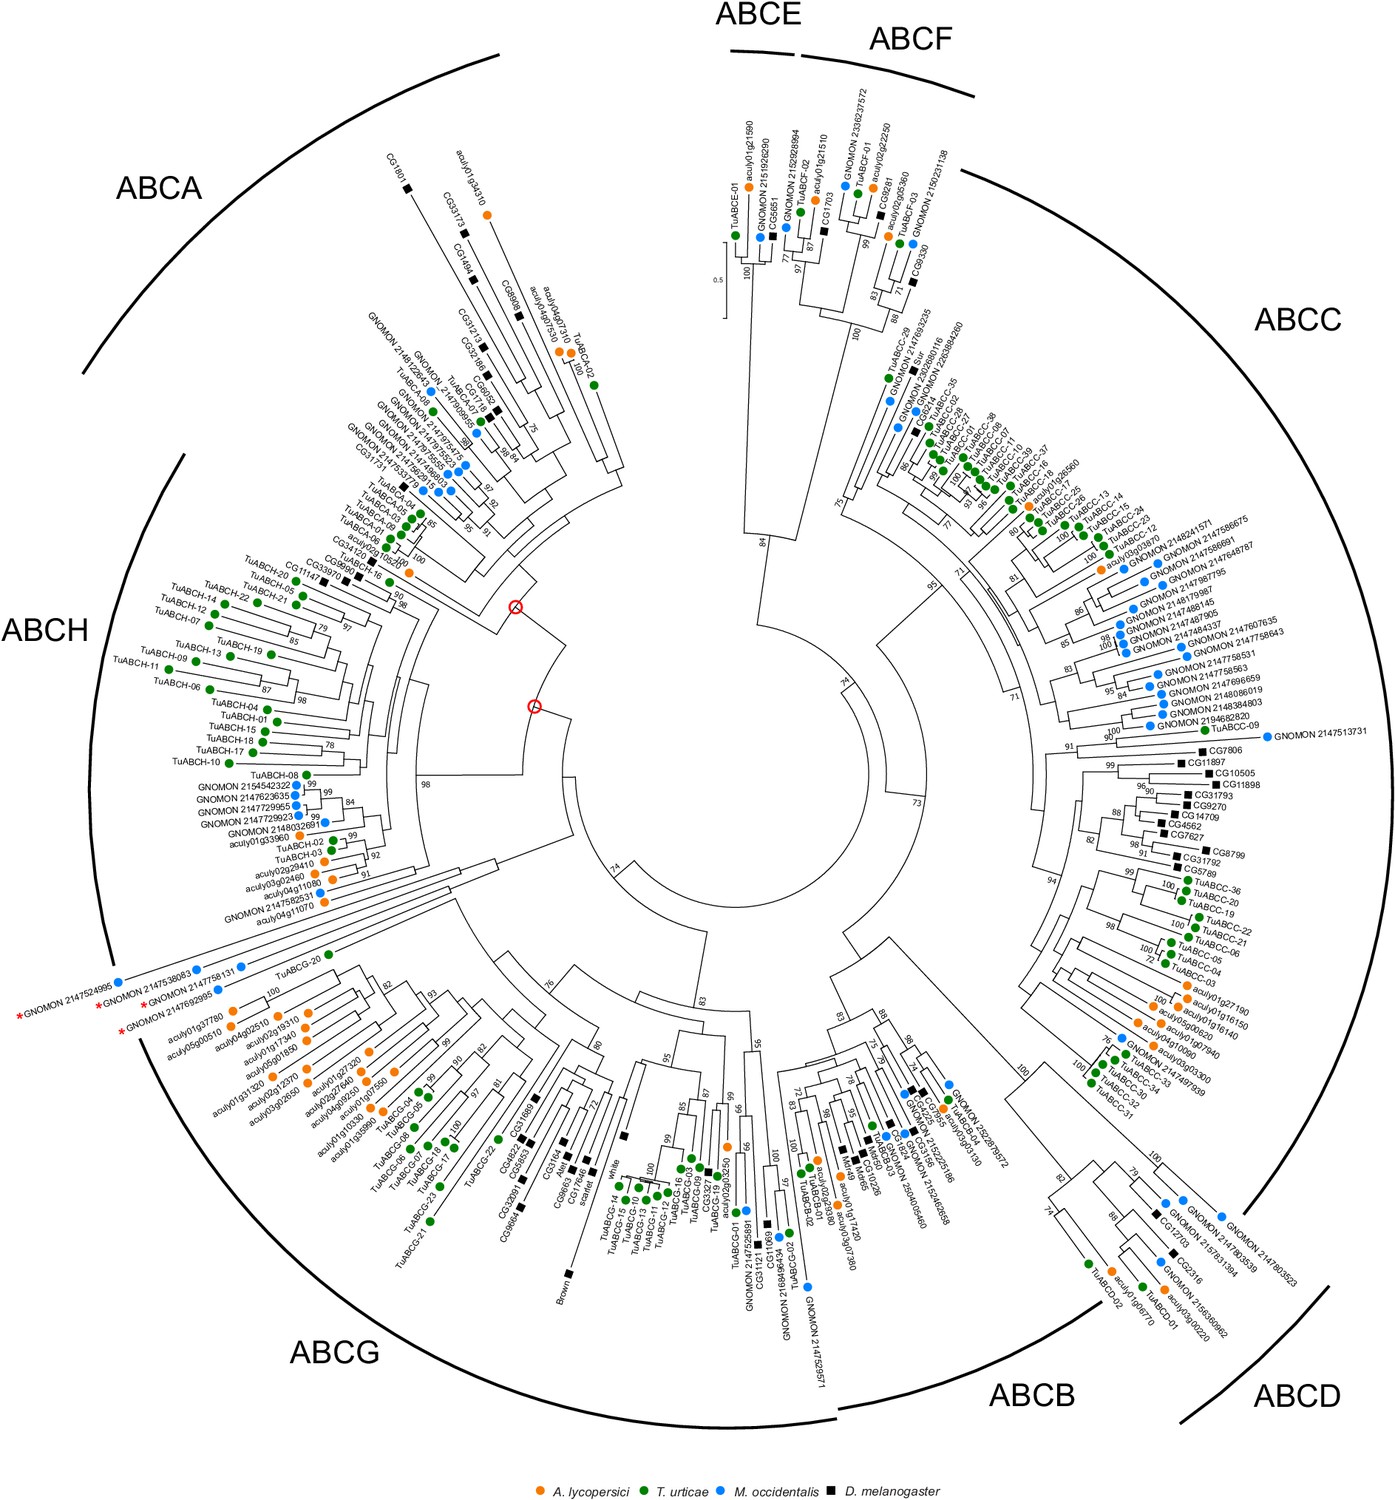
Phylogenetic analysis of nucleotide-binding domains of ABC proteins of A. lycopersici.
A midpoint rooted maximum likelihood tree is shown; the scale bar represents 0.5 substitutions per site, while numbers at nodes indicate bootstrap support based on 1000 replicates. Only bootstrap values above 70 are shown. The different ABC protein subfamilies are indicated with arches and a letter (A–H). It should be noted that when four atypical NBD sequences of M. occidentalis [indicated with a red asterisk; these only had BLASTp hits with sequences of species belonging to the Mesostigmata (Tropilaelaps mercedesae, Varroa sp. or M. occidentalis)] were not included in the phylogenetic analysis, the bootstrap values for the ABCA subfamily and the ABCA-ABCH nodes were both 90 (indicated with open red circles). Species are denoted by color as indicated in the legend at bottom (circles, chelicerates; square, an insect). The alignment used for phylogenetic inference can be found in Supplementary file 7.
Figure 4—figure supplement 5
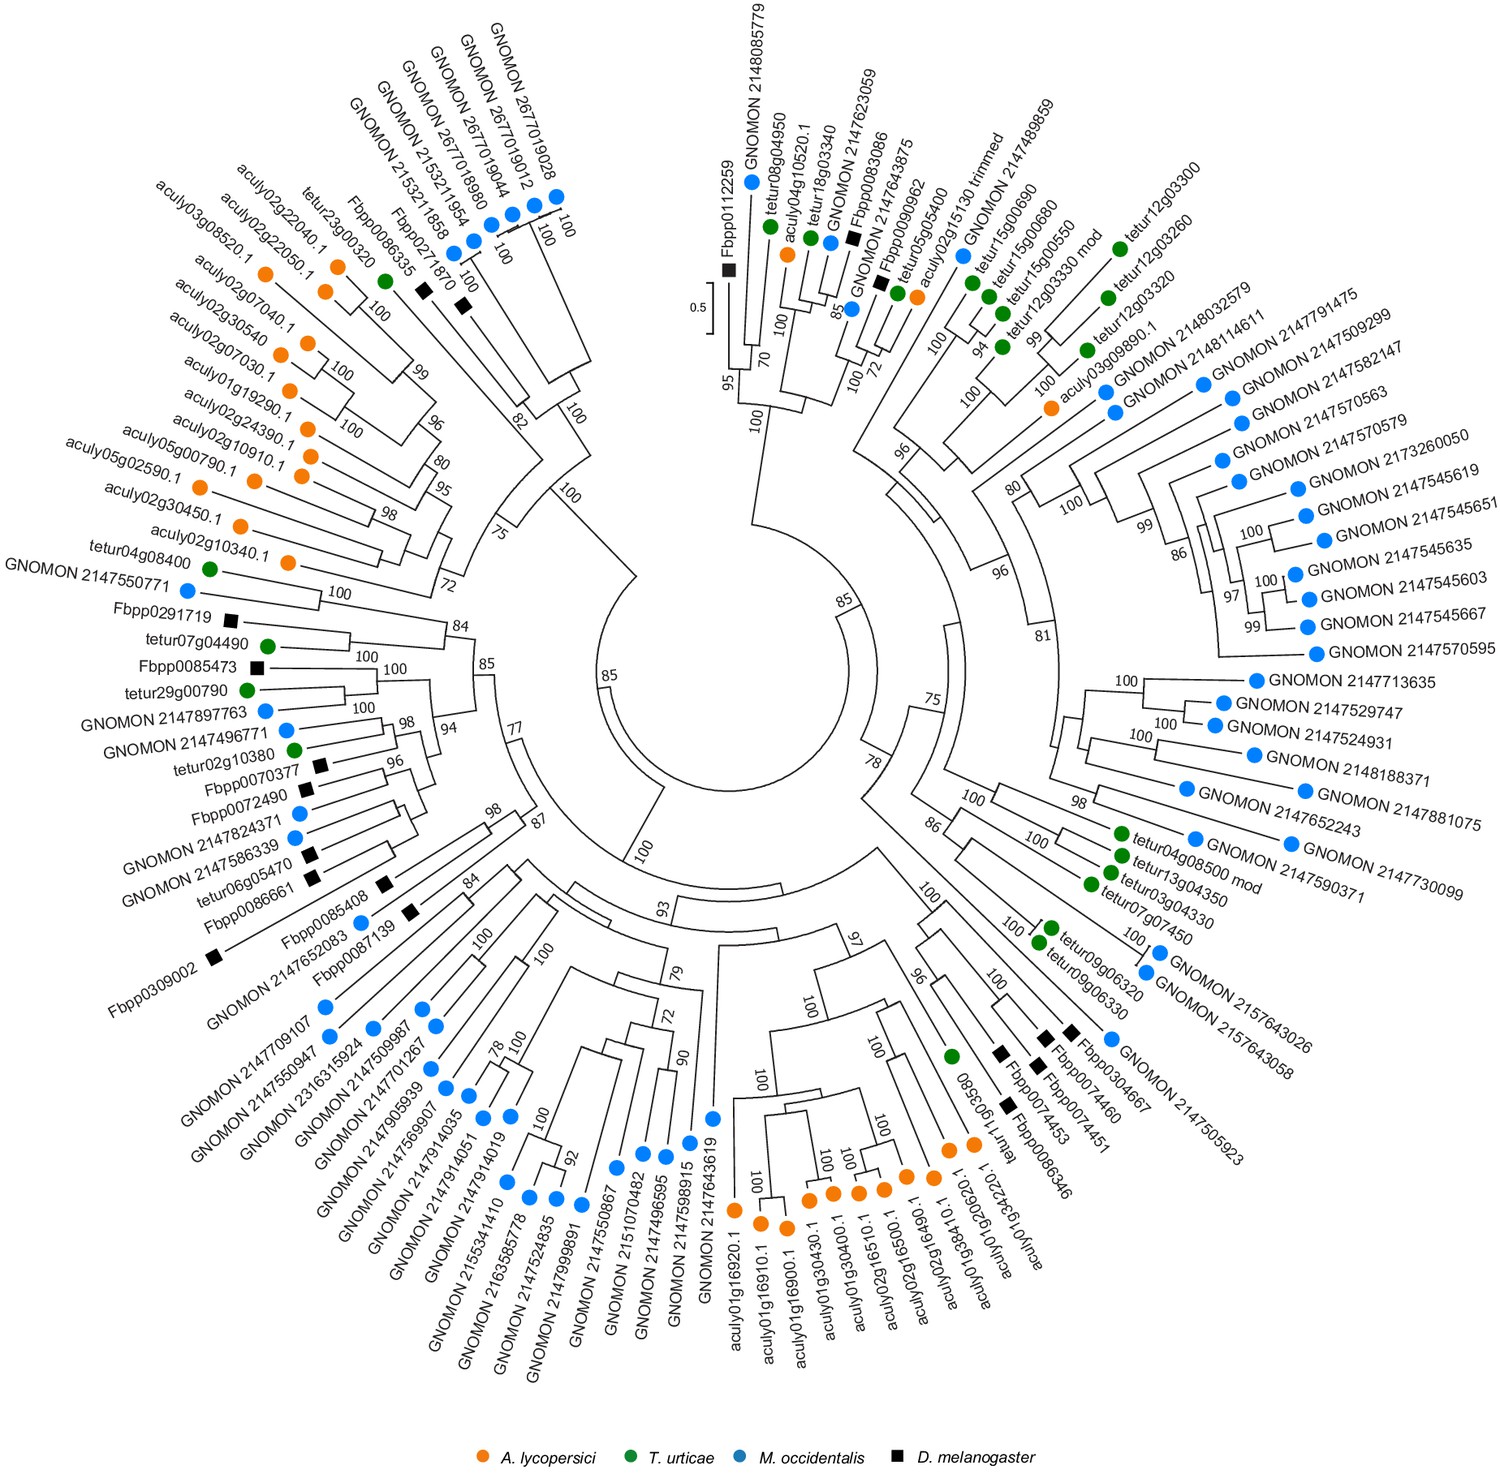
Phylogenetic analysis of MFS protein sequences of A. lycopersici.
A midpoint rooted maximum likelihood tree is shown; the scale bar represents 0.5 substitutions per site, while numbers at nodes indicate bootstrap support based on 1000 replicates. Only bootstrap values above 70 are shown. Species are denoted by color as indicated in the legend at bottom (circles, chelicerates; square, an insect). The alignment used for phylogenetic inference can be found in Supplementary file 7.
Figure 4—figure supplement 6
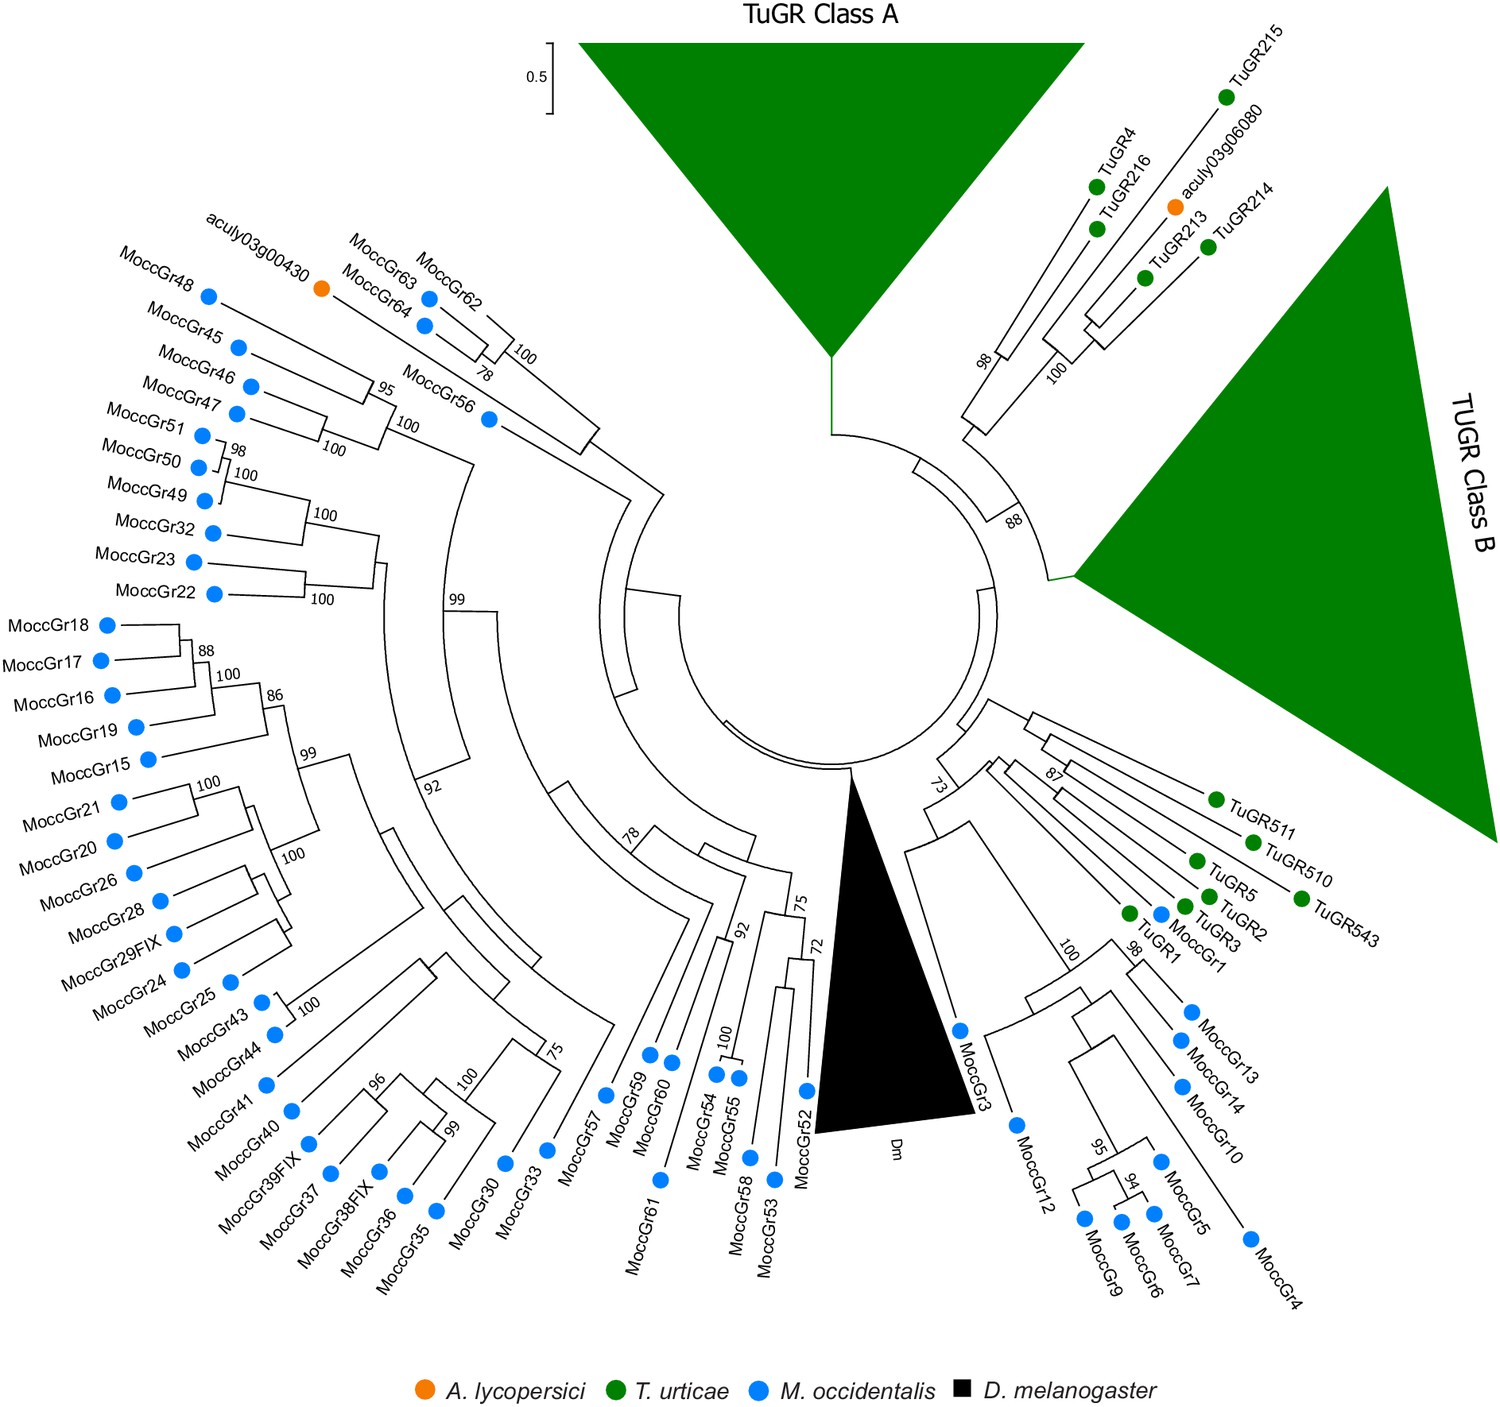
Phylogenetic analysis of GRs of A. lycopersici.
A midpoint rooted maximum likelihood tree is shown; the scale bar represents 0.5 substitutions per site, while numbers at nodes indicate bootstrap support based on 1000 replicates. The lineage-specific expansions of T. urticae Class A and B GRs and D. melanogaster (Dm) GRs were grouped (triangles) for clarity of display. Only bootstrap values above 70 are shown. Species are denoted by color as indicated in the legend at bottom (circles, chelicerates; square, an insect). The alignment used for phylogenetic inference can be found in Supplementary file 7.
Figure 4—figure supplement 7
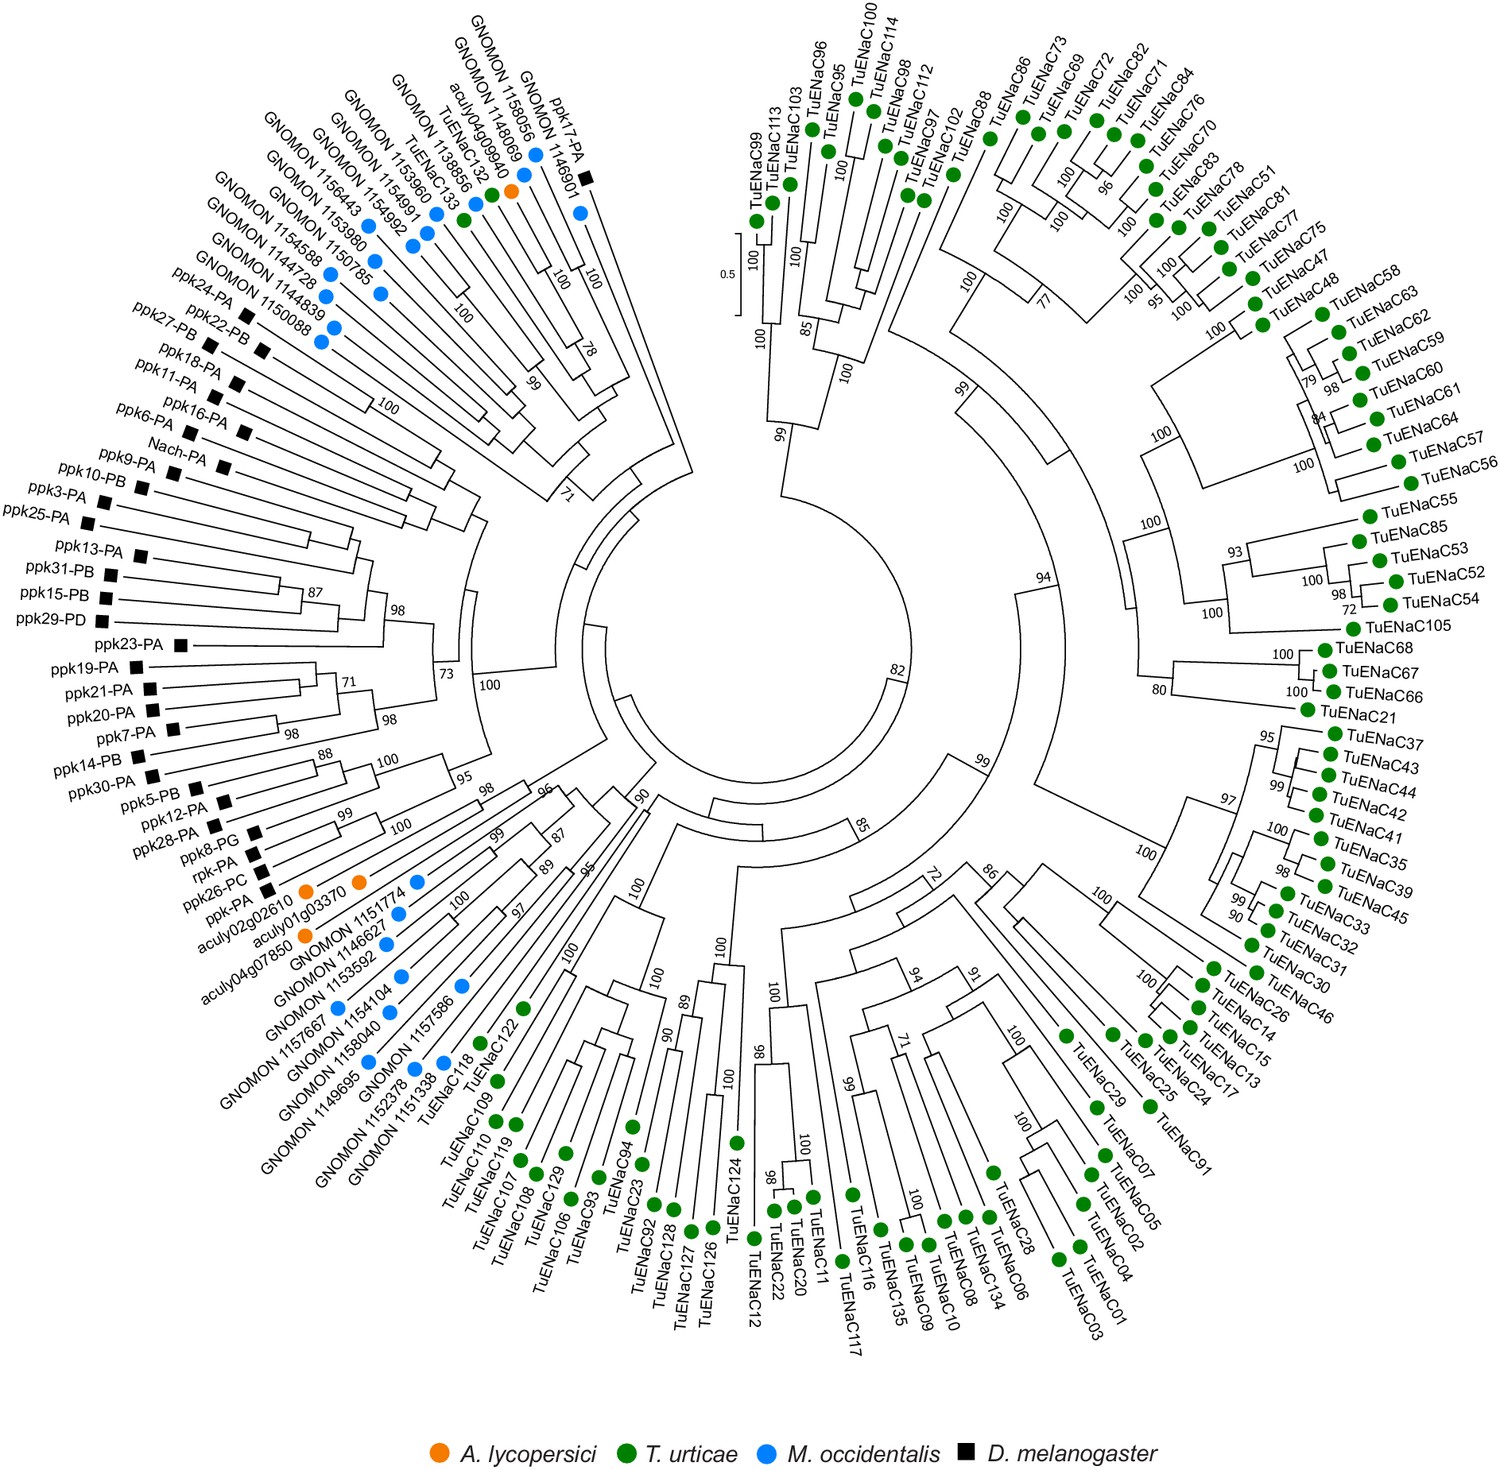
Phylogenetic analysis of ENaCs of A. lycopersici.
A midpoint rooted maximum likelihood tree is shown; the scale bar represents 0.5 substitutions per site, while numbers at nodes indicate bootstrap support based on 1000 replicates. Only bootstrap values above 70 are shown. Species are denoted by color as indicated in the legend at bottom (circles, chelicerates; square, an insect). The alignment used for phylogenetic inference can be found in Supplementary file 7.
Figure 4—figure supplement 8
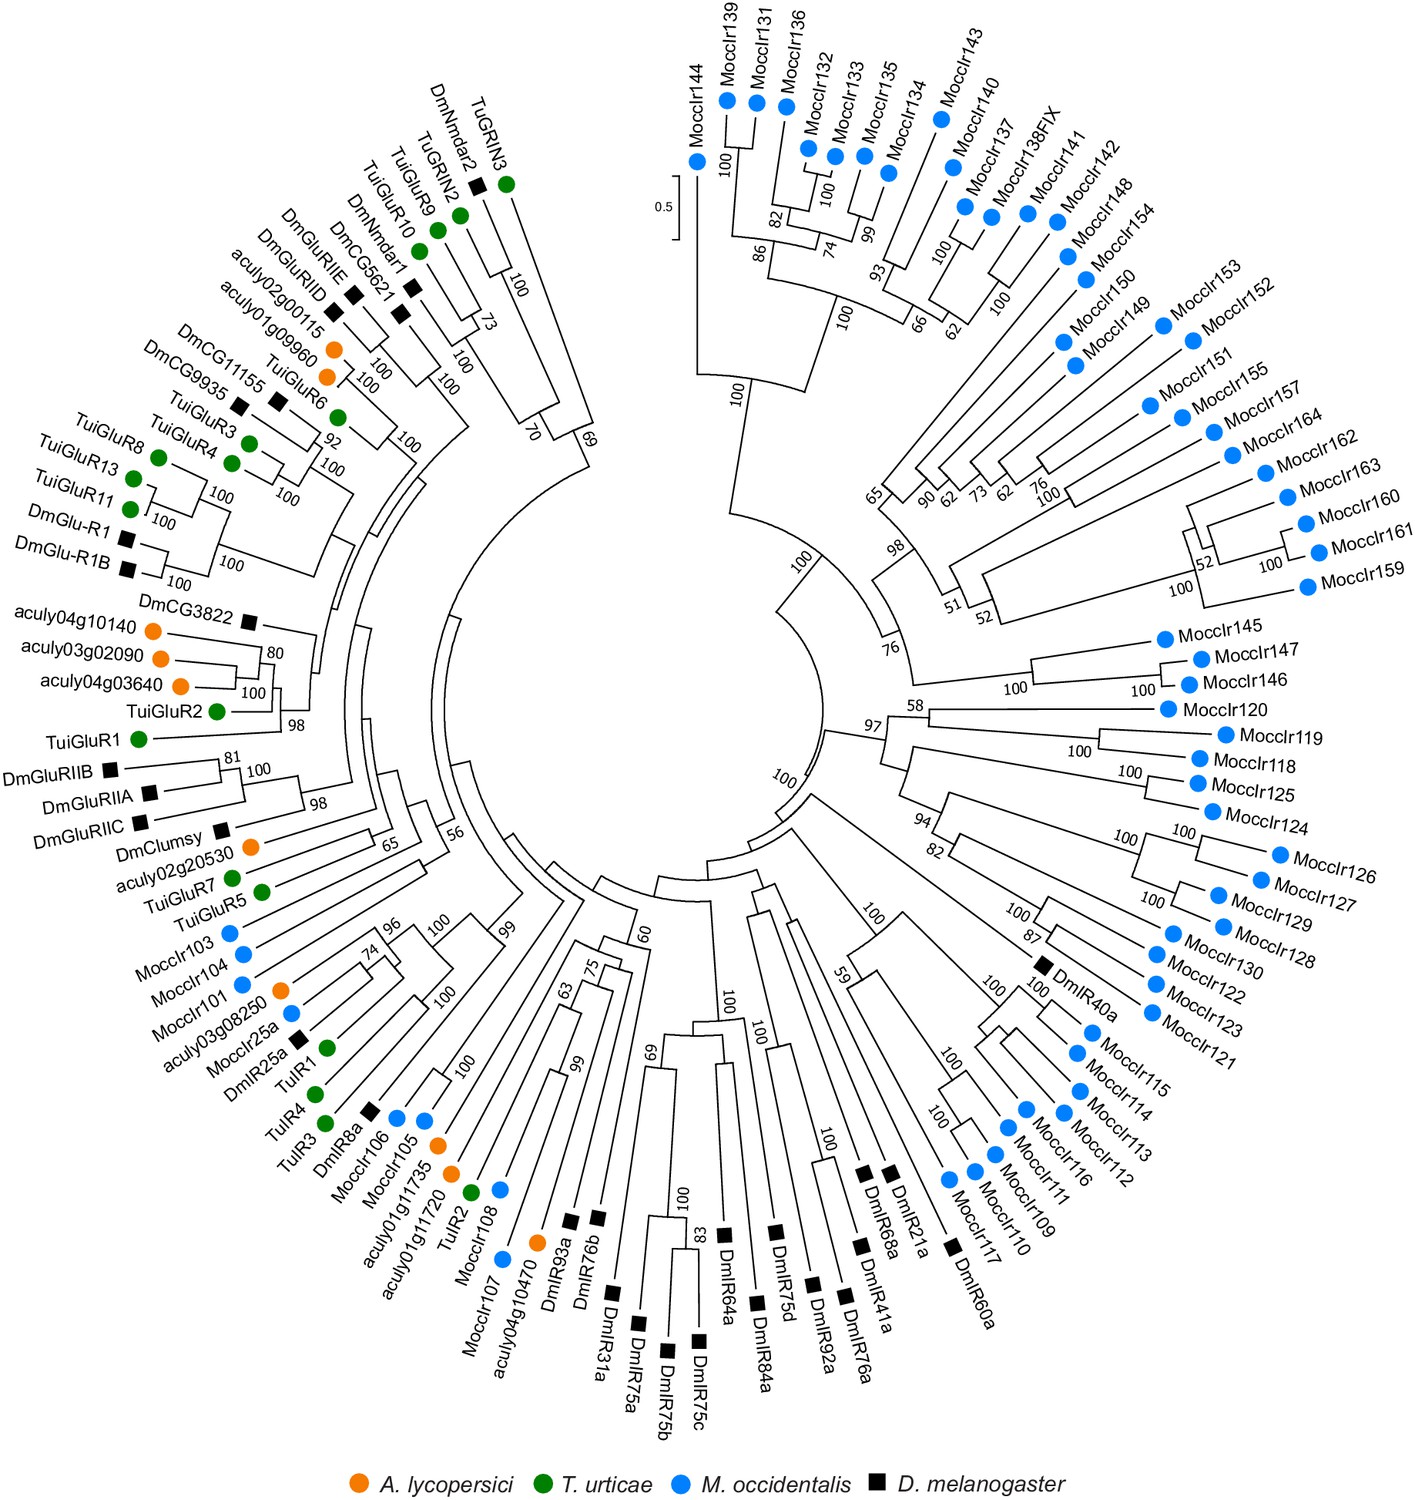
Phylogenetic analysis of ionotropic and related receptors of A. lycopersici.
A midpoint rooted maximum likelihood tree is shown; the scale bar represents 0.5 substitutions per site, while numbers at nodes indicate bootstrap support based on 1000 replicates. Only bootstrap values above 50 are shown. For M. occidentalis, only ionotropic receptor sequences were available for download from Hoy et al., 2016, and were therefore included in the analysis. Four A. lycopersici protein sequences fall in clades with ionotropic receptors (IR) from other mites or D. melanogaster (aculy03g08250, aculy01g11735, aculy01g11720, and aculy04g10470), while the remaining five A. lycopersici sequences fall in clades suggestive of iGluRs, see also Hoy et al., 2016 and Ngoc et al., 2016. However, bootstrap support for some basal nodes is low (for instance, the placement of aculy02g20530 is unclear). Species are denoted by color as indicated in the legend at bottom (circles, chelicerates; square, an insect). The alignment used for phylogenetic inference can be found in Supplementary file 7.
Figure 4—figure supplement 9
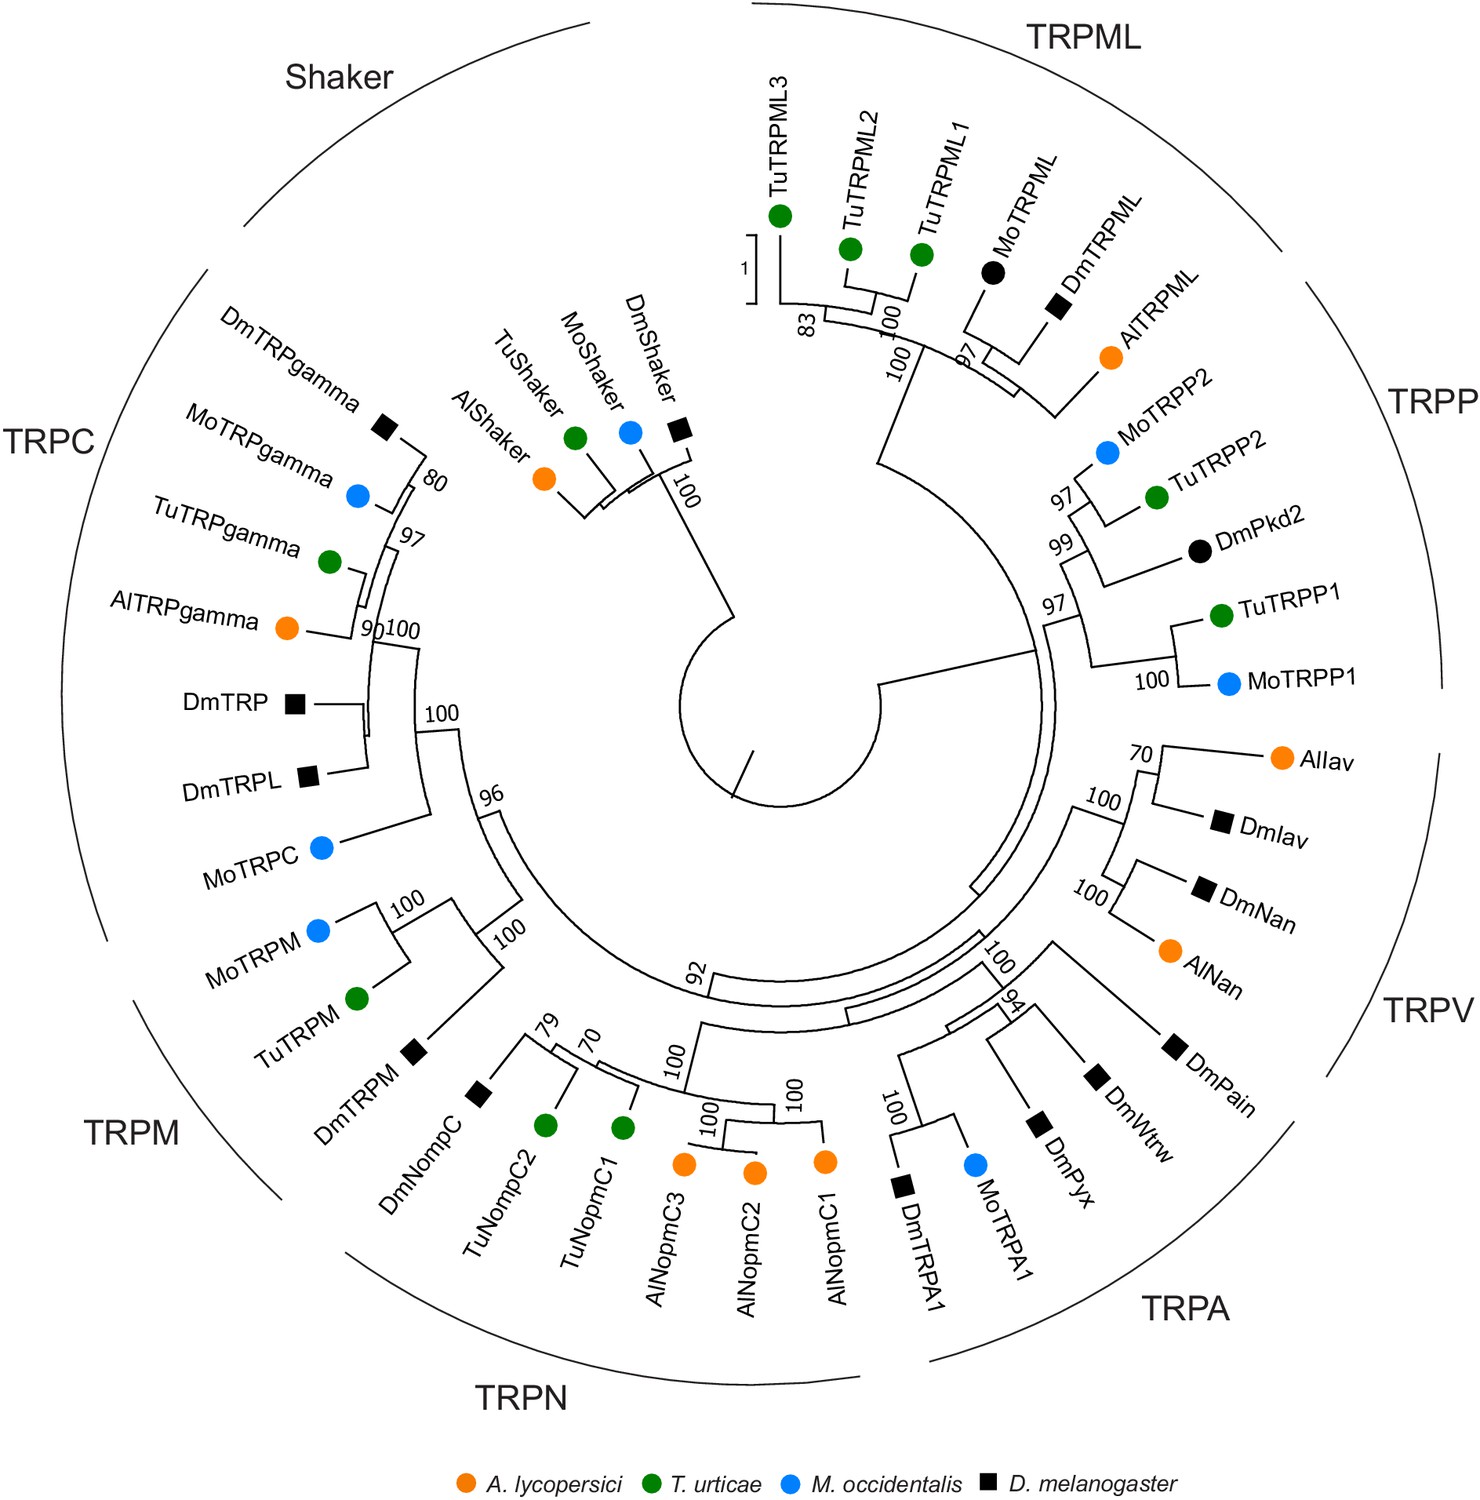
Phylogenetic analysis of TRP channels of A. lycopersici.
A rooted maximum likelihood tree is shown; the scale bar represents 0.5 substitutions per site while numbers at nodes indicate bootstrap support based on 1000 replicates. The Shaker family was used as an outgroup to root the tree, with naming following that of Peng et al., 2015. Only bootstrap values above or equal to 70 are shown. Species are denoted by color as indicated in the legend at bottom (circles, chelicerates; square, an insect). The alignment used for phylogenetic inference can be found in Supplementary file 7.
Figure 4—figure supplement 10
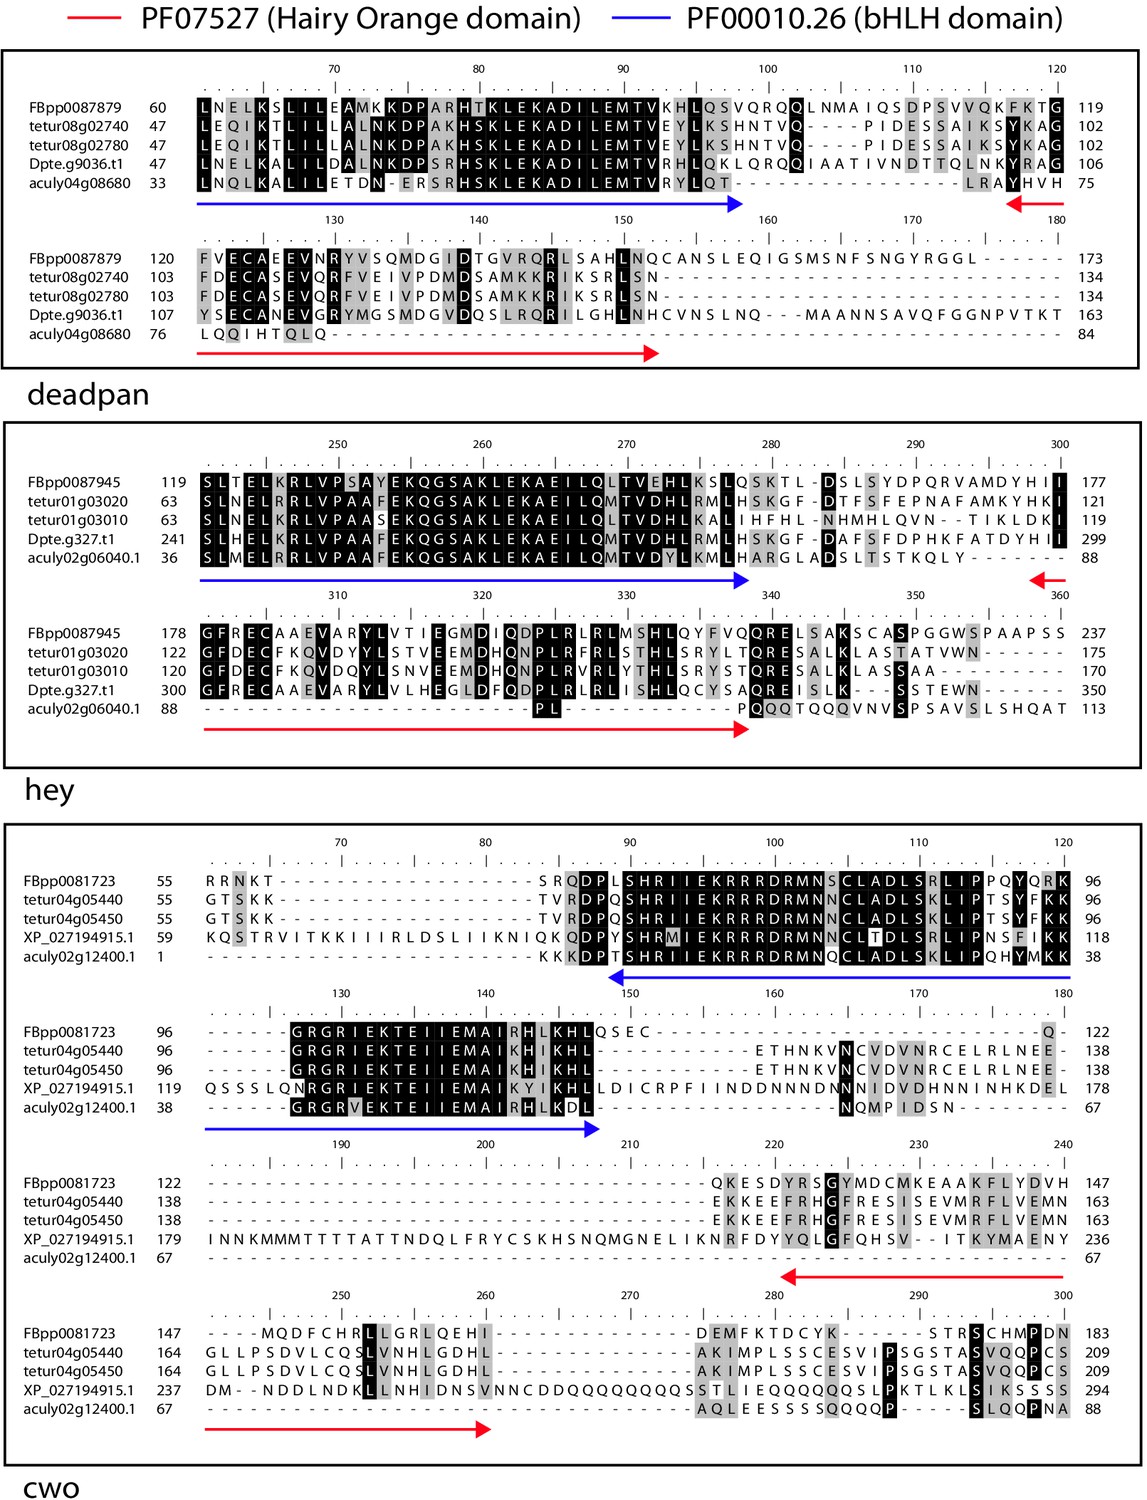
Alignment of the Hairy Orange domain region from deadpan, hey and cwo proteins of A. lycopersici, D. pteronyssinus, and T. urticae with deadpan, hey and cwo of D. melanogaster.
The Hairy Orange and the Basic helix loop helix (bHLH) domains of D. melanogaster are indicated with red and blue, double-headed arrows, respectively. While D. pteronysinnus cwo could not be identified in the D. pteronyssinus annotation that we used for the primary analyses presented in this study (for instance, Table 1), it could be identified in the RefSeq annoation for this genome (XP_027194915.1). A 75% threshold was used for identity (black background) and similarity shading (gray background). Sequence accesssions beginning with ‘FBpp’ are from D. melanogaster, those beginning with ‘tetur’ are from T. urticae, those beginning with ‘Dpte’ or ‘XP_’ are from D. pteronysinnus, and those beginning with ‘aculy’ are from A. lycopersici.
Figure 4—figure supplement 11
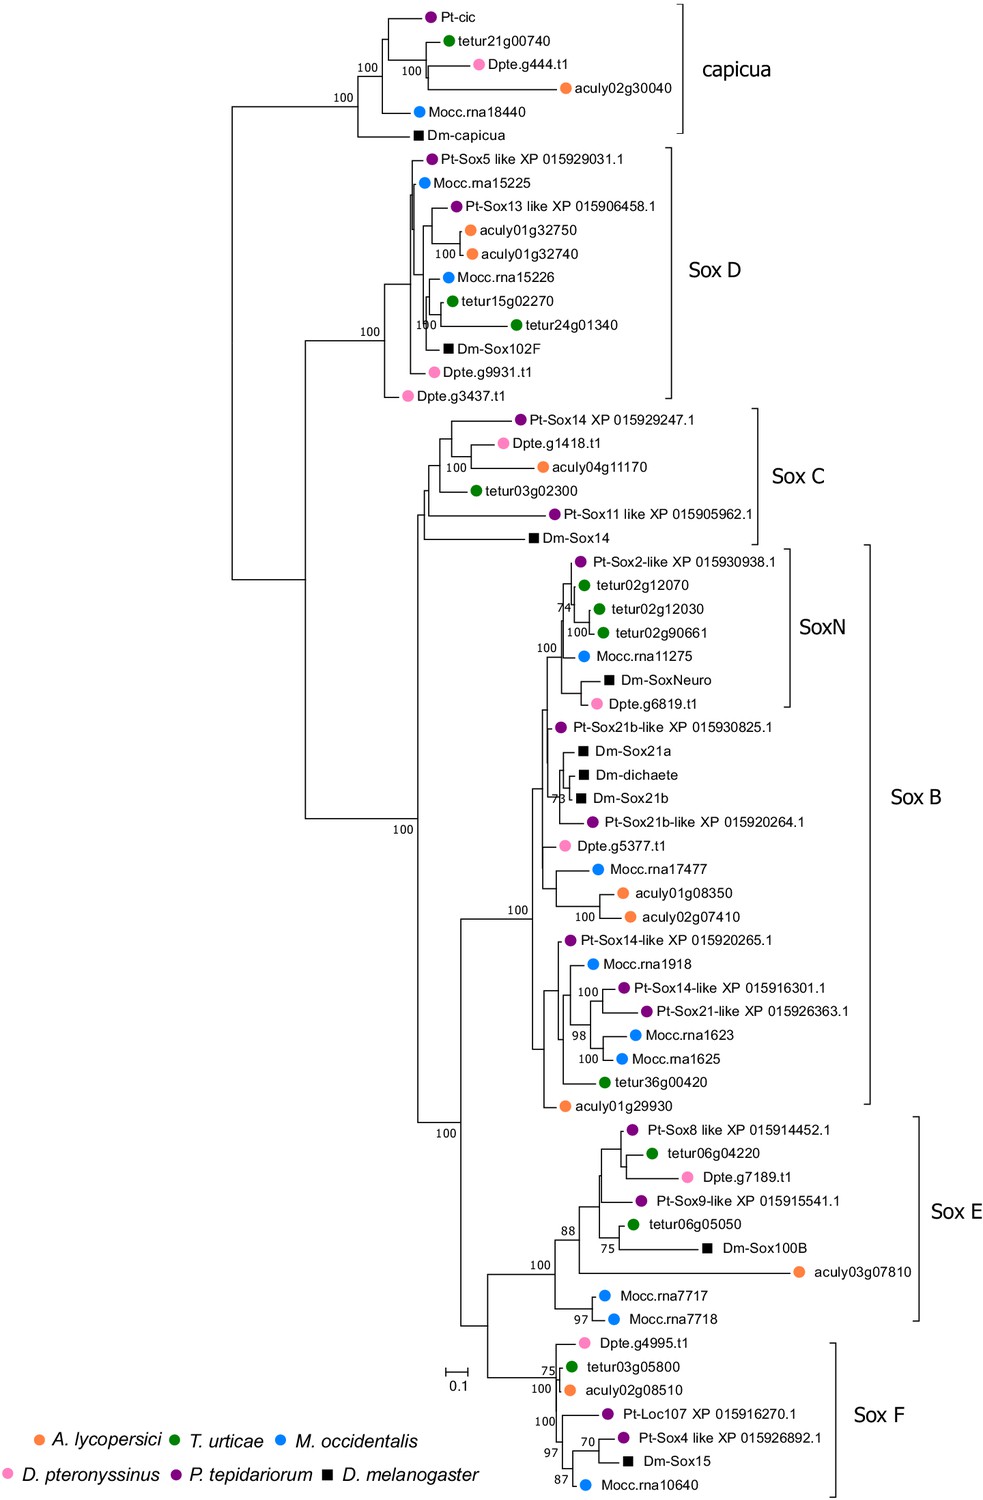
Bayesian phylogenetic analysis of A. lycopersici Sox proteins.
A Bayesian tree is shown and was rooted with capicua proteins, a HMG-box domain protein that is used as an outgroup in phylogenetic analyses of the Sox family of HMG-box domain proteins Janssen et al., 2018; the scale bar represents 0.1 substitutions per site, while numbers at nodes indicate Bayessian Posterior Probabilities (% support) based on 750 sampled trees (only values above or equal to 70 are shown). A. lycopersici proteins were assigned to the Sox B, C, D E, and F classes (Janssen et al., 2018) as shown. A SoxNeuro (SoxN) orthologue was not identified in the A. lycopersici genome. Species are denoted by color as indicated in the legend at the bottom left (circles, chelicerates; square, an insect). The alignment used for phylogenetic inference can be found in Supplementary file 7.
Figure 4—figure supplement 12
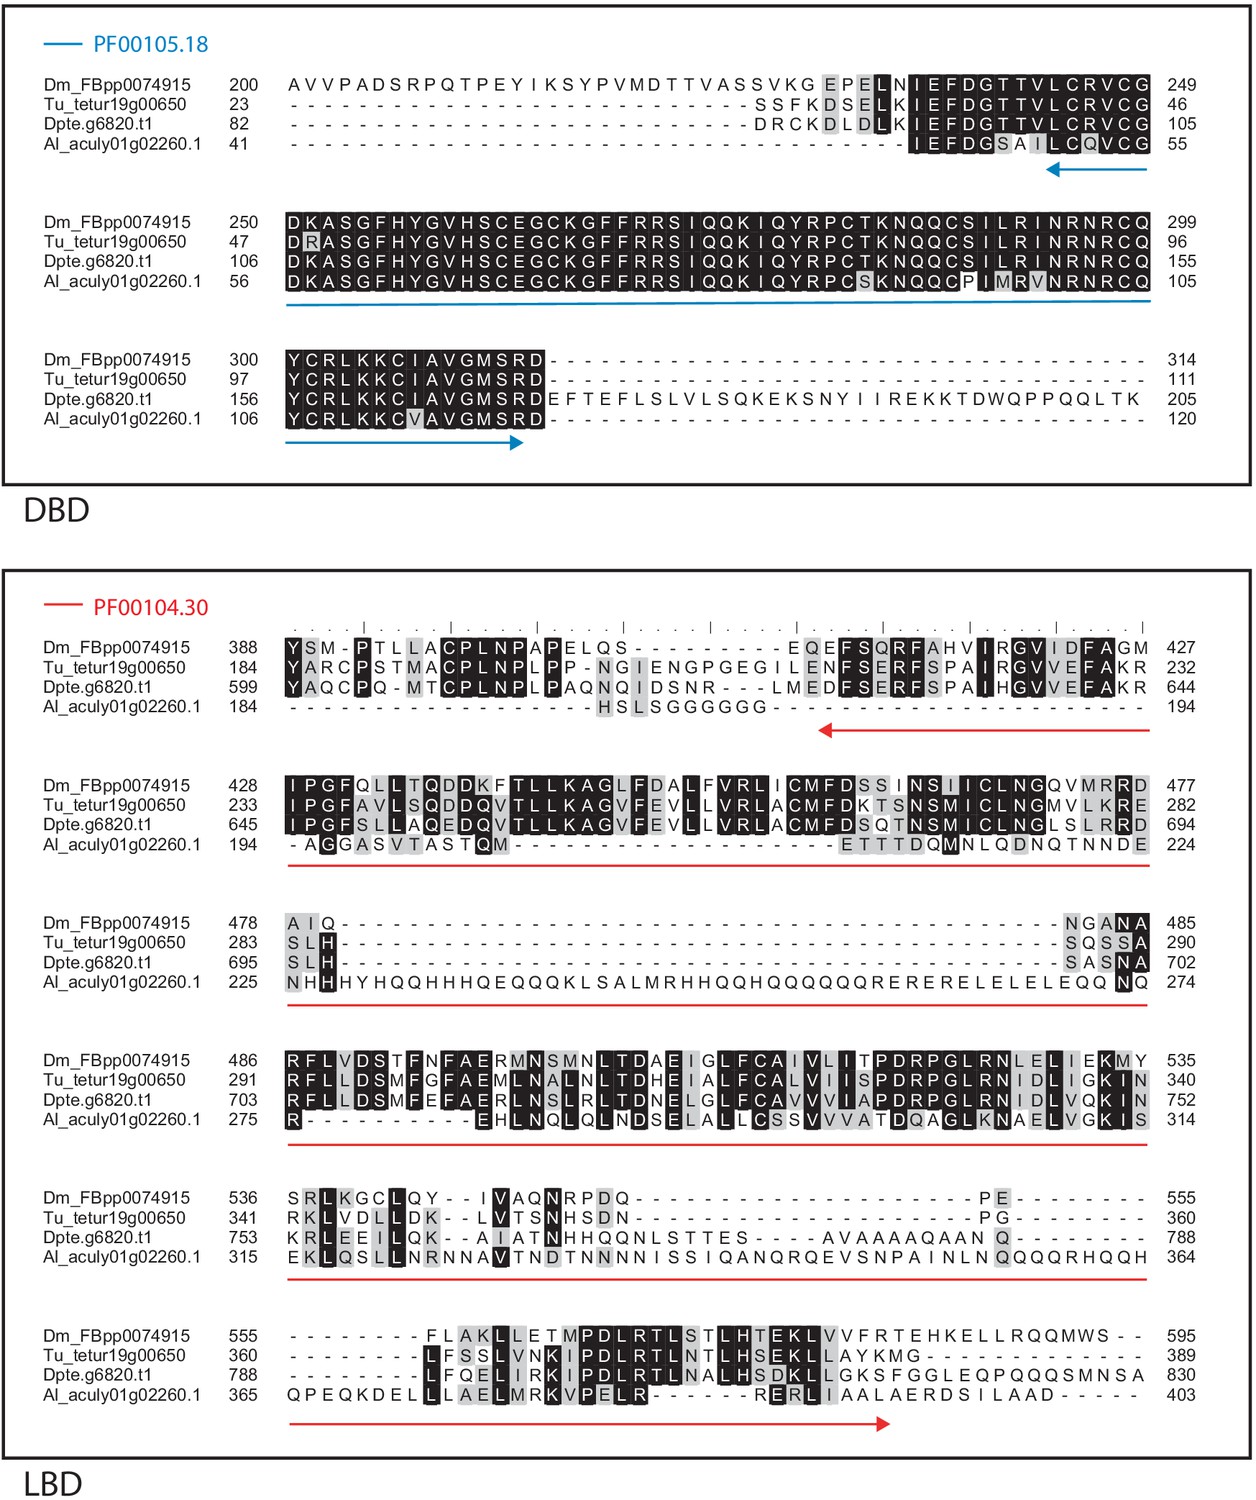
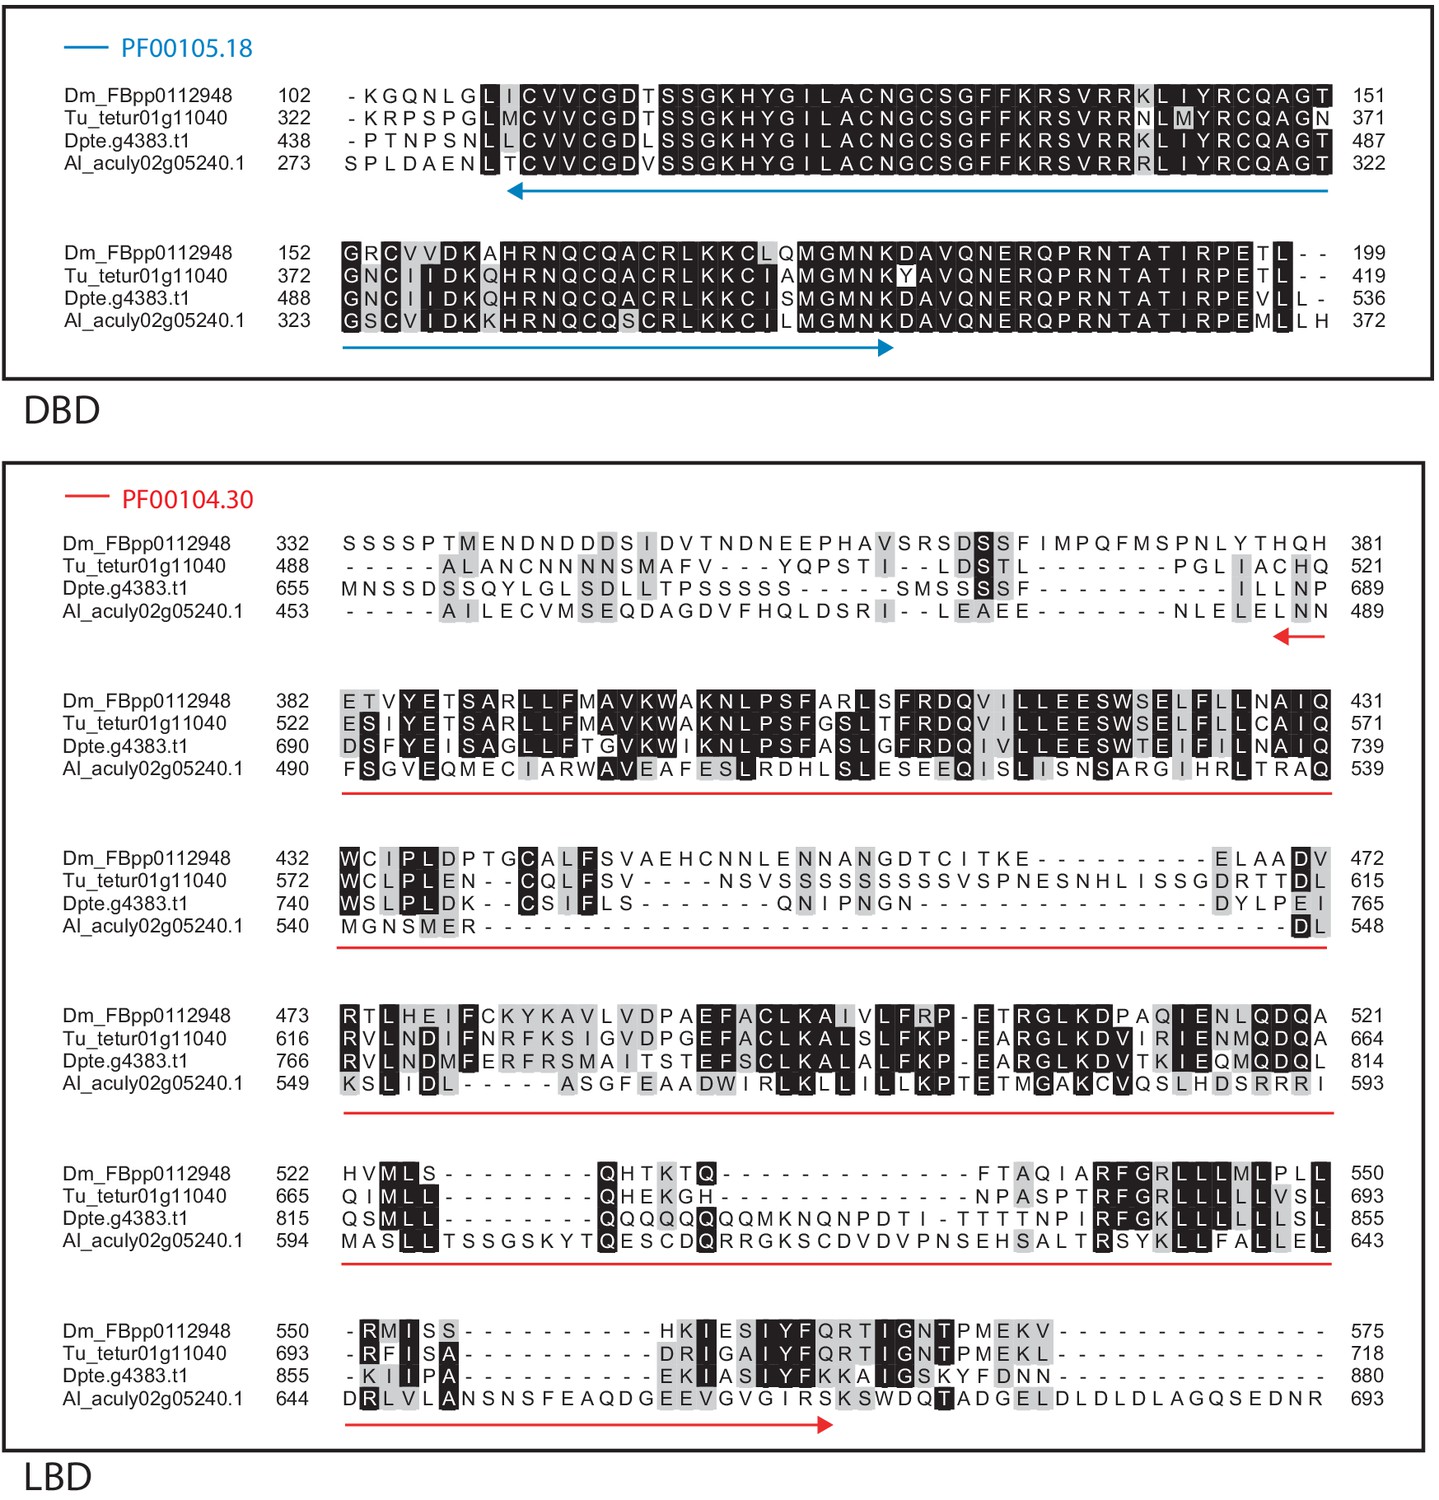
Alignment of the DNA-binding domain and the ligand-binding domain region of D. melanogaster E75 with those of T. urticae, D. pteronyssinus and A. lycopersici.
Alignments for the DNA-binding domain (DBD) and the ligand-binding domain (LBD) are shown at top and bottom, respectively. The DBD domain (PF00105) in the DBD region of the D. melanogaster sequence is indicated with a blue double-headed arrow (top), while the LBD domain (PF00104) in the LBD region of the D. melanogaster sequence is indicated with a red double-headed arrow (bottom). A 75% threshold was used for identity (black background) and similarity shading (gray background). Sequences from D. melanogaster, T. urticae, D. pteronyssinus, and A. lycopersici are prefixed with ‘Dm’, ‘Tu’, ‘Dpte’, and ‘Al’, respectively.
Figure 4—figure supplement 13
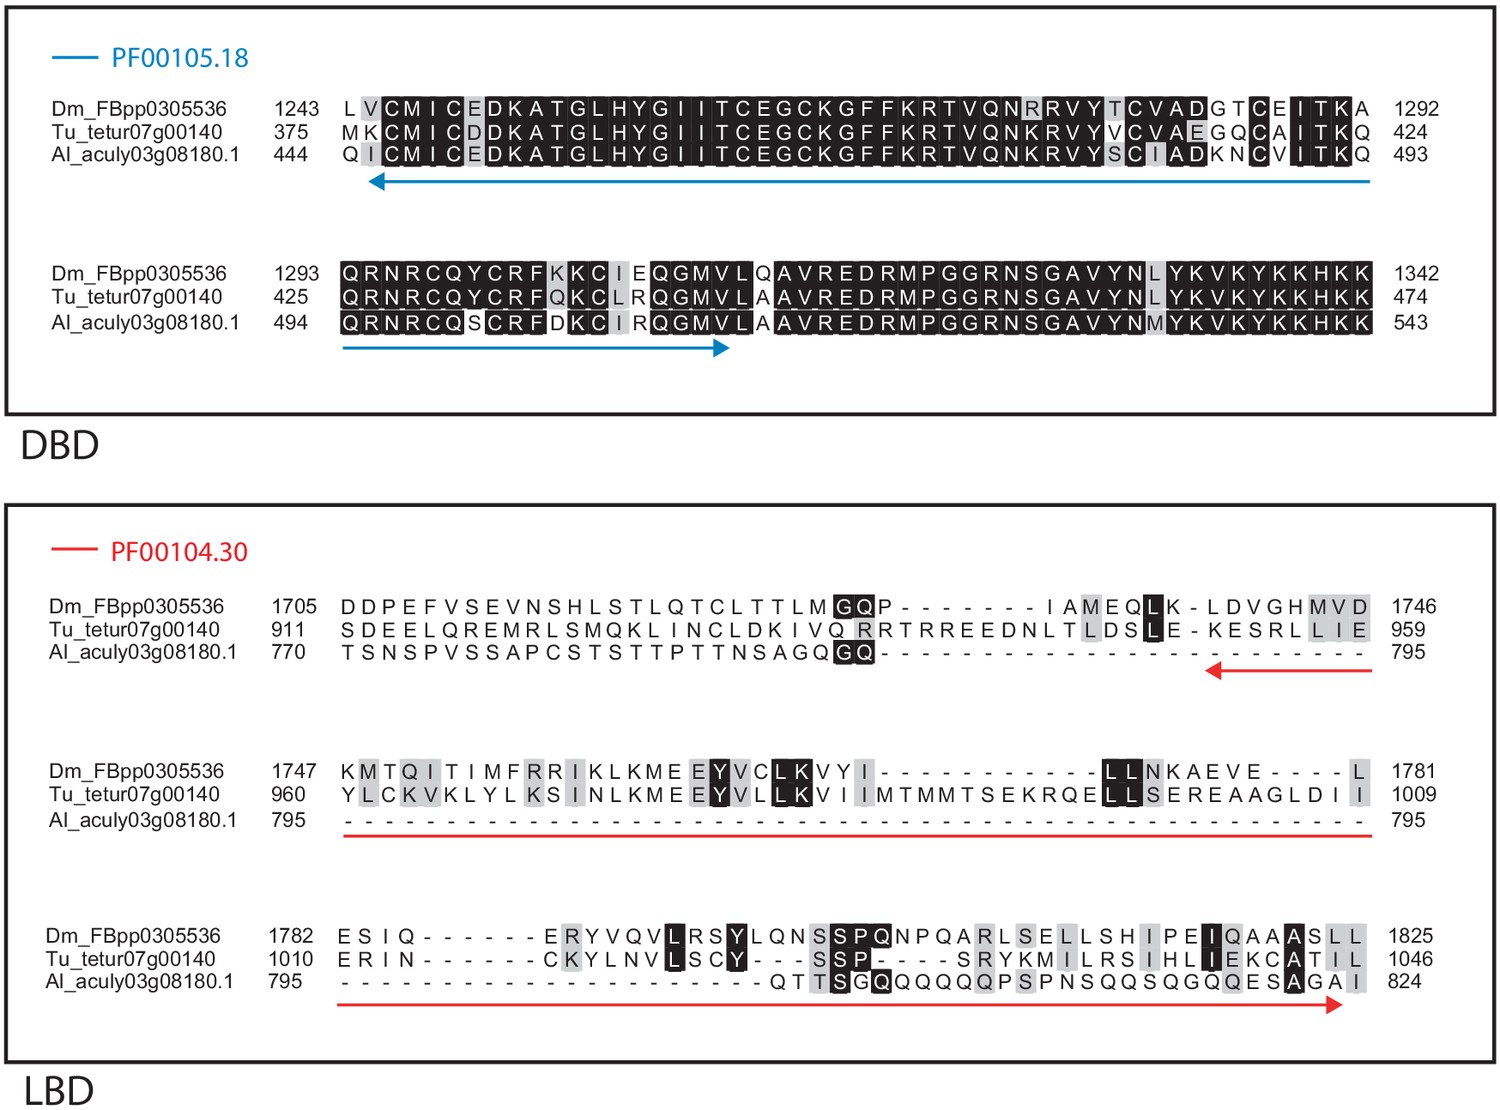
Alignment of the DNA-binding domain and the ligand-binding domain region of D. melanogaster HR4 with those of T. urticae and A. lycopersici.
Alignments for the DNA-binding domain (DBD) and the ligand-binding domain (LBD) are shown at top and bottom, respectively. The DBD domain (PF00105) in the DBD region of the D. melanogaster sequence is indicated with a blue double-headed arrow (top), while the LBD domain (PF00104) in the LBD region of the D. melanogaster sequence is indicated with a red double-headed arrow (bottom). A 75% threshold was used for identity (black background) and similarity shading (gray background). Sequences from D. melanogaster, T. urticae, and A. lycopersici are prefixed with ‘Dm’, ‘Tu’, and ‘Al’, respectively.
Figure 4—figure supplement 14
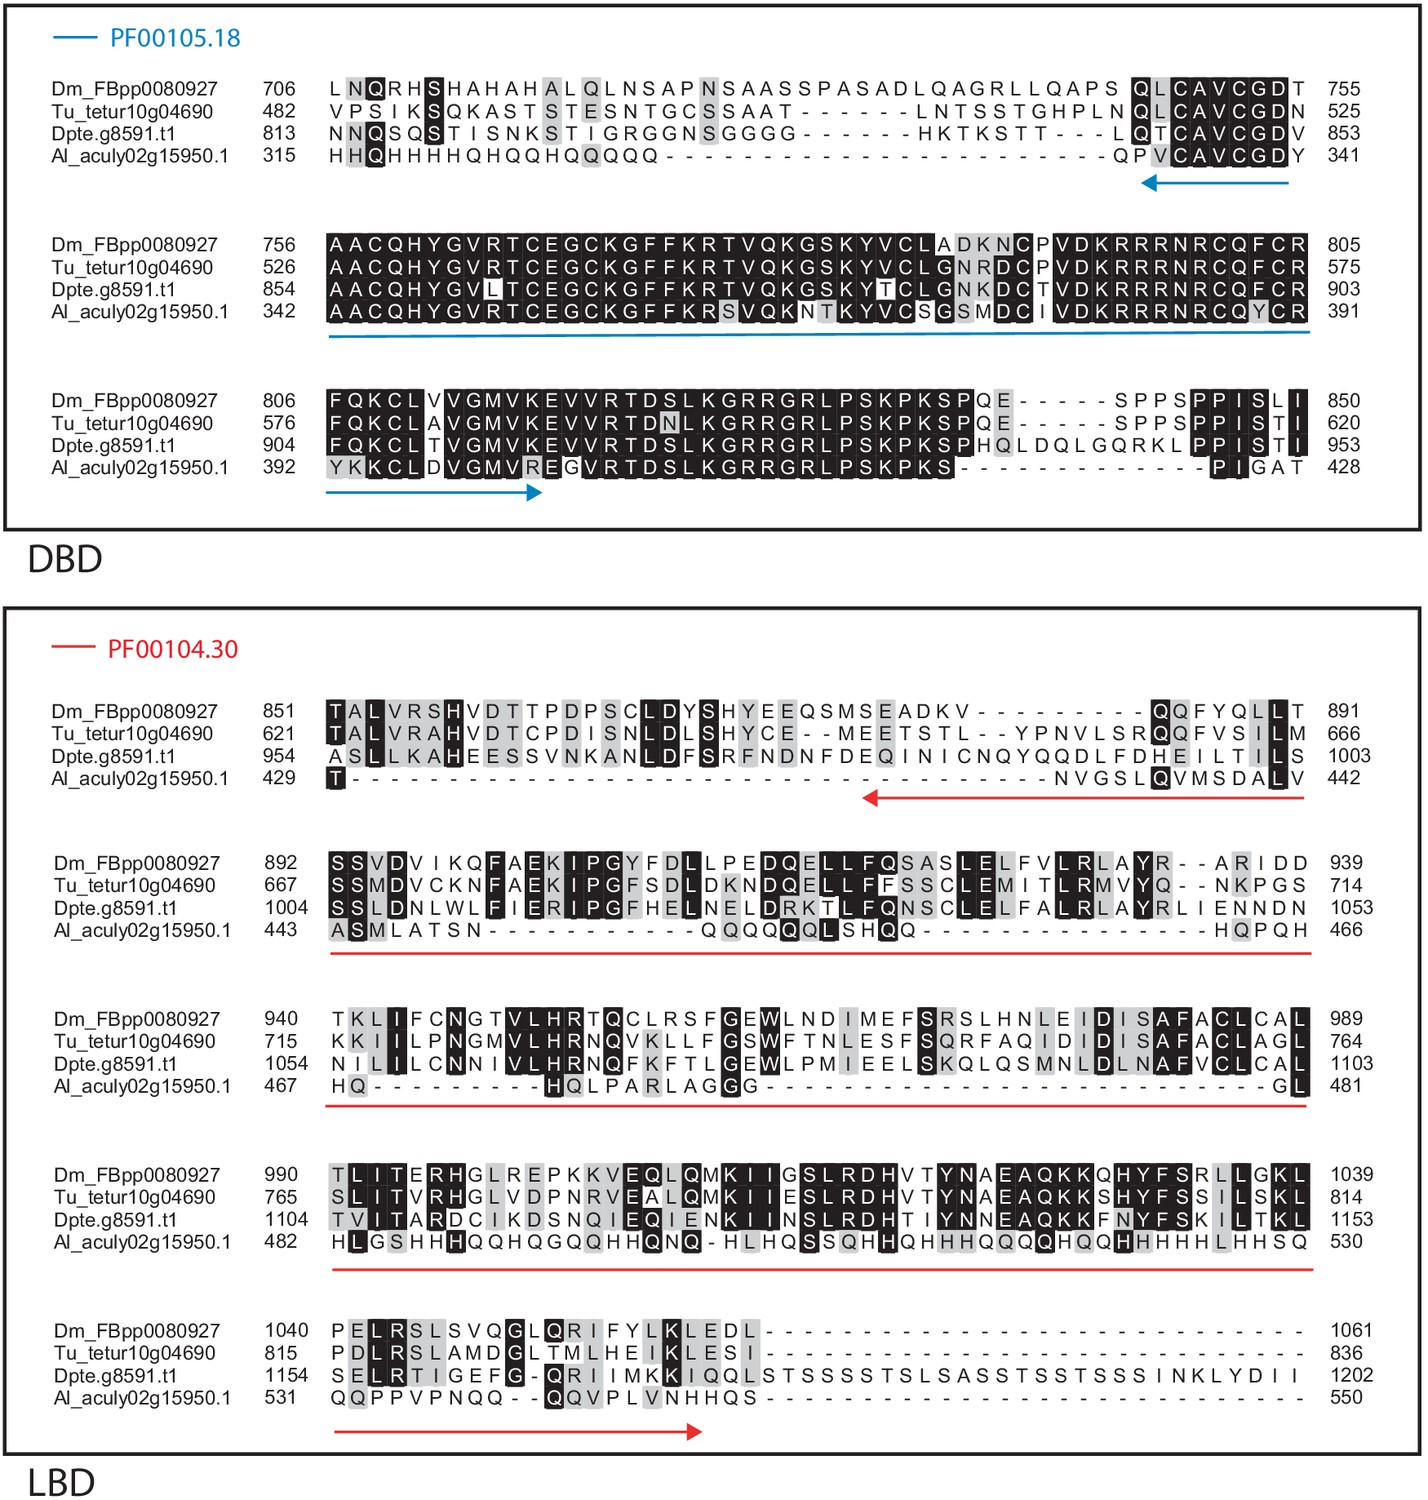
Alignment of the DNA-binding domain and the ligand-binding domain region of D. melanogaster HR38 with those of T. urticae, D. pteronyssinus and A. lycopersici.
Alignments for the DNA-binding domain (DBD) and the ligand-binding domain (LBD) are shown at top and bottom, respectively. The DBD domain (PF00105) in the DBD region of the D. melanogaster sequence is indicated with a blue double-headed arrow (top), while the LBD domain (PF00104) in the LBD region of the D. melanogaster sequence is indicated with a red double-headed arrow (bottom). A 75% threshold was used for identity (black background) and similarity shading (gray background). Sequences from D. melanogaster, T. urticae, D. pteronyssinus, and A. lycopersici are prefixed with ‘Dm’, ‘Tu’, ‘Dpte’, and ‘Al’, respectively.
Figure 4—figure supplement 15
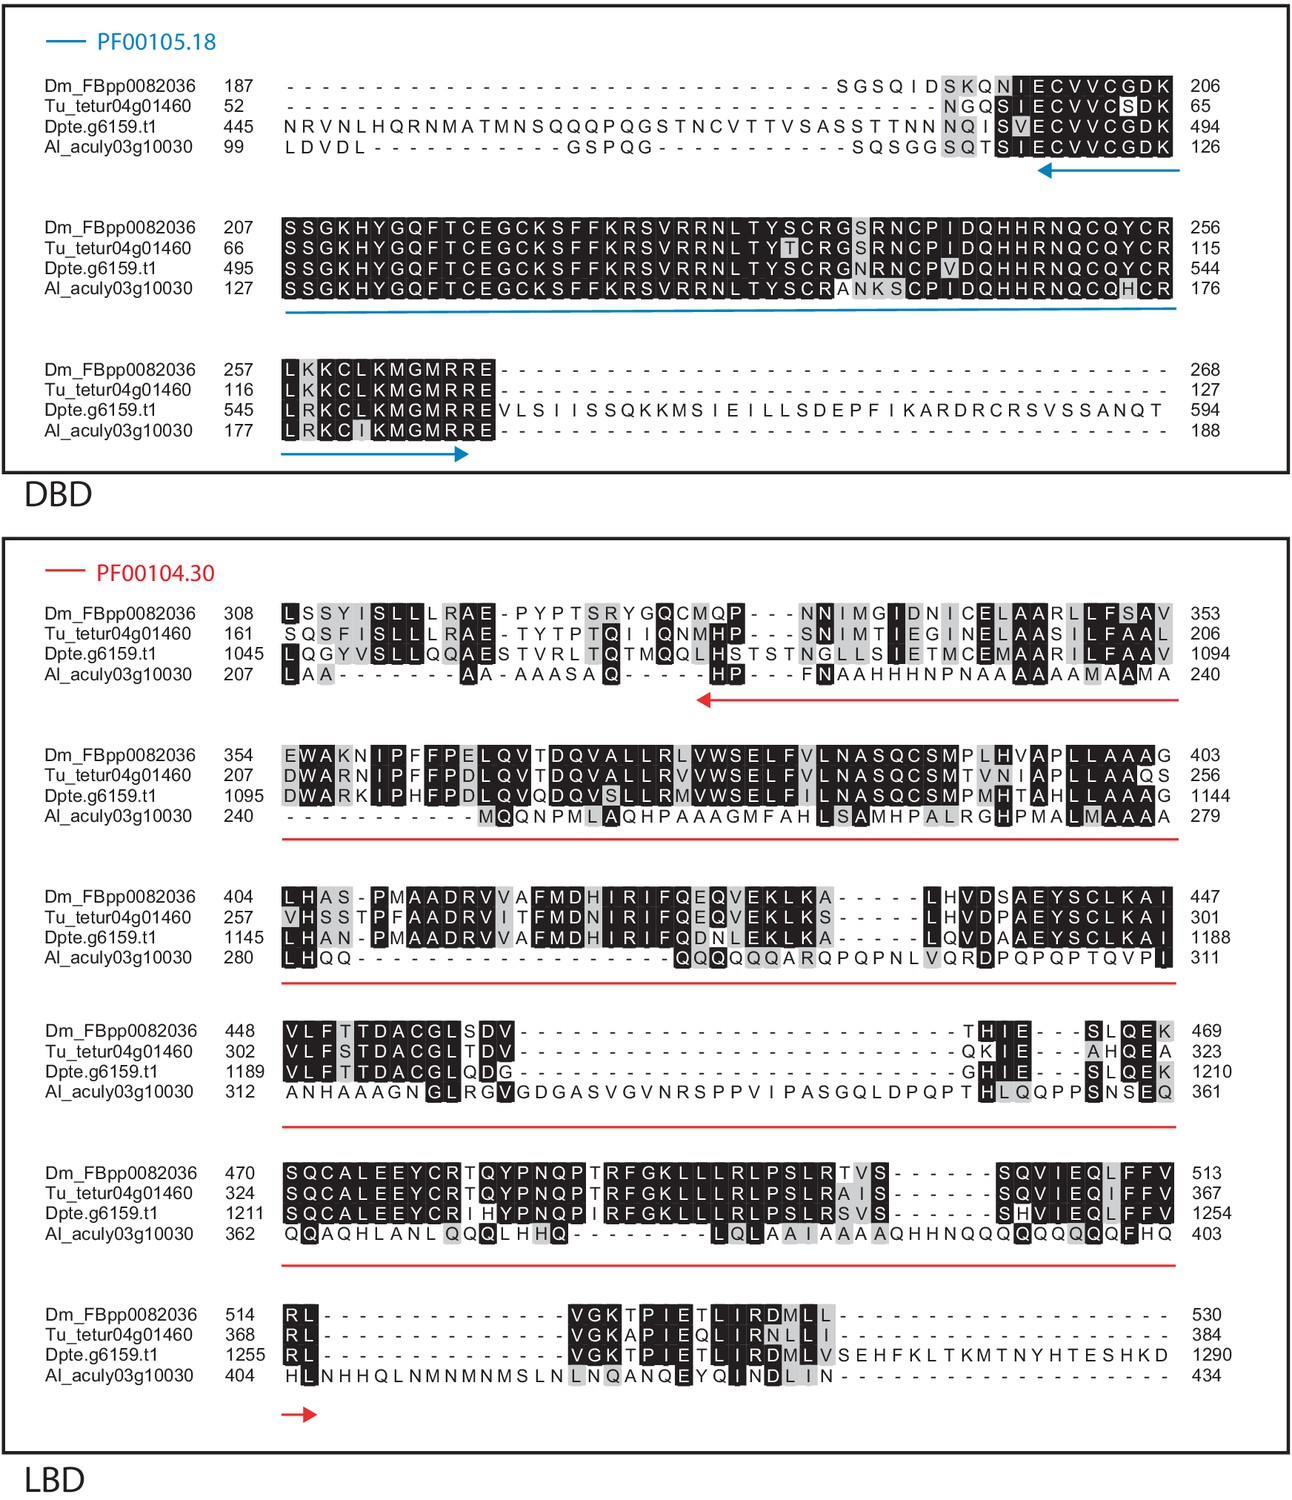
Alignment of the DNA-binding domain and the ligand-binding domain region of D. melanogaster HR51 with those of T. urticae, D. pteronyssinus, and A. lycopersici.
Alignments for the DNA-binding domain (DBD) and the ligand-binding domain (LBD) are shown at top and bottom, respectively. The DBD domain (PF00105) in the DBD region of the D. melanogaster sequence is indicated with a blue double-headed arrow (top), while the LBD domain (PF00104) in the LBD region of the D. melanogaster sequence is indicated with a red double-headed arrow (bottom). A 75% threshold was used for identity (black background) and similarity shading (gray background). Sequences from D. melanogaster, T. urticae, D. pteronyssinus, and A. lycopersici are prefixed with ‘Dm’, ‘Tu’, ‘Dpte’, and ‘Al’, respectively.
Figure 4—figure supplement 16
Alignment of the DNA-binding domain and the ligand-binding domain region of D. melanogaster SVP with those of T. urticae, D. pteronyssinus, and A. lycopersici.
Alignments for the DNA-binding domain (DBD) and the ligand-binding domain (LBD) are shown at top and bottom, respectively. The DBD domain (PF00105) in the DBD region of the D. melanogaster sequence is indicated with a blue double-headed arrow (top), while the LBD domain (PF00104) in the LBD region of the D. melanogaster sequence is indicated with a red double-headed arrow (bottom). A 75% threshold was used for identity (black background) and similarity shading (gray background). Sequences from D. melanogaster, T. urticae, D. pteronyssinus, and A. lycopersici are prefixed with ‘Dm’, ‘Tu’, ‘Dpte’, and ‘Al’, respectively.
Figure 4—figure supplement 17
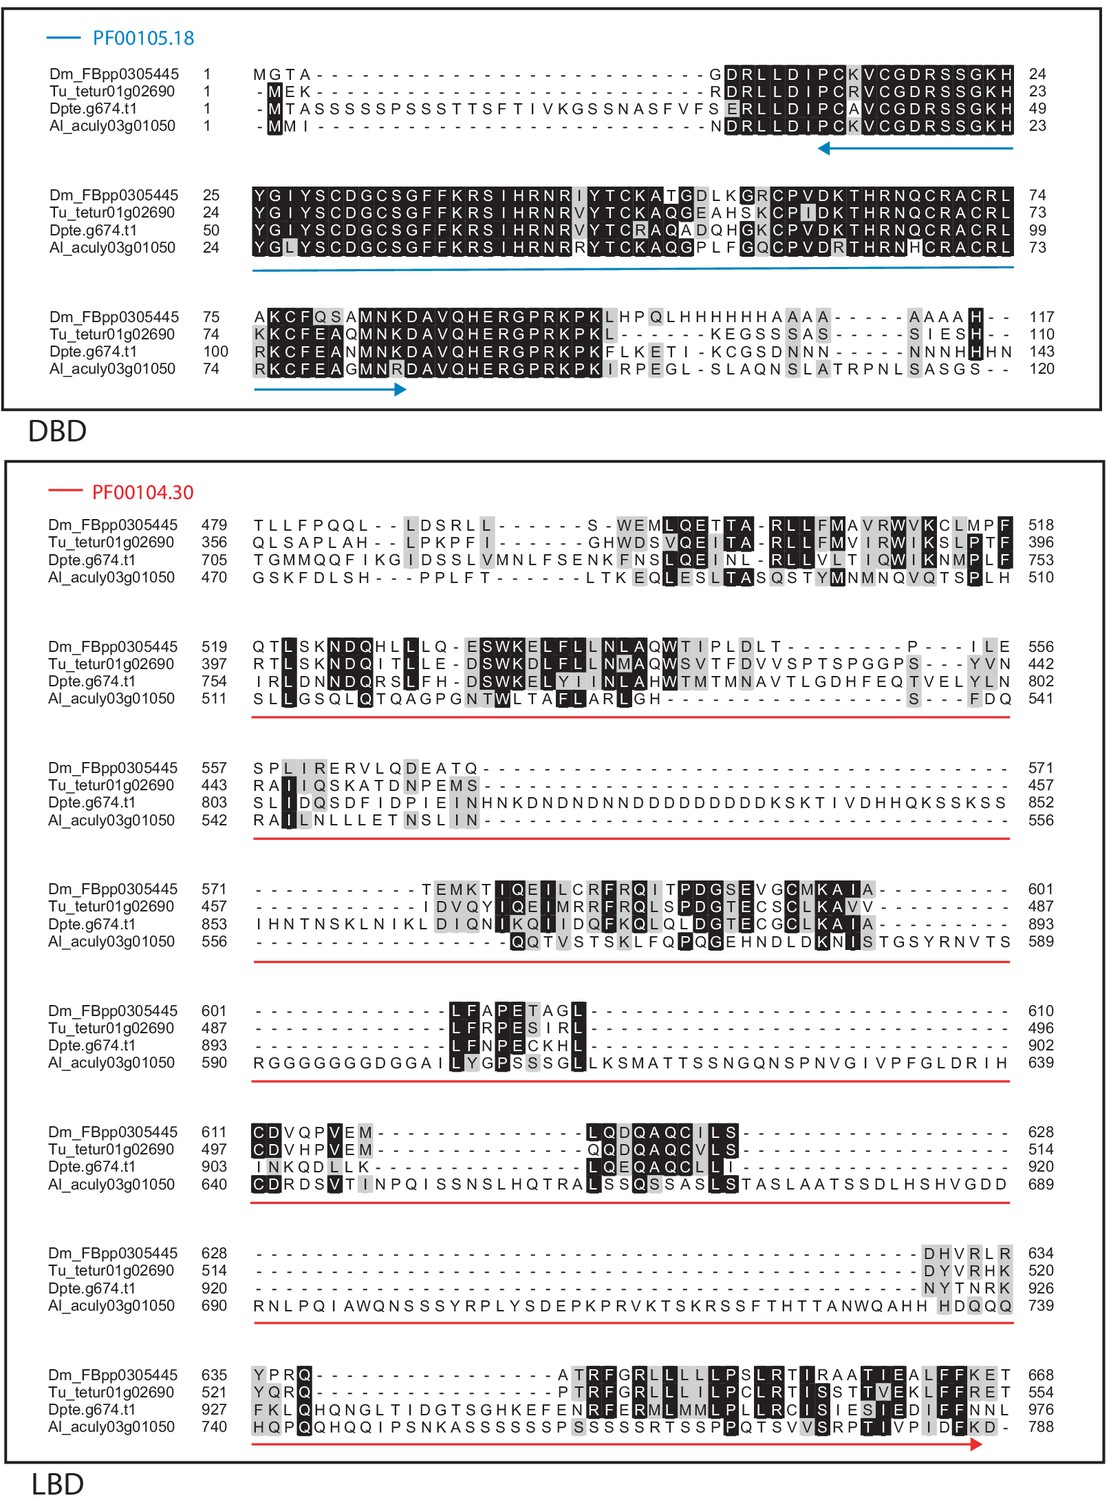
Alignment of the DNA-binding domain and the ligand-binding domain region of D. melanogaster DSF with those of T. urticae, D. pteronyssinus, and A. lycopersici.
Alignments for the DNA-binding domain (DBD) and the ligand-binding domain (LBD) are shown at top and bottom, respectively. The DBD domain (PF00105) in the DBD region of the D. melanogaster sequence is indicated with a blue double-headed arrow (top), while the LBD domain (PF00104) in the LBD region of the D. melanogaster sequence is indicated with a red double-headed arrow (bottom). A 75% threshold was used for identity (black background) and similarity shading (gray background). Sequences from D. melanogaster, T. urticae, D. pteronyssinus, and A. lycopersici are prefixed with ‘Dm’, ‘Tu’, ‘Dpte’, and ‘Al’, respectively.
Figure 4—figure supplement 18
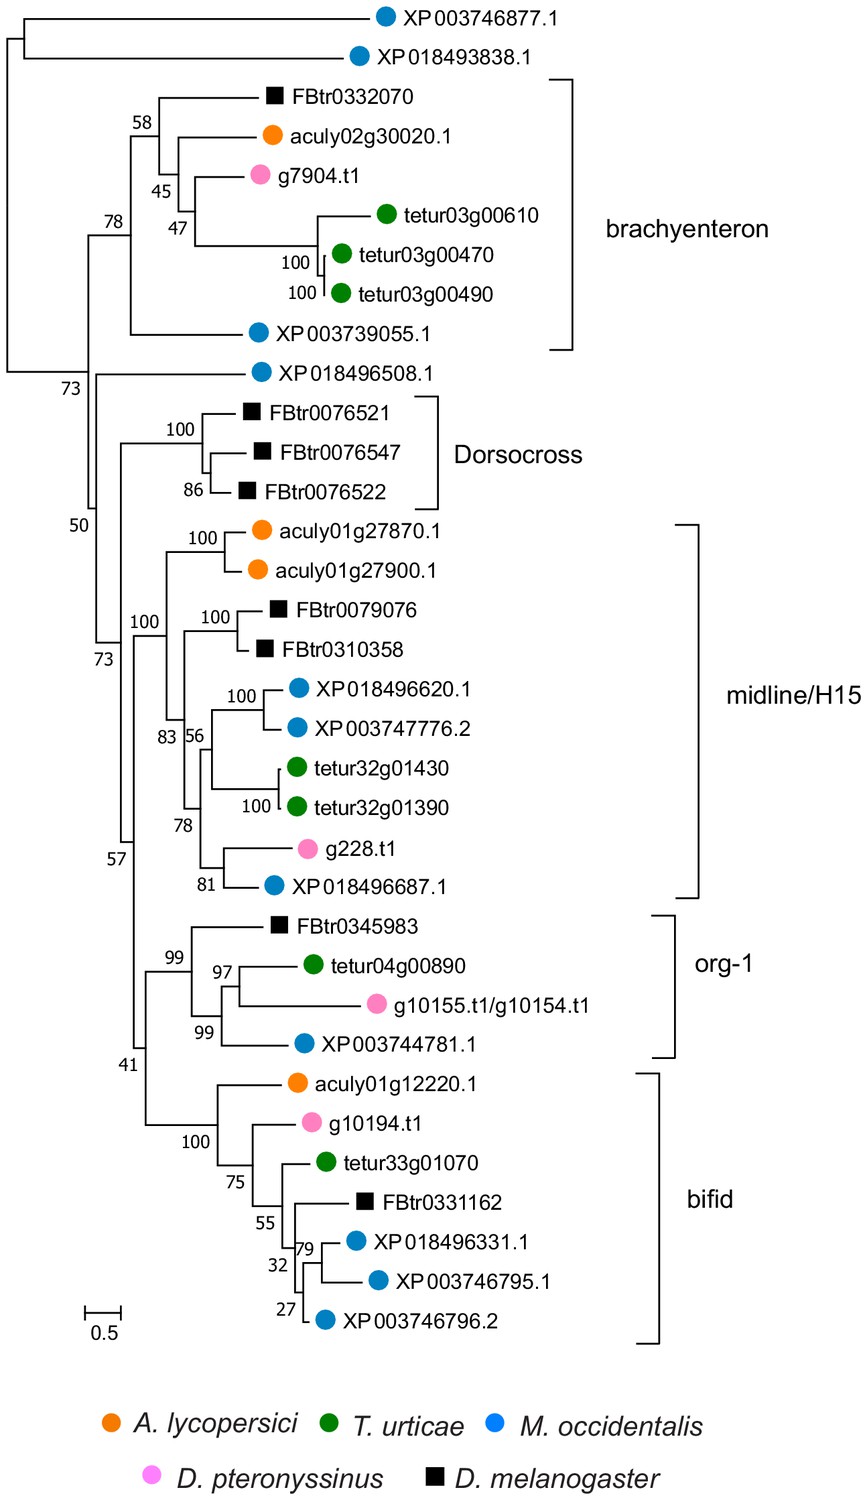
Phylogenetic analysis of A. lycopersici protein sequences with a T-box (PF00907) domain.
A midpoint rooted maximum likelihood tree is shown; the scale bar represents 0.5 substitutions per site, while numbers at nodes indicate bootstrap support based on 1000 replicates. The different T-box clusters are indicated with brackets and were named after the D. melanogaster T-box protein(s) contained in each T-box clade. Species are denoted by color as indicated in the legend at bottom (circles, chelicerates; square, an insect). The alignment used for phylogenetic inference can be found in Supplementary file 7.
Figure 4—figure supplement 19

Phylogenetic analysis of A. lycopersici UGT protein sequences.
A midpoint rooted maximum likelihood tree is shown; the scale bar represents 0.2 substitutions per site, while numbers at nodes indicate bootstrap support based on 1000 replicates. A red circle denotes the A. lycopersici UGT cluster (node with bootstrap support of 87). Species are denoted by colored circles as indicated in the legend at bottom. The alignment used for phylogenetic inference can be found in Supplementary file 7.
Figure 4—figure supplement 20
Phylogenetic analysis of A. lycopersici C1A proteases.
A midpoint rooted maximum likelihood tree is shown; the scale bar represents 0.5 substitutions per site, while numbers at nodes indicate bootstrap support based on 1000 replicates. Only bootstrap values above 50 are shown. Species are denoted by color as indicated in the legend at bottom (circles, chelicerates; square, an insect). The alignment used for phylogenetic inference can be found in Supplementary file 7.
Figure 5
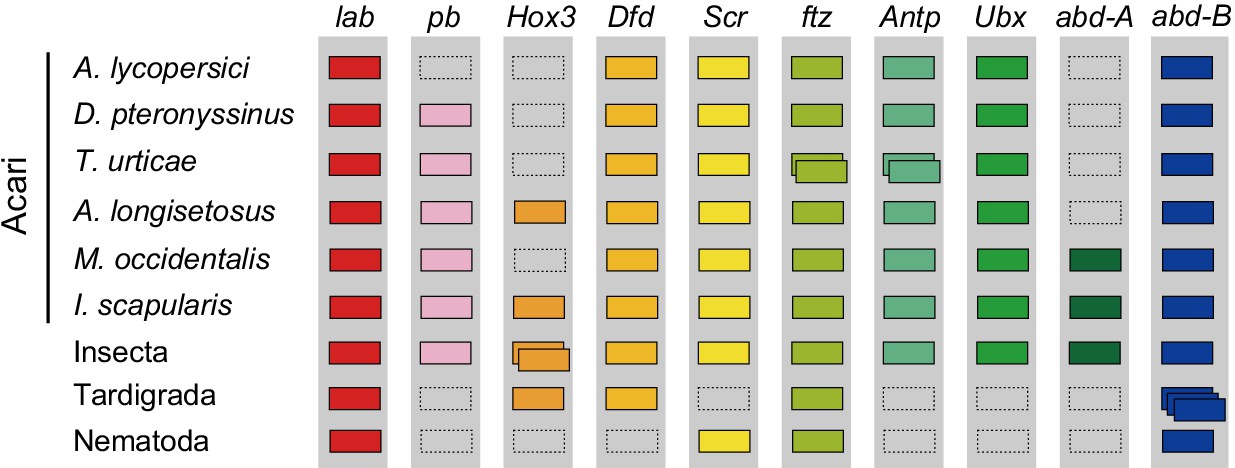
Hox genes in Acari and other ecdysozoan lineages.
Hox orthology groups are indicated by different colored boxes. Gray boxes with a dashed outline represent missing Hox genes. Some species have duplications of Hox genes and these are indicated by multiple boxes that overlap. T. castaneum, H. dujardini and C. elegans were selected as representative species for the Hox gene clusters of Insecta, Tardigrada and Nematoda, respectively.
Figure 6 with 1 supplement
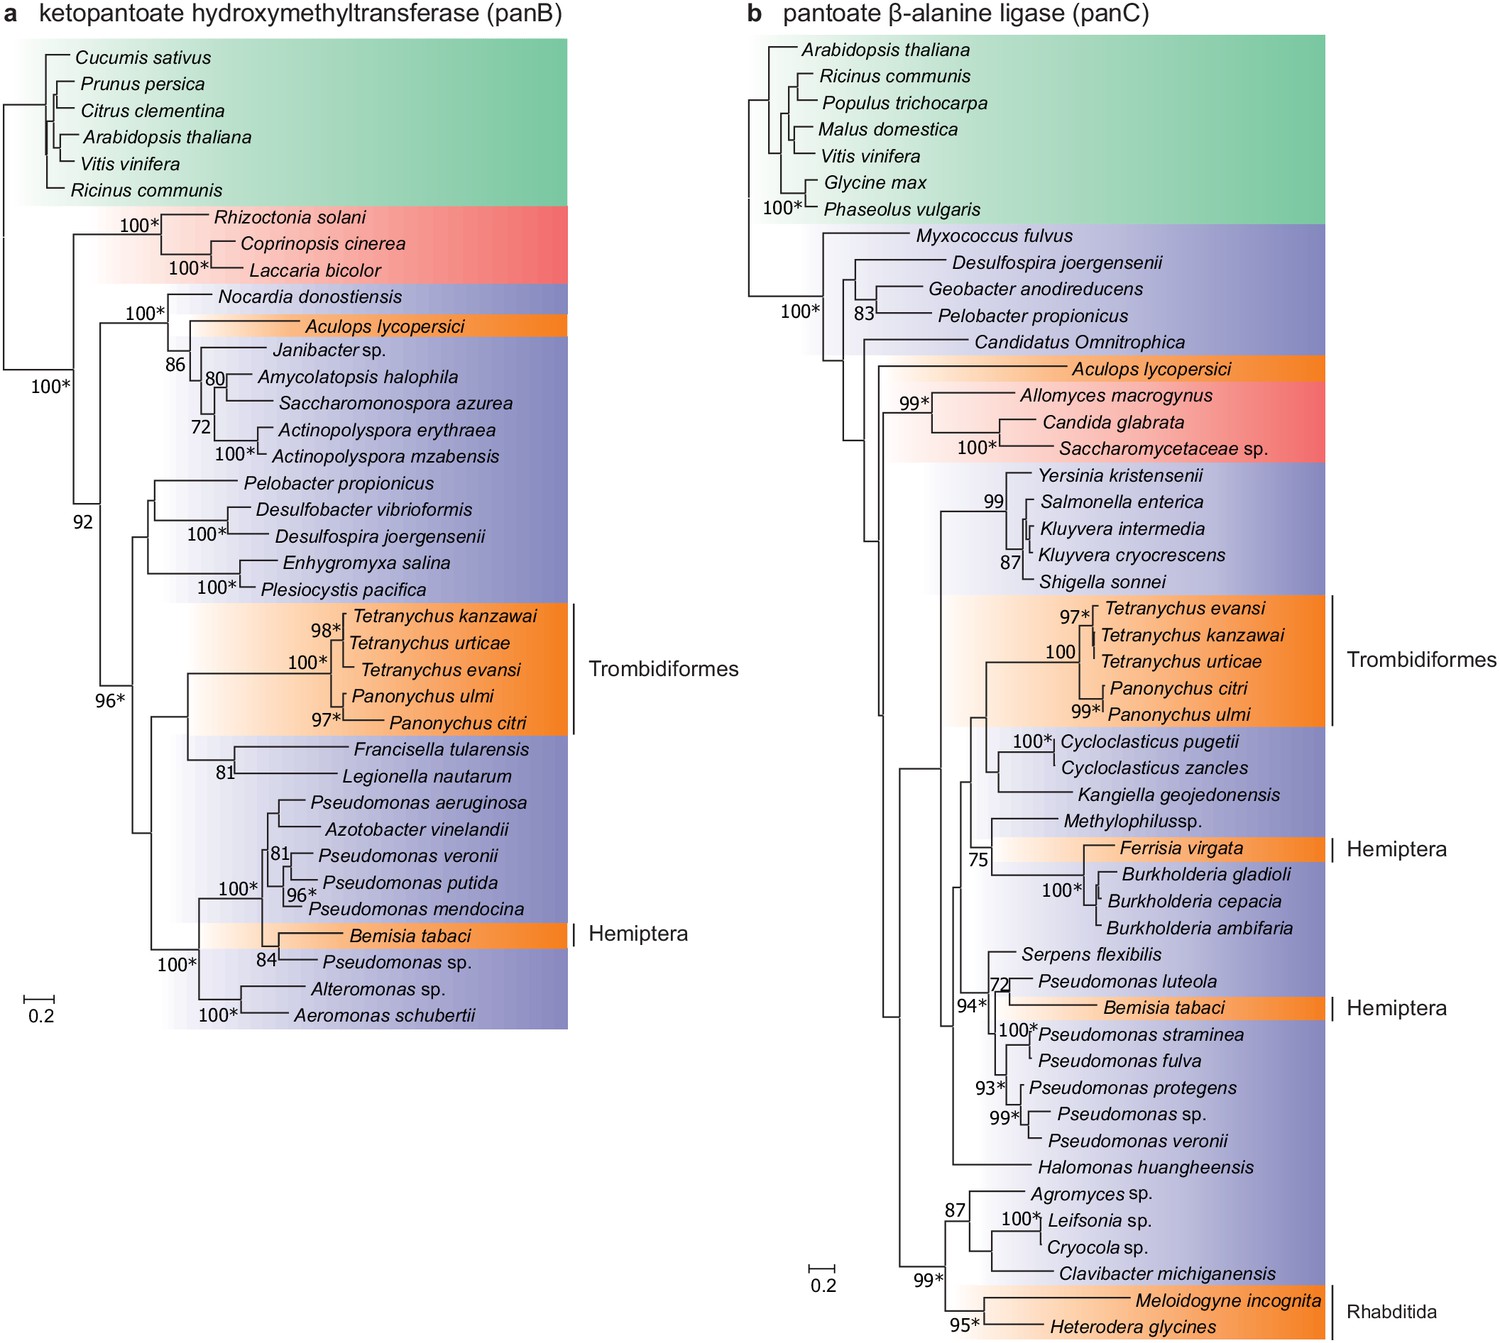
Maximum-likelihood phylogenetic inference for ketopantoate hydroxymethyltransferase and pantoate β-alanine ligase of A. lycopersici.
(a) Ketopantoate hydroxymethyltransferase. (b) Pantoate β-alanine ligase. Branches are color coded depending on their position within the tree of life; plants: green, animals: orange, fungi: red and bacteria: blue. RAxML phylogenetic reconstructions are consistent with the evolutionary scenario of independent horizontal transfer events of the two pantothenate biosynthetic genes in the A. lycopersici lineage, tetranychid spider mites, and hemipterans. Only RAxML bootstrap support values higher than 70 are depicted and the scale bars represent 0.2 amino acid substitutions per site. Informative nodes were identical and well-supported in another maximum-likelihood analysis (IQ-TREE; an asterisk indicates nodes with ultrafast bootstrap values above or equal to 95 in the IQ-TREE analyses). Plant homologues were used to root both phylogenetic trees. The alignments used for phylogenetic inference can be found in Supplementary file 7.
Figure 6—figure supplement 1
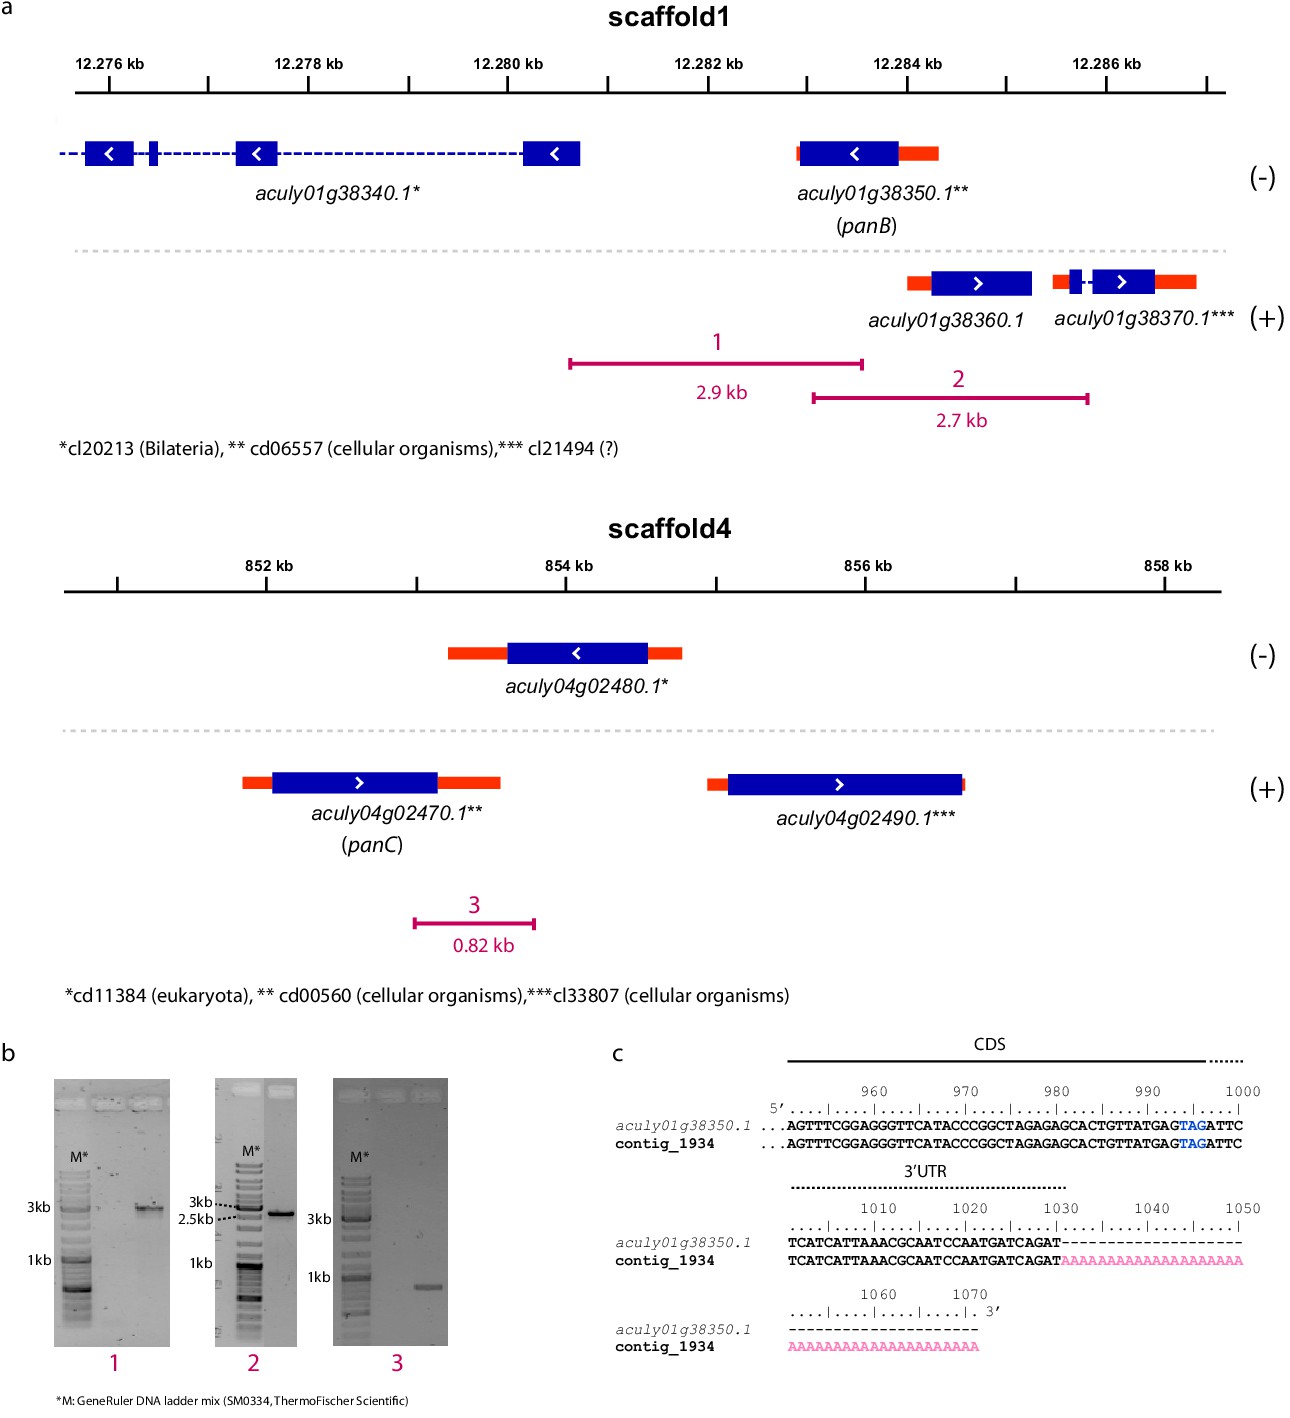
Integration of the ketopantoate hydroxymethyltransferase (aculy01g38350, panB) and pantoate β-alanine ligase (aculy04g02470, panC) genes into the A. lycopersici genome.
(a) Gene models of aculy01g38350 (on scaffold 1) and aculy04g02470 (on scaffold 4) and their neighboring genes are depicted as follows: blue and red rectangles represent coding sequences (CDS) and untranslated regions (UTRs), respectively, while introns are shown as dashed lines. (+) and (-) represent the forward and reverse strands, respectively. Asterisks indicate the conserved domains (NCBI conserved domain database) that are found in the proteins that are encoded by these genes (taxonomic distribution of these domains is shown). Underneath the gene models, as indicated in purple, are the lengths and positions of amplicons 1, 2, and 3 obtained by PCR. Amplicons 1 and 2 link aculy01g38350 to genes with introns, while amplicon 3 links aculy04g02470 to aculy04g02480, which encodes a ras-related GTP-binding protein for which the T. urticae orthologue (tetur12g01430) harbors three CDS introns, confirming a eukaryotic origin. (b) Agarose gels showing PCR amplicons 1, 2, and 3 as depicted in panel (a). (c) The 3′end of the aculy01g38350 gene aligned with an Illumina assembled transcript (contig 1943). A solid line indicates the 3′CDS region, while a dashed line indicates the 3′UTR region. The polyA tail is indicated with pink font while the stop codon of the aculy01g38350 CDS is indicated with blue font (no polyA track is present at the respective genomic location).
Author response image 1
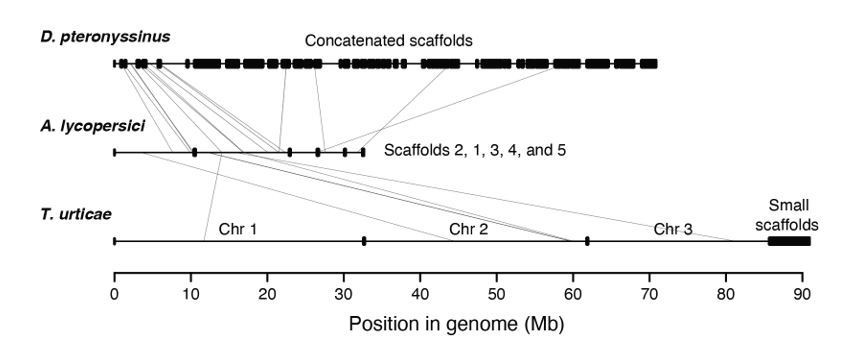
Synteny assessment between acariform mite genomes.
Synteny was assessed using Synima (PMID: 29162056). Concatenated genomes of D. pteronyssinus, A. lycopersici and T. urticae are shown, with possible micro-synteny with respect to A. lycopersici, middle, indicated by light grey connecting lines.
Tables
Table 1
Genome metrics for A. lycopersici, other mite species, D. melanogaster and H. sapiens.
| Species | Genome size (Mb) | PCG* | % intronless† | Coding %‡ | Intergenic %§ | Intronic %¶ | Intergenic M | Intron M |
|---|---|---|---|---|---|---|---|---|
| A. lycopersici | 32.53 | 10,263 | 83.67 | 42.26 | 45.12 | 12.62 | 538 bp | 170 bp |
| D. pteronyssinus | 70.76 | 12,530 | 25.29 | 35.26 | 46.00 | 18.73 | 542 bp | 75 bp |
| T. urticae | 90.83 | 19,086 | 18.26 | 22.10 | 54.12 | 23.78 | 1302 bp | 94 bp |
| M. occidentalis | 151.90 | 17,310 | 24.97 | 15.25 | 59.14 | 25.61 | 2035 bp | 135 bp |
| D. melanogaster | 143.73 | 13,931 | 16.37 | 15.60 | 57.37 | 27.03 | 1228 bp | 69 bp |
| H. sapiens | 3088.27 | 19,636 | 6.74 | 1.10 | 68.14 | 30.77 | 23,279 bp | 1,505 bp |
-
*PCG: protein coding genes.
†Percent coding genes with no introns.
-
‡Percentage of genome in coding regions.
§Percentage of genome in between genes.
-
¶Percentage of genome in introns.
M = Median. See ‘Genome metric calculations’ in Materials and methods and Table 1—source data 1 for more information.
-
Table 1—source data 1
GFF3 annotation file of the A. lycopersici genome.
- https://cdn.elifesciences.org/articles/56689/elife-56689-table1-data1-v2.zip
Table 2
Detoxification enzyme (CYPs, GSTs, CCEs) and ABC transporter gene family size in A. lycopersici, T. urticae, M. occidentalis, and D. melanogaster.
| Detoxification enzyme | A. lycopersici | T. urticae | M. occidentalis | D. melanogaster |
|---|---|---|---|---|
| CYPs (total) | 23 | 78* | 63 | 86 |
| CYP2 | 1 | 38 | 16 | 7 |
| CYP3 | 17 | 9 | 23 | 36 |
| CYP4 | 2 | 26 | 19 | 32 |
| Mito Clan | 3 | 5 | 5 | 11 |
| GSTs (total) | 4 | 31 | 13 | 37 |
| Delta/Epsilon | 1 | 16 | 3 | 25 |
| Mu | 2 | 12 | 5 | 0 |
| Omega | 0 | 2 | 3 | 5 |
| Sigma | 0 | 0 | 0 | 1 |
| Theta | 0 | 0 | 0 | 4 |
| Zeta | 1 | 1 | 1 | 2 |
| Unknown | 0 | 0 | 1 | 0 |
| CCEs (total) | 8 | 69 | 44 | 35 |
| Dietary class (clade A-C) | 0 | 0 | 0 | 13 |
| Hormone class | ||||
| D (integument CCEs) | 0 | 0 | 0 | 3 |
| E (secreted beta-esterases) | 0 | 0 | 0 | 2 |
| F (dipteran JHEs†) | 0 | 0 | 0 | 3 |
| F' (chelicerate JHEs) | 0 | 2 | 1 | 0 |
| Neurodevelopmental class | ||||
| H (glutactins) | 0 | 0 | 0 | 4 |
| J (AChE) | 1 | 1 | 1 | 1 |
| J' (Acari-specific CCEs) | 0 | 32 | 19 | 0 |
| J'' (Acari-specific CCEs) | 0 | 22 | 15 | 0 |
| K (gliotactin) | 1 | 1 | 1 | 1 |
| L (neuroligins) | 2 | 5 | 5 | 4 |
| M (neurotactin) | 1 | 1 | 0 | 1 |
| U (unchar. conserv. clade in Acariformes/L. polyphemus) | 2 | 3 | 0 | 0 |
| I (unchar. conserv. clade in insects) | 0 | 0 | 0 | 2 |
| No clear clade assignment | 1 | 2 | 2 | 1 |
| ABCs (total) | 44 | 103 | 55 | 56 |
| ABCA | 4 | 9 | 8 | 10 |
| ABCB-FT‡ | 3 | 2 | 1 | 4 |
| ABCB-HT§ | 1 | 2 | 4 | 4 |
| ABCC | 9 | 39 | 22 | 14 |
| ABCD | 2 | 2 | 4 | 2 |
| ABCE | 1 | 1 | 1 | 1 |
| ABCF | 3 | 3 | 3 | 3 |
| ABCG | 16 | 23 | 2 | 15 |
| ABCH | 5 | 22 | 6 | 3 |
| Unknown | 0 | 0 | 4 | 0 |
| Total | 79 | 281 | 175 | 214 |
-
Numbers and class/clade/subfamily assignments were derived from previous studies (Grbić et al., 2011; Wei et al., 2020; Wu and Hoy, 2016) and this study.
*Of the 81 T. urticae CYPs identified by Grbić et al., 2011, three CYP genes (tetur46g00150, tetur46g00170 and tetur47g00090) and tetur602g00010 were considered as allelic variants and a pseudogene, respectively, and one new full-length CYP gene (tetur01g13730) was identified in this study.
-
†JHE, juvenile hormone esterases.
‡FT, full transporter.
-
§HT, half transporter.
Additional files
-
Supplementary file 1
Supplementary Tables S1-20 as Tabs in a. xlsx file.
- https://cdn.elifesciences.org/articles/56689/elife-56689-supp1-v2.xlsx
-
Supplementary file 2
2371 orthologous protein clusters used as input for Malin.
- https://cdn.elifesciences.org/articles/56689/elife-56689-supp2-v2.zip
-
Supplementary file 3
Sequence alignments and annotations of intron positions for A. lycopersici, D. pteronyssinus, T. urticae, M. occidentalis, B. mori, and D. melanogaster members of 80 orthogroups.
- https://cdn.elifesciences.org/articles/56689/elife-56689-supp3-v2.txt
-
Supplementary file 4
Small and large orthogroups used as input for CAFE analysis.
- https://cdn.elifesciences.org/articles/56689/elife-56689-supp4-v2.xlsx
-
Supplementary file 5
Ultrametric tree used as input for CAFE analysis.
- https://cdn.elifesciences.org/articles/56689/elife-56689-supp5-v2.txt
-
Supplementary file 6
Homeodomain regions of Hox protein sequences of A. lycopersici, D. pteronyssinus, T. urticae, A. longisetosus, I. scapularis, and T. castaneum.
- https://cdn.elifesciences.org/articles/56689/elife-56689-supp6-v2.fas.zip
-
Supplementary file 7
Protein alignments used for phylogenetic tree construction in Figures 2, 4 and 6, and the respective figure supplements.
- https://cdn.elifesciences.org/articles/56689/elife-56689-supp7-v2.zip
-
Transparent reporting form
- https://cdn.elifesciences.org/articles/56689/elife-56689-transrepform-v2.docx
Download links
A two-part list of links to download the article, or parts of the article, in various formats.
Downloads (link to download the article as PDF)
Open citations (links to open the citations from this article in various online reference manager services)
Cite this article (links to download the citations from this article in formats compatible with various reference manager tools)
Genome streamlining in a minute herbivore that manipulates its host plant
eLife 9:e56689.
https://doi.org/10.7554/eLife.56689


