Divergent sensory investment mirrors potential speciation via niche partitioning across Drosophila
- Max Planck Institute for Chemical Ecology (MPICE), Department of Evolutionary Neuroethology, Germany
Figures
Figure 1 with 3 supplements
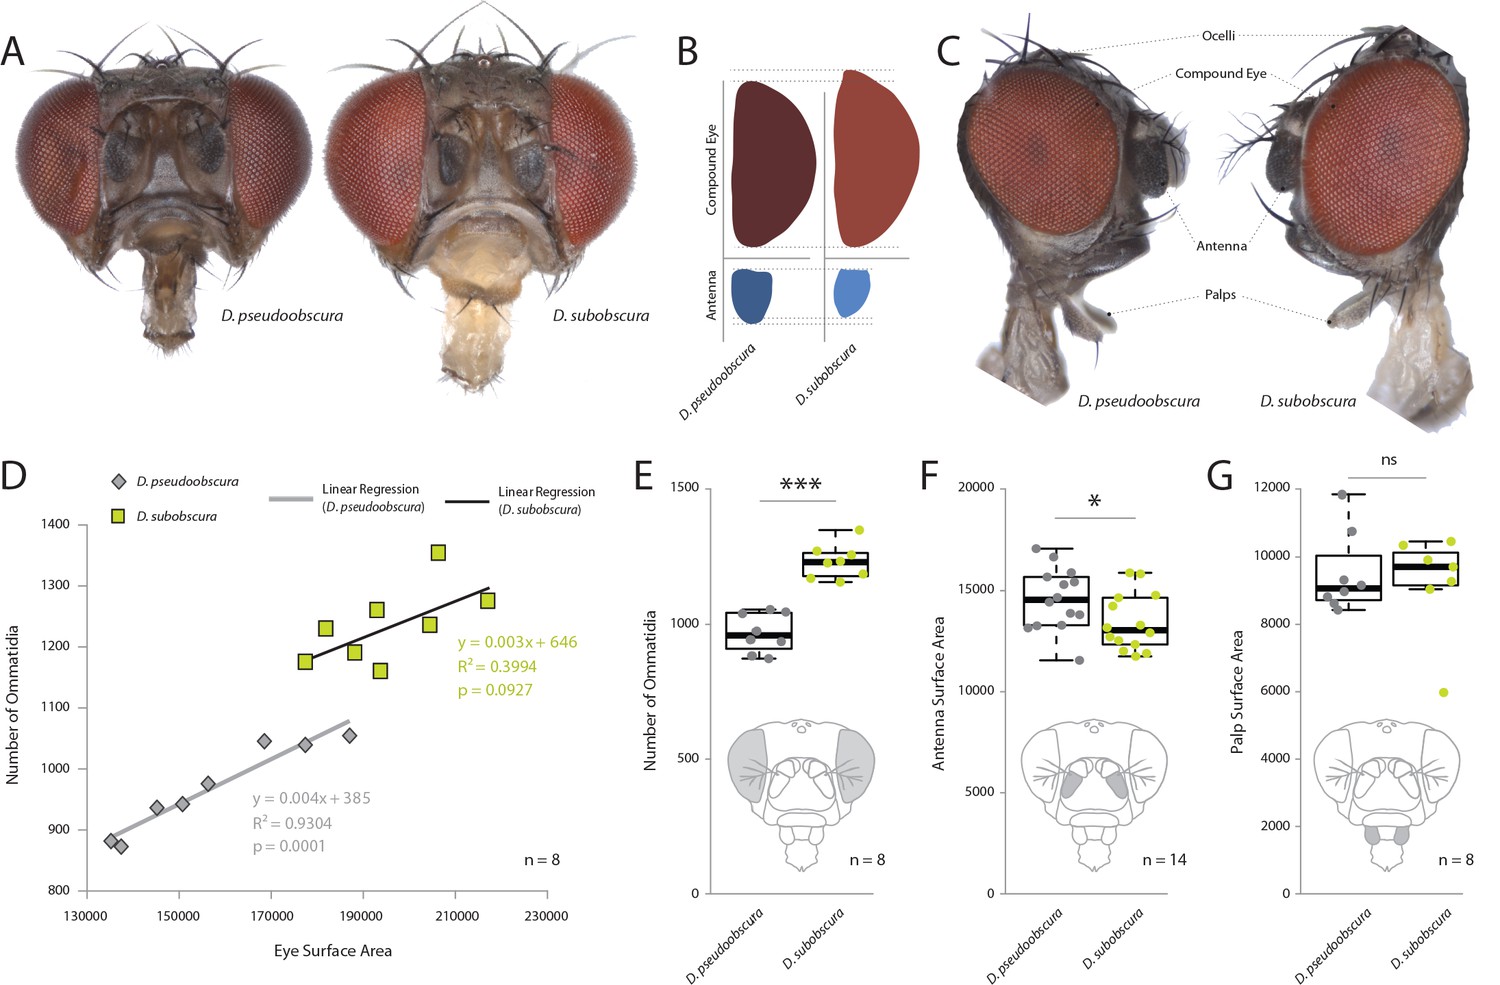
Comparative morphology of external sensory systems.
(A) Examples of frontal head replicates, where eye and antenna surface area was measured from females. Note the differences in pigmentation, as well as the size of the compound eye and third antennal segment from both species. (B) Side-by-side comparison of both the compound eye (red) and third antennal segment (blue) from each fly. (C) Example of lateral views used for measurements, including compound eye surface area, antennal surface area, and maxillary palp surface area. (D) Intra- and interspecies correlations between eye surface area and the number of ommatidia for D. subobscura (yellow) and D. pseudoobscura (grey). (E–G) Comparison of ommatidia counts (E), antennal surface (F), and palp surface (G) for both species. Boxplots represent the median (bold black line), quartiles (boxes), as well as 1.5 times the inter quartile range (whiskers). Mann-whitney U test; ***, p<0.001; *, p<0.05; ns, p>0.05.
-
Figure 1—source data 1
Morphometrics across the obscura group.
- https://cdn.elifesciences.org/articles/57008/elife-57008-fig1-data1-v2.xlsx
Figure 1—figure supplement 1
External morphometrics of two obscura species.
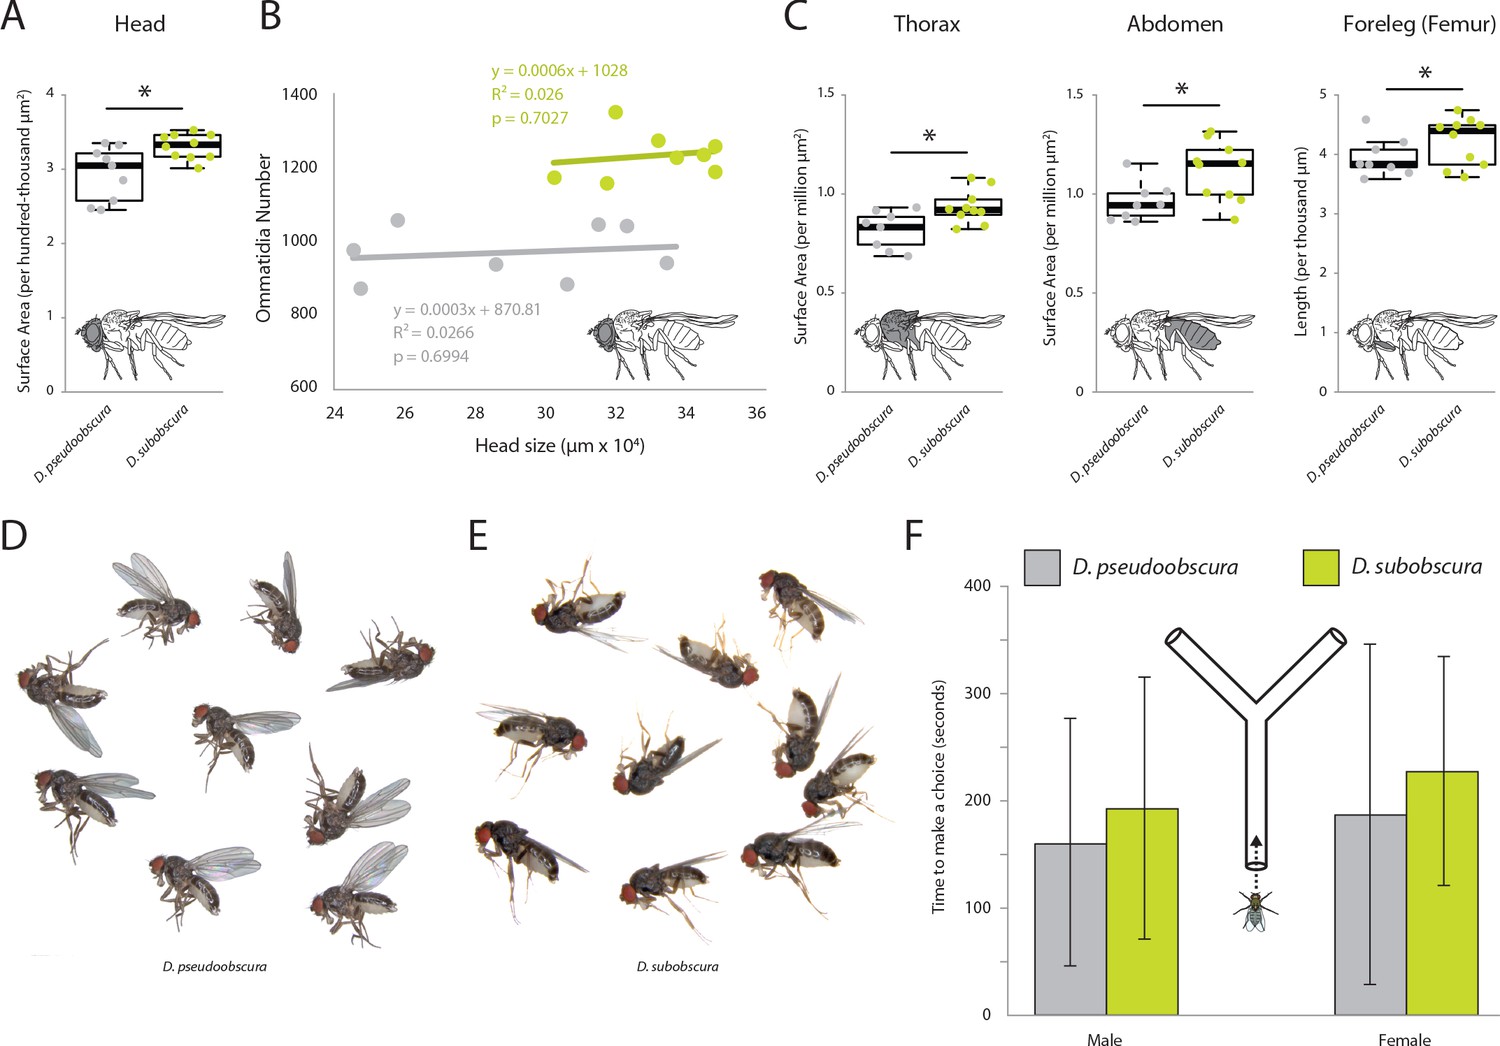
Images of whole flies were collected to provide measurements on overall size differences between these two Drosophila species. While D. subobscura was significantly larger, this does not appear to explain the observed variation in eye or antenna sizes between these two species. (A) Lateral views of each fly species were measured to provide surface area estimates for head. (B) Linear correlations reveal that head size does not mirror ommatidia number; thus, that the visual sensory system varies isometrically with respect to head size. (C) Lateral views of each fly species were measured to provide surface area estimates for thorax, abdomen and foreleg (femur) measurements. In all cases, D. subobscura females were significantly larger than D. pseudoobscura adults. (D) Lateral views of D. pseudoobscura adult females. (E) Lateral views of D. subobscura females. (F) Time metrics are shown for flies selecting between darkened or lightened sides of the Y-tube during phototaxis experiments.
Figure 1—figure supplement 2
Additional metrics from sensory systems.
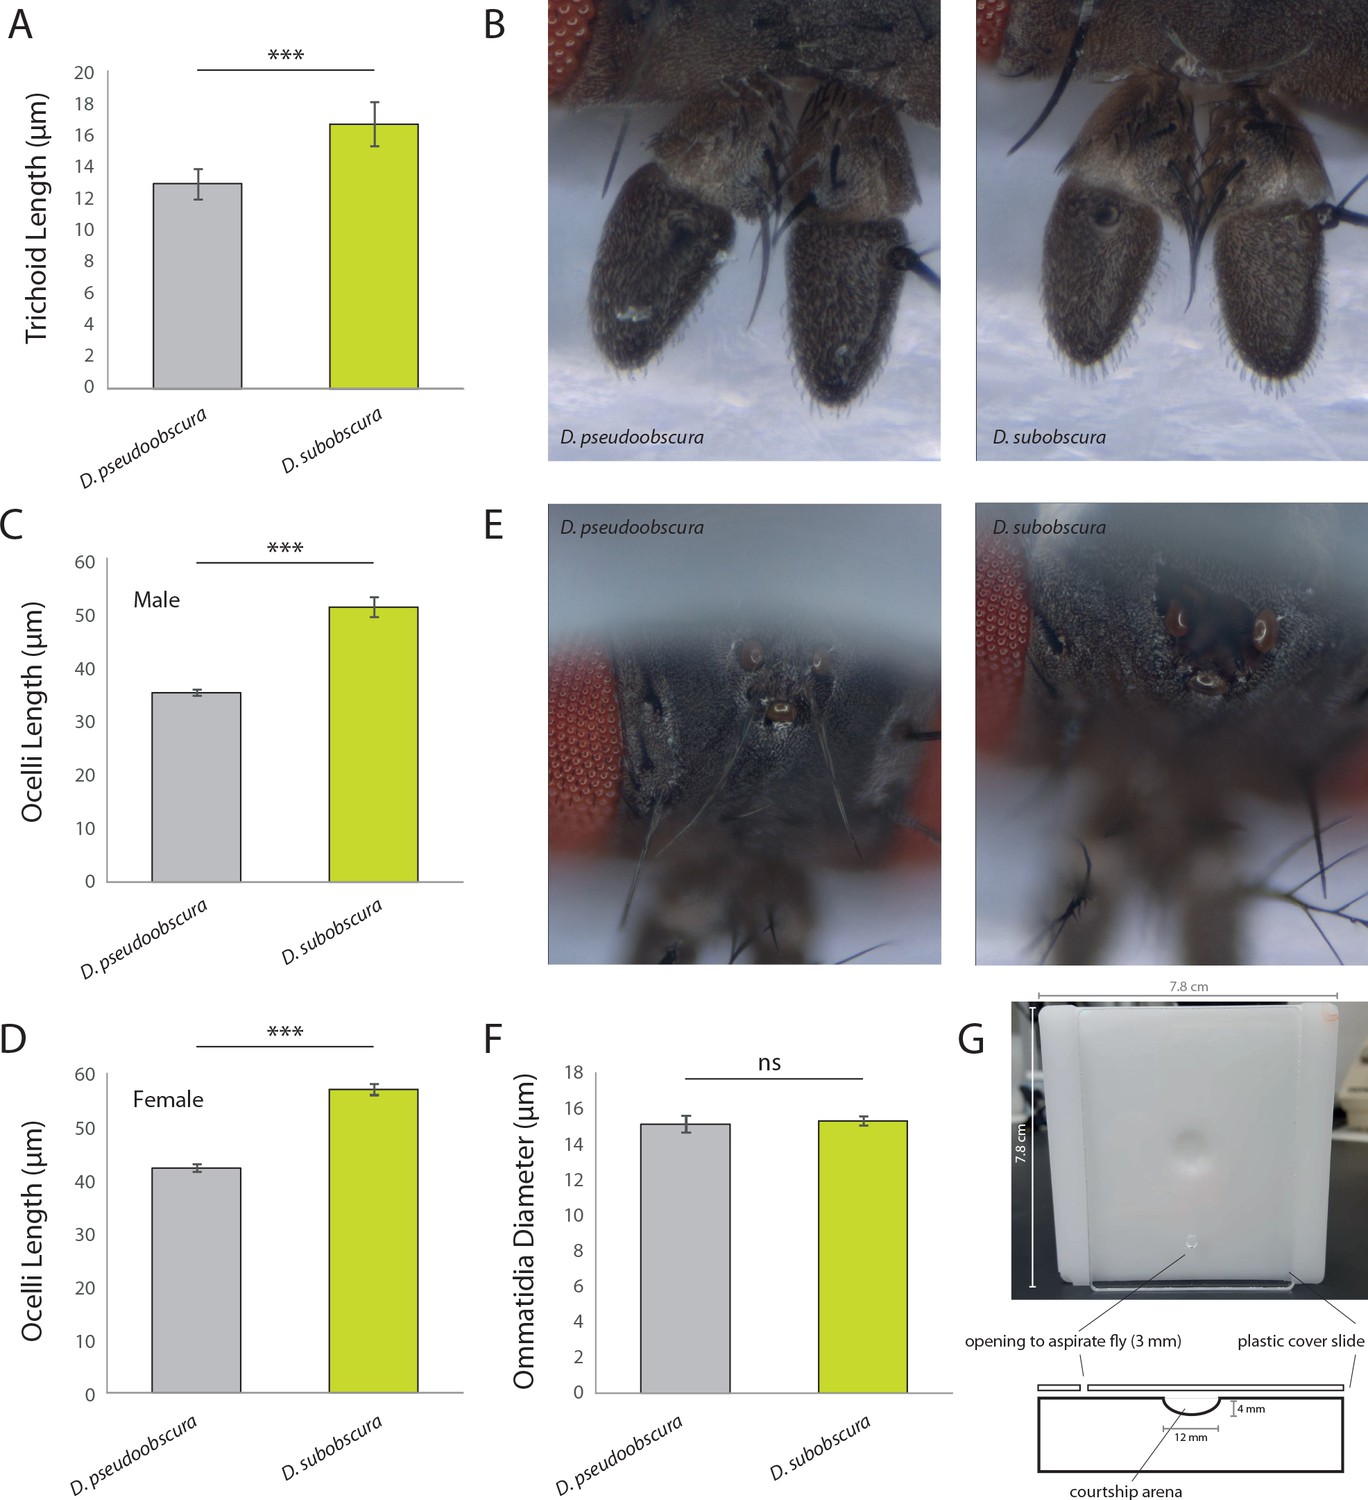
(A) Here, we note a difference in trichoid length between males of the two obscura species, with D. subobscura having significantly longer sensillum than D. pseudoobscura. It was not possible to distinguish between antennal trichoid one (at1) and antennal trichoid four (at4), at least not based on morphology alone. Therefore, we clarify in the present measurements that trichoid refers collectively to both at1 and at4 across those examined Drosophila species. (B) Stacked focal images of the antenna from each species. (C–D) Average ocelli length from males and females of each species, where D. subobscura consistently had larger ocelli. (E) Stacked focal images of the ocelli from each species. (F) Average ommatidium diameters, where there was no significant difference between our two obscura species. (G) Courtship arenas used in this study, including measurements of sizes for each component.
Figure 1—figure supplement 3
Measurements of ommatidia diameter.
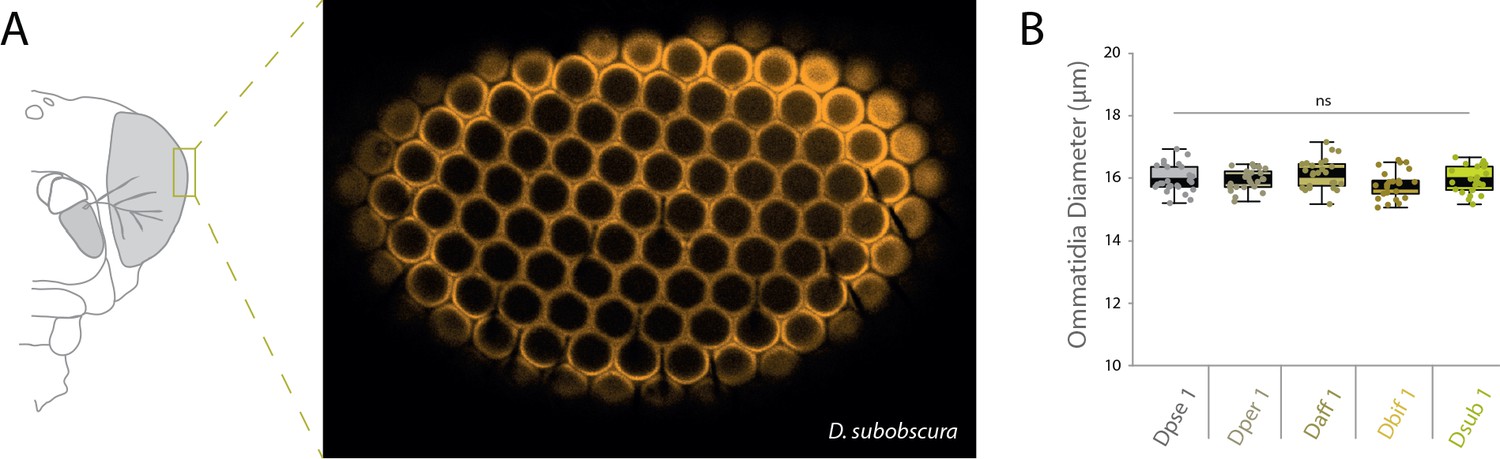
(A) Heads were dissected and mounted in order to image the apex of each species’ compound eye. Example confocal image of the apex of the compound eye from one replicate of D. subobscura analyses. (B) Repeated measures of ommatidia diameter were generated and statistically compared between our five obscura species, though we did not document any significant differences in diameter.
Figure 2
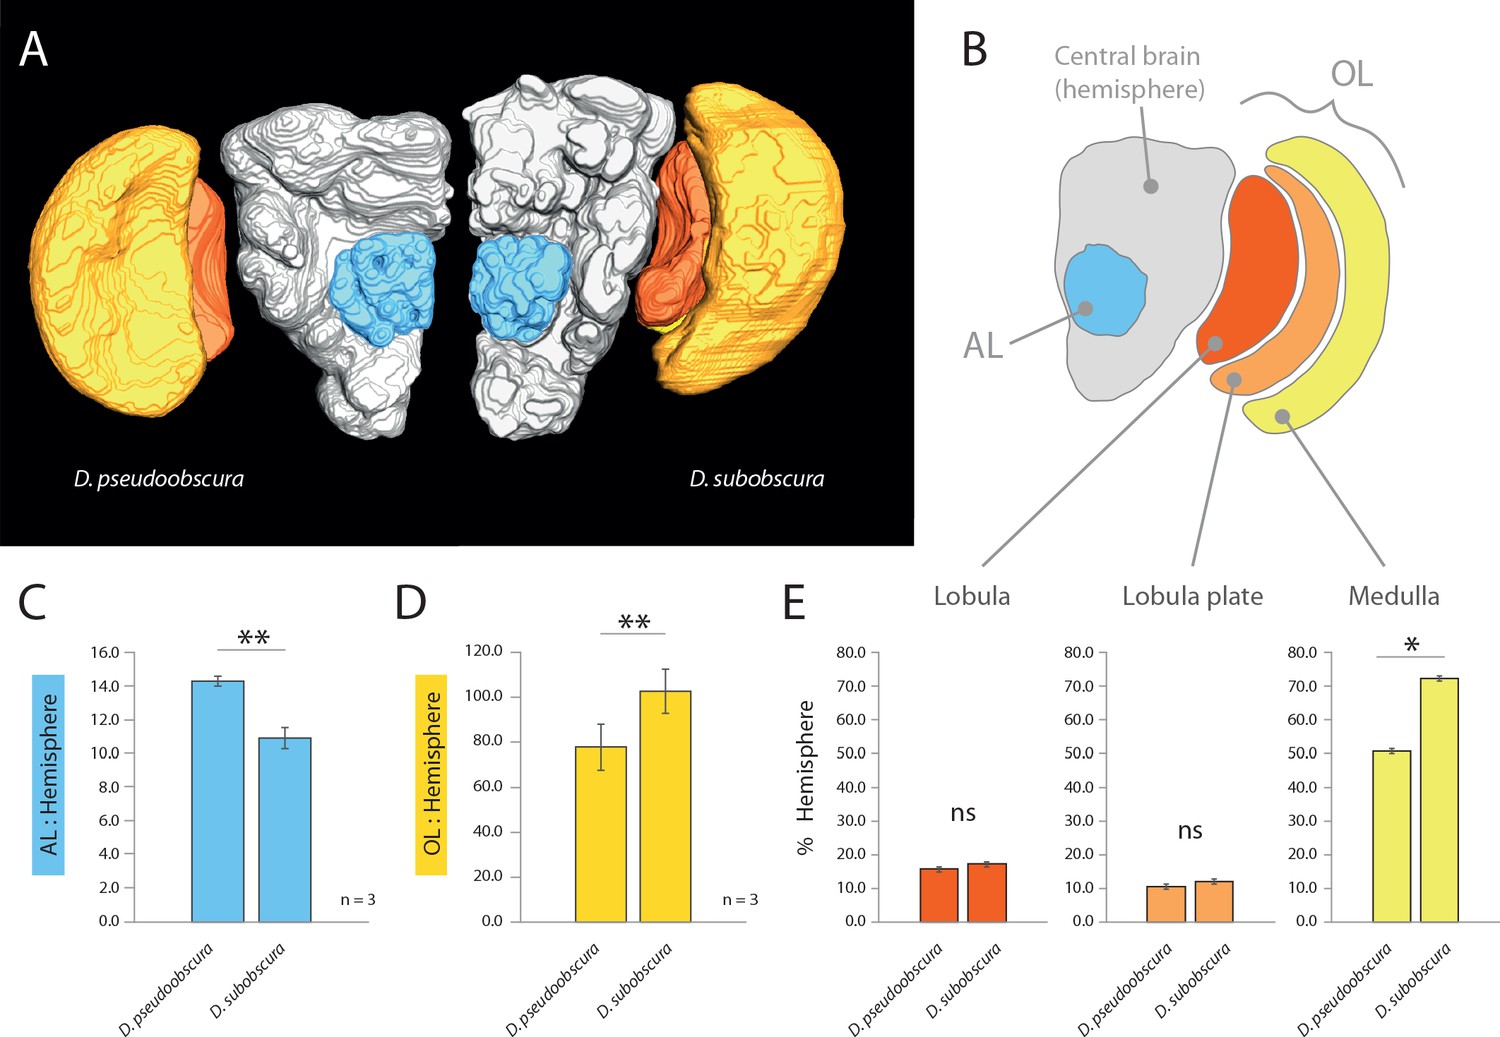
Comparative morphology of primary processing centers in the brain.
(A) Three-dimensional reconstructions of the neuropils of D. pseudoobscura and D. subobscura adult females. (B) Diagrammatic representation of the brain, with color-coded and labeled volumetric sources. AL, blue; hemisphere, grey; optic lobe, OL, with medulla (yellow), lobula (red) and lobula plate (orange). (C–E) Relative size of AL (C), OL (D), and lobula plate, lobula, and medulla (E) as compared to respective hemisphere [%].
-
Figure 2—source data 1
Metrics associated with visual and olfactory neuropils.
- https://cdn.elifesciences.org/articles/57008/elife-57008-fig2-data1-v2.xlsx
Figure 3
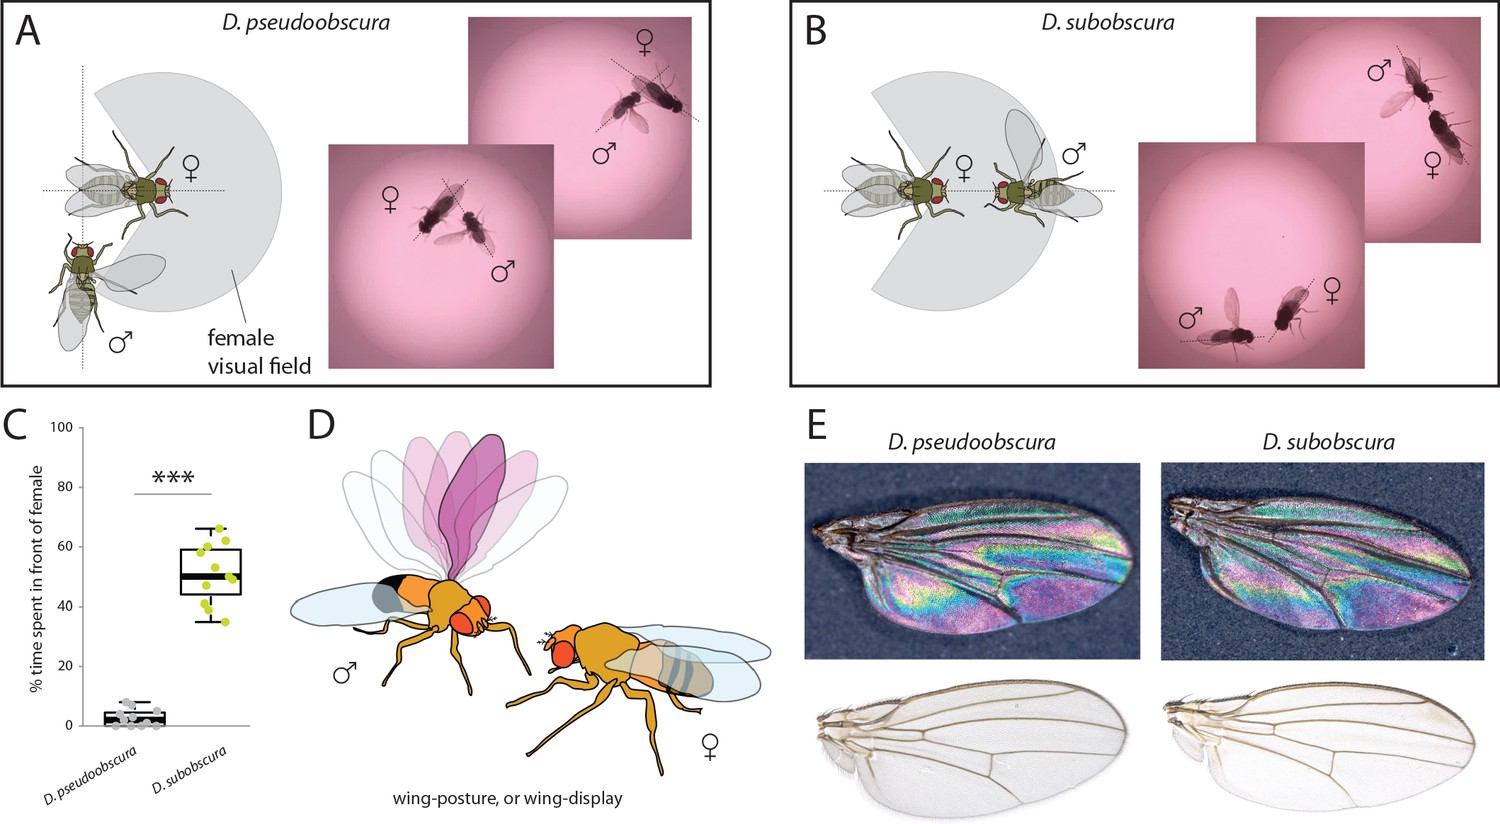
Courtship and mating behavior.
(A–B) Images of courtship for D. pseudoobscura (A) and D. subobscura (B) and schematic of the behavior, whether the male is in- or outside the predicted visual field of the female. (C) Time that males spent within the female visual field during courtship. Boxplots represent the median (bold black line), quartiles (boxes), as well as 1.5 times the inter quartile range (whiskers). Mann-Whitney U test; ***, p<0.001 (D) Diagram of D. subobscura wing display by the male, where no wing vibration was observed, and instead, a discrete range of wing angles was presented and maintained towards the female mating partner during courtship. (E) Stable structural wing interference patterns observed across the otherwise clear wings of males of both species.
Figure 4

Light preferences and hypothesized niche partitioning by both species.
(A) Two diagram views of the Y-tube phototactic response paradigm. Single flies were allowed to choose between either a well-lit or a darkened arm of a Y-tube. (B) Percentages of male and female flies of both species choosing the well-lit or darkened arm of the y-tube. (C) Diagram of ecological niche partitioning where our closely-related Drosophila species divide spatially across microhabitats within the same environment, and where light gradients act as an isolation barrier. Here we propose that these obscura species, despite sharing a forest ecology, create a reduction in either host resource or mating competition via their different preferences toward edge and open canopy environmental conditions, as related directly to their innate preferences for light intensity.
-
Figure 4—source data 1
Y-tube assay and phototaxis dataset.
- https://cdn.elifesciences.org/articles/57008/elife-57008-fig4-data1-v2.xlsx
Figure 5
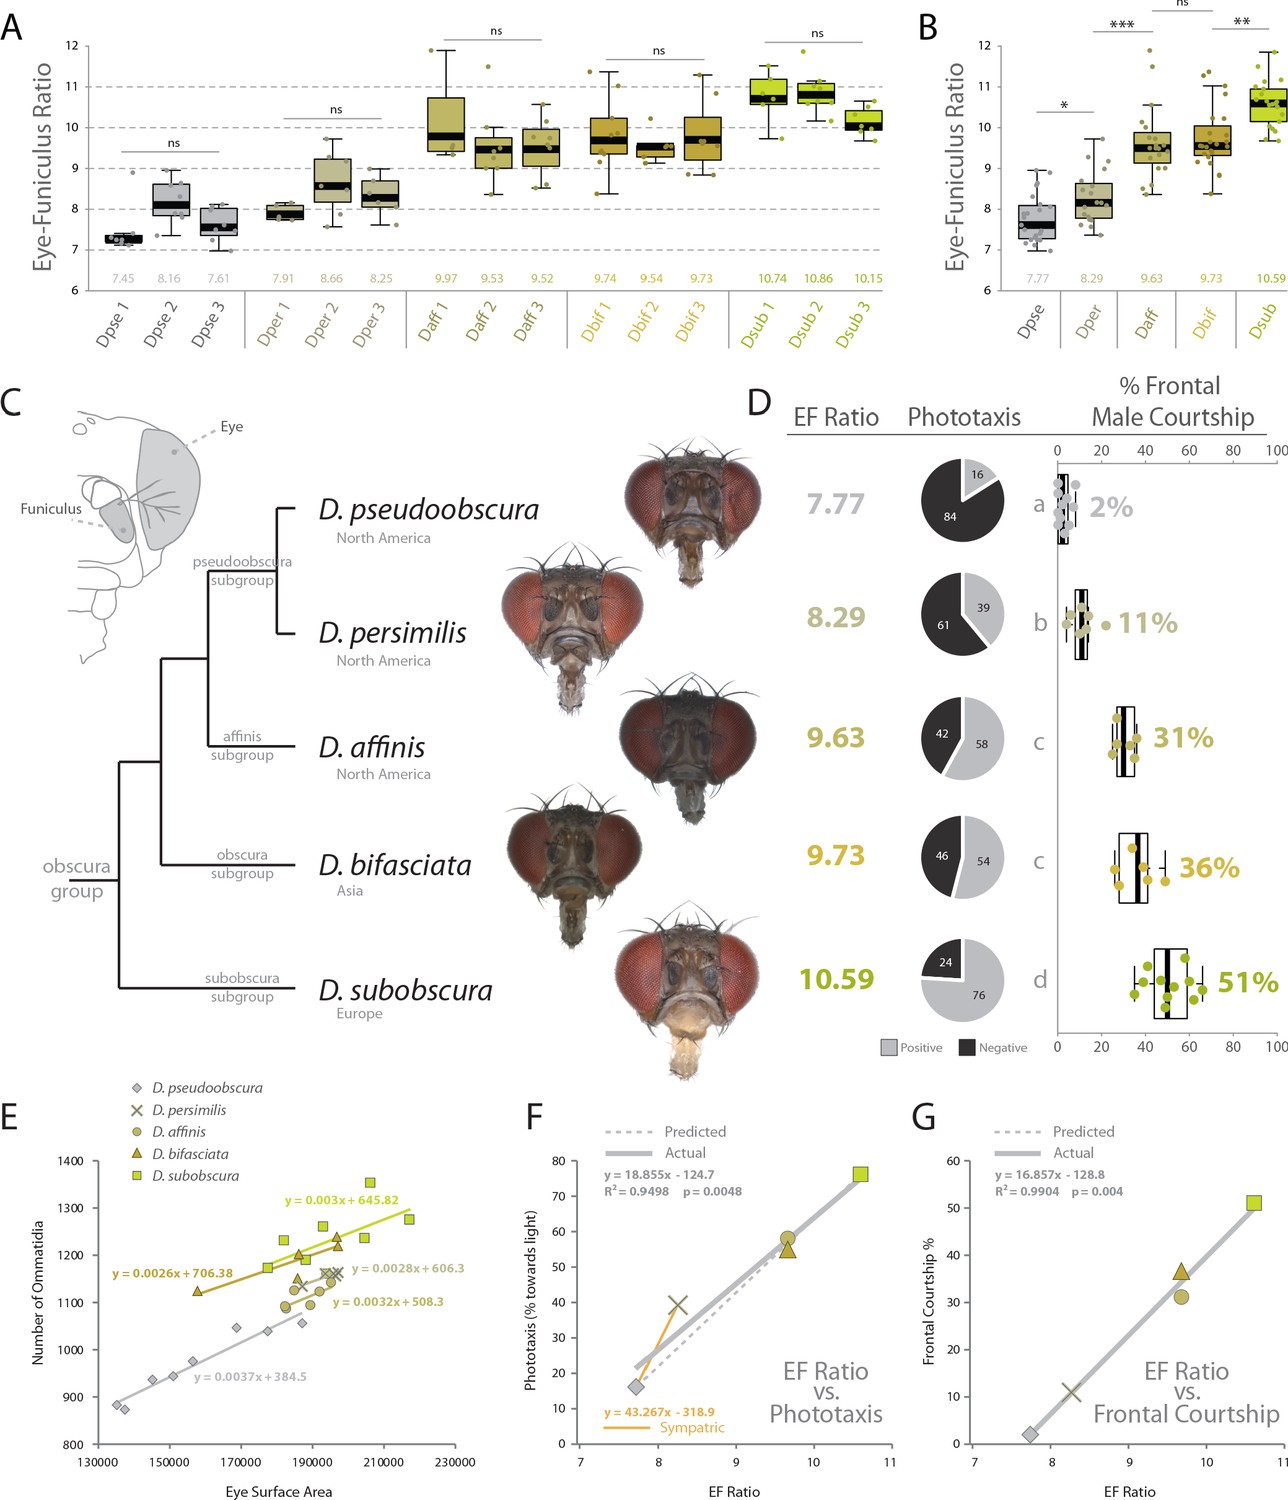
Behavioral relevance of sensory investment in 5 species of the obscura group.
(A) Measures of eye-to-funiculus ratio (EF ratio) across 15 populations of obscura species. (B) Statistical assessments of average EF Ratio between each species. (C) Diagram of morphology used to generate EF ratio for each species and the phylogenetic relationship of these five members of the obscura group (Crysnanto and Obbard, 2019; O'Grady, 1999), as well as examples of the frontal head images used to collect certain morphological data. Additional images are available with the online version of this publication. (D) Eye-to-funiculus ratio for each measured species, as well as the male phototactic response during y-tube trials. More details about phototaxis behavioral regimes are available in Figure 4. In addition, courtship videos from each species were addressed to quantify the amount of time the male spent in courtship, and shown are what percentage of that courtship time was spent in front of the female (see Figure 3 and supplementary videos for more detail). (E) Morphological measurements of eye surface area and the number of ommatidia collected from lateral views of each species. (F) Correlation between EF ratio and positive phototaxis for all tested obscura species. Our hypothesized correlation is shown with a dashed line, which stems from initial comparison of just two species (D. pseudoobscura and D. subobscura), while the actual correlation following the additional analyses of three new species is shown using a solid line. (G) Correlation between EF ratio and the percentage of male courtship spent in front of the female during his dance or display ethology.
-
Figure 5—source data 1
Morphometrics for intraspecies and interspecies comparisons.
- https://cdn.elifesciences.org/articles/57008/elife-57008-fig5-data1-v2.xlsx
Videos
Video 1
Courtship behavior video clip examples for D. subobscura adults.
Video 2
Courtship behavior video clip examples for D. pseudoobscura adults.
Tables
Key resources table
| Reagent type (species) or resource | Designation | Source or reference | Identifiers | Additional information |
|---|---|---|---|---|
| Strain (Drosophila subobscura) | Dsub 1 | NDSSC | RRID:FlyBase_FBst0203739 | 14011–0131.16 |
| Strain (D. subobscura) | Dsub 2 | NDSSC | RRID:FlyBase_FBst0201472 | 14011–0131.04 |
| Strain (D. subobscura) | Dsub 3 | NDSSC | RRID:FlyBase_FBst0201473 | 14011–0131.05 |
| Strain (D. pseudoobscura) | Dpse 1 | NDSSC | RRID:FlyBase_FBst0200037 | 14011–0121.00 |
| Strain (D. pseudoobscura) | Dpse 2 | NDSSC | RRID:FlyBase_FBst0200038 | 14011–0121.03 |
| Strain (D. pseudoobscura) | Dpse 3 | NDSSC | RRID:FlyBase_FBst0201452 | 14011–0121.100 |
| Strain (D. affinis) | Daff 1 | NDSSC | RRID:FlyBase_FBst0200081 | 14012–0141.00 |
| Strain (D. affinis) | Daff 2 | NDSSC | RRID:FlyBase_FBst0201485 | 14012–0141.05 |
| Strain (D. affinis) | Daff 3 | NDSSC | RRID:FlyBase_FBst0203594 | 14012–0141.09 |
| Strain (D. bifasciata) | Dbif 1 | KYORIN-fly | E-12733 | |
| Strain (D. bifasciata) | Dbif 2 | KYORIN-fly | E-12701 | |
| Strain (D. bifasciata) | Dbif 3 | KYORIN-fly | E-12710 | |
| Strain (D. persimilis) | Dper 1 | NDSSC | RRID:FlyBase_FBst0200020 | 14011–0111.00 |
| Strain (D. persimilis) | Dper 2 | NDSSC | RRID:FlyBase_FBst0200034 | 14011–0111.41 |
| Strain (D. persimilis) | Dper 3 | NDSSC | 14011–0111.63 | |
| Other | data repository | EDMOND | https://dx.doi.org/10.17617/3.3v |
Additional files
Download links
A two-part list of links to download the article, or parts of the article, in various formats.
Downloads (link to download the article as PDF)
Open citations (links to open the citations from this article in various online reference manager services)
Cite this article (links to download the citations from this article in formats compatible with various reference manager tools)
Divergent sensory investment mirrors potential speciation via niche partitioning across Drosophila
eLife 9:e57008.
https://doi.org/10.7554/eLife.57008


