Divergent sensory investment mirrors potential speciation via niche partitioning across Drosophila
Abstract
The examination of phylogenetic and phenotypic characteristics of the nervous system, such as behavior and neuroanatomy, can be utilized as a means to assess speciation. Recent studies have proposed a fundamental tradeoff between two sensory organs, the eye and the antenna. However, the identification of ecological mechanisms for this observed tradeoff have not been firmly established. Our current study examines several monophyletic species within the obscura group, and asserts that despite their close relatedness and overlapping ecology, they deviate strongly in both visual and olfactory investment. We contend that both courtship and microhabitat preferences support the observed inverse variation in these sensory traits. Here, this variation in visual and olfactory investment seems to provide relaxed competition, a process by which similar species can use a shared environment differently and in ways that help them coexist. Moreover, that behavioral separation according to light gradients occurs first, and subsequently, courtship deviations arise.
Introduction
The genus Drosophila provides an incredible array of phenotypic, evolutionary and ecological diversity (Jezovit et al., 2017; Keesey et al., 2019; Keesey IW et al., 2019; Markow, 2015; Markow and O'Grady, 2007; O'Grady and DeSalle, 2018). Members of this genus, which provides roughly 1500 species including the model organism D. melanogaster, inhabit all continents except Antarctica, and occur in almost every type of environment. Due to their vast variation in behavioral, morphological and natural history traits, the comparison of vinegar flies provides an enormous potential for the understanding of driving forces in evolutionary processes. In particular, the feeding, courtship and breeding sites of this genus are tremendously diverse, including both generalists and specialists, and spanning extreme dietary variation and host utilization such as different stages of fruit decay, as well as flowers, mushrooms, sap or slime flux, rotting leaves, cacti and many other sources of microbial fermentation. It is important to note that preferences in feeding and oviposition have shifted numerous times, and closely related species are known to utilize different types of food resources (Crowley-Gall et al., 2019; Crowley-Gall et al., 2016), or to visit a host at different stages of decay (Karageorgi et al., 2017; Keesey et al., 2015; Ometto et al., 2013). At the same time, it is common to find phylogenetically distant species using the same host, or living in overlapping environments (Hey and Houle, 1987; Lachance et al., 1995; Martin, 1998; Taylor, 1987; Taylor and Powell, 1978). Therefore, the spatial distribution of species over discrete patches of an ecosystem, such as within a temperate forest, might vary according to discrete microhabitats. While little ecological information is available for a majority of the non-melanogaster species, it has been shown repeatedly that many of the members of the obscura species group overlap geographically as well as ecologically in their utilization of temperate forest ecosystems (Bächli et al., 2006; Burla et al., 1986; Michell and Epling, 1951). Moreover, these local environments may create different selective and energetic pressures for neuroanatomy (Niven and Laughlin, 2008) that in turn could provide an opportunity and rationale for the coexistence of many species within a single habitat or ecological niche (Finke and Snyder, 2008; Griffin and Silliman, 2011).
In an earlier paper, we showed that robust idiosyncrasies exist between visual and olfactory investment across this genus (Keesey et al., 2019), including many examples of inverse variation within a subgroup, and between sympatric species and subspecies that utilize seemingly identical host plants or food resources. However, most vinegar fly species have an understudied ecology, and other than information about where and when they were collected for laboratory establishment, we often know very little about their natural habitats or ecological preferences. The aim of the present paper is to determine whether behavioral, phenotypic, and neuronal differences between close relatives all combine to support the coexistence of different species within a single ecological habitat. As predicted by our initial hypotheses, we document that these sensory traits vary significantly between two close relatives within the obscura group – D. subobscura and D. pseudoobscura – and we examine in detail the potential driving forces of speciation, such as biotic and abiotic factors, including courtship modalities and phototactic response. Next, we expand our research objectives to predict sensory variation in monophyletic species based on our hypothesis from the obscura group, including D. persimilis, D. affinis and D. bifasciata, where we test our hypothesis that this sensory variation will consistently occur across subgroups within the obscura clade. Here, we assert that even between close, phylogenetic relatives as well as sympatric species, these differences in visual and olfactory sensory investment are strongly apparent. We propose that these sensory differences could reduce interspecies competition via resource partitioning and through innate variation in microhabitat or microclimate preferences, thus promoting speciation, novel niche establishment, as well as stabilizing selection using natural sensory trait variation across this important genus of insects. Moreover, behavioral differences related to phototaxis appear to be more significant between sympatric species, and thus niche partitioning may be the initial driving force, whereas differences in courtship then promote and maintain speciation events.
Results
External morphology of sensory systems
In order to examine the sensory traits of five closely related and often co-occurring species – D. persimilis, D. affinis, D. bifasciata, D. subobscura and D. pseudoobscura – we quantified their visual and olfactory investment by first measuring the external morphology of their visual and olfactory systems. Here, we first focused on the two best studied members, D. subobscura and D. pseudoobscura, where previous work has already suggested potential differences (Keesey IW et al., 2019; Ramaekers et al., 2019; Tanaka et al., 2017). Eight to 10 females of these species were photographed using a Zeiss AXIO microscope, including lateral, dorsal, and frontal views. We then measured across a variety of physical characteristics, such as surface areas of the compound eye, antenna, maxillary palps, ocelli, and overall body size, as well as head, thorax, abdomen and femur length. We also generated metrics for the number of ommatidia as well as measures of trichoid sensilla for each species. It is not possible to distinguish between antennal trichoid one (at1) and antennal trichoid four (at4), at least not based on morphology alone. Therefore, we clarify herein that trichoid measurements refer collectively to both at1 and at4 across those examined Drosophila species. In general, we found that D. subobscura possessed much larger eyes in regards to surface area, as well as 25–30% more ommatidia than its close relative, D. pseudoobscura, though ommatidia diameter was identical (Figure 1A–E; Figure 1—figure supplement 2F). While there was some variation in individual size within and between species (with D. subobscura exhibiting larger dimensions in all measured body parts; Figure 1—figure supplement 1A–E), we note that eye surface area was consistently correlated with ommatidium number (Figure 1D), suggesting that eye surface area provides a good approximation of visual investment. Here, we note that both of these two species had a nearly identical linear relationship between surface area and number of ommatidia (Figure 1D), with D. subobscura possessing larger eyes. While D. pseudoobscura possessed smaller eyes and a reduced ommatidium count, females of this species instead displayed larger antennal surface areas relative to D. subobscura females (Figure 1A–C,F). Interestingly, not all metrics related to sensory organs on the head were different between these closely related species. For example, the maxillary palps (Figure 1G) did not display any significant variation in surface area, but we do note differences in the ocelli (Figure 1—figure supplement 2C–E). Thus, these changes to sensory systems on the head appear mostly restricted to the antenna and to the visual sensory modalities.

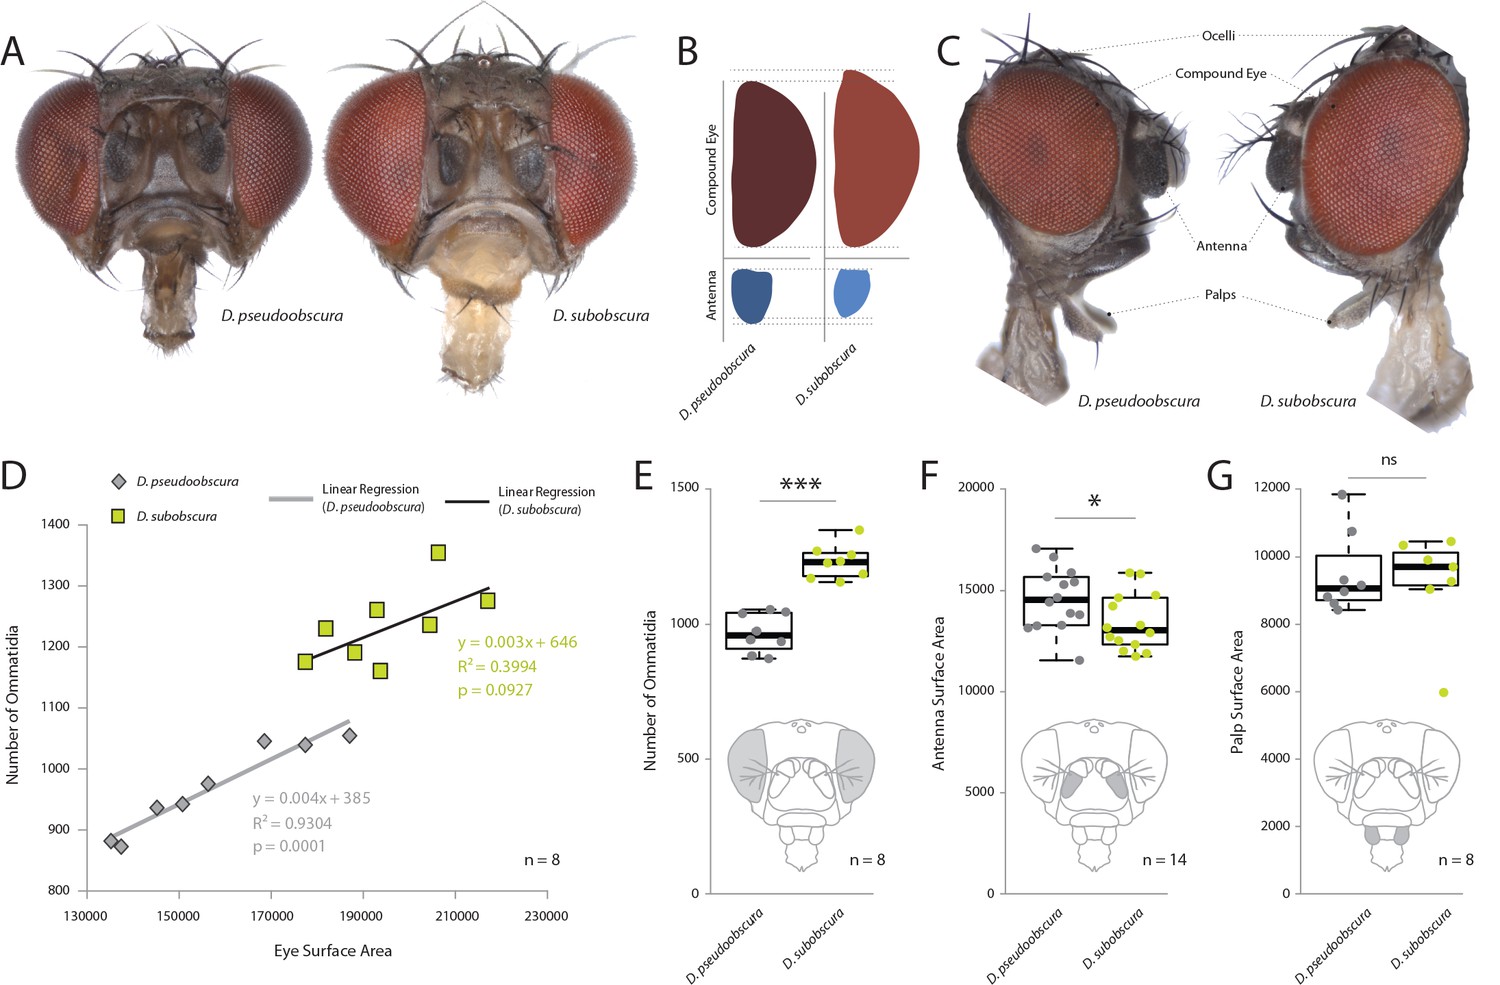
Comparative morphology of external sensory systems.
(A) Examples of frontal head replicates, where eye and antenna surface area was measured from females. Note the differences in pigmentation, as well as the size of the compound eye and third antennal segment from both species. (B) Side-by-side comparison of both the compound eye (red) and third antennal segment (blue) from each fly. (C) Example of lateral views used for measurements, including compound eye surface area, antennal surface area, and maxillary palp surface area. (D) Intra- and interspecies correlations between eye surface area and the number of ommatidia for D. subobscura (yellow) and D. pseudoobscura (grey). (E–G) Comparison of ommatidia counts (E), antennal surface (F), and palp surface (G) for both species. Boxplots represent the median (bold black line), quartiles (boxes), as well as 1.5 times the inter quartile range (whiskers). Mann-whitney U test; ***, p<0.001; *, p<0.05; ns, p>0.05.
-
Figure 1—source data 1
Morphometrics across the obscura group.
- https://cdn.elifesciences.org/articles/57008/elife-57008-fig1-data1-v2.xlsx
Comparative neuroanatomy of visual and olfactory investment
As we had already established divergent external morphology between these two species, especially in regards to vision and olfaction, we next focused our attention on the primary processing centers in the brain for these sensory systems, including the antennal lobe (AL) and optic lobe (OL) (Figure 2AB). After correcting for adult size (using the remaining hemisphere or central brain volume as a reference for each species; in grey) (Keesey et al., 2019), we identified a relative increase of the AL size for D. pseudoobscura (Figure 2C), as well as a relative decrease of the size of its OL (Figure 2D) when compared to the same neuropils for D. subobscura adults. These inverse values between the two sensory systems correspond strongly to the variations we measured in the external morphology, where one species had larger eyes but smaller antennae, and vice versa. Moreover, to highlight the regions of the OL that show the largest increases, we provide similar metrics for relative size for the lobula plate, lobula and the medulla (Figure 2E), where all brain regions (again when corrected for total brain size; in grey) are bigger in D. subobscura, but only the medulla is significantly larger.

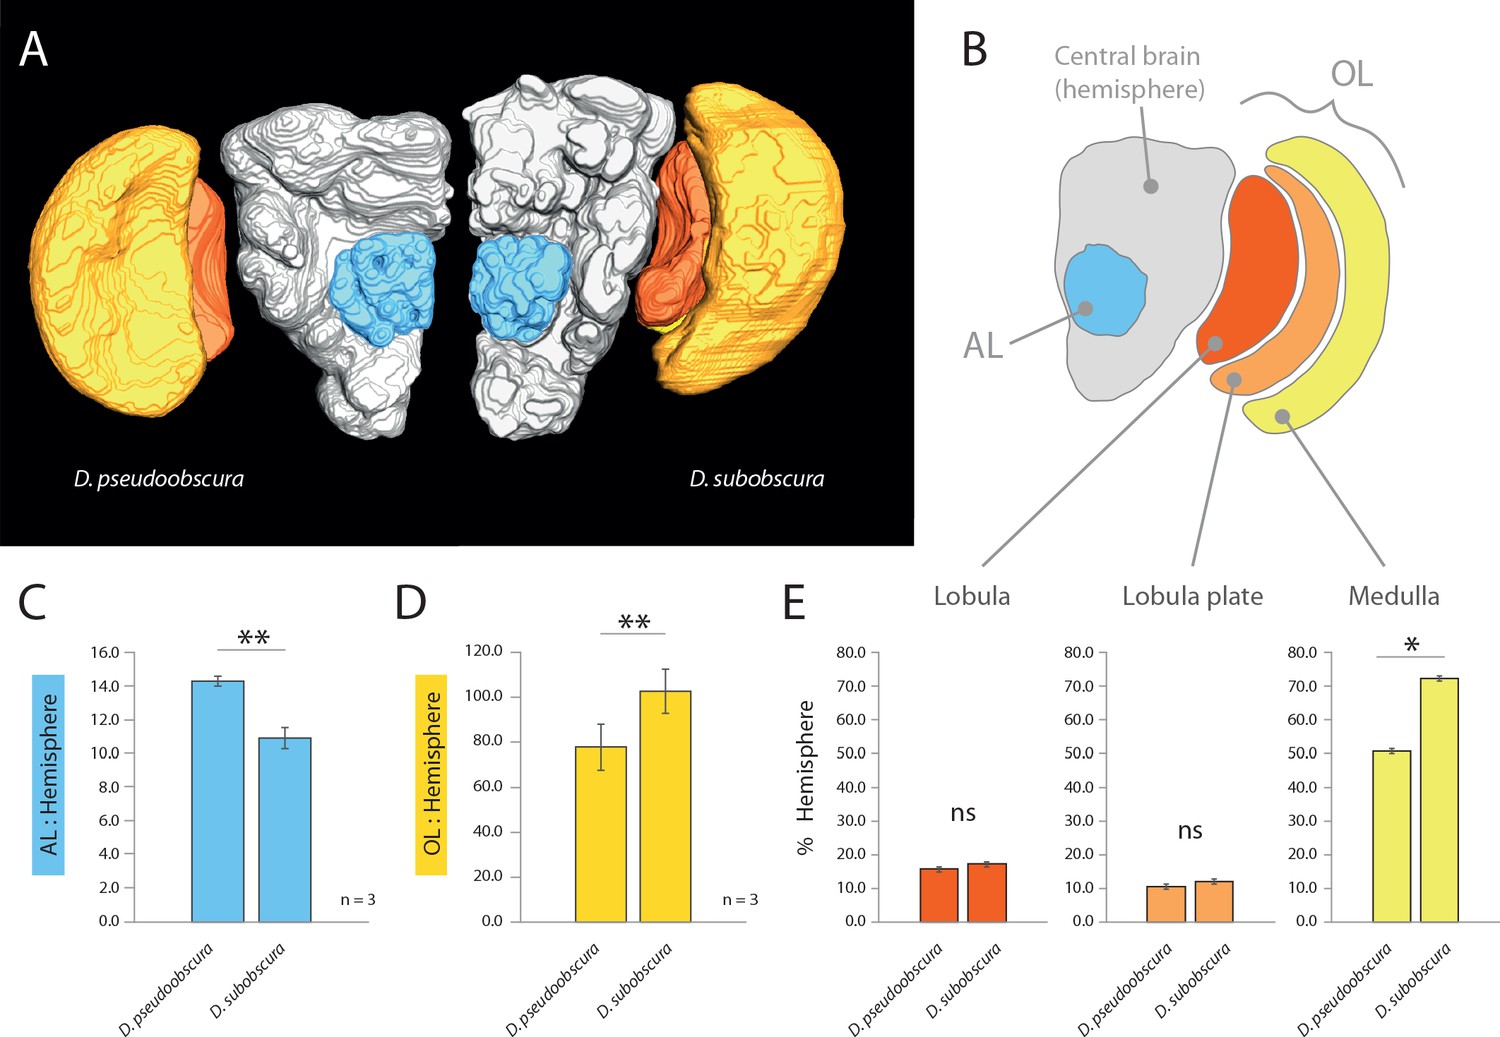
Comparative morphology of primary processing centers in the brain.
(A) Three-dimensional reconstructions of the neuropils of D. pseudoobscura and D. subobscura adult females. (B) Diagrammatic representation of the brain, with color-coded and labeled volumetric sources. AL, blue; hemisphere, grey; optic lobe, OL, with medulla (yellow), lobula (red) and lobula plate (orange). (C–E) Relative size of AL (C), OL (D), and lobula plate, lobula, and medulla (E) as compared to respective hemisphere [%].
-
Figure 2—source data 1
Metrics associated with visual and olfactory neuropils.
- https://cdn.elifesciences.org/articles/57008/elife-57008-fig2-data1-v2.xlsx
Courtship and mating behavior differences between obscura species
In order to ascertain the possible ramifications of inverse eye and antenna variation between our two species, we proceeded to examine behaviors related to mate selection and courtship. Previous research has shown that D. subobscura displays light-dependent courtship, and will not successfully copulate in the dark (Wallace and Dobzhansky, 1946; Grossfield, 1971; Spieth, 1952). Counter to this, D. pseudoobscura mating is light-independent, and courtship can successfully occur regardless of light conditions (Brown, 1964; Wallace and Dobzhansky, 1946; Grossfield, 1971; Ripfel and Becker, 1982; Spassky, 1967). Therefore, as we wanted to observe and dissect the behavioral motifs and succession of events that lead to successful courtship, we performed courtship trials under identical conditions for both species. We recorded videos (Video 1 and Video 2) using virgin males and females that were introduced into a small courtship arena (Figure 3). Several differences were immediately noted between the species. D. pseudoobscura males oriented themselves either behind or to the side of the female during courtship, often forming a right angle to her with the male head focusing on the last few abdominal segments of the potential mate (Figure 3A). Next, this species performed characteristic wing vibrations and singing, with the outstretched wing always nearest to and in the direction of the head of the female (Figure 3A), and with the male constantly in pursuit of the female from behind or from the side. It is not clear if larger pedicel size (i.e. Johnston’s organ) correlates with species that perform songs, but future work will address this hypothesis. In stark contrast, observations of the courtship of D. subobscura showed that the males of this species often dart around in a circular arc to put themselves directly in front of the path of the female, and appear to arrest her movement (Figure 3B,C). This frontal positioning by the D. subobscura male results in most of the subsequent courtship behaviors occurring in front of the female and within her visual field, including the male wing displays. Here, D. subobscura was not observed to vibrate the outstretched wing (unlike D. pseudoobscura males, which are known to sing), and instead, seemed to angle or tilt the outstretched wing during the display, possibly as a flash of color via wing interference patterns (WIPs) (Shevtsova et al., 2011) or another visual exhibition for the female (Figure 3B,D,E).
Courtship behavior video clip examples for D. subobscura adults.
Courtship behavior video clip examples for D. pseudoobscura adults.

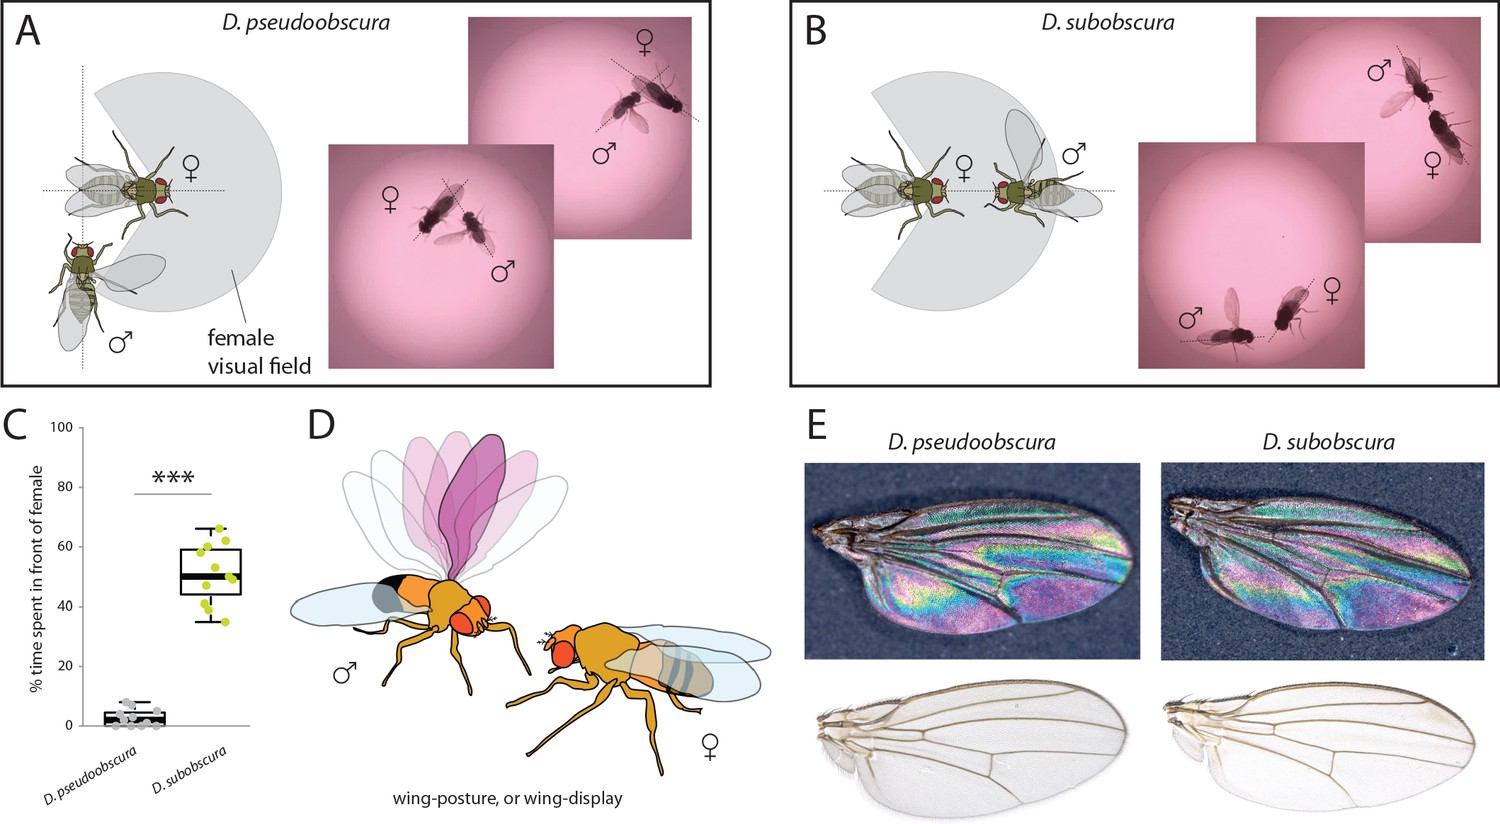
Courtship and mating behavior.
(A–B) Images of courtship for D. pseudoobscura (A) and D. subobscura (B) and schematic of the behavior, whether the male is in- or outside the predicted visual field of the female. (C) Time that males spent within the female visual field during courtship. Boxplots represent the median (bold black line), quartiles (boxes), as well as 1.5 times the inter quartile range (whiskers). Mann-Whitney U test; ***, p<0.001 (D) Diagram of D. subobscura wing display by the male, where no wing vibration was observed, and instead, a discrete range of wing angles was presented and maintained towards the female mating partner during courtship. (E) Stable structural wing interference patterns observed across the otherwise clear wings of males of both species.
Phototactic responses by close-relatives of the obscura group
Given that we had established that differences in compound eye and antenna sizes correlated with differences in courtship behavior, we next examined whether the morphological investments played any additional role in ecological decisions related to environmental preferences. Here we utilized a simple Y-tube two-choice behavioral assay, where adult flies from each species could select between a light or dark environment (Figure 4A). We observed that the smaller-eyed D. pseudoobscura significantly preferred to enter the Y-tube arm that was in shadow and darkened (Figure 4B). In contrast, the larger-eyed adult D. subobscura significantly preferred the Y-tube arm that was in full light.

Light preferences and hypothesized niche partitioning by both species.
(A) Two diagram views of the Y-tube phototactic response paradigm. Single flies were allowed to choose between either a well-lit or a darkened arm of a Y-tube. (B) Percentages of male and female flies of both species choosing the well-lit or darkened arm of the y-tube. (C) Diagram of ecological niche partitioning where our closely-related Drosophila species divide spatially across microhabitats within the same environment, and where light gradients act as an isolation barrier. Here we propose that these obscura species, despite sharing a forest ecology, create a reduction in either host resource or mating competition via their different preferences toward edge and open canopy environmental conditions, as related directly to their innate preferences for light intensity.
-
Figure 4—source data 1
Y-tube assay and phototaxis dataset.
- https://cdn.elifesciences.org/articles/57008/elife-57008-fig4-data1-v2.xlsx
Expansion of hypotheses to include additional species
Using the same behavioral, phenotypic and morphological examinations, we tested our hypotheses of sensory trait variation across three additional members of the obscura group. Here we included D. persimilis, which is a well-studied, sympatric species for direct comparison to D. pseudoobscura, as well as D. affinis, which also shares North American habitats with these two species. We also added D. bifasciata, which is a member of the obscura subgroup, and is endemic to Asia. In total, these five vinegar flies represent a reasonable phylogenetic spectrum, and provide example species from four of the main subgroups of the obscura clade. After collecting images from several angles including frontal views (Figure 5A), we analyzed in depth the visual and olfactory morphology of each new species, ultimately generating an eye-to-funiculus ratio (EF ratio) for each fly (Figure 5A–C), which has been used previously to compare sensory systems from species of differing absolute size (Keesey IW et al., 2019). Moreover, we examined three populations of each species in order to examine the consistency of EF Ratio within and between our five obscura species. Subsequently, we again repeated the same behavioral regimes using these new obscura members, including both y-tube phototaxis as well as species-specific courtship ethology. In these cases, we documented a rather steady variance in positive or negative phototaxis across this growing phylogenetic examination, with our initial two species (e.g. D. pseudoobscura and D. subobscura) representing the two extremes (Figure 5D). Similarly, we also observed a consistent change in male courtship behavior, as measured by the percentage of time the male of each new species spent in front of the female during his dance or mating display. By documenting the relationship between our ommatidium counts and our estimates of the surface area of the compound eye, we conclude that diameter of ommatidia does not vary between our species (Figure 1—figure supplement 3), and we conclude that surface area is a consistently accurate metric for estimating the number of visual facets in the obscura group (Figure 5E). We do note variation in the absolute size of flies within each species, and future research should examine this aspect for additional assessments of sensory plasticity or constraints, perhaps related to population density. However, to generate similar sized adults, we controlled rearing density for consistent adult sizes across both morphological and behavioral assessments. Interestingly, we also describe correlations between EF ratio and phototaxis across our species, as well as the percentage of courtship the male spends in front of the female (Figure 5F,G). In both instances, larger EF ratios correspond tightly with increases in positive phototaxis (i.e. attraction to light) and correspond strongly with increases in courtship behaviors generated while in front of the female, which we presume are related to the importance of visual sensory signals. Here we note that some of the largest behavioral differences (i.e. slope between individual species) still occur between closest phylogenetic relatives, including D. pseudoobscura and D. persimilis (Figure 5F,G), which represent the most-studied and well-published sympatric species pair from the obscura group. In these sympatric species, we see larger behavioral variations (y-axis) than changes in morphology (x-axis), suggesting that perhaps even small tradeoffs in olfactory or visual sensory systems can generate robust changes in behavior (Figure 5F,G). Here, we note that changes in phototaxis between sympatric species appear to be stronger and more acute than changes in courtship dynamics (Figure 5D,F,G). Moreover, we observe that the slope of the correlation between phototaxis and EF Ratio for the sympatric species is greater than the slope related to the rest of the obscura subgroup (Figure 5F; orange vs grey).

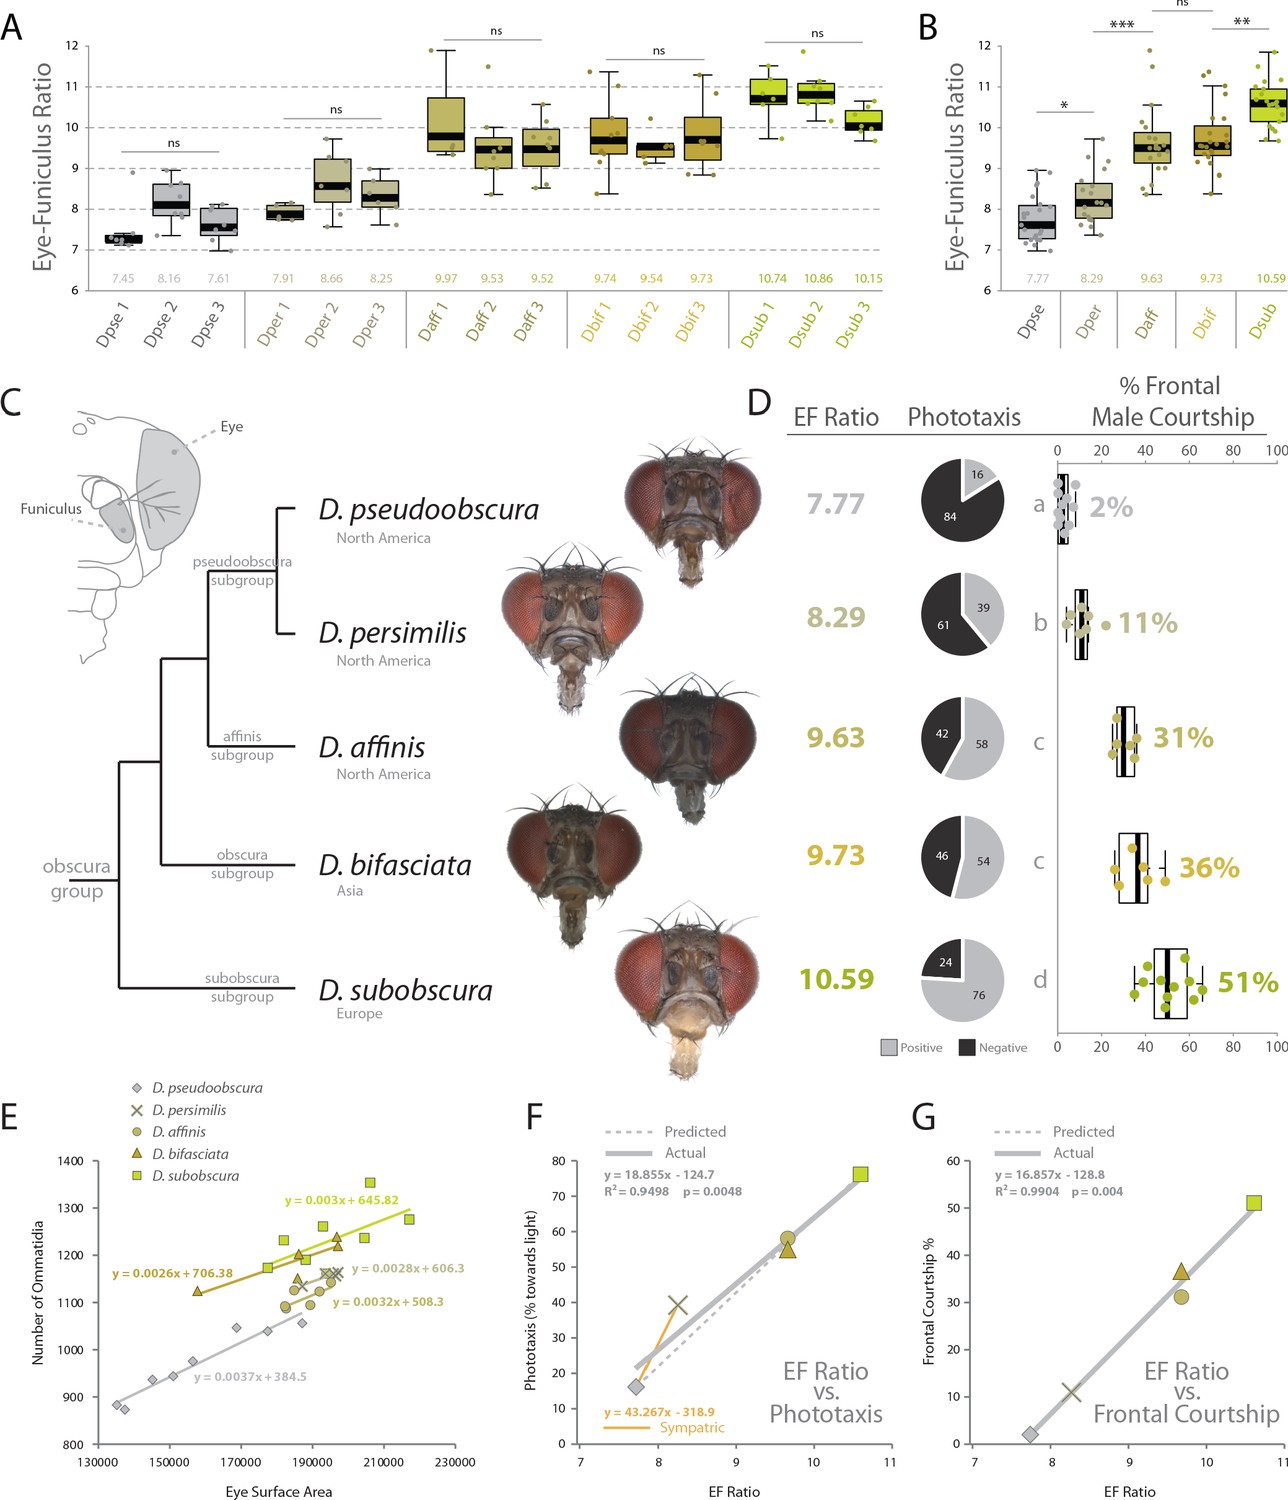
Behavioral relevance of sensory investment in 5 species of the obscura group.
(A) Measures of eye-to-funiculus ratio (EF ratio) across 15 populations of obscura species. (B) Statistical assessments of average EF Ratio between each species. (C) Diagram of morphology used to generate EF ratio for each species and the phylogenetic relationship of these five members of the obscura group (Crysnanto and Obbard, 2019; O'Grady, 1999), as well as examples of the frontal head images used to collect certain morphological data. Additional images are available with the online version of this publication. (D) Eye-to-funiculus ratio for each measured species, as well as the male phototactic response during y-tube trials. More details about phototaxis behavioral regimes are available in Figure 4. In addition, courtship videos from each species were addressed to quantify the amount of time the male spent in courtship, and shown are what percentage of that courtship time was spent in front of the female (see Figure 3 and supplementary videos for more detail). (E) Morphological measurements of eye surface area and the number of ommatidia collected from lateral views of each species. (F) Correlation between EF ratio and positive phototaxis for all tested obscura species. Our hypothesized correlation is shown with a dashed line, which stems from initial comparison of just two species (D. pseudoobscura and D. subobscura), while the actual correlation following the additional analyses of three new species is shown using a solid line. (G) Correlation between EF ratio and the percentage of male courtship spent in front of the female during his dance or display ethology.
-
Figure 5—source data 1
Morphometrics for intraspecies and interspecies comparisons.
- https://cdn.elifesciences.org/articles/57008/elife-57008-fig5-data1-v2.xlsx
Discussion
When we imagine examples of isolation barriers, we often consider those that are distinctly physical in nature, such as a mountain range or a remote island biogeography. However, sensory isolation barriers also exist, including differences in pheromone chemistry between geographically overlapping species (Chung et al., 2014; Löfstedt, 1993; Löfstedt et al., 1991; Mitchell et al., 2015), or variations in the songs and auditory repertoires of crickets, frogs and birds (Blair, 1974; Hobel and Gerhardt, 2003; Kirschel et al., 2009; Walker, 1974). In this study, we hypothesize that sources of light gradients may also create strong selective pressures and isolation mechanisms that in turn lead to speciation events or stabilizing selection for opposing phototaxis within otherwise overlapping habitats, such as arboreal forests. Moreover, we propose that these light gradients most likely work in tandem with inverse changes in pheromone or chemosensory changes to further provide avenues for species divergence. Arboreal forest microhabitats have been addressed previously as sources for spatial separation between species (Atkinson and Miller, 1980; Montgomery and Merrill, 2017; Penariol and Madi-Ravazzi, 2013; Taylor and Powell, 1978), including studies directly related to the field-sampling of members of the family Drosophilidae, often with the division of species occurring in proximity to the forest edge. While the evolutionary selective pressures and their effects on the relative size of various components of the nervous system have not been previously examined, it has been suggested that sources of light may be one of the ambient forces driving the observed tradeoff in the evolution of these two sensory structures (Keesey et al., 2019). However, additional field studies are still needed to confirm whether these sensory investments differ outside the laboratory, and to examine how insect species sort in the wild, for example, via niche partitioning or character displacement.
Here we demonstrate that several monophyletic species within the obscura group, despite being close relatives, deviate significantly in regards to both eye and antenna morphology (Figure 1), as well as in their corresponding neuropils for vision and olfaction (Figure 2). In addition, we observe that this variation in sensory systems positively correlates with both courtship behavior (Figure 3) and environmental habitat preferences (Figure 4), especially as related to the relative importance of visual stimuli or sources of light, which appears to be of opposing value between these sibling species (Figure 5). Previous work has documented this tradeoff or inverse resource allocation between vision and olfaction across more than 60 species within the Drosophila genus (Keesey IW et al., 2019), but the ecological mechanisms and selective pressures underlying this divergence have not been studied as explicitly in monophyletic species groups or subgroups. While little ecological information is available for a majority of the non-melanogaster species, it has been shown repeatedly that many of the members of the obscura species group overlap geographically as well as ecologically in their utilization of temperate forest ecosystems (Bächli et al., 2006; Burla et al., 1986; Michell and Epling, 1951). In addition, there has been documentation of a recent geographical overlap between D.pseudoobscura and D. subobscura in North America, which might make for an ideal field study in the future to test our hypotheses regarding environmental partitioning and the evolution of sensory variation (Noor, 1998; Pascual et al., 1998). However, the species D. pseudoobscura and D persimilis have been well established as sympatric (Crysnanto and Obbard, 2019; O'Grady, 1999), and already act as models for genetic variation in phototaxis and courtship (Brown, 1965; Brown, 1964; Hernández and Fabre, 2016; Noor and Aquadro, 1998; Ripfel and Becker, 1982). However, these behaviors have not been previously studied concurrently, nor with the overlay of morphological and neurobiological data across both visual and olfactory sensory systems. In these two evolutionarily sympatric species (i.e. D. pseudoobscura and D persimilis), we demonstrate significant deviation in visual and olfactory behavior, including both phototactic response and potential visual bias during male courtship (Figure 5D–G), thus supporting our initial proposal that variance in sensory investment occurs even within closest, sympatric species across this genus. While we have sampled several species, it would also be important to address additional Drosophila species within the obscura group, such as D. tristis, D. tsukabaensis, D. obscura, D. miranda, D. iowei, D. ambigua and D. helvetica. This is especially true in cases where these species potentially share ecological overlap in habitat utilization or geography, and where genomic information is perhaps readily available for additional analyses of the molecular mechanisms for this sensory tradeoff (Ramaekers et al., 2019). In the present study, we test the hypothesis that close insect relatives may divide host or habitat resources through niche partitioning by inversely prioritizing the relative importance of visual stimuli as compared to those stimuli that are olfactory. This explanation would be consistent with previous observations that monophyletic species often possess inversely correlated eye and antenna sizes despite being close relatives and despite sharing seemingly identical hosts and environmental preferences (Gaspar et al., 2020; Keesey et al., 2019; Özer and Carle, 2020; Ramaekers et al., 2019). In addition, this hypothesis continues to be consistent with the more in depth analyses afforded by the present study, which documents this sensory inversion across the obscura group, including across close, sympatric relatives, as well as across several populations or strains of each species (Figure 5A,B). Please note that surface areas of the various head and thorax, as well as overall body size, were examined for only one strain per species. It thus remains to be confirmed that the observed differences are truly interspecific. Future research should continue to address both interspecies and intraspecies variation in sensory investment, especially as related to both causal agents and genetic underpinnings of this divergence.
Microhabitats often arise in nature, as landscapes are inherently non-uniform (Martin, 1998; Scheffers et al., 2014). These ecological subdivisions have been examined in regards to cline variation or altitude (Griffiths et al., 2005; Michell and Epling, 1951; Parsons, 1991), as well as temperature gradients or differences in water availability (Enjin et al., 2016; Parsons, 1991; Scheffers et al., 2014; Toda, 1992). In addition, several studies have addressed microhabitat variation and its effects on species richness or biodiversity. Moreover, that plant hosts and other nutritional resources such as fungi and yeasts can differ greatly between forest edge and forest interior (Bächli et al., 2006; Łuczaj and Sadowska, 1997; Penariol and Madi-Ravazzi, 2013; Toda, 1992). Thus, it is well recognized that flora and fauna can vary in both their relative abundance as well as their innate preferences across microclimates within a single habitat, where the fitness of a Drosophila species is intimately tied to its ability to compete for resources within its own environmental niche (Koerte et al., 2020; Qiao et al., 2019). However, the mechanisms by which these innate animal preferences for microhabitats can generate evolutionary pressures or speciation events has not been as thoroughly documented, least of all in a set of model organisms where robust molecular genetic toolkits are available, such as those afforded by the Drosophila genus.
Other insects have been examined for their differences in circadian rhythm or phenology, either in regards to host search or mating behaviors, where close relatives are able to reduce competition by varying their activity cycles (Mitchell et al., 2015). Conversely, it has been well-documented that both D. pseudoobscura and D. subobscura share similar crepuscular activity (Atkinson and Miller, 1980; Bächli et al., 2006; Michell and Epling, 1951; Noor, 1998). Thus, at this juncture we do not feel that the circadian rhythms or seasonal activities of feeding or courtship play any distinct role in the observed evolutionary divergence in relative eye or antenna size. As such, while the light-dependent courtship of D. subobscura suggests a difference from that of D. pseudoobscura in daily patterns of mating, this has not been shown (Atkinson and Miller, 1980; Michell and Epling, 1951; Noor, 1998). Thus, we suggest that it is more likely that D. subobscura simply uses consistent visual stimuli as a species-defining trait, perhaps initiated via a preference for a better-lit arena to perform their courtship ritual and to attract a potential mate. This would include such microhabitats as a forest edge or an open forest canopy (Figure 4C), where visual elements of courtship such as wing displays would be more optimally employed for species identification and female sexual selection given the increases in light availability. Here, we suggest while these species are assumed to be linked via a forest ecology (Bächli et al., 2006; Burla et al., 1986; Michell and Epling, 1951), that D. pseudoobscura may be more likely to prefer darker, inner-forest habitats, while D. subobscura would prefer the forest edge or sections of open canopies within the same forest environment (Figure 4C). This light preference would therefore create opposing spatial regions of highest abundance, where each species would reduce overlap with the other by tuning their sensory systems towards either larger-eyes and positive phototaxis, or smaller eyes and negative phototaxis. We thus propose that this shift in the nervous system would then affect both courtship and host preference. Here, field studies in the 1980s using baited traps did not find a distinct difference in capture across light versus dark areas for D. subobscura (Atkinson and Miller, 1980). However, as mentioned before, additional fieldwork is still needed to continue to test our hypotheses outside of the laboratory, and within naturally occurring populations, for example, in relation to abiotic measures of light gradients and GPS studies of forest canopy cover, and in locations where several species co-occur. It is important to note that, to our knowledge, of the 1200–1500 species of Drosophila that have been documented, none have been described to be nocturnal (which could be an alternative factor for the evolution of especially large and light-sensitive eyes). Thus, it is reasonable that increases in eye size for this genus correlate so strongly with positive phototaxis and correlate with visually mediated courtship (Figure 5F,G), and we propose this occurrence may extend toward all members of the Drosophila genus (Keesey et al., 2019). Moreover, the importance of potential visual displays in courtship and predator avoidance has also been previously examined in some Lepidopterans, including phylogenetic studies across spatial and ecological gradients (Montgomery and Merrill, 2017), as well as in regards to the genetics of wing pigmentation, especially wing spots (Zhang and Reed, 2016). As such, there may be additional factors to address in this interplay between visual and olfactory investment, especially if these same or related genes can be shown to have additional effects beyond the head, for example on the wing pigmentation or across other morphological fodder for evolutionary pressures to exert meaningful sensory changes.
The utilization of forest openings are well studied in avian biology, where males often construct and clear elaborate arenas to perform intricate visual displays for females (i.e. the genus Parotia or six-plumed birds of paradise) (Ligon et al., 2018). However, to our knowledge, the visual capabilities across vertebrate animal species has never been compared to examine evolutionary investments in the nervous system that correlate with visual courtship, and never in regards to alternative sensory methods of courtship such as olfactory or pheromone driven mating rituals. Again, we feel it is likely that investment in the visual system might mirror the tendency of any Drosophila species to possess a positive phototaxis, as all documented species are diurnal. Here we demonstrate that tendency among these five obscura species, although it remains unclear which of these behavioral phenotypes occurs first (e.g. phototaxis or visual courtship), and which behavior subsequently drives a correlation in the other trait over the course of evolutionary time. Using our sympatric species (e.g. D. pseudoobscura and D. persimilis; Figure 5D,F,G), we observe that small changes in morphological investment (EF ratio) correlate with dynamic differences in behavior. Here we note that changes in phototaxis between sympatric species appear to be stronger and more acute than changes in courtship dynamics (Figure 5D,F,G). For example, we observe that the slope of the correlation between phototaxis and EF Ratio for the sympatric species is greater than the slope related to the rest of the obscura subgroup (Figure 5F; orange vs grey). Thus, we hypothesize minor shifts in morphology and neurobiology between sensory components of the nervous system first create exaggerated changes in phototaxis behavior, perhaps due to a spontaneous developmental mutation. This might initially separate species spatially and then subsequently, courtship characteristics start to drift apart (e.g. chemical, auditory or visual cues), which ultimately leads to a division that no longer allows successful mating or progeny to occur and thus that incipient species diverge more permanently.
An alternative hypothesis would be that the phototaxis behaviors may have switched before morphology for some species, through an as of yet unknown mechanism, in order to push these species towards more shaded environments (i.e. perhaps to avoid desiccation pressures). As the visual system is inherently expensive to maintain (Niven and Laughlin, 2008), this could produce a reduction in the visual system, with the evolutionary pressure being energy preservation. Thus, reduction in visual investment would be a consequence, not a driving force, of niche partitioning. This is similar to what occurred within cavefish, where these species living in complete darkness have lost their eyes entirely. However, it is not thought that the fish went to the caves and then speciated as a consequence of losing their vision, rather that the cavefish specialized only after entering into the cave environment, where the no-longer useful eyes were eventually lost. This concept of the evolutionary order of events goes in a direction that remains puzzling across the animal kingdom. Nocturnal animals usually have two pathways for visual investment, either to increase or decrease the eyes. Here, the selection of the preferred visual investment is also not consistent across nocturnal examples, such as owls (large eyes) compared to bats (small eyes). Thus, the evolutionary decision about visual investment seems to rely on the respective starting point for the species or organism, for example if there already has been large visual or auditory investment, then this is perhaps more prioritized over generations. There may also be additional developmental constraints. Moreover, while these cavefish have entirely lost their eyes, as they are in absolute darkness and therefore represent a very extreme habitat example, many deep-sea fish, in direct contrast, have actually increased their eye size investment (e.g. despite the complete darkness), as they perhaps have to observe all manner of bioluminescence. Thus, overall, this is a difficult evolutionary concept to clarify fully, and in absolute terms, especially without more data from additional animal species. Again, we also point out that zero Drosophila species are described as nocturnal, thus variation in eye size may be under significantly different pressures than nocturnal insects, such as crickets (i.e. Orthopterans), which have often greatly increased their visual investment for their nocturnal activity. Here in the present study, we observe that the more significant changes in phototaxis still occur between close, genetic relatives, which appear prior to significant changes in courtship (Figure 5D,F,G). As such, we continue to predict that niche partitioning, character displacement, and response to light gradients are the stronger initial driving forces of the evolution and speciation within the obscura group, where the novel environmental conditions drive sensory investment that in turn optimizes the courtship success of each species in this new niche.
It continues to be unclear which are the most important factors in the visual displays of D. subobscura during courtship, for example, whether outstretched wings provide a specific color or UV pattern (Shevtsova et al., 2011), or whether this wing display simply generates a flash of bright light reflected toward the female (Figure 3B,D,E). Moreover, it has been shown that male D. subobscura do not sing, and thus do not vibrate their wings during display, but we do observe midleg tapping or drumming, which may instead be the auditory component of their courtship ethology. Further work is still needed to qualify and quantify the courtship variation between these species, especially as it pertains to multimodal sensory integration. Thus far, no research has simultaneously compared visual and auditory neurobiology or development for these species, but future work should attempt to encompass these and other sensory modalities. Additional studies will also need to address which photoreceptors are expanded in the compound eye of D. subobscura and how they validate the increases in ommatidium numbers when compared to other close relatives. However, previous research has already shown an expansion of the fruitless positive labeled cells in the optic lobes of D. subobscura as compared to D. melanogaster (Tanaka et al., 2017). Thus, while this pathway has not been addressed yet in D. pseudoobscura or any other members of the obscura group, it is perhaps again indicative of an evolutionary investment in visual modalities for courtship success, given the visual connection to this fruitless labeled neural pathway. Moreover, additional studies should address any sensory investment differences between the sexes, especially given that the fruitless neural network is sexually dimorphic (Gaspar et al., 2020; Tanaka et al., 2017).
Nevertheless, it is apparent from our current data that variation in visual and olfactory sensory system development occurs for more than just mating purposes, and appears to match ecological deviations in behavioral phototaxis and microhabitat preferences for light within a shared ecological niche. In the future, it will continue to be important to test our theories related to niche partitioning as an evolutionary force for speciation across other groups beyond obscura and to continue to provide ecological explanations for the observed variation or tradeoff between these two sensory systems in relation to other geographical overlap and between competing species across the entire genus. In general, additional work is still needed to qualify and quantify the diverse sensory-driven behaviors across this genus of insects, especially as related to their natural ecology and not just laboratory assays, in order to pave the way for future analyses using genetic resources to identify the neural mechanisms governing these morphological and behavioral variations between sensory systems.
Materials and methods
Reagent type (species) or resource | Designation | Source or reference | Identifiers | Additional information |
---|---|---|---|---|
Strain (Drosophila subobscura) | Dsub 1 | NDSSC | RRID:FlyBase_FBst0203739 | 14011–0131.16 |
Strain (D. subobscura) | Dsub 2 | NDSSC | RRID:FlyBase_FBst0201472 | 14011–0131.04 |
Strain (D. subobscura) | Dsub 3 | NDSSC | RRID:FlyBase_FBst0201473 | 14011–0131.05 |
Strain (D. pseudoobscura) | Dpse 1 | NDSSC | RRID:FlyBase_FBst0200037 | 14011–0121.00 |
Strain (D. pseudoobscura) | Dpse 2 | NDSSC | RRID:FlyBase_FBst0200038 | 14011–0121.03 |
Strain (D. pseudoobscura) | Dpse 3 | NDSSC | RRID:FlyBase_FBst0201452 | 14011–0121.100 |
Strain (D. affinis) | Daff 1 | NDSSC | RRID:FlyBase_FBst0200081 | 14012–0141.00 |
Strain (D. affinis) | Daff 2 | NDSSC | RRID:FlyBase_FBst0201485 | 14012–0141.05 |
Strain (D. affinis) | Daff 3 | NDSSC | RRID:FlyBase_FBst0203594 | 14012–0141.09 |
Strain (D. bifasciata) | Dbif 1 | KYORIN-fly | E-12733 | |
Strain (D. bifasciata) | Dbif 2 | KYORIN-fly | E-12701 | |
Strain (D. bifasciata) | Dbif 3 | KYORIN-fly | E-12710 | |
Strain (D. persimilis) | Dper 1 | NDSSC | RRID:FlyBase_FBst0200020 | 14011–0111.00 |
Strain (D. persimilis) | Dper 2 | NDSSC | RRID:FlyBase_FBst0200034 | 14011–0111.41 |
Strain (D. persimilis) | Dper 3 | NDSSC | 14011–0111.63 | |
Other | data repository | EDMOND | https://dx.doi.org/10.17617/3.3v |
External morphometrics from head and body
Request a detailed protocolFor each fly species, 8–10 females were photographed using a Zeiss AXIO Zoom.V16 microscope (ZEISS, Germany, Oberkochen), including lateral, dorsal, and frontal views. We utilized the following laboratory strains: D. subobscura (#1, 14011–0131.16; #2, 14011–0131.04; #3, 14011–0131.05), D. pseudoobscura (#1, 14011–0121.00; #2, 14011–0121.03; #3, 14011–0121.100), D. affinis (#1, 14012–0141.00; #2, 14012–0141.05; #3, 14012–0141.09), D. persimilis (#1, 14011–0111.00; #2, 14011–0111.41; #3, 14011–0111.63), and D. bifasciata (#1, E-12733; #2, E-12701; #3, E-12710). Insects were obtained from the National Drosophila Species Stock Center (NDSSC, Cornell, USA) or from KYORIN-Fly, the Drosophila species stock center at Kyorin University (KYORIN-fly, Tokyo, Japan). We reared all insects with softened standard diet and a single crushed blueberry (in order to further induce and improve egg-laying behaviors). Flies of each wild type were dispatched using pure ethyl acetate (MERCK, Germany, Darmstadt). Lateral body (40×), dissected frontal head (128×), and dissected antenna views (180×) were acquired as focal stacks with a 0.5x PlanApo Z objective (ZEISS, Germany, Oberkochen). The resulting stacks were compiled to extended focus images in Helicon Focus 6 (Helicon Soft, Dominica) using the pyramid method. Based on the extended focus images, we measured head, thoracic, abdominal, foreleg (femur), as well as funiculus and compound eye surface areas, where all measurements are in µm or µm2 (Figure 1; Figure 1—figure supplement 1). We also measured surface areas of the maxillary palps and length of the ocelli from both species; however, we did not find any significant difference for the palps (Figure 1C,G; Figure 1—figure supplement 2). Measurements of all body regions were conducted manually using the tools available in Image J (Fiji) software. All raw data available with online version of the manuscript.
Ommatidia counts and compound eye surface area metrics
Request a detailed protocolIn order to count ommatidia, the compound eye of each species was arranged laterally and perpendicular to the AXIO Zoom.V16 microscope. A total of 8–12 individuals per species were utilized, with only the best eight specimens used where the eye was completely intact and in focus, where counts were done manually using Image J (Fiji) software tools (Figure 1C–E). We also examined the association between eye surface area and ommatidia counts (Figure 1D). Here, we note that species share nearly identical linear regression analyses between the number of ommatidia and the associated surface area, thus we conclude that ommatidium diameter is identical between the two species, and that surface area is a good predictor of ommatidia number. Although we observed small variations in absolute body size within our species populations that appeared to be correlated with rearing density (e.g. high density produced smaller flies), we also observed a consistently conserved ratio between the eye and antenna morphology regardless of adult body size (data not shown). However, to control for density-dependent plasticity, we maintained both species at a consistent population size (15 females per rearing vial). This resulted in all flies for each species being nearly identical in adult body size for use in morphometric analyses as well as all behavioral examinations. We used the following populations for these measurements: D. pseudoobscura #3, D. persimilis #1, D. affinis #1, D. bifasciata #1, D. subobscura #1.
3D reconstructions and neuropil measurements
Request a detailed protocolIn order to assess neuroanatomy, the dissection of fly brains was carried out according to established protocols (Keesey et al., 2019). The confocal scans were obtained using confocal laser scanning microscopy (Zeiss confocal laser scanning microscope [cLSM] 880; ZEISS) using a 40x water immersion objective (W Plan-Apochromat 40×/1.0 DIC M27; ZEISS) in combination with the internal Helium-Neon 543 (ZEISS) laser line. Reconstruction of whole OLs and ALs was done using the segmentation software AMIRA version 5.5.0 (FEI Visualization Sciences Group). We analyzed scans of at least three specimens for each and then reconstructed the neuropils using the segmentation software AMIRA 5.5.0 (FEI Visualization Sciences Group). Using information on the voxel size from the cLSM scans as well as the number of voxels labeled for each neuropil in AMIRA, we calculated the volume of the whole AL as well as the individual sections of the OL and the central brain (where central brain values exclude the AL volume). We used these strains for all measurements: D. pseudoobscura #3, D. subobscura #1.
Analyses of courtship and mating behavior
Request a detailed protocolFor the analysis of courtship behavior, the adult flies were collected from pupae that were separated into single vials (using a wet paint brush), and then later identified by sex after subsequent eclosion. Adults were kept virgin in these single vials for 2–6 days after eclosion with access to food and water. Temperature controlled chambers were used for courtship conditions. Here we optimized the temperature for both obscura species, where courtship initiation and success was observed to be highest between 18–24 degrees Celsius, which was a substantially lower temperature than previous examinations of D. melanogaster courtship. In the behavioral assays, a female fly was first aspirated into the tiny chamber, and secured with a clear cover slide (Figure 1—figure supplement 2G). Next, a male fly was introduced into the same chamber, and video recording was initiated. The flies were recorded under white light illumination for 10–15 min. If no initiation of courtship was observed after 10 min, then videos were halted and new flies were introduced as a novel pair. Videos of successful courtship and copulation were analyzed with BORIS (http://www.boris.unito.it/). We used the following strains for these behavioral experiments: D. pseudoobscura #3, D. persimilis #1, D. affinis #1, D. bifasciata #1, D. subobscura #1.
Wing interference patterns and pigmentation
Request a detailed protocolIn order to assess visual elements of adult wings from both obscura species, individual wings from each species were photographed using an AXIO microscope, as was described previously for external head and body metrics. Both clear as well as dark, opaque backgrounds were used to examine wing interference patterns (WIPs) and any other elements of visual information that the wings represent during courtship display (Figure 3E). Here, we noted differences in wing shape, as well as sensillum and hair lengths along the wing margins of these two species. However, we did not observe any obvious differences in WIP, nor did we note any apparent differences in pigmentation, color or other visual structures. Thus, it would appear that the wings of the two species are nearly identical, and that perhaps only the behavioral utilization of the wing differs between these species during male courtship (Figure 1A–D).
Phototaxis behavior and Y-tube two-choice experiments
Request a detailed protocolA glass Y-tube was fixed and positioned at approximately a 15-degree slope (which encouraged upward walking), with one arm covered with an opaque cardboard box that was cut to match the diameter of the glass (Figure 4A). This covered area provided a heavily darkened arm of the Y-tube, while the other arm was fully illuminated. Both terminal ends of the Y-tube contained sealed glass containers for insect collection and removal. Adults were introduced into the base of the glass Y-tube using an aspirator, where adults could freely walk out of the aspirator pipette tip once they had calmed, and acclimatized to the setup (this greatly reduced escape responses, and random choices). We positioned a light source that mimics natural sunlight wavelengths at the end of the Y-tube, and all overhead illumination (as well as all other sources of light in the chamber) were eliminated. Adult flies were allowed to walk up the Y-tube where they had to then choose between either a dark or light arm, where the first choice was noted for each individual fly (Figure 4B), and time duration was also recorded (Figure 1—figure supplement 1D). After every 10 individuals, an additional, clean glass Y-tube was used (to avoid any contamination from cuticular hydrocarbons or frass/feces left behind by previous flies [Keesey et al., 2016]), and the Y-tubes were rotated after every fly to eliminate any directional bias that could be caused by imperfections in the glass or Y-tube arms. We also rotated the darkened arm every time we exchanged the Y-tube for a clean one, to eliminate any left-right bias. Each day we cleaned glassware with hot soapy water, then rinsed with cold water, then rinsed with ethanol, and lastly we heated them for several hours at 200°C before use in these behavioral assays. In both species, the males showed a stronger trend of light preference than females; however, this trend was not significant (Figure 4B). We also noted no significant differences in the time it took flies to make a choice (Figure 1—figure supplement 1D), but there was a trend that D. pseudoobscura were slighty faster, as were the males of both species when compared to females. We used the following strains for these behavioral experiments: D. pseudoobscura #3, D. persimilis #1, D. affinis #1, D. bifasciata #1, D. subobscura #1.
Statistical assessments and figure generation
Request a detailed protocolAll images and drawings are originals, and were prepared by the first author for this publication. Figures were prepared via a combination of R Studio, Microsoft Excel, IrfanView v4.52, ScreenToGif, VLC Media Player, and Adobe Illustrator CS5. Statistics were performed using GraphPad InStat version 3.10 at α = 0.05 (*), α = 0.01 (**), and α = 0.001 (***) levels. Error bars for bar graphs are standard deviation. Boxplots represent the median (bold black line), quartiles (boxes), as well as 1.5 times the inter quartile range (whiskers).
Supplementary information
Request a detailed protocolAll data supporting the findings of this study, including methodology, display examples, raw confocal images and z-stack scans, statistical assessments, courtship videos, as well as other supplementary materials are all available with the online version of this publication. An additional, online data depository also contains raw data from this publication, and this material can be accessed via EDMOND, the Open Access Data Repository of the Max Planck Society (MPG): https://dx.doi.org/10.17617/3.3v.
Data availability
All data supporting the findings of this study, including methodology, display examples, raw confocal images and z-stack scans, statistical assessments, courtship videos, as well as other supplementary materials are all available with the online version of this publication. An additional, online data depository also contains raw data from this publication, and this material can be accessed via EDMOND, the Open Access Data Repository of the Max Planck Society (MPG):https://doi.org/10.17617/3.3v.
-
EDMONDDivergent sensory investment mirrors potential speciation via niche partitioning across Drosophila.https://doi.org/10.17617/3.3v
References
-
On the microdistribution of species of Drosophilidae and some other diptera across a forest edgeMitteilungen Der Schweizerischen Entomol Gesellschaft 79:117–126.https://doi.org/10.5169/seals-402916
-
Character displacement in frogsAmerican Zoologist 14:1119–1125.https://doi.org/10.1093/icb/14.4.1119
-
Population differences in olfaction accompany host shift in Drosophila mojavensisProceedings of the Royal Society B: Biological Sciences 283:20161562.https://doi.org/10.1098/rspb.2016.1562
-
Host preference and olfaction in Drosophila mojavensisThe Journal of Heredity 110:68–79.https://doi.org/10.1093/jhered/esy052
-
Humidity sensing in DrosophilaCurrent Biology 26:1352–1358.https://doi.org/10.1016/j.cub.2016.03.049
-
Characterization of the genetic architecture underlying eye size variation within Drosophila melanogaster and Drosophila simulansG3: Genes, Genomes, Genetics 10:1005–1018.https://doi.org/10.1534/g3.119.400877
-
Phylogeny, environment and sexual communication across the Drosophila genusThe Journal of Experimental Biology 220:42–52.https://doi.org/10.1242/jeb.143008
-
Adult frass provides a pheromone signature for Drosophila feeding and aggregationJournal of Chemical Ecology 42:739–747.https://doi.org/10.1007/s10886-016-0737-4
-
Yeast communities associated with Drosophila species and related flies in an eastern oak-pine forest: a comparison with western communitiesJournal of Industrial Microbiology 14:484–494.https://doi.org/10.1007/BF01573963
-
Moth pheromone genetics and evolutionPhilosophical Transactions: Biological Sciences 340:167–177.
-
Drosophila biology in the genomic ageGenetics 177:1269–1276.https://doi.org/10.1534/genetics.107.074112
-
Cerambycid beetle species with similar pheromones are segregated by phenology and minor pheromone componentsJournal of Chemical Ecology 41:431–440.https://doi.org/10.1007/s10886-015-0571-0
-
Divergence in brain composition during the early stages of ecological specialization in Heliconius butterfliesJournal of Evolutionary Biology 30:571–582.https://doi.org/10.1111/jeb.13027
-
Energy limitation as a selective pressure on the evolution of sensory systemsJournal of Experimental Biology 211:1792–1804.https://doi.org/10.1242/jeb.017574
-
Diurnal activity patterns of Drosophila subobscura and D. pseudoobscura in sympatric populationsThe American Midland Naturalist 140:34–41.https://doi.org/10.1674/0003-0031(1998)140[0034:DAPODS]2.0.CO;2
-
Reevaluation of phylogeny in the Drosophila obscura species group based on combined analysis of nucleotide sequencesMolecular Phylogenetics and Evolution 12:124–139.https://doi.org/10.1006/mpev.1998.0598
-
Linking genomics and ecology to investigate the complex evolution of an invasive Drosophila pestGenome Biology and Evolution 5:745–757.https://doi.org/10.1093/gbe/evt034
-
Biodiversity conservation under global climatic change: the insect Drosophila as a Biological Indicator?Global Ecology and Biogeography Letters 1:77–83.https://doi.org/10.2307/2997493
-
Gut microbiota affects development and olfactory behavior in Drosophila melanogasterThe Journal of Experimental Biology 222:jeb192500.https://doi.org/10.1242/jeb.192500
-
Light-dependent mating of Drosophila subobscura and species discriminationBehavior Genetics 12:241–260.https://doi.org/10.1007/BF01067846
-
Microhabitats reduce animal's exposure to climate extremesGlobal Change Biology 20:495–503.https://doi.org/10.1111/gcb.12439
-
BookMating Behavior Within the Genus Drosophila (Diptera)Bulletin of the American Museum of Natural History.
-
Optogenetic activation of the fruitless-labeled circuitry in Drosophila subobscura males induces mating motor actsThe Journal of Neuroscience 37:11662–11674.https://doi.org/10.1523/JNEUROSCI.1943-17.2017
-
Habitat selection within species of Drosophila: a review of experimental findingsEvolutionary Ecology 1:389–400.https://doi.org/10.1007/BF02071561
-
Character displacement and acoustic insectsAmerican Zoologist 14:1137–1150.https://doi.org/10.1093/icb/14.4.1137
Decision letter
-
Virginie Courtier-OrgogozoReviewing Editor; Université Paris-Diderot CNRS, France
-
Ronald L CalabreseSenior Editor; Emory University, United States
-
Virginie Courtier-OrgogozoReviewer; Université Paris-Diderot CNRS, France
In the interests of transparency, eLife publishes the most substantive revision requests and the accompanying author responses.
Acceptance summary:
This paper elegantly combines extensive morphological and behavioral analyses of five related Drosophila species of the obscura group and shows that each species displays a particular set of traits, which can be interpreted all together as differential investments between visual and olfactory sensory systems. Such variation in visual and olfactory investment may have provided relaxed competition and thus facilitated speciation.
Decision letter after peer review:
[Editors’ note: the authors submitted for reconsideration following the decision after peer review. What follows is the decision letter after the first round of review.]
Thank you for submitting your work entitled "Niche partitioning as a selective pressure for the evolution of the Drosophila nervous system" for consideration by eLife. Your article has been reviewed by three peer reviewers, including Virginie Courtier-Orgogozo as the Reviewing Editor and Reviewer #1, and the evaluation has been overseen by a Senior Editor.
Our decision has been reached after consultation between the reviewers. Based on these discussions and the individual reviews below, we regret to inform you that your work cannot be considered at present for publication in eLife. However, a completely revised version of this work that take into account the reviewer concerns might be submitted as a new manuscript.
The ideas and concepts presented in this manuscript are very interesting, very well written and perfectly suited to the broad readership of eLife. However, the manuscript in its current form is relatively data sparse, in the sense that the ideas are not sufficiently backed up by data.
After consultation, the reviewers have identified 5 major concerns that need to be solved to make the paper suitable for publication in eLife:
1) Only one strain was used for each species.
It is important to repeat the measurements for at least one more strain per species, not the ones of the neuropile, which might be too much work, but at least the external ones for eye and antennae size.
2) The treatment of body size should be revised.
3) Ommatidia diameter should be measured, and not just inferred from the measures of ommatidia number and eye area.
4) EF in Figure 5: it is not clear whether EF is significantly different between D. pseudoobscura and D. persimilis. This should be tested statistically.
5) The title makes a claim that is too strong.
We suggest something like: "Speciation by niche partitioning can be explained by differences in investment between olfactory and visual systems"
Reviewer #1:
This paper examines multiple morphological and behavioral traits in five related species of the obscura group. The authors find that each species display a particular set of traits, which can be interpreted all together as differential investments between visual olfactory sensory systems. These results, obtained in the laboratory using laboratory strains, provide important insights into possible mechanisms of speciation. Here the authors propose based on their data that these species have first diverged in terms of light preference (relative to olfactory investment), and that behavioral separation according to light has led to niche partitioning and courtship deviation.
The figures, text and annotated videos are very clear and nice.
Note that the reviewers have not yet had access the raw data.
Major comments:
1) Only one strain was examined for each species and the authors assume that what they measure in one strain is representative of the entire species. This is problematic because the phenotypic traits measured by the authors can vary between strains within the same species.
The authors should at least acknowledge this caveat in the results and Discussion section.
The authors should also provide a list of the exact strains they used, with information on how long ago they were collected, so that the reader can have information on how long these strains have been maintained in the lab before the experiments were performed.
2) It is not clear at many instances in the manuscript whether measurements are given for males or females or both.
The text mentions that "Eight to ten males and females of these two main species were…" but then in the following sentences it is not clear if the results are presented for males, females or both.
The authors should clarify this point for Figure 1A,B,C,D,E,F,G Figure 2A,B,C,D,E Figure 5A,B,C,D,E
3) "In these sympatric species we see larger behavioral variations (y-axis) than changes in morphology (x-axis)" and "we note that changes in phototaxis appear to be stronger and more acute than changes in courtship dynamics between sympatric species".
How can you compare traits which are measured in different units? This is unclear.
Reviewer #2:
Keesey et al. put forward an interesting hypothesis. That closely related Drosophila species that are sympatric might have diverged by partitioning their niche, with one species preferring light conditions similar to those found at the edge of the forest and at clearings, while the other species would prefer darker environments. They argue that these behavioural differences are driven by different investment in the visual vs the olfactory systems. The main novelty of the paper is to quantify the size of the eye and antennae, as well as their associated neuropils across four closely related Drosophila species, and correlate these differences with two behaviours: courtship and phototaxis. Based on this, they hypothesise that differential allocation of resources to vision and olfaction would underlie these differences in behaviour, and thus drive niche partitioning. However, their data is not sufficient to support this claim. Given the data presented, the title of the manuscript seems misleading: "Niche partitioning as a selective pressure for the evolution of the Drosophila nervous system" , suggests that they provide some experimental evidence to demonstrate that niche partitioning acts as a selective pressure for nervous system evolution. However, they do not demonstrate at any point that there is niche partitioning in the wild for these species, or that competition from sympatric species imposes a selective pressure on the evolution of the eyes and antennae. Therefore, a title that would be more apt for what the manuscript shows would be what they suggest as impact statement: "Phototaxis and courtship behaviour match differences in olfactory and visual system investment in five monophyletic Drosophila species and could explain their speciation events". In addition, there are a number of statements through the text that are overinterpretations of the presented results. I will mention some these in the below in addition to other concerns:
– In Figure 1, why are the authors not showing the measurements normalised by body size? Or head capsule size? Especially since in Figure 2 they normalise by adult size. Why do they use total size normalised measurements in some figures, but not in others?
– In Figure 5 D and E the correlation R values are shown without p values. There is also no statics shown for the data in Figure 5B.
– Their explanation for the data shown in Figure 5 was unconvincing. The fact that D. pseudoobscura and D. persimilis have very similar EF ratios (7.7 vs 7.8, is this difference even significant?) yet display different phototaxis and courtship behaviour, could reflect that their hypothesis is wrong, and that different resource allocation between vision and olfaction does not underlay behavioural differences, and might just be a by-product of the true (unknown) mechanistic changes underlying this behavioural evolution. Instead, they try to argue that this data shows that "small changes in morphological investment (EF ratio) can create dynamic differences in behaviour". However, there is no evidence to support this statement.
– In addition, their claim that the niche partition, and the differential allocation to vision and smell, occurs as a consequence of competition, is based on data from D. pseudoobscura and D. subobscura. However, these two species are not sympatric, the first one inhabits in North America, while the second one in Europe. At the same time, the two species that are sympatric, D. pseudoobscura and D. persimilis, have different behaviours, yet, very similar (identical?) allocation to vision and olfaction. How does this fit with their hypothesis?
– Without any fieldwork to show that there is indeed niche partitioning in the light and dark areas of the forest for the two main species studied, any claims of this nature need to be removed from the manuscript, specially the title and the Abstract.
Reviewer #3:
This paper explores external eye and antennal morphology as well as the associated internal nervous system morphology involved in the function of these important sensory organs between D. subobscura and D. pseudoobscura as well as several related species. They report that D. subobscura has larger eyes and smaller antennae than D. pseudoobscura. Comparisons of the behavior of these flies suggest that these changes in the relative size of sensory structures are correlated with differences in copulatory behavior and phototatic preferences. These correlations are also consistent with the morphology and behavior of related species.
Overall the manuscript provides a very interesting study of the potential behavioral outcomes of changes in the size of eyes and antennae, and that this may contribute to habitat preferences and even mating differences. However, I have a number of concerns about the manuscript that should be addressed.
Substantive concerns
In addition to ommatidia number, ommatidia size/diameter is a key parameter for the function of compound eyes. The paper states that "ommatidial diameter was identical" between the two focal species. However as far as I can tell this was never directly measured but instead was inferred from the correlation between ommatidia number and eye area. This is problematic for several reasons – ommatidia diameter can vary considerably across individual eyes and therefore even if there was a perfect correlation between number and area (which there is not) this could still belie local but important differences in ommatidia diameter for example in the anterior ommatidia. In addition, while Figure 2D shows a similar positive correlation between ommatidia number and area within D. subobscura or D. pseudoobscura, the species actually differ in that the former has smaller than expected eye area compared to ommatidia number and vice versa for the latter species. It is likely that this could be explained by D. pseudoobscura having larger ommatidia. This is important because it would potentially confer greater contrast sensitivity and explain why D. pseudoobscura may prefer darker conditions.
Although the manuscript states "Eight to ten males and females of these two main species…", no data is presented for males. Given there is interesting patterns of eye and antennal dimorphism between sexes for many Drosophla species, and this manuscript studies copulatory behavior and phototatic preferences, I think it is important to include data from males and as well as females, but no explanation is provided for why only female morphology was analysed.
The authors make much of the correlation between external and internal morphology and copulatory and phototatic behaviors of the two focal species and related species. However, I am concerned that only one strain of each species was examined and given the substantial intra-specific variation, and even plasticity in these traits, it might be misleading to say that these differences and correlations are indicative of these species (with the ensuing speculation about speciation etc) when it might only be representative of the strains used.
The paper does not cite other previous studies showing a trade-off between eyes and other aspects of the head capsule in D. pseudoobscura and in other Drosophila species and especially where the genetic underpinnings have been explored in some detail – in particular the recent paper in Dev Cell by Ramaekers et al., as well as work from the Norry and McGregor groups.
[Editors’ note: further revisions were suggested prior to acceptance, as described below.]
Thank you for submitting your article "Divergent sensory investment mirrors potential speciation via niche partitioning across Drosophila" for consideration by eLife. Your article has been reviewed by three peer reviewers, including Virginie Courtier-Orgogozo as the Reviewing Editor and Reviewer #1, and the evaluation has been overseen by Ronald Calabrese as the Senior Editor.
The reviewers have discussed the reviews with one another and the Reviewing Editor has drafted this decision to help you prepare a revised submission.
We would like to draw your attention to changes in our revision policy that we have made in response to COVID-19 (https://elifesciences.org/articles/57162). Specifically, we are asking editors to accept without delay manuscripts, like yours, that they judge can stand as eLife papers without additional data, even if they feel that they would make the manuscript stronger. Thus the revisions requested below only address clarity and presentation.
This manuscript reports very interesting data on trade-offs between olfactory and visual organs and behaviours in flies of the obscura group of Drosophila. The authors have extensively revised the manuscript in response to the reviewers' comments on the previous version of the manuscript. The new additional data (e.g. in Figures 5 and Figure 1—figure supplement 3) very much enhance the manuscript and add further support to the authors conclusions. While, reviewer 3 thinks that it would be interesting to study ommatidial size in different regions of the eyes of these flies and to assay males as well as females, reviewer 3 agrees with the authors that this can be done in the future and is not needed for this story because the conclusions are already very well supported by the data provided.
1) One caveat highlighted by the reviewers was that the phenotypic traits measured by the authors can vary between strains within the same species. As far as I understand, in the revised manuscript, the surface areas of the compound eye, antenna, maxillary palps, ocelli, and overall body size, as well as head, thorax, abdomen and femur length are still presented for only one strain per species.
However, the authors replied to the reviewers' comments that they included data from 3 populations/strains for each of our 5 total obscura species. And the revised Discussion reads: "the present study, which documents this sensory inversion across the obscura group, including across close, sympatric relatives, as well as across several populations or strains of each species (Figure 5A,B)."
Can they clarify this point?
If data is available, it would be good to increase the number of strains for Figure 1. If not, it is recommended to acknowledge in the text that it remains to be shown whether the observed differences are truly interspecific, as opposed to intraspecific, by analyzing several strains for each species.
2) Figure 5:
Where do the data in Figure 5B come from? From the x axis labels it seems that the authors choose a single strain for the comparison, but the data do not match the data shown in A. See for example the data distribution for Dpse1 or Dsub1 in panel A and B, they are completely different. Also it might be best to plot in B the aggregated measures of all three strains, unless, is this what they did? If that is the case they need to correct the axis labels, which at the moment indicate that only strain 1 for each species was used.
Assuming that the problem with Figure 5B are the labels and that indeed this represents the aggregated data for each of the three strains per species. This looks more convincing and is fine. However, it is worth noting that intraspecies variability seems larger than the interspecies variability for D.pseudoobscura and D. persimilis. This could give them an opportunity to test their hypothesis further. For example, unlike the population average, Dpse2 (EF ratio 8.16) is higher than Dper (EF ratio 7.91), if they examine the behaviour of these two strains, do they find that it correlates as well, ie. in this case Dper prefers darkness and does less frontal courtship than Dpse (unlike what happens with other strains)? This experiment could be done, or at least commented in the Discussion.
3) In addition to this, there seems to be a few extra mistakes in Figure 5 with the numbers. First, in the original publication the EF ratio of Dpse was 7.74 and that of Dper 7.89. However, in the new submission, for none of the measures for any of the strains there is a match on these values. This is surprising as one would have expected one of the strains for each species to match the numbers of Figure 5B from the prior submission, can the authors explain why this is not the case? Did they re-count the EF ratio for all of the strains including the one they had used previously and the different numbers reflect just variability? Can they confirm which one was the strain they had used previously?
4) In the current Figure 5B the ratio for Dper reads 8.20, but in Figure 5D for the same species reads 8.28. I imagine this is just a typo, can they correct this prior to publication?
5) Discussion:
The authors should properly describe existing references in the Discussion. For example, the paper from Atkinson and Miller 1980 shows that in field experiment capture bait experiments, D. subobscura did not have a preference for baits located in a light vs dark areas. Meaning that field experiments so far do not support their hypothesis, this should be noted in the Discussion.
6) Also in the Discussion, the statement should change from "changes in morphological investment can create dynamic differences in behaviour" to "changes in morphological investment correlate with dynamic differences in behaviour".
7) In the very extensive Discussion, they don't mention the alternative more plausible, hypothesis that behaviour might have switched first, through unknown neural basis, for some species to prefer shaded places (perhaps to avoid desiccation?) and thus become less visually guided. As the visual system is expensive to maintain this would produce a reduction in the visual system, the evolutionary pressure being energy preservation. Thus, reduction in visual investment being a consequence, not a driving force, of niche partitioning. This is indeed what happens with cave fish, where cave species have lost their eyes all together, but it is not thought that the fish went to the caves and speciated as a consequence of losing their eyes (as the authors seem to be suggesting in their discussion for flies), rather they specialised in the caves, and the no-longer useful eyes were lost. This seems a more parsimonious explanation for differential investment in vision and olfaction, than the proposed mechanism where reduced vision investment would drive niche partitioning. Not to mention that there is no evidence, nor circuit basis that could explain how larger eyes change phototaxis preference, which is probably computed in downstream circuits. Therefore, they should include in their Discussion the very possible hypothesis that flies reduced their visual investment as a consequence of niche partitioning, which occurred through yet unknown mechanisms.
[Editors' note: further revisions were suggested prior to acceptance, as described below.]
Thank you for resubmitting your article "Divergent sensory investment mirrors potential speciation via niche partitioning across Drosophila" for consideration by eLife. Your revised article has been reviewed by the Reviewing Editor and Ronald Calabrese as the Senior Editor.
The reviewers' comments have been adequately addressed. Figure 5 is now perfect. The Discussion has been greatly improved and is indeed extremely interesting.
There is just one comment that has not been fully addressed: the authors replied that they clarified the point that it remains to be shown whether the observed differences are truly interspecific but I could not read any statement regarding this fact in the Discussion. We suggest to add the following sentence (or similar) to the Discussion: "Please note that surface areas of the various head and thorax organs, as well as overall body size, were examined only for one strain per species. It thus remains to be confirmed that the observed differences are truly interspecific."
Regarding the raw data supporting the findings of this study:
– The raw data for Figure 3C, 4B is missing.
– The standard deviation for AL and OL of D. pseudoobscura was not calculated correctly based on the provided Excel file (see cells C45-F45 in Figure 2—source data 1).
– It is really nice that the authors have made the data supporting the findings of this study available through EDMOND, the Open Access Data Repository of the Max Planck Society. However, not all their data is available on this platform. It would be great if the authors could also include all the videos analysed for this paper.
https://doi.org/10.7554/eLife.57008.sa1Author response
[Editors’ note: the authors resubmitted a revised version of the paper for consideration. What follows is the authors’ response to the first round of review.]
The ideas and concepts presented in this manuscript are very interesting, very well written and perfectly suited to the broad readership of eLife. However, the manuscript in its current form is relatively data sparse, in the sense that the ideas are not sufficiently backed up by data.
After consultation, the reviewers have identified 5 major concerns that need to be solved to make the paper suitable for publication in eLife:
1) Only one strain was used for each species.
It is important to repeat the measurements for at least one more strain per species, not the ones of the neuropile, which might be too much work, but at least the external ones for eye and antennae size.
This is a very good point, and we have now included data from 3 populations/strains for each of our 5 total obscura species (thus for a total of 15 population assessments). This additional data is now available in the new version of Figure 5A,B. In addition, we confirm statistically that the differences in eye-to-funiculus ratio (EF Ratio) are consistent within a species, as well as consistently different between species.
2) The treatment of body size should be revised.
We have now demonstrated again that in the obscura group sensory traits also scale isometrically with respect to head size (see Figure 1—figure supplement 1B). Moreover, we have likewise shown this lack of allometry for both head and body sizes across 62 different species in a previous publication, including multiple regression analyses as well as analyses of the residuals (linked DOI below). This is a major justification for using EF Ratio to compare sensory systems between insect species that differ in absolute size. However, we have also made further careful referrals to body size considerations within the present manuscript, including for both the methods and Discussion sections.
(Please see Supplementary Figure 1B,C,E,F,H,I within the following publication)
Keesey I. W., Grabe V., Gruber L., Koerte S., Obiero G. F. et al. , (2019). Inverse resource allocation between vision and olfaction across the genus Drosophila. Nature Communications. 10: 1162 10.1038/s41467-019-09087-z
3) Ommatidia diameter should be measured, and not just inferred from the measures of ommatidia number and eye area.
Thank you for this suggestion! We have now added repeated measures of ommatidia diameter from each of the 5 species (e.g. 5 measures per individual replicate, per species, for 25 total diameter measurements per species). This is now available in Figure 1—figure supplement 3. Here we did not identify any difference in diameter between our insects. Again, we would also like to highlight that all raw images, confocal scans, measurements, and other raw data will be made freely available with the online version of this publication for any additional comparisons. Please also see additional comments about ommatidia diameter within response towards Review #3.
4) EF in Figure 5: it is not clear whether EF is significantly different between D. pseudoobscura and D. persimilis. This should be tested statistically.
We have now explicitly tested this difference between species in the new version of Figure 5B, where we confirm that the EF Ratio is significantly different between these two sympatric species.
5) The title makes a claim that is too strong.
We suggest something like: "Speciation by niche partitioning can be explained by differences in investment between olfactory and visual systems"
We thank the editors and reviewers for their suggestions, and hope the new title is more indicative of the scope and design of the research presented in this manuscript. The new title is listed as: “Divergent sensory investment mirrors potential speciation via niche partitioning across Drosophila”
Reviewer #1:
This paper examines multiple morphological and behavioral traits in five related species of the obscura group. The authors finds that each species display a particular set of traits, which can be interpreted all together as differential investments between visual olfactory sensory systems. These results, obtained in the laboratory using laboratory strains, provide important insights into possible mechanisms of speciation. Here the authors propose based on their data that these species have first diverged in terms of light preference (relative to olfactory investment), and that behavioral separation according to light has led to niche partitioning and courtship deviation.
The figures, text and annotated videos are very clear and nice.
Note that the reviewers have not yet had access the raw data.
Major comments:
1) Only one strain was examined for each species and the authors assume that what they measure in one strain is representative of the entire species. This is problematic because the phenotypic traits measured by the authors can vary between strains within the same species.
The authors should at least acknowledge this caveat in the results and Discussion section.
Thank you for this suggestion! We have now strived these last few months to include 3 populations/strains across each of the 5 obscura species that we examine in this manuscript (i.e. for a total of 15 populations examined). This data is now presented in Figure 5A,B. We believe that this additional population data further strengthens the publication, as we now more clearly demonstrate that eye-to-funiculus ratio (EF Ratio), while still variable between strains, is relatively stable within a species, but more divergent between each species. Moreover, we have added a mention of this population-related caveat to the Discussion section of the text.
The authors should also provide a list of the exact strains they used, with information on how long ago they were collected, so that the reader can have information on how long these strains have been maintained in the lab before the experiments were performed.
We apologize for this error. In the new version of the manuscript, we have now sought to include increased levels of detail about the exact strains and populations used for each species. This includes stock numbers that can in turn provide additional information about site of collection, as well as the date since laboratory establishment via the stock centers that have provided all this background. Please see the Materials and methods section.
2) It is not clear at many instances in the manuscript whether measurements are given for males or females or both.
The text mentions that "Eight to ten males and females of these two main species were…" but then in the following sentences it is not clear if the results are presented for males, females or both.
The authors should clarify this point for Figure 1A,B,C,D,E,F,G Figure 2A,B,C,D,E Figure 5A,B,C,D,E
Thank you for this comment and suggestion. We now clarify the sex represented in each data set and within associated figure legends.
3) "In these sympatric species we see larger behavioral variations (y-axis) than changes in morphology (x-axis)" and "we note that changes in phototaxis appear to be stronger and more acute than changes in courtship dynamics between sympatric species".
How can you compare traits which are measured in different units? This is unclear.
We have clarified this section in the text as well as Figure 5F. Here we are comparing the metrics for sympatric species to the overall obscura species regression, highlighting the much higher slope for sympatric species.
Reviewer #2:
Keesey et al. put forward an interesting hypothesis. That closely related Drosophila species that are sympatric might have diverged by partitioning their niche, with one species preferring light conditions similar to those found at the edge of the forest and at clearings, while the other species would prefer darker environments. They argue that these behavioural differences are driven by different investment in the visual vs the olfactory systems. The main novelty of the paper is to quantify the size of the eye and antennae, as well as their associated neuropils across four closely related Drosophila species, and correlate these differences with two behaviours: courtship and phototaxis. Based on this, they hypothesise that differential allocation of resources to vision and olfaction would underlie these differences in behaviour, and thus drive niche partitioning. However, their data is not sufficient to support this claim. Given the data presented, the title of the manuscript seems misleading: "Niche partitioning as a selective pressure for the evolution of the Drosophila nervous system" , suggests that they provide some experimental evidence to demonstrate that niche partitioning acts as a selective pressure for nervous system evolution. However, they do not demonstrate at any point that there is niche partitioning in the wild for these species, or that competition from sympatric species imposes a selective pressure on the evolution of the eyes and antennae. Therefore, a title that would be more apt for what the manuscript shows would be what they suggest as impact statement: "Phototaxis and courtship behaviour match differences in olfactory and visual system investment in five monophyletic Drosophila species and could explain their speciation events". In addition, there are a number of statements through the text that are overinterpretations of the presented results. I will mention some these in the below in addition to other concerns:
Thank you again for your time and insights with regard to this manuscript. We concur, that in the present document we do not explore field-sampling or other natural monitoring of these obscura species. Moreover, with your comments in mind, we have more explicitly added this caveat to the manuscript Discussion section. However, we contend that the theory we put forward and the evidence we provide is very compelling, and thus far, our theory is highly consistent with the data that we have collected in the laboratory using lab-reared flies from our five species. In the future, we hope to continue to test this hypothesis, for example in the field, but this was not within the feasibility nor the scope of the present manuscript revision. In accordance with your comments, and those from the editors, we have adjusted the title and we hope this new version is more agreeable. Thank you again for your time, insights and suggestions!
– In Figure 1, why are the authors not showing the measurements normalised by body size? Or head capsule size? Especially since in Figure 2 they normalise by adult size. Why do they use total size normalised measurements in some figures, but not in others?
We hope we have addressed this concern, as we have now added tests of allometry to Figure 1—figure supplement 1B. Herein we demonstrate that ommatidia number, for example, does not scale with respect to head size; moreover, in a previous publication we examine, through multiple regression and assessments of residuals across 62 Drosophila species, that neither body size nor head size are significantly linked to the observed variation in either visual or olfactory sensory investment. In Figure 2 we normalize using the hemisphere (grey) of each species. This is comparable to our normalization via eye-to-funiculus ratio (EF Ratio), which again, we feel best provides statistically comparable values between species of differing absolute size. However, some metrics, like sheer ommatidia counts, do not appear available from the literature, thus we also wanted to include raw values.
(Please see Supplementary Figure 1B,C,E,F,H,I within the following publication):
Keesey I. W., Grabe V., Gruber L., Koerte S., Obiero G. F. et al. , (2019). Inverse resource allocation between vision and olfaction across the genus Drosophila. Nature Communications. 10: 1162 10.1038/s41467-019-09087-z
– In Figure 5 D and E the correlation R values are shown without p values. There is also no statics shown for the data in Figure 5B.
Corrected, thank you for catching this error! We have now shown the R2 and p-values for each linear correlation, as well as added mention of statistical assessments to the figure legends. Apologies again for this oversight!
– Their explanation for the data shown in Figure 5 was unconvincing. The fact that D. pseudoobscura and D. persimilis have very similar EF ratios (7.7 vs 7.8, is this difference even significant?) yet display different phototaxis and courtship behaviour, could reflect that their hypothesis is wrong, and that different resource allocation between vision and olfaction does not underlay behavioural differences, and might just be a by-product of the true (unknown) mechanistic changes underlying this behavioural evolution. Instead, they try to argue that this data shows that "small changes in morphological investment (EF ratio) can create dynamic differences in behaviour". However, there is no evidence to support this statement.
During the revision of this manuscript, we have now added 2 additional populations from each of the five species (thus 3 examined populations per species, for a total analysis of 15 populations). We feel that this additional, robust data more strongly supports our hypotheses, as well as strengthens the statistical tests between species. Here we contend that EF Ratio is relatively consistent between populations within a species, as well as consistently divergent between our species. Please see the new Figure 5A,B. Moreover, the new population-based EF Ratio for each species now correlates even more strongly with both phototaxis and frontal courtship behaviors (see Figure 5F,G). Again, we thank the reviewers for suggesting the additional population-based analyses of each species, as we feel these additional sets of replicates and statistical analyses have continued to reinforce our theories. While we concur that we cannot eliminate all other alternative hypotheses, nor that we can we pin down causation, we again contest that our hypothesis of a sensory tradeoff is currently the most consistent, viable explanation for the observed behavioral variations in phototaxis and courtship. Here again, we show repeated, strong, statistically correlated evidence within the laboratory, and hope in the future to examine these hypotheses again in the wild, with naturally co-occuring species of flies.
– In addition, their claim that the niche partition, and the differential allocation to vision and smell, occurs as a consequence of competition, is based on data from D. pseudoobscura and D. subobscura. However, these two species are not sympatric, the first one inhabits in North America, while the second one in Europe. At the same time, the two species that are sympatric, D. pseudoobscura and D. persimilis, have different behaviours, yet, very similar (identical?) allocation to vision and olfaction. How does this fit with their hypothesis?
Thank you again for comments and suggestions. We have provided additional clarification in the written text that we did not consider D.pseudoobscura and D.subobscura to be evolutionarily sympatric (though they are now published as co-occurring in the Western USA, and would make for a great field study as a follow-up!). Moreover, we have provided much stronger data (and population replicates) to support the notion that D.pseudoobscura and D.persimilis differ in EF Ratio morphology as well as behavior (where these two species are in fact, well recognized as sympatric). While again we concede that is it not possible to pin down causation, we do find the correlation between EF Ratio and phototaxis (as well as the correlation between EF Ratio and frontal courtship) to be even more strongly supported statistically given the increased replicates of measurements per insect species across populations (please see revised Figure 5). Again, we thank the reviewers for their insightful suggestions of adding populations for each obscura species, and we hope the new data and text clarifications more convincingly demonstrate our interpretations of the data as compared to the previous manuscript draft.
– Without any fieldwork to show that there is indeed niche partitioning in the light and dark areas of the forest for the two main species studied, any claims of this nature need to be removed from the manuscript, specially the title and the Abstract.
We have attempted to tone down our conclusions about “ecological” niche partitioning (i.e. to concluding that niche partitioning would be consistent with the observed behavioral patterns from the laboratory, and we have added discussion of what further data would be needed to test more conclusively this hypothesis in the field in a future study). While we do not consider this manuscript to be the alpha and omega on this particular research topic, we do feel that the present manuscript provides a strong foundation concerning a viable ecological explanation for inverse variation in the visual and olfactory systems across these closely related insect species, and that this tradeoff has distinct behavioral ramifications. We hope this manuscript could serve as a foothold and building block to continue to examine these hypotheses, perhaps including fieldwork. Further discussion is now added in the text to propose these additional studies, highlighting the importance of field-based validation of our hypotheses towards niche partitioning and species competition within the lighting architecture of a temperate forest environment. Thank you again for your comments, insights and suggestions, where we hope our newly written version and copious new data are more convincing of these hypotheses.
Reviewer #3:
This paper explores external eye and antennal morphology as well as the associated internal nervous system morphology involved in the function of these important sensory organs between D. subobscura and D. pseudoobscura as well as several related species. They report that D. subobscura has larger eyes and smaller antennae than D. pseudoobscura. Comparisons of the behavior of these flies suggest that these changes in the relative size of sensory structures are correlated with differences in copulatory behavior and phototatic preferences. These correlations are also consistent with the morphology and behavior of related species.
Overall the manuscript provides a very interesting study of the potential behavioral outcomes of changes in the size of eyes and antennae, and that this may contribute to habitat preferences and even mating differences. However, I have a number of concerns about the manuscript that should be addressed.
Substantive concerns
In addition to ommatidia number, ommatidia size/diameter is a key parameter for the funntion of compound eyes. The paper states that "ommatidial diameter was identical" between the two focal species. However as far as I can tell this was never directly measured but instead was inferred from the correlation between ommatidia number and eye area. This is problematic for several reasons – ommatidia diameter can vary considerably across individual eyes and therefore even if there was a perfect correlation between number and area (which there is not) this could still belie local but important differences in ommatidia diameter for example in the anterior ommatidia. In addition, while Figure 2D shows a similar positive correlation between ommatidia number and area within D. subobscura or D. pseudoobscura, the species actually differ in that the former has smaller than expected eye area compared to ommatidia number and vice versa for the latter species. It is likely that this could be explained by D. pseudoobscura having larger ommatidia. This is important because it would potentially confer greater contrast sensitivity and explain why D. pseudoobscura may prefer darker conditions.
Thank you for your insights regarding ommatidia. While we measured ommatidia diameter in a previous publication (and show it does not generally vary, despite substantial changes in ommatidia number), we did error in our extrapolation towards all our current obscura species. We have now added a new supplementary figure to address direct measurements of ommatidia diameter for each species presented in the current manuscript (please see Figure 1—figure supplement 3). However, here we again do not identify any significant variance in diameter between our tested species, suggesting that surface area and ommatidia number are the more accurate metrics for estimating divergence in visual investment via external morphology. Moreover, I would emphasize again that we are providing all raw data, scans, confocal images and replicates within the accepted version of the present manuscript. We would thus encourage the reviewer and others to examine additional ideas or avenues that we may have overlooked, for example, any additional descriptive measures of ommatidium curvature, apex or length.
We would also add that, to our knowledge, there are no nocturnal Drosophila species. Thus while some insect orders and families are more variable in their ommatidia measures, these differences could also be related to circadian periodicity of the animal’s activity patterns. However, all examined Drosophila show the same pattern of activity. That all being said, we continue to be highly interested in understanding more about the visual capabilities of this genus of fly, and we would welcome any additional comments or ideas about how to better test, quantify and describe variation in eye size between our species of interest. In the future, we also hope genetic tools become more readily available across the obscura clade in order to generate additional markers to follow.
Although the manuscript states "Eight to ten males and females of these two main species…", no data is presented for males. Given there is interesting patterns of eye and antennal dimorphism between sexes for many Drosophla species, and this manuscript studies copulatory behavior and phototatic preferences, I think it is important to include data from males and as well as females, but no explanation is provided for why only female morphology was analysed.
We sought to examine, in detail, many aspects of external and internal investment in visual and olfactory machinery across 5 species and ultimately 3 populations per species (for a new total of 15 insect strains). As such, we regrettably were not able to also assess all differences related to sex. In the present manuscript, we now clarify in the text that we chose to focus on sensory investment for females, which act as the receivers of male courtship displays, and also represent the oviposition decision-makers. However, we would encourage future research to also examine variance related to sex, and we would be excited to see those results in comparison to the current literature!
The authors make much of the correlation between external and internal morphology and copulatory and phototatic behaviors of the two focal species and related species. However, I am concerned that only one strain of each species was examined and given the substantial intra-specific variation, and even plasticity in these traits, it might be misleading to say that these differences and correlations are indicative of these species (with the ensuing speculation about speciation etc) when it might only be representative of the strains used.
Thank you again for your insights. We now examine populations (in triplicates) from each species, as well as include the stock numbers and associated information from each strain. Here we emphasize that the new data more strongly defines the intra- and interspecies differences across these sensory investments, where again, we observe more consistent values within a species than between our species. Please see the new Figure 5 for all new data related to population-based analyses of EF Ratio.
The paper does not cite other previous studies showing a trade-off between eyes and other aspects of the head capsule in D. pseudoobscura and in other Drosophila species and especially where the genetic underpinnings have been explored in some detail – in particular the recent paper in Dev Cell by Ramaekers et al., as well as work from the Norry and McGregor groups.
Apologies for this oversight. We have now included several of the suggested citations, as well as the newest publication showing that this inverse variation (or trade-off) between vision and olfaction occurs simultaneously:
Özer I, Carle T (2020) Back to the light, coevolution between vision and olfaction in the “Dark-flies” (Drosophilamelanogaster). PLoS ONE 15(2): e0228939. https://doi.org/10.1371/journal.pone.0228939
Ramaekers, A., A. Claeys, M. Kapun, E. Mouchel-Vielh, D. Potier et al., (2019) Altering the Temporal Regulation of One Transcription Factor Drives Evolutionary Trade-Offs between Head Sensory Organs. Dev Cell 50: 780–792 e787. https://doi.org/10.1016/j.devcel.2019.07.027https:// doi.org/10.1016/j.devcel.2019.07.027
Gaspar, P. et al. (2020) Characterization of the Genetic Architecture Underlying Eye Size Variation Within Drosophilamelanogaster and Drosophila simulans. G3 (Bethesda, Md.); 10.1534/g3.119.400877
[Editors’ note: what follows is the authors’ response to the second round of review.]
This manuscript reports very interesting data on trade-offs between olfactory and visual organs and behaviours in flies of the obscura group of Drosophila. The authors have extensively revised the manuscript in response to the reviewers' comments on the previous version of the manuscript. The new additional data (e.g. in Figures 5 and Figure 1—figure supplement 3) very much enhance the manuscript and add further support to the authors conclusions. While, reviewer 3 thinks that it would be interesting to study ommatidial size in different regions of the eyes of these flies and to assay males as well as females, reviewer 3 agrees with the authors that this can be done in the future and is not needed for this story because the conclusions are already very well supported by the data provided.
1) One caveat highlighted by the reviewers was that the phenotypic traits measured by the authors can vary between strains within the same species. As far as I understand, in the revised manuscript, the surface areas of the compound eye, antenna, maxillary palps, ocelli, and overall body size, as well as head, thorax, abdomen and femur length are still presented for only one strain per species.
However, the authors replied to the reviewers' comments that they included data from 3 populations/strains for each of our 5 total obscura species. And the revised Discussion reads: "the present study, which documents this sensory inversion across the obscura group, including across close, sympatric relatives, as well as across several populations or strains of each species (Figure 5A,B)."
Can they clarify this point?
If data is available, it would be good to increase the number of strains for Figure 1. If not, it is recommended to acknowledge in the text that it remains to be shown whether the observed differences are truly interspecific, as opposed to intraspecific, by analyzing several strains for each species.
We have added complete EF ratio data for all populations to the manuscript in Figure 5A; however, we were not able to generate the complete data comparisons as in Figure 1 for all populations. Moreover, clarification has been added to the Discussion. In addition, we have now been able to provide all data supporting the findings of this study, including methodology examples, raw images and z-stack scans, ommatidia measurements, statistical assessments as well as species and population datasets, which are available through EDMOND, the Open Access Data Repository of the Max Planck Society. We have now completed the necessary steps to make this data open access to the public, and the web link or DOI should be fully functional and accessible when the manuscript is published online.
EDMOND, link for all raw data:
https://dx.doi.org/10.17617/3.3v
2) Figure 5:
Where do the data in Figure 5B come from? From the x axis labels it seems that the authors choose a single strain for the comparison, but the data do not match the data shown in A. See for example the data distribution for Dpse1 or Dsub1 in panel A and B, they are completely different. Also it might be best to plot in B the aggregated measures of all three strains, unless, is this what they did? If that is the case they need to correct the axis labels, which at the moment indicate that only strain 1 for each species was used.
Assuming that the problem with Figure 5B are the labels and that indeed this represents the aggregated data for each of the three strains per species. This looks more convincing and is fine. However, it is worth noting that intraspecies variability seems larger than the interspecies variability for D.pseudoobscura and D. persimilis. This could give them an opportunity to test their hypothesis further. For example, unlike the population average, Dpse2 (EF ratio 8.16) is higher than Dper (EF ratio 7.91), if they examine the behaviour of these two strains, do they find that it correlates as well, ie. in this case Dper prefers darkness and does less frontal courtship than Dpse (unlike what happens with other strains)? This experiment could be done, or at least commented in the Discussion.
Thank you. Yes. The labels were incorrect in Figure 5B, which, as you already correctly identified, shows the aggregate/average of ALL data across populations within the complete dataset from each species. We have adjusted the figure labels in the Figure 5B accordingly, and thank you again for catching this error! Given the pandemic and laboratory constraints, we are unable to run the additional experiments suggested, but we hope something similar could be constructed in the future to continue to examine these species (and populations) in more detail. We are very grateful for this proposed experiment, and look forward to testing these ideas perhaps in a future manuscript or study! We also add note of this idea to the manuscript.
3) In addition to this, there seems to be a few extra mistakes in Figure 5 with the numbers. First, in the original publication the EF ratio of Dpse was 7.74 and that of Dper 7.89. However, in the new submission, for none of the measures for any of the strains there is a match on these values. This is surprising as one would have expected one of the strains for each species to match the numbers of Figure 5B from the prior submission, can the authors explain why this is not the case? Did they re-count the EF ratio for all of the strains including the one they had used previously and the different numbers reflect just variability? Can they confirm which one was the strain they had used previously?
Apologies. We have added more replicates to several of the species, including those from the original populations. Thus, the average values may have shifted slightly from the previous manuscript version. For each section within the Materials and methods, we document, often as the last sentence, which species and populations we used within each behavioral or morphological analysis. In addition, we have now reduced all numerical averages to only two decimal places, thus we further hope this avoids any confusion related to averaging of the EF values in Figure 5. In general, we hope these comments and adjustments sufficiently answer these questions from the reviewers on this topic, and again, we point out that we are now in the process of making all raw data publically available for meta-analyses or additional hypotheses testing in the future using the included images and raw measurements. Copyright and legal permissions have now been given approval by the MPG, and these data will all be publically shared with the included DOI.
4) In the current Figure 5B the ratio for Dper reads 8.20, but in Figure 5D for the same species reads 8.28. I imagine this is just a typo, can they correct this prior to publication?
I believe this was a visual error based on the low resolution of the supplied figure (which actually reads “8.29”). However, in order to correct further any issues pertaining to decimal-related rounding of these average values, we have sought to include only two decimal places for each metric across all figures. We thank the reviewer for asking for clarity regarding this perceived discrepancy, and hope this is now resolved. The final figures should also be of high enough resolution that all text (and values) will be more legible as well.
5) Discussion:
The authors should properly describe existing references in the Discussion. For example, the paper from Atkinson and Miller 1980 shows that in field experiment capture bait experiments, D. subobscura did not have a preference for baits located in a light vs dark areas. Meaning that field experiments so far do not support their hypothesis, this should be noted in the Discussion.
Agreed, and we have expanded this line/paragraph and section of the Discussion to better expand upon this already cited reference, namely pointing out that previous field trials in the 1980s have also attempted a similar analysis with field-collecting organisms, though we highlight that these field experiments should be repeated.
“Here, field studies in the 1980s using baited traps did not find a distinct difference in capture across light versus dark areas for D. subobscura (Atkinson and Miller, 1980). However, as mentioned before, additional fieldwork is still needed to continue to test our hypotheses outside of the laboratory, and within naturally occurring populations, especially in relation to abiotic measures of light gradients and GPS studies of canopy cover.”
6) Also in the Discussion, the statement should change from "changes in morphological investment can create dynamic differences in behaviour" to "changes in morphological investment correlate with dynamic differences in behaviour".
Thank you. We have changed “can create” into “correlate with”.
7) In the very extensive Discussion, they don't mention the alternative more plausible, hypothesis that behaviour might have switched first, through unknown neural basis, for some species to prefer shaded places (perhaps to avoid desiccation?) and thus become less visually guided. As the visual system is expensive to maintain this would produce a reduction in the visual system, the evolutionary pressure being energy preservation. Thus, reduction in visual investment being a consequence, not a driving force, of niche partitioning. This is indeed what happens with cave fish, where cave species have lost their eyes all together, but it is not thought that the fish went to the caves and speciated as a consequence of losing their eyes (as the authors seem to be suggesting in their discussion for flies), rather they specialised in the caves, and the no-longer useful eyes were lost. This seems a more parsimonious explanation for differential investment in vision and olfaction, than the proposed mechanism where reduced vision investment would drive niche partitioning. Not to mention that there is no evidence, nor circuit basis that could explain how larger eyes change phototaxis preference, which is probably computed in downstream circuits. Therefore, they should include in their Discussion the very possible hypothesis that flies reduced their visual investment as a consequence of niche partitioning, which occurred through yet unknown mechanisms.
We do not think these two hypotheses are necessarily contradictory, and instead, that they are perhaps more complementary. Niche partitioning can be driven from both ways at the same time, as an initial, albeit slight, preference for darkness or light, for example due to a spontaneous developmental mutation, can lead to a change in habitat preference and could then eventually solidify the new fly phenotype. However, this, basically, goes into one direction that remains puzzling across the animal kingdom. For example, nocturnal animals usually have two separate directions for visual investment, larger eyes or smaller eyes. This selection of the preferred sensory modality seems a bit weird across nocturnal animals, like owls (large eyes) vs. bats (small eyes). This evolutionary “decision” for sensory systems seems to rely on the respective starting point for the species or organism, if there already has been more visual or auditory investment, which is then perhaps more prioritized over time. These cavefish you mention of course have lost their eyes, as they are in absolute darkness, and therefore represent a very extreme example, although many deep-sea fish, in contrast, have actually increased their eye size investment (e.g. despite the complete darkness), as they perhaps have to observe all sorts of bioluminescence. Overall, this is a difficult concept to explain fully, especially without more data from additional animal species. Here again though, we highlight that to our knowledge, zero Drosophila species are nocturnal, which may prove an important developmental limitation to ponder as we continue to address the visual investment of these insects.
In the end, we concur with the original point from the reviewer, and have now sought to expand greatly a section or paragraph of the Discussion to include this alternative hypothesis within the lines pertaining to the potential order of evolutionary events. Moreover, we agree that this alternative interpretation cannot be ruled out, and we thank the reviewers for suggesting this expansion of the Discussion, which we hope will continue to create ongoing dialogue about the mechanisms for this observed shift in sensory systems between our examined species, and perhaps across vertebrate examples as well (i.e. cartilaginous fish).
“An alternative hypothesis would be that the phototaxis behaviors may have switched before morphology for some species, through an as of yet unknown mechanism, in order to push these species towards more shaded environments (i.e. perhaps to avoid desiccation pressures). […] As such, we continue to predict that niche partitioning, character displacement, and response to light gradients are the stronger initial driving forces of the evolution and speciation within the obscura group, where the novel environmental conditions drive sensory investment that in turn optimizes the courtship success of each species in this new niche.”
[Editors' note: further revisions were suggested prior to acceptance, as described below.]
There is just one comment that has not been fully addressed: the authors replied that they clarified the point that it remains to be shown whether the observed differences are truly interspecific but I could not read any statement regarding this fact in the Discussion. We suggest to add the following sentence (or similar) to the Discussion: "Please note that surface areas of the various head and thorax organs, as well as overall body size, were examined only for one strain per species. It thus remains to be confirmed that the observed differences are truly interspecific."
The sentence has been added to the Discussion and we have uploaded the new manuscript document.
Regarding the raw data supporting the findings of this study:
– The raw data for Figure 3C, 4B is missing.
We have added the corresponding excel files for these figures as Supplementary files.
– The standard deviation for AL and OL of D. pseudoobscura was not calculated correctly based on the provided Excel file (see cells C45-F45 in Figure 2—source data 1).
We have corrected the error and replaced the corresponding excel file with the corrected one.
– It is really nice that the authors have made the data supporting the findings of this study available through EDMOND, the Open Access Data Repository of the Max Planck Society. However, not all their data is available on this platform. It would be great if the authors could also include all the videos analysed for this paper.
We are very sorry that we cannot upload all videos. Please see above.
https://doi.org/10.7554/eLife.57008.sa2Article and author information
Author details
Funding
Max-Planck-Gesellschaft (Open-access funding)
- Ian W Keesey
- Veit Grabe
- Markus Knaden
- Bill S Hansson
The funding organization had no role in the study design, data collection, interpretation, nor the decision to submit the work for publication. The authors declare no competing interests.
Acknowledgements
This research was maintained through funding provided by the German government and the Max Planck Society (Max Planck Gesellschaft). Wild-type flies were obtained from the San Diego Drosophila Species Stock Center (now The National Drosophila Species Stock Center, Cornell University) as well as obtained from Ehime University at Matsuyama (EHIME-Fly, Japan), which is the branch laboratory for Drosophila resources under the National BioResource Project (now moved to Kyorin University, Japan; KYORIN-Fly). We express our gratitude to S Trautheim and D Veit for their technical support, expertise and guidance at MPI-CE. We also thank R Stieber for her expertise and guidance in regards to immuno staining for these two novel fly species. A special thank you as well to J Balma for her expert assistance and proficiency in compiling the curated courtship video examples. Lastly, we thank Ben Longdon, Nicolas Gompel, Benjamin Prud’homme and their laboratories for their gracious donation of several obscura species stocks for additional measurements.
Senior Editor
- Ronald L Calabrese, Emory University, United States
Reviewing Editor
- Virginie Courtier-Orgogozo, Université Paris-Diderot CNRS, France
Reviewer
- Virginie Courtier-Orgogozo, Université Paris-Diderot CNRS, France
Version history
- Received: March 17, 2020
- Accepted: June 30, 2020
- Accepted Manuscript published: June 30, 2020 (version 1)
- Version of Record published: August 4, 2020 (version 2)
Copyright
© 2020, Keesey et al.
This article is distributed under the terms of the Creative Commons Attribution License, which permits unrestricted use and redistribution provided that the original author and source are credited.
Metrics
-
- 2,641
- Page views
-
- 446
- Downloads
-
- 9
- Citations
Article citation count generated by polling the highest count across the following sources: Crossref, PubMed Central, Scopus.
Download links
Downloads (link to download the article as PDF)
Open citations (links to open the citations from this article in various online reference manager services)
Cite this article (links to download the citations from this article in formats compatible with various reference manager tools)
Further reading
-
- Biochemistry and Chemical Biology
- Evolutionary Biology
Evolution can tinker with multi-protein machines and replace them with simpler single-protein systems performing equivalent functions in an equally efficient manner. It is unclear how, on a molecular level, such simplification can arise. With ancestral reconstruction and biochemical analysis, we have traced the evolution of bacterial small heat shock proteins (sHsp), which help to refold proteins from aggregates using either two proteins with different functions (IbpA and IbpB) or a secondarily single sHsp that performs both functions in an equally efficient way. Secondarily single sHsp evolved from IbpA, an ancestor specialized in strong substrate binding. Evolution of an intermolecular binding site drove the alteration of substrate binding properties, as well as the formation of higher-order oligomers. Upon two mutations in the α-crystallin domain, secondarily single sHsp interacts with aggregated substrates less tightly. Paradoxically, less efficient binding positively influences the ability of sHsp to stimulate substrate refolding, since the dissociation of sHps from aggregates is required to initiate Hsp70-Hsp100-dependent substrate refolding. After the loss of a partner, IbpA took over its role in facilitating the sHsp dissociation from an aggregate by weakening the interaction with the substrate, which became beneficial for the refolding process. We show that the same two amino acids introduced in modern-day systems define whether the IbpA acts as a single sHsp or obligatorily cooperates with an IbpB partner. Our discoveries illuminate how one sequence has evolved to encode functions previously performed by two distinct proteins.
-
- Evolutionary Biology
- Genetics and Genomics
Microbial plankton play a central role in marine biogeochemical cycles, but the timing in which abundant lineages diversified into ocean environments remains unclear. Here, we reconstructed the timeline in which major clades of bacteria and archaea colonized the ocean using a high-resolution benchmarked phylogenetic tree that allows for simultaneous and direct comparison of the ages of multiple divergent lineages. Our findings show that the diversification of the most prevalent marine clades spans throughout a period of 2.2 Ga, with most clades colonizing the ocean during the last 800 million years. The oldest clades – SAR202, SAR324, Ca. Marinimicrobia, and Marine Group II – diversified around the time of the Great Oxidation Event, during which oxygen concentration increased but remained at microaerophilic levels throughout the Mid-Proterozoic, consistent with the prevalence of some clades within these groups in oxygen minimum zones today. We found the diversification of the prevalent heterotrophic marine clades SAR11, SAR116, SAR92, SAR86, and Roseobacter as well as the Marine Group I to occur near to the Neoproterozoic Oxygenation Event (0.8–0.4 Ga). The diversification of these clades is concomitant with an overall increase of oxygen and nutrients in the ocean at this time, as well as the diversification of eukaryotic algae, consistent with the previous hypothesis that the diversification of heterotrophic bacteria is linked to the emergence of large eukaryotic phytoplankton. The youngest clades correspond to the widespread phototrophic clades Prochlorococcus, Synechococcus, and Crocosphaera, whose diversification happened after the Phanerozoic Oxidation Event (0.45–0.4 Ga), in which oxygen concentrations had already reached their modern levels in the atmosphere and the ocean. Our work clarifies the timing at which abundant lineages of bacteria and archaea colonized the ocean, thereby providing key insights into the evolutionary history of lineages that comprise the majority of prokaryotic biomass in the modern ocean.