shinyDepMap, a tool to identify targetable cancer genes and their functional connections from Cancer Dependency Map data
- Laboratory of Systems Pharmacology and Department of Systems Biology, Harvard Medical School, United States
Figures
Figure 1
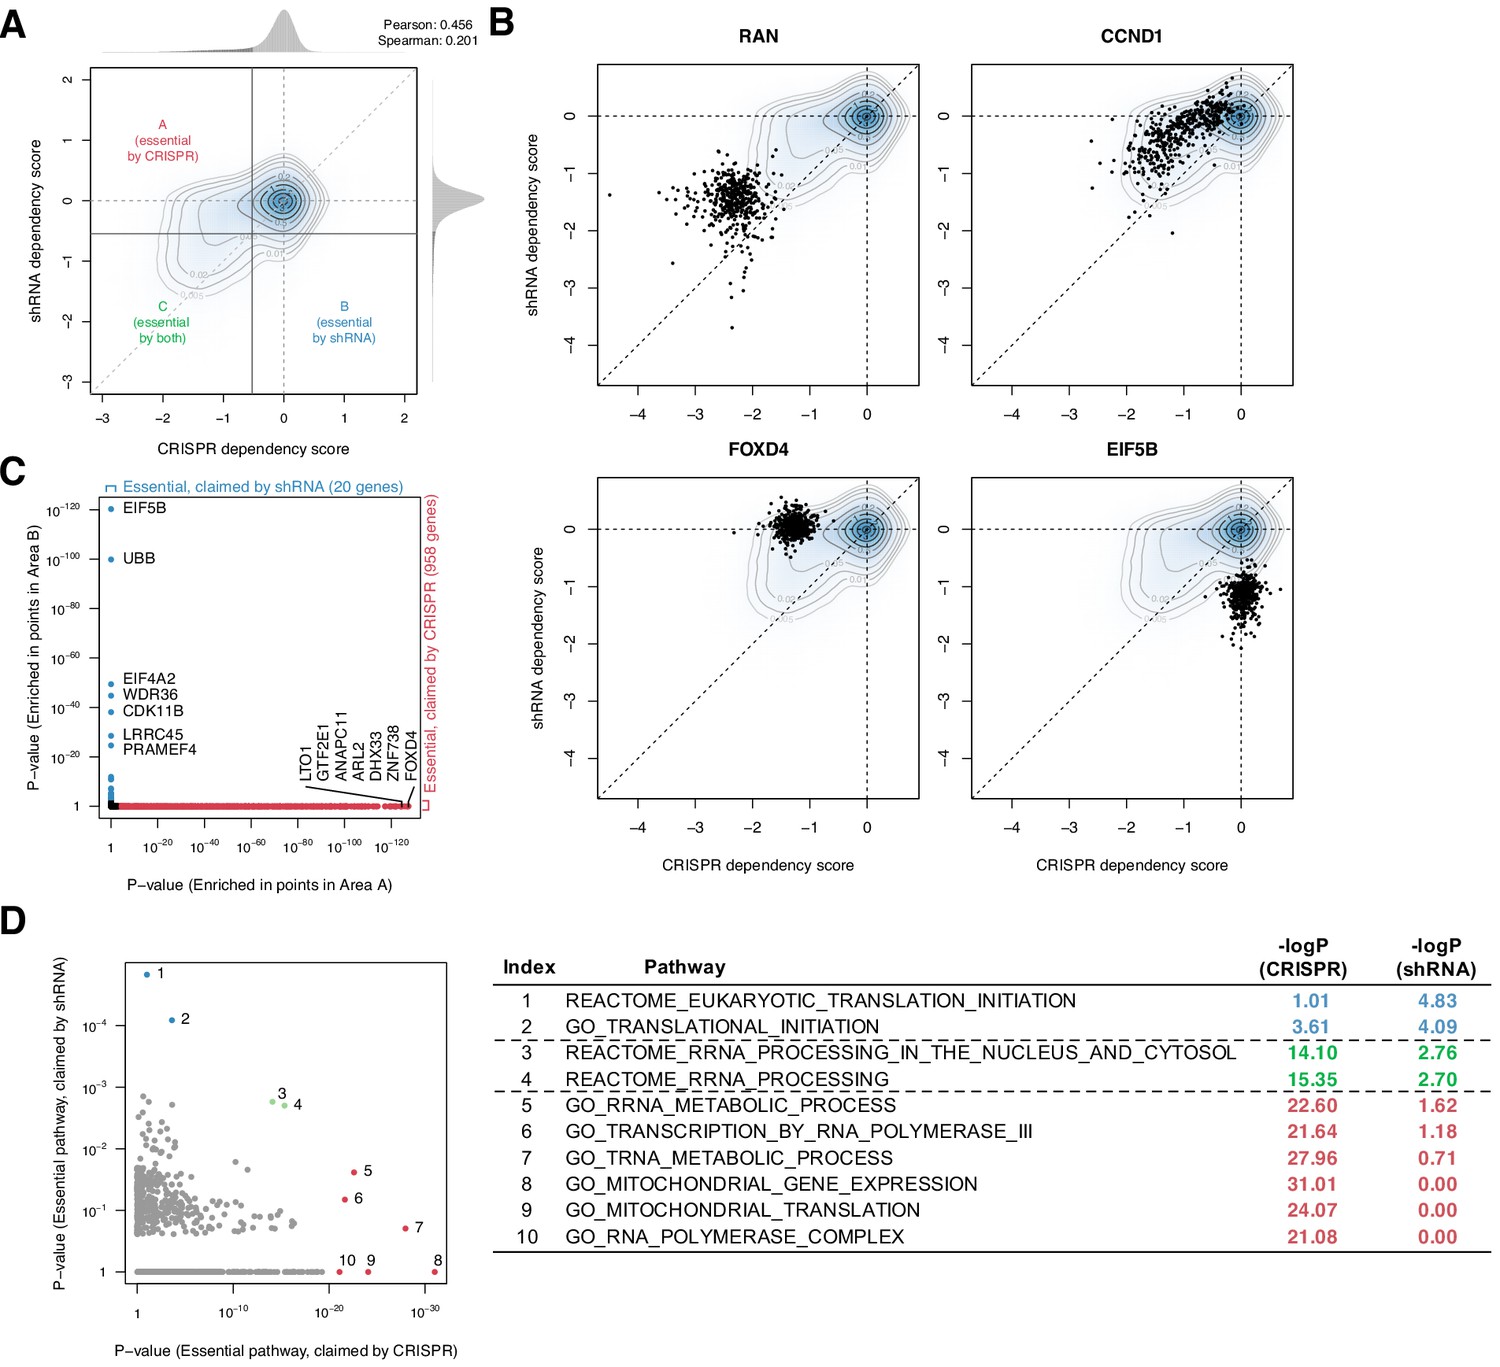
Systematic biases in CRISPR and shRNA dependency scores.
(A) Comparison of normalized CRISPR and shRNA dependency scores of 15,847 protein-encoding genes in 423 cell lines. The density and contour plot corresponds to the distribution of the scores from all gene perturbations. Vertical and horizontal solid lines indicate the essentiality thresholds for CRISPR and shRNA dependency scores, respectively. Areas A, B, and C correspond to the regions where only CRISPR, only shRNA, or both CRISPR and shRNA claimed essential. (B) Comparison of CRISPR and shRNA targeting four genes. In each panel, data points correspond to each gene’s perturbation in 423 cell lines. Each point corresponds to one cell line. (C) In total, 958 and 20 genes were claimed essential only by CRISPR or shRNA but not by the other method, respectively (Fisher’s exact test, p-value<1e-3). (D) Assessment of the pathways overrepresented by the essential genes claimed only by CRISPR or shRNA, highlighted in C (Fisher’s exact test).
-
Figure 1—source data 1
Information of the 423 cell lines in which both CRIPSR and shRNA screening were tested.
- https://cdn.elifesciences.org/articles/57116/elife-57116-fig1-data1-v3.xlsx
Figure 2
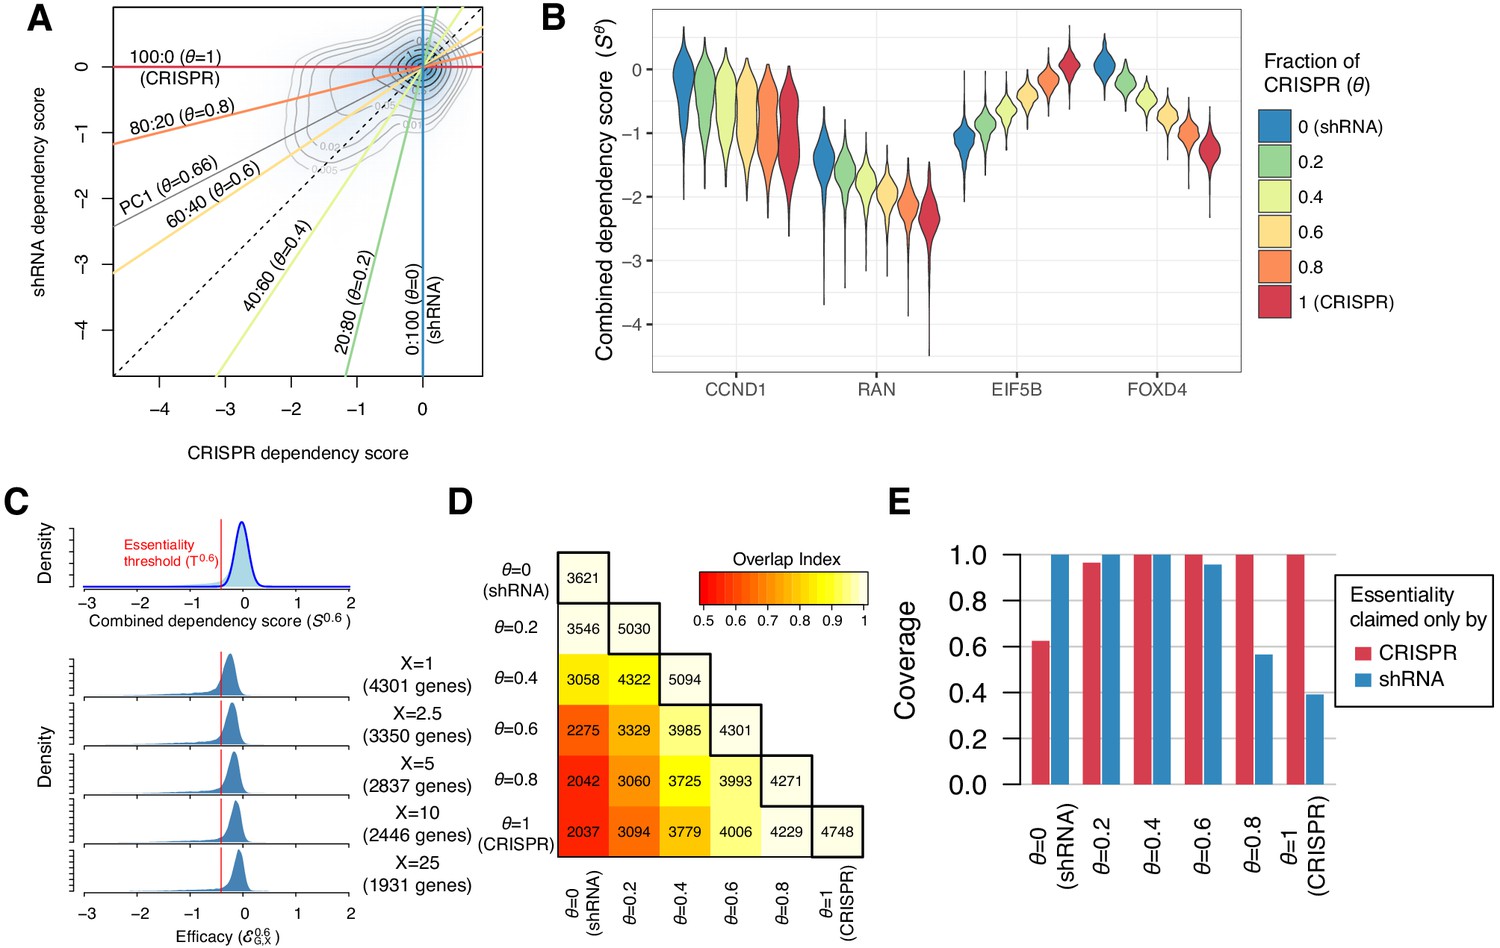
Identification of essential genes based on combined dependency score.
(A) Dependency scores defined with different mixing ratios are computed by projecting each point onto the corresponding lines. θ denotes the fraction of CRISPR dependency scores. PC1 is the direction of the primary principal component line. (B) The distributions of combined dependency scores for four genes shown in Figure 1B. (C) Top panel: the distribution of the combined dependency score . The essentiality threshold is determined based on this distribution. Bottom panel: the distribution of efficacy scores with various X (-th percentile). Genes that satisfy are defined as commonly or selectively essential, and the number of essential genes depends on X. (D) On the diagonal line, the numbers of commonly or selectively essential genes identified with various θ are shown. In the off-diagonal area, the numbers of essential genes identified with two distinct θ are shown. Color code indicates an overlap index, a measure of overlap between two essential gene sets. The overlap index ranges from 0 (no shared genes) to 1 (the smaller set is included in the larger set). (E) The extent to which the genes claimed essential by only CRISPR or shRNA are covered by the essential genes discovered by each mixing ratio.
-
Figure 2—source data 1
The combined dependency scores for 15,847 protein-coding genes in 423 cell lines for six .
= 0 and 1 corresponds to shRNA and CRISPR scores compared in Figure 1.
- https://cdn.elifesciences.org/articles/57116/elife-57116-fig2-data1-v3.xlsx
Figure 3

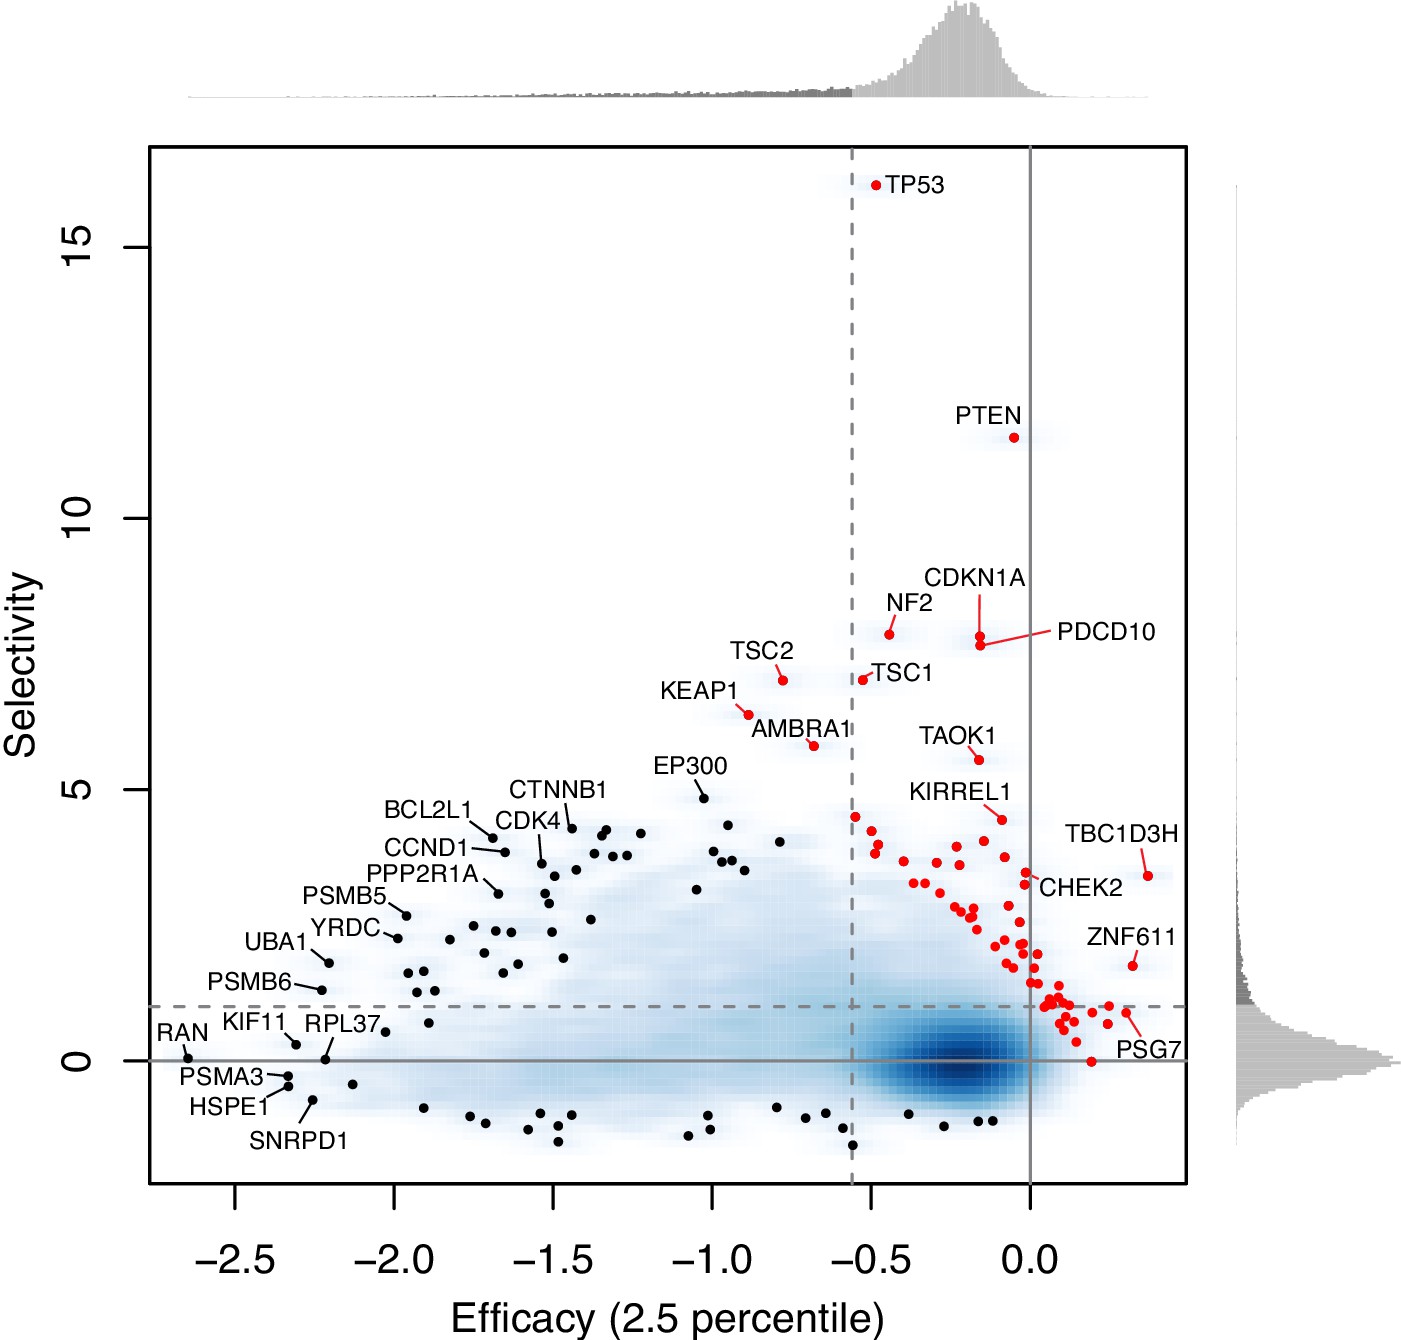
Efficacy and selectivity.
(A) The 1st and 99th percentiles of the combined dependency score of each gene where θ = 0.6. Each point corresponds to one gene. X- and Y-axes are equivalent to the efficacy with X = 1 and X = 99, respectively. Solid red line and dashed black line are robust linear regression and identity lines, respectively. (B) Distribution of the combined dependency scores of four selective and four non-selective genes. The 1st and 99th percentile values within each distribution are also highlighted. (C) The efficacy and selectivity of all genes are plotted. (D) Summary of the pathways overrepresented by genes with strongly negative efficacy and high selectivity, strongly negative efficacy, and high selectivity, respectively.
-
Figure 3—source data 1
Efficacy and selectivity for 15,847 genes for the six and five X: .
- https://cdn.elifesciences.org/articles/57116/elife-57116-fig3-data1-v3.xlsx
-
Figure 3—source data 2
GO/KEGG pathways overrepresented by genes with strongly negative efficacy, high selectivity, or strongly negative efficacy and high selectivity for six and X=1.
- https://cdn.elifesciences.org/articles/57116/elife-57116-fig3-data2-v3.xlsx
Figure 4
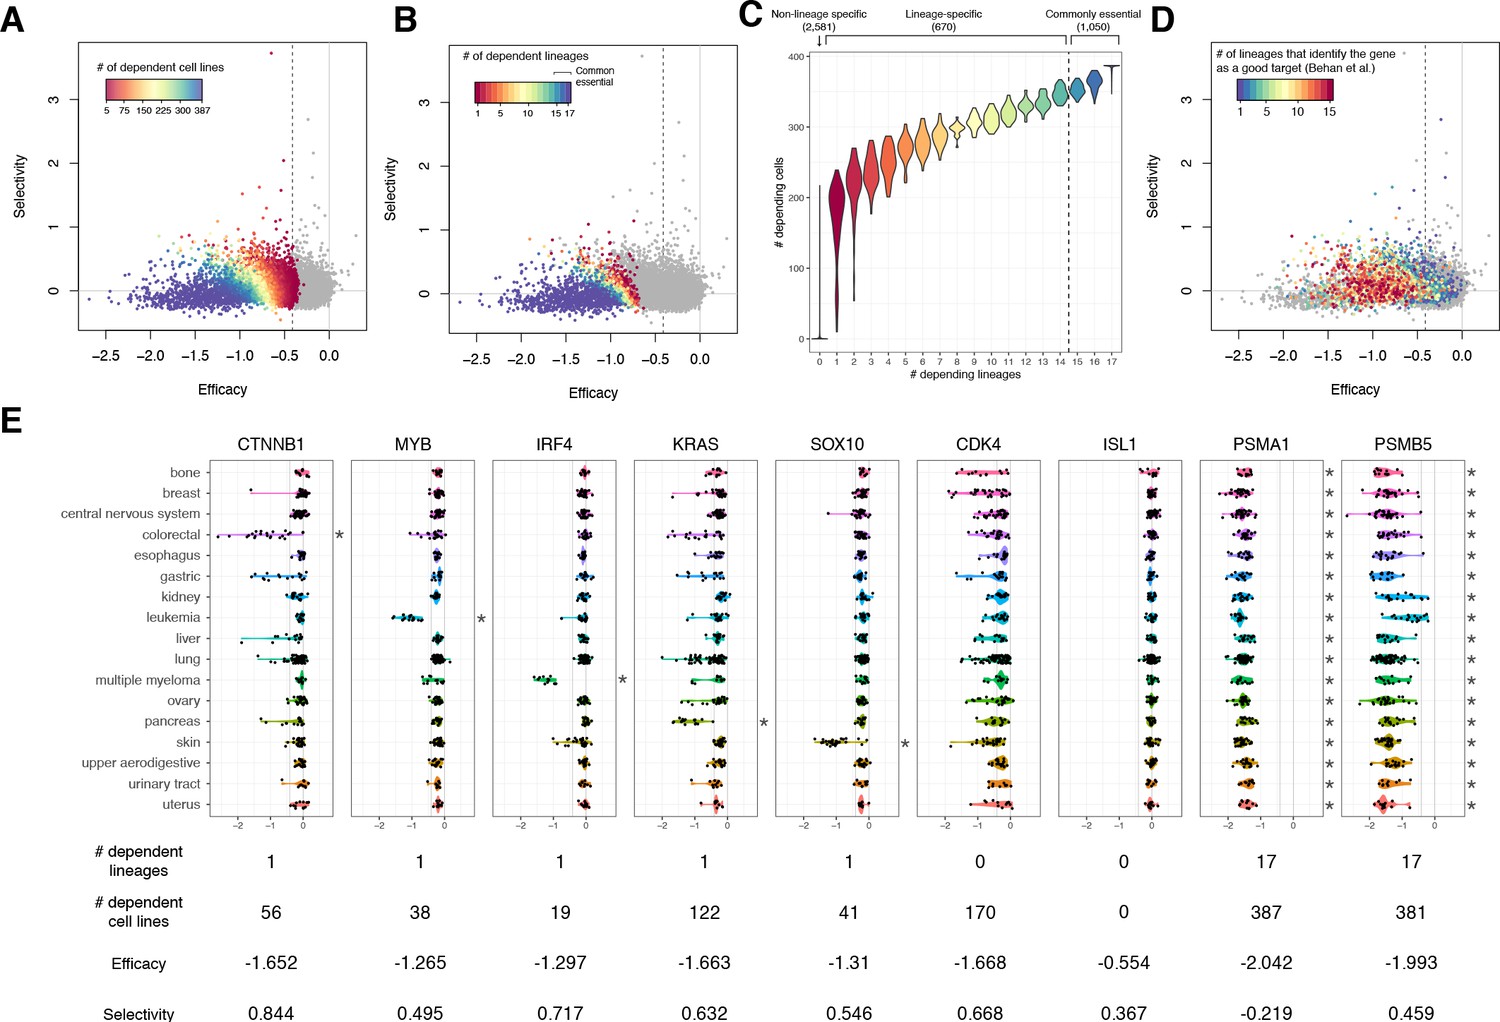
The lineage dependency.
In A, B, and D, the efficacy and selectivity scatterplots (Figure 3C) are color-coded differently, highlighting the following properties of each gene. (A) The numbers of dependent cell lines. (B) The number of dependent lineages, computed with the Adaptive Daisy Model (ADaM). (C) The relationship between the dependent cell lines and the dependent lineages. (D) The number of lineages in which Behan et al. suggested suitable for chemotherapy targets. (E) Nine genes’ dependency scores grouped by lineages, together with the number of dependent lineages and cell lines, efficacy, and selectivity. All the panels in this figure were computed using θ = 0.6 and X = 1.
-
Figure 4—source data 1
Lineage-dependent essentiality of 17 lineages and common essentiality computed using the Adaptive Daisy Model (ADaM) for six .
- https://cdn.elifesciences.org/articles/57116/elife-57116-fig4-data1-v3.xlsx
Figure 5 with 3 supplements

Essential gene clustering.
(A) The framework of ensemble clustering with hierarchy over DBSCAN on t-SNE with Spearman distance matrix (ECHODOTS) algorithm. (B) Nine gene clusters and their associated pathways. (C) Median efficacy and selectivity of large clusters. (D) Genes consisting of large clusters with high selectivity highlighted in C. (E–G) The intra-cluster connectivity of three gene clusters as exemplars. The colors of nodes indicate their membership of small clusters, and the edges indicate that the two connected genes have Spearman correlation coefficient greater than 0.1. Numbers in E indicate Spearman correlation coefficients.
-
Figure 5—source data 1
Cluster membership of essential genes and probability of their assignment to clusters for six .
- https://cdn.elifesciences.org/articles/57116/elife-57116-fig5-data1-v3.xlsx
-
Figure 5—source data 2
Pathways overrepresented in large clusters for six .
Clusters that contain 15 genes or more are only considered in this analysis.
- https://cdn.elifesciences.org/articles/57116/elife-57116-fig5-data2-v3.xlsx
Figure 5—figure supplement 1
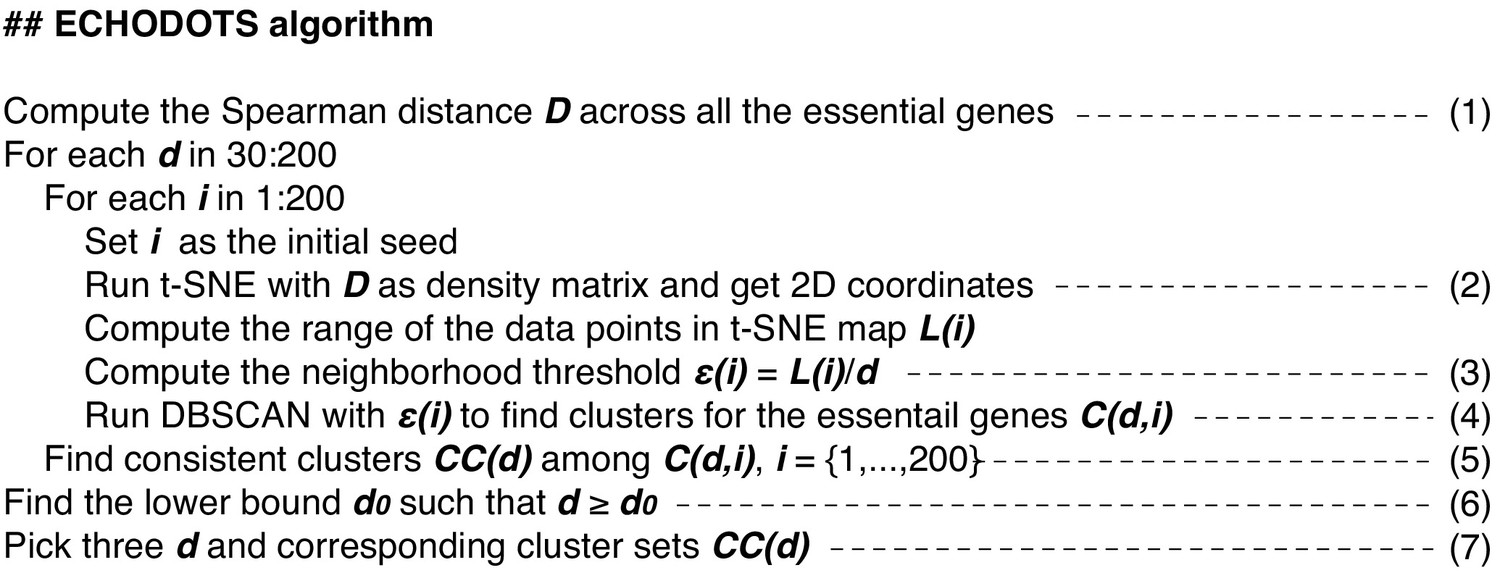
Ensemble clustering with hierarchy over DBSCAN on t-SNE with Spearman distance matrix (ECHODOTS) algorithm.
The ECHODOTS algorithm is written using pseudocodes. The line numbers correspond to the line numbers in the main text.
Figure 5—figure supplement 2

Efficacy, selectivity, and dependent lineages with various θ.
(A) Empirical cumulative density functions (CDFs) of the efficacy across all the genes with various θ. (B) Empirical CDFs of the number of dependent cell lines across all the genes with various θ. (C) The distribution of the number of dependent lineages among essential genes with various θ. The genes in the left- and right-hand side of the vertical lines are considered selectively and commonly essential according to the Adaptive Daisy Model (ADaM). (D, E) The efficacy–selectivity plot of all the genes with various θ (X=1). The genes are color-coded based on the number of dependent cell lines (D) and lineages (E). (F) Relationship between the number of dependent lineages and the number of dependent cell lines with various θ (X=1). (G) Empirical CDFs of the selectivity across all the genes with various θ. (H) The number of overrepresented pathways associated with genes with strongly negative efficacy and high selectivity, strongly negative efficacy, and high selectivity.
Figure 5—figure supplement 3

Dependent cell lines and lineages using six dependency scores.
In A–D, four parameters were plotted on Y-axis against on X-axis, where is a neighborhood threshold in density-based spatial clustering and noise (DBSCAN), for various θ. (A) The ratio between the sizes of the first and second largest clusters (N1/N2). (B) The number of genes assigned into the first and second largest clusters (N1 and N2) and the number of noise genes (Nn), that is, the genes that are not clustered with other genes. (C) The number of clusters. (D) The mean cluster size. (E) The similarity of the clusters with various θ. Cluster membership of the 2008 genes that were found essential with all θ was compared using cl_dissimilarity in clue R package.
Figure 6
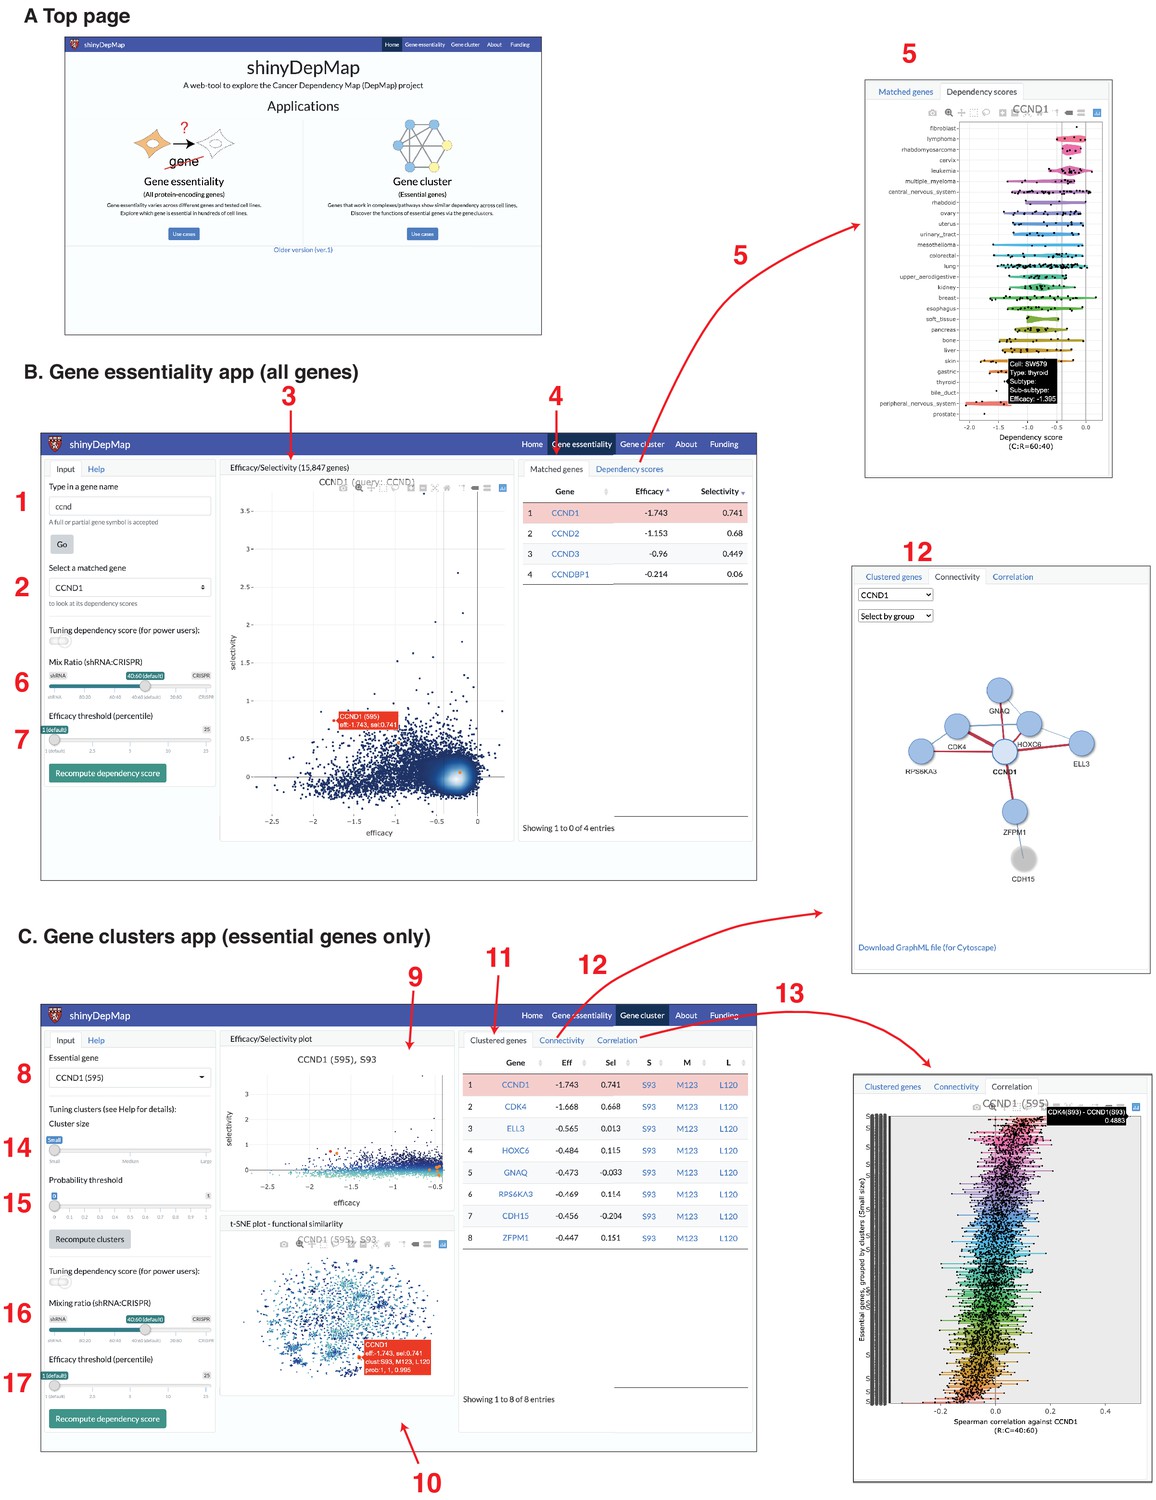
shinyDepMap: a web tool to explore DepMap dataset.
(A) Top page. (B) Gene essentiality app. 1: textbox to type in a (partial) gene symbol to query; 2: dropdown menu to select a gene symbol that matches the query; 3: efficacy–selectivity scatterplot; 4: list of matched genes; 5: combined dependency score profile of the gene selected in 2; 6: mix ratio; 7: efficacy threshold (C) Gene clusters app; 8: dropdown menu to select an essential gene to explore; 9: efficacy–selectivity plot for essential genes; 10: t-distributed stochastic neighbor embedding (t-SNE) plot; 11: list of clustered genes; 12: connectivity plot; 13: Spearman correlation between the selected gene and other essential genes; 14: cluster size input; 15: probability threshold input; 16: mix ratio; 17: efficacy threshold.
Author response image 1
Author response image 2
Additional files
Download links
A two-part list of links to download the article, or parts of the article, in various formats.
Downloads (link to download the article as PDF)
Open citations (links to open the citations from this article in various online reference manager services)
Cite this article (links to download the citations from this article in formats compatible with various reference manager tools)
shinyDepMap, a tool to identify targetable cancer genes and their functional connections from Cancer Dependency Map data
eLife 10:e57116.
https://doi.org/10.7554/eLife.57116


