PRDM9 activity depends on HELLS and promotes local 5-hydroxymethylcytosine enrichment
- Institut de Génétique Humaine (IGH), Centre National de la Recherche Scientifique, Univ Montpellier, France
- Institut de Génomique Fonctionnelle, Université de Montpellier, CNRS, INSERM, France
Figures
Figure 1 with 1 supplement
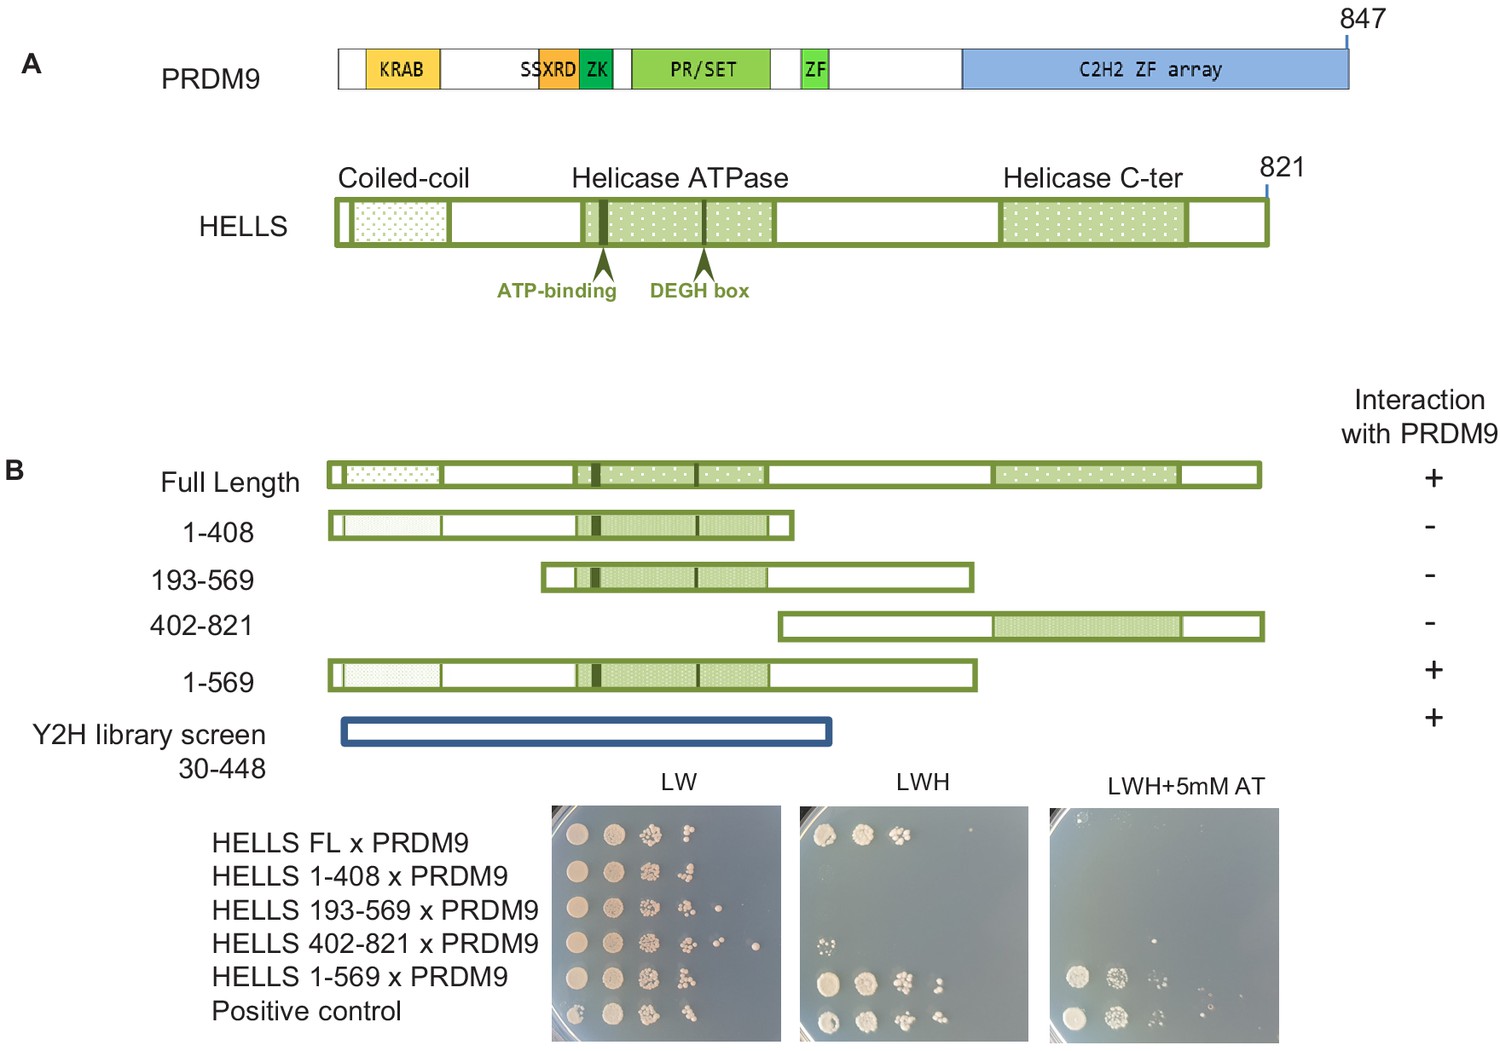
HELLS interacts with PRDM9.
(A) Domains of PRDM9 and HELLS PRDM9 includes a Krüppel-associated box domain (KRAB), a synovial sarcoma-X break point-repression domain (SSXRD), a Su(var)3–9, Polycomb-group protein enhancer of zeste and trithorax-group protein TRX domain (PR/SET) that is preceded and followed by zinc-finger domains (ZK and ZF, respectively), and a C2H2-type zinc-finger array (C2H2 ZF array). HELLS contains a coiled-coil domain, a helicase ATPase domain, and a helicase C-terminal domain. (B) Interaction between PRDM9 and HELLS by yeast two-hybrid assays. Full-length and four fragments of mouse HELLS were used to test for interaction with mouse PRDM9 (full length). HELLS domains were fused to the Gal4 activation domain (GAD), and PRDM9 was fused to the Gal4 DNA-binding domain (GBD). A positive interaction was detected for full-length HELLS and fragment 1–569. Growth was tested on medium without leucine and tryptophan (LW), without leucine, tryptophan and histidine (LWH), and without leucine, tryptophan and histidine with 5 mM amino-triazole (LWH + 5 mM AT). A diploid strain that expresses pGAD-REC114 and pGBD-MEI4 (Kumar et al., 2010) was used as positive control. The HELLS region of the cDNAs isolated by yeast two-hybrid screening is shown. Controls are shown in Figure 1—figure supplement 1.
Figure 1—figure supplement 1
Controls for yeast two-hybrid assays.
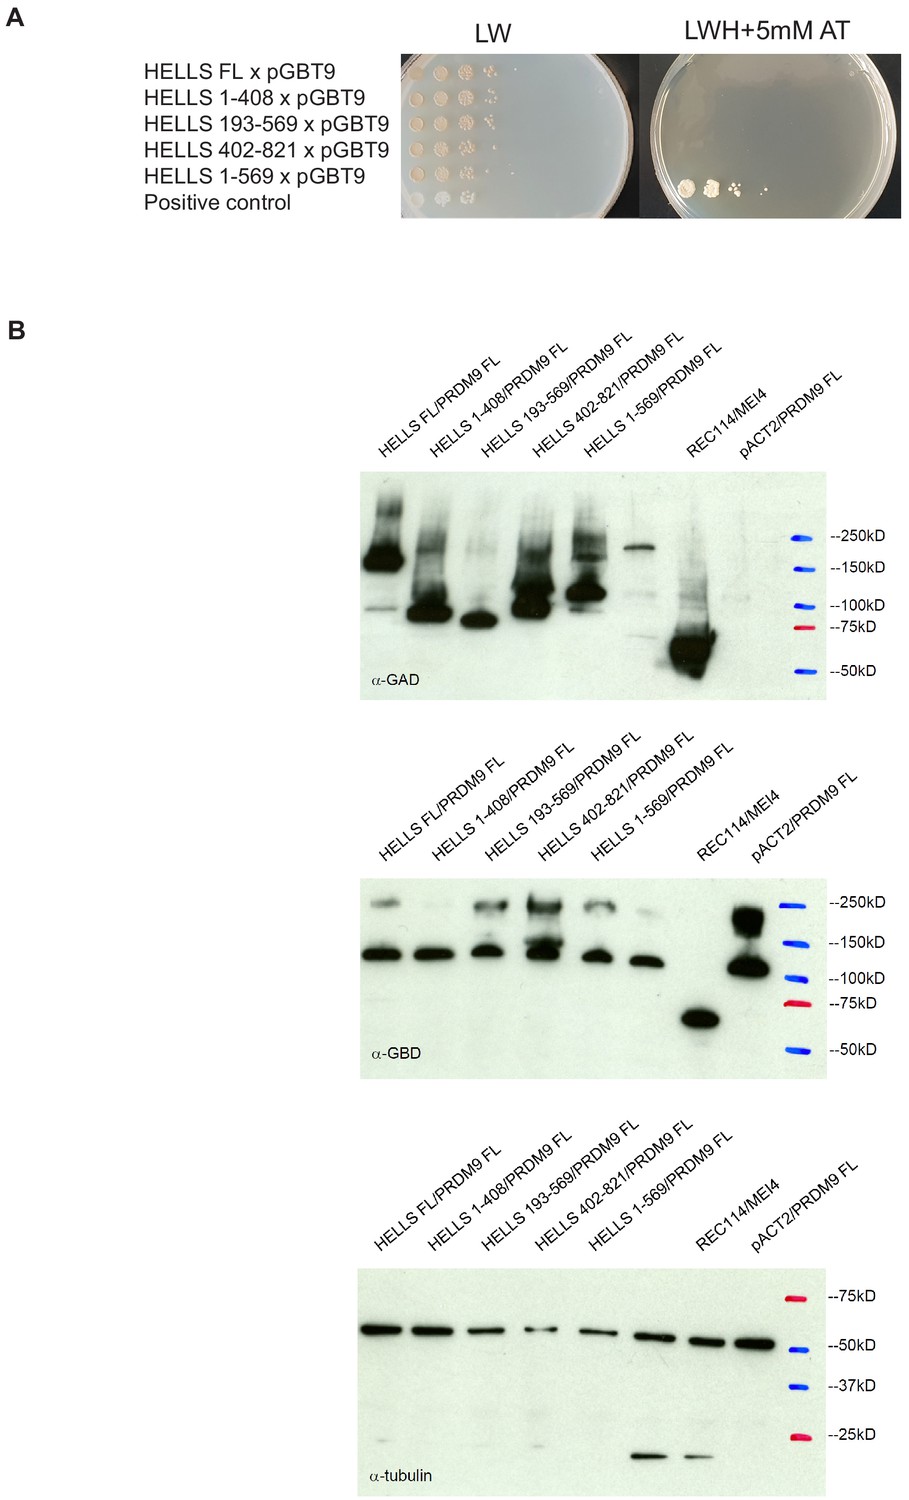
(A) Negative controls for the different mouse HELLS domains analyzed by yeast two-hybrid assays. Growth of diploid strains that express the indicated HELLS construct or the empty GBT9 vector were tested on medium without leucine and tryptophan (LW) and on medium without leucine, tryptophan and histidine with 5 mM amino-triazole (LWH + 5 mM AT). Positive control was a diploid strain that expresses pGAD-REC114 and pGBD-MEI4. (B) Western blot analysis of the GAD-HELLS and GBD-PRDM9 fusion proteins expressed in the various diploid strains used in the yeast two-hybrid assays. Blots were probed with anti-GAD, anti-GBD, or anti-tubulin (internal control) antibodies, as indicated.
Figure 2 with 5 supplements
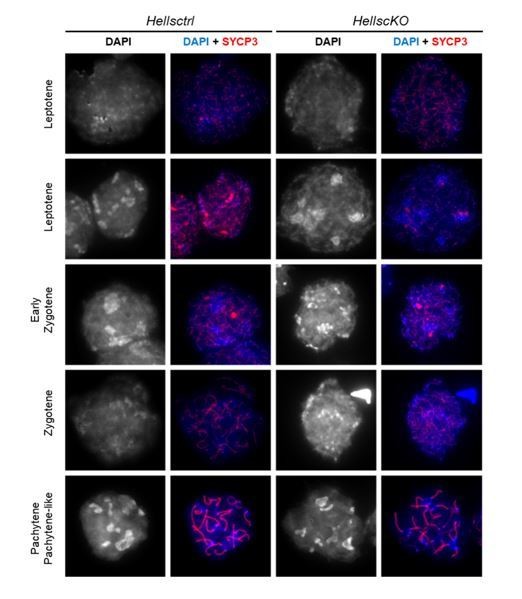
Meiotic prophase is defective in Hells cKO spermatocytes.
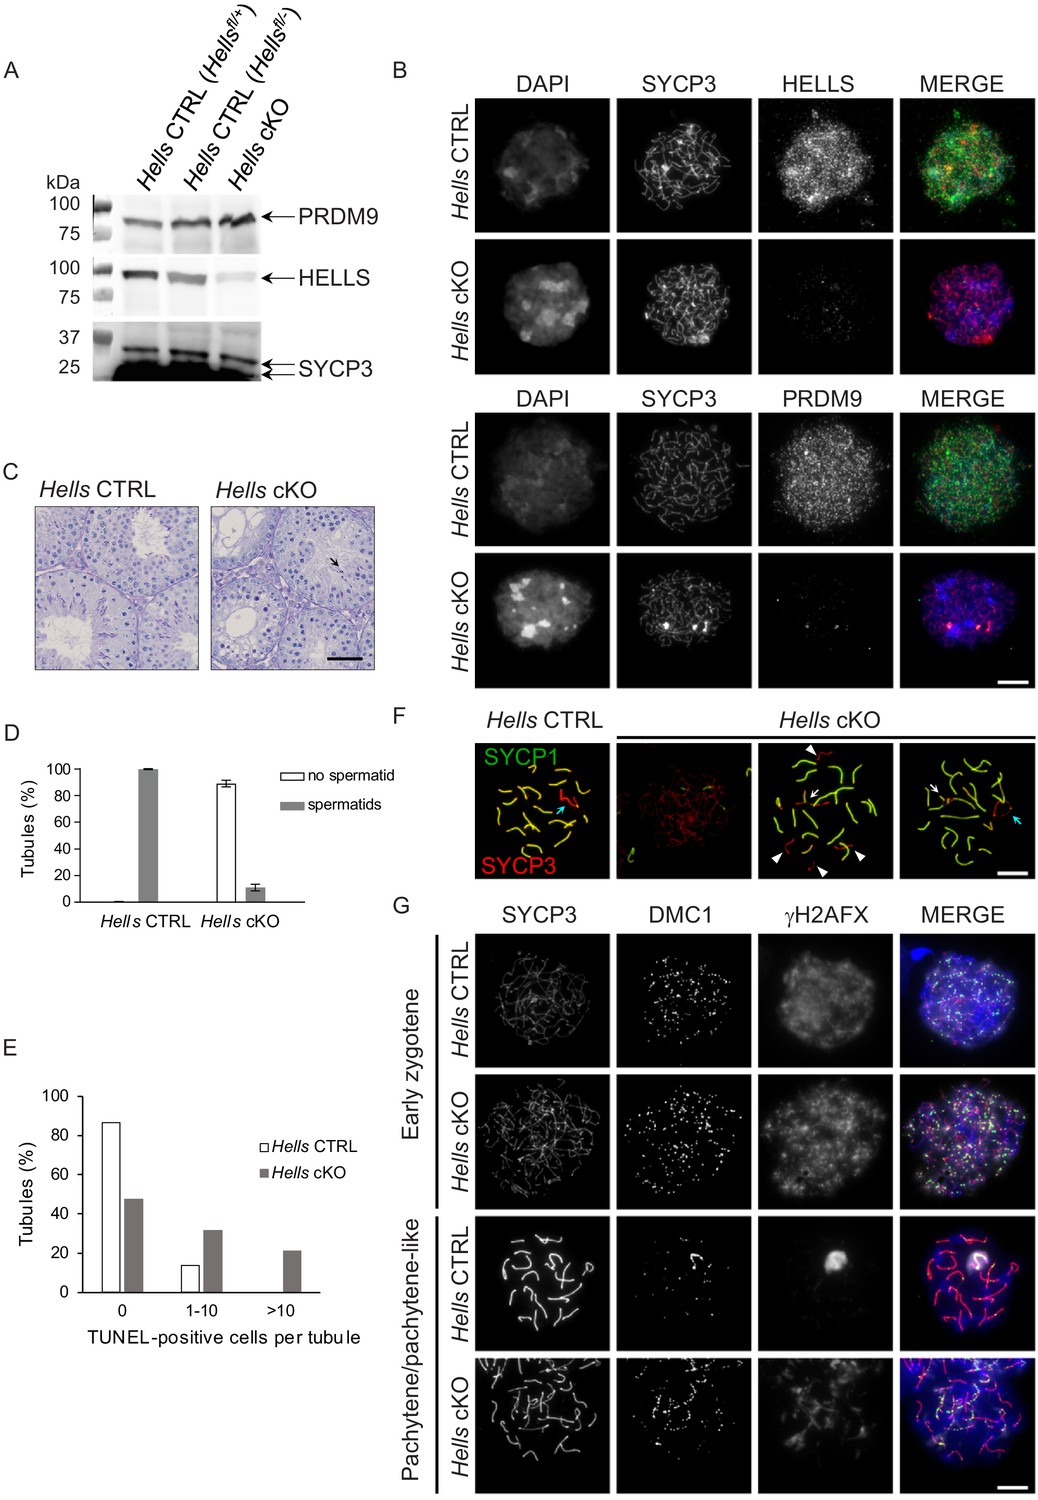
(A) Detection of PRDM9, HELLS and SYCP3 expression in nuclear fractions of testes from Hells CTRL (Hellsfl/+ and Hellsfl/-) and Hells cKO mice at 22 dpp. Hells alleles are presented in Figure 2—figure supplement 1. HELLS and PRDM9 expression are presented in Figure 2—figure supplement 2. (B) Representative spreads of early zygotene spermatocyte nuclei from synchronized testes from Hells CTRL and Hells cKO mice after staining for DNA (DAPI, white or blue), SYCP3 (white or red) and HELLS (white or green) (top panels) or PRDM9 (white or green) (bottom panels). Anti-HELLS antibody from rabbit was used for these staining. Scale bar, 10 μm. HELLS and PRDM9 detection kinetics are presented in Figure 2—figure supplements 3 and 5. (C) Periodic acid-Schiff (PAS) staining of testis sections from 40 dpp Hells CTRL and Hells cKO mice. To visualize the glycoproteins/acrosomes (violet) and nuclei (blue), testis sections were stained with PAS and counterstained with hematoxylin. Hells CTRL testis sections (left panel) show normal spermatogenesis with well-organized stages of germ cell development, round spermatids with PAS-positive normal acrosomal caps, elongating and elongated spermatids. Hells cKO testis sections (right panel) show defective spermatogenesis with only few elongated spermatids (black arrow). Scale bar, 50 μm. (D) Proportions of seminiferous tubules without and with spermatids (mean ± SD) in testis sections from Hells CTRL and Hells cKO mice at 40 dpp. n = 4 testis sections from two mice. Data are available in Figure 2—source data 1. (E) Apoptosis detected by TUNEL assay in Hells CTRL and Hells cKO testes at 40 dpp. n = 2 testis sections from one mouse. TUNEL-positive cells are shown in Figure 2—figure supplement 4. Data are available in Figure 2—source data 1. (F) SYCP3 (red) and SYCP1 (green) staining of pachytene (Hells CTRL) and pachytene-like (Hells cKO) spermatocyte nuclei from 40 dpp mice. Arrowheads, unsynapsed chromosomes. White arrow, non-homologous synapsis. Blue arrows, sex chromosomes. Scale bar, 10 μm. (G) Representative spreads of early zygotene and pachytene or pachytene-like spermatocyte nuclei from 40 dpp Hells CTRL and Hells cKO mice, respectively, after staining for SYCP3 (white or red), DMC1 (white or green) and γH2AFX (white or blue). Scale bar, 10 μm.
-
Figure 2—source data 1
Quantification of spermatid and TUNEL-positive sections.
- https://cdn.elifesciences.org/articles/57117/elife-57117-fig2-data1-v2.xlsx
Figure 2—figure supplement 1
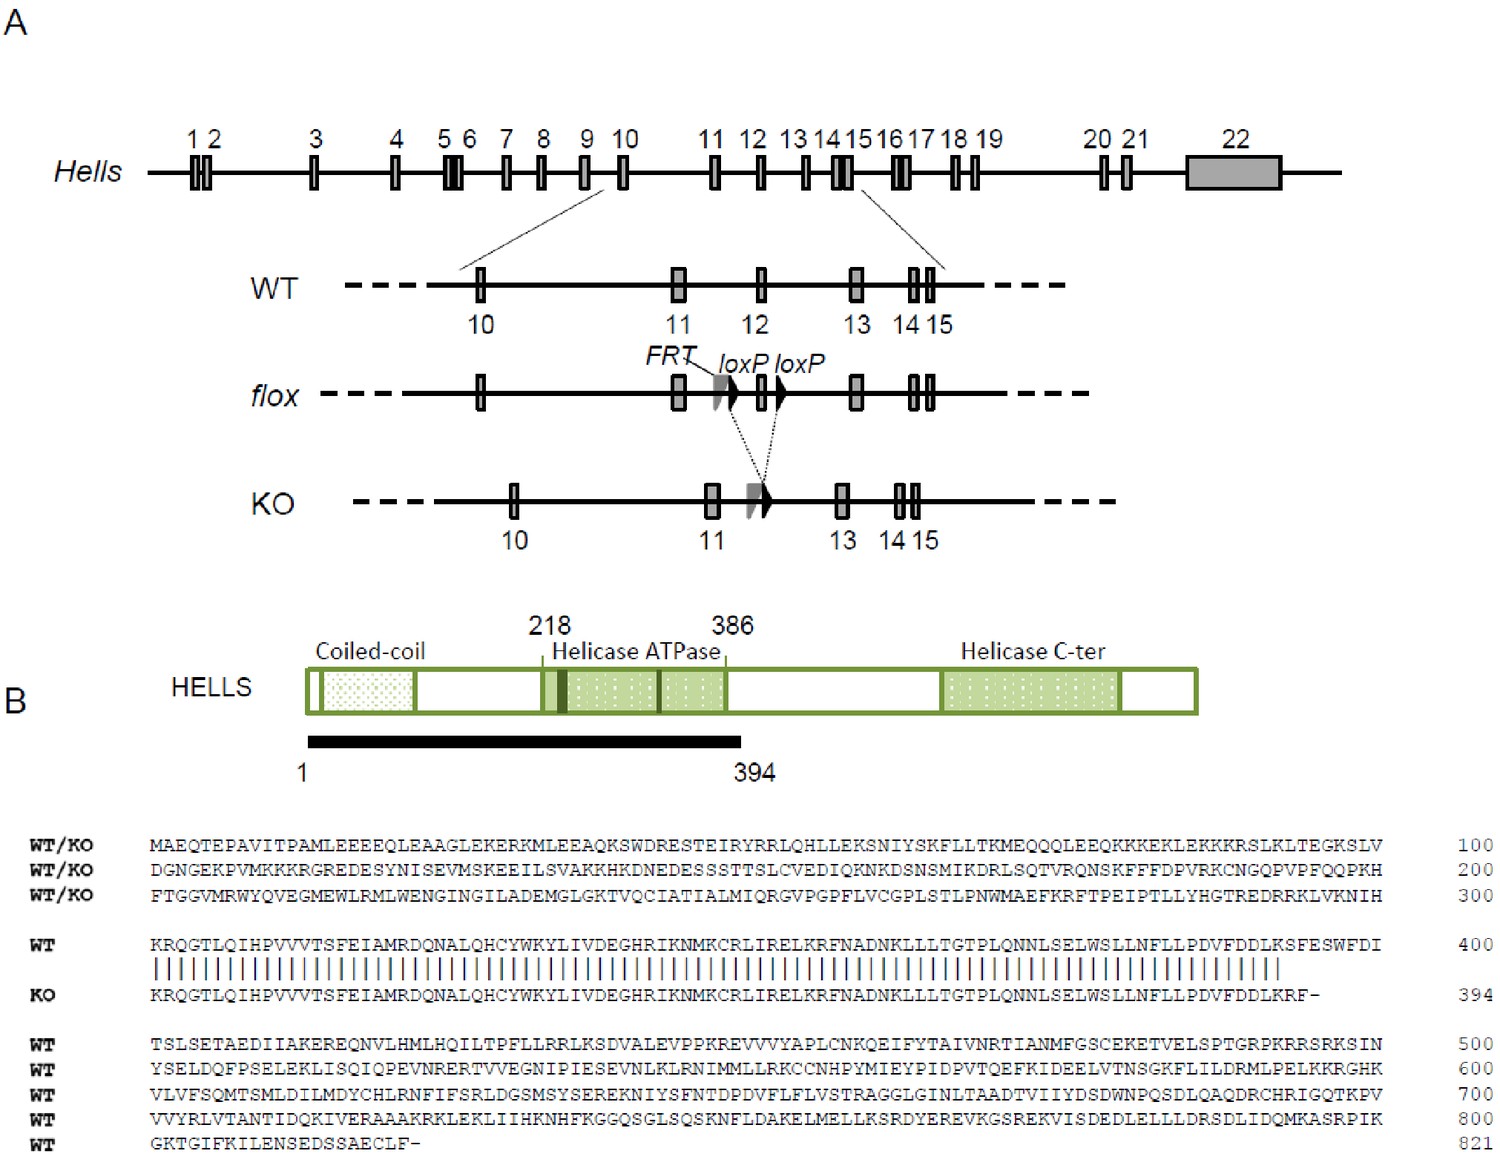
The Hells cKO allele.
(A) Schematic diagram of the Hells alleles used in this study. (B) Schematic diagram (top) and predicted sequence (bottom) of wild-type (from WT or floxed allele) and mutant (KO) HELLS proteins.
Figure 2—figure supplement 2
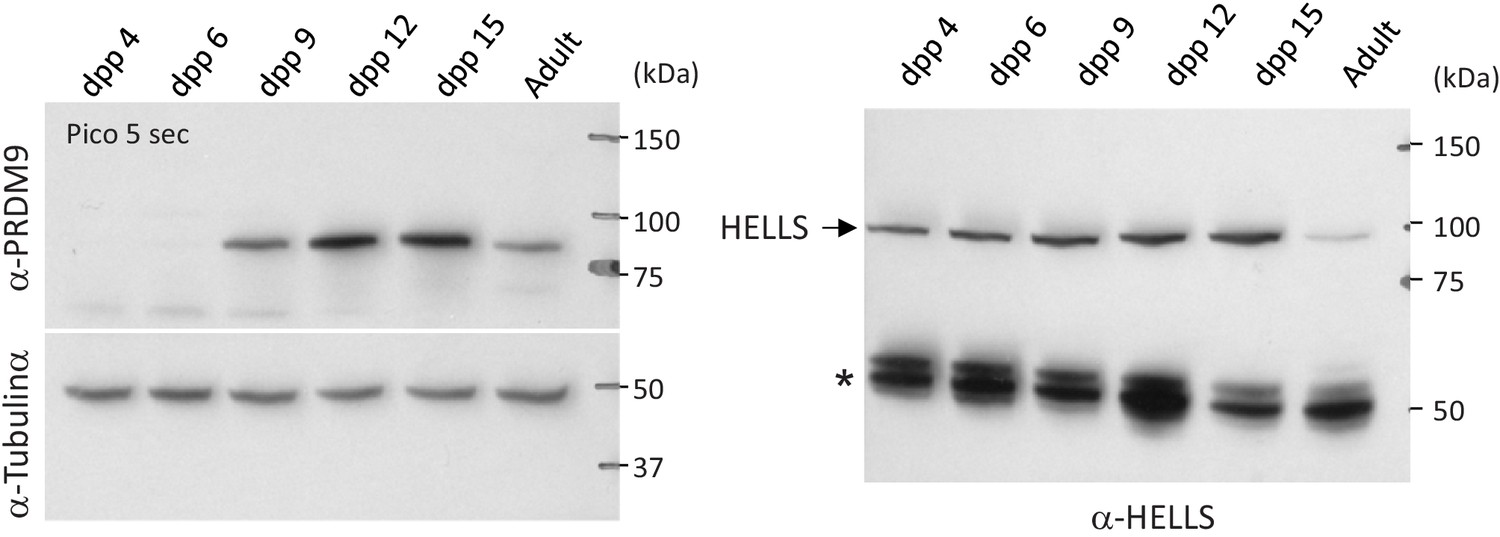
PRDM9 and HELLS protein levels during the first wave of spermatogenesis in wild-type mice.
Testis extracts from RJ2 mice at the indicated days post-partum (dpp) and from adult were analyzed by western blotting. The same amount of extracts was loaded in parallel on two different gels. One membrane (left) was probed with anti-PRDM9 and anti-tubulin α antibodies, the other membrane (right) with an anti-HELLS antibody. The star on the right panel indicates non-specific bands.
Figure 2—figure supplement 3
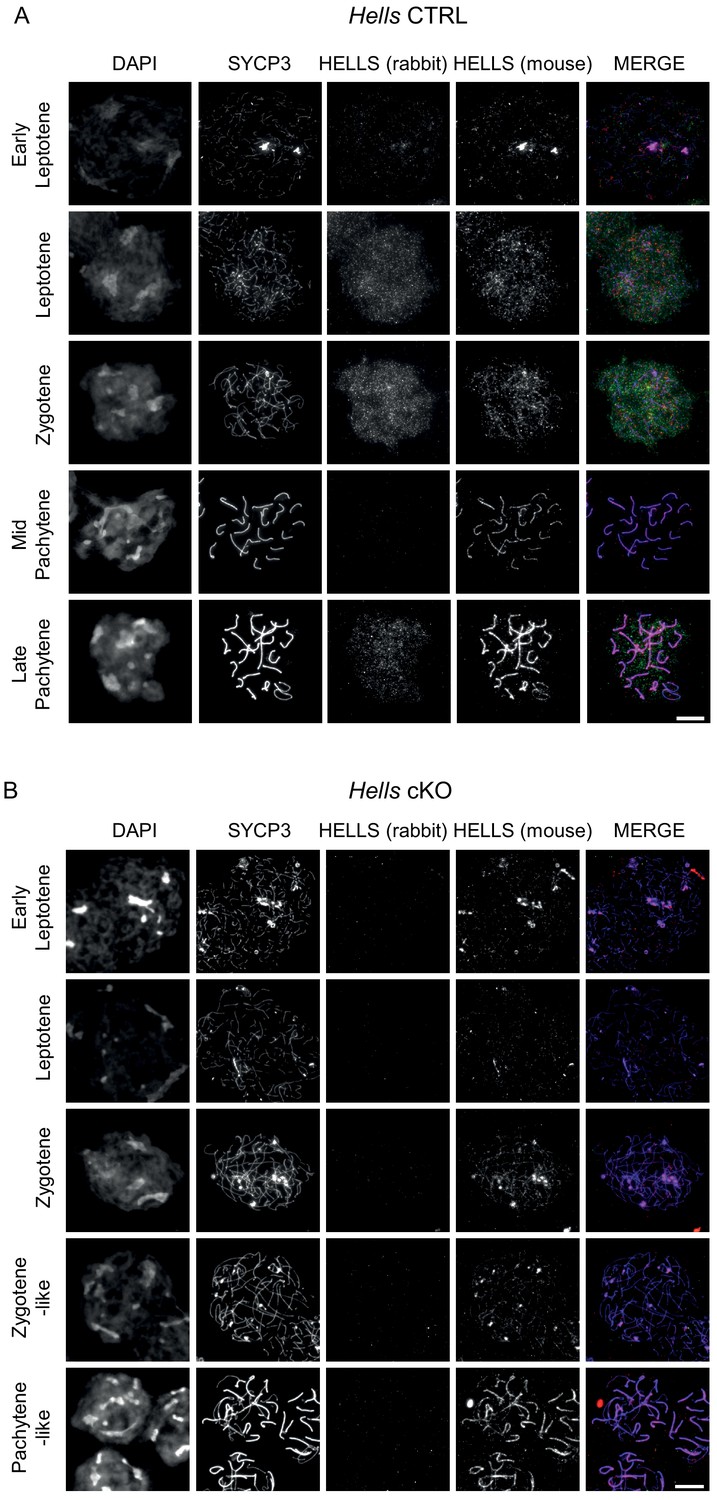
HELLS detection in Hells CTRL and Hells cKO spermatocytes Representative spreads of spermatocyte nuclei from Hells CTRL.
(A) And Hells cKO (B) Mice after staining for DNA (DAPI, white), SYCP3(white or blue), and HELLS using a rabbit (white or green) and a mouse (white or red) antibody. Scale bar, 10 μm. Both rabbit and mouse anti-HELLS antibodies display a nucleus-wide, punctate staining in leptotene and zygotene stages, attributable to HELLS. In addition to this specific signal, both antibodies showed also a different non-specific signal. The mouse antibody showed a colocalization with SYCP3 at every stage, that was not seen with the rabbit antibody and is therefore most likely not attributable to HELLS. The rabbit antibody showed a nucleus-wide staining in late pachytene and diplotene stage nuclei, not seen with the mouse antibody, likely due to cross-reaction.
Figure 2—figure supplement 4
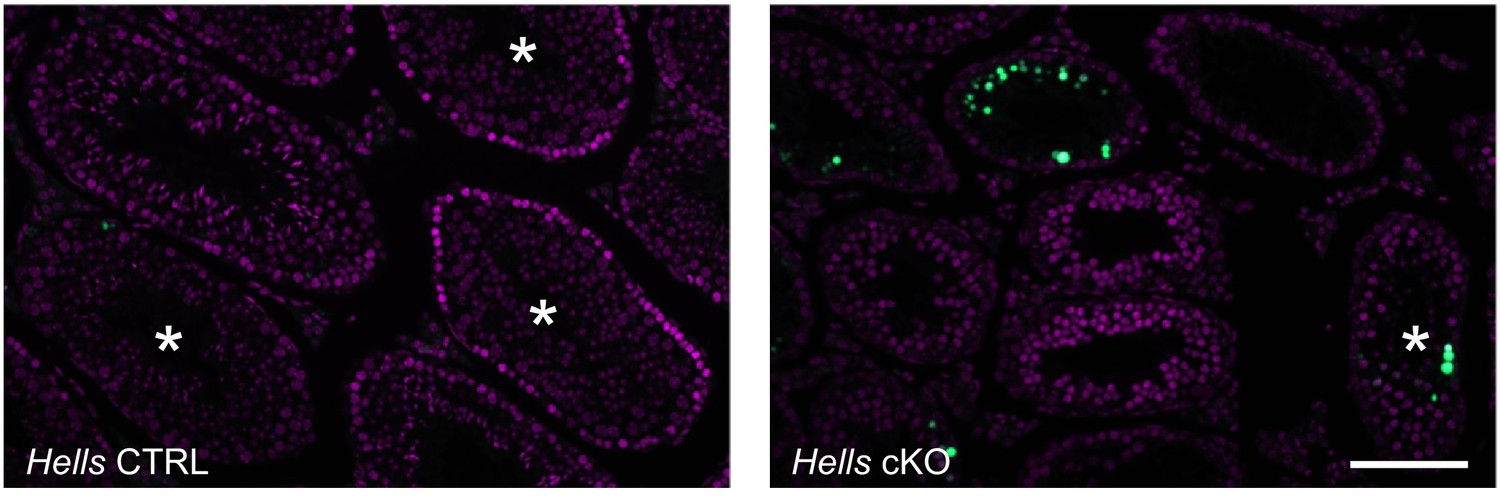
TUNEL-positive cells detected in testis sections of control and Hells cKO mice.
Sections from 40dpp Hells CTRL and Hells cKO mice were stained for DNA (DAPI, purple) and TUNEL (green). Asterisks mark tubules containing round spermatids. Scale bar, 10 μm.
Figure 2—figure supplement 5
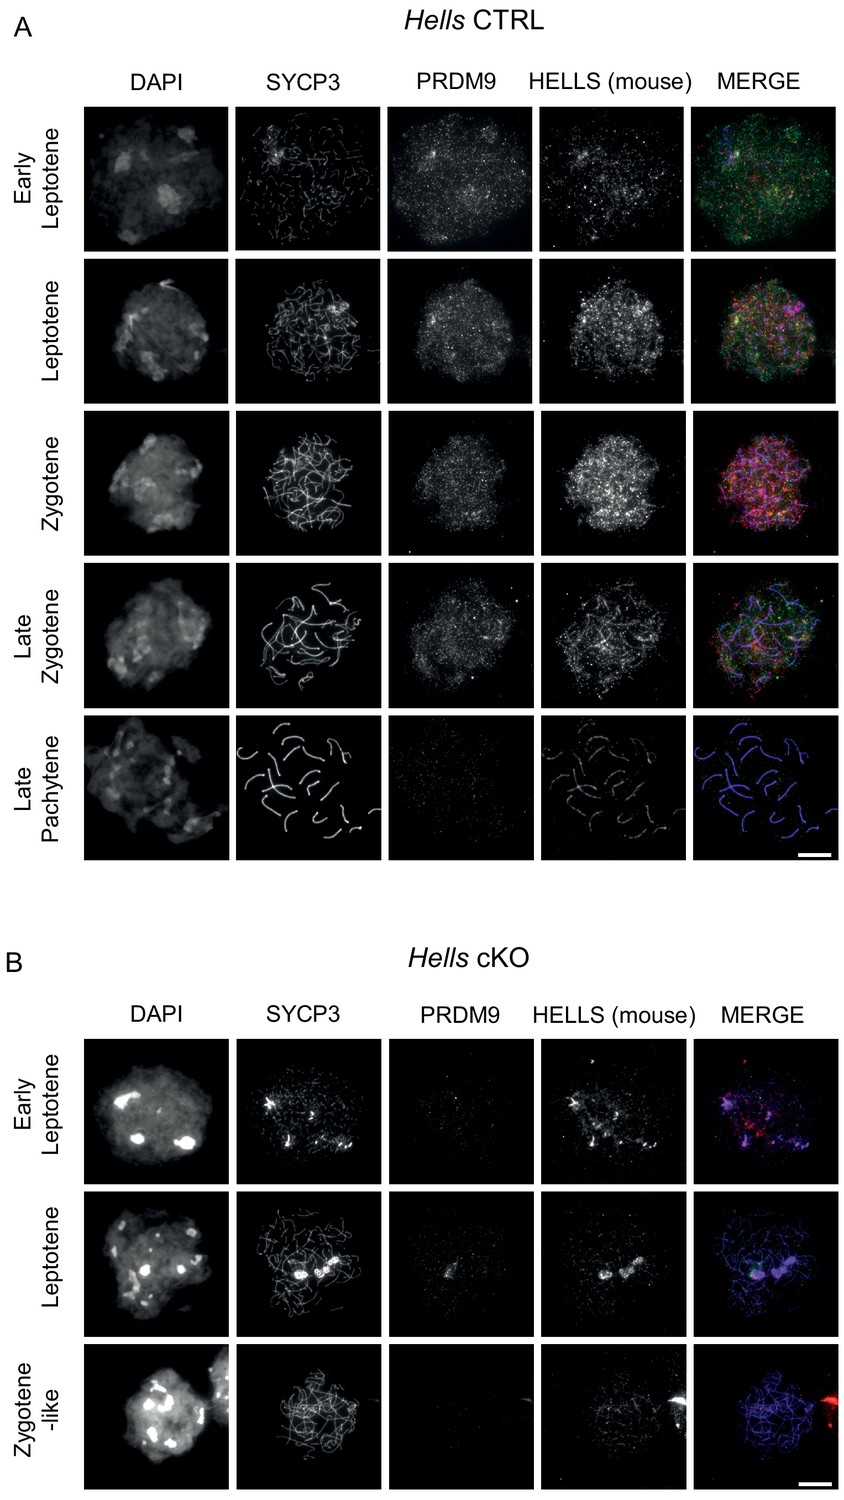
HELLS and PRDM9 detection in Hells CTRL and Hells cKO spermatocytes.
Representative spreads of spermatocyte nuclei from Hells CTRL (A) and Hells cKO (B) mice after staining for DNA (DAPI, white), SYCP3 (white or blue), PRDM9 (white or green) and HELLS (white or red). Scale bar, 10 μm. In addition to bona fides HELLS staining, the mouse anti-HELLS antibody displays additional, non-specific staining marking the chromosome axes, as described in the legend to Figure 2—figure supplement 3.
Figure 3 with 2 supplements
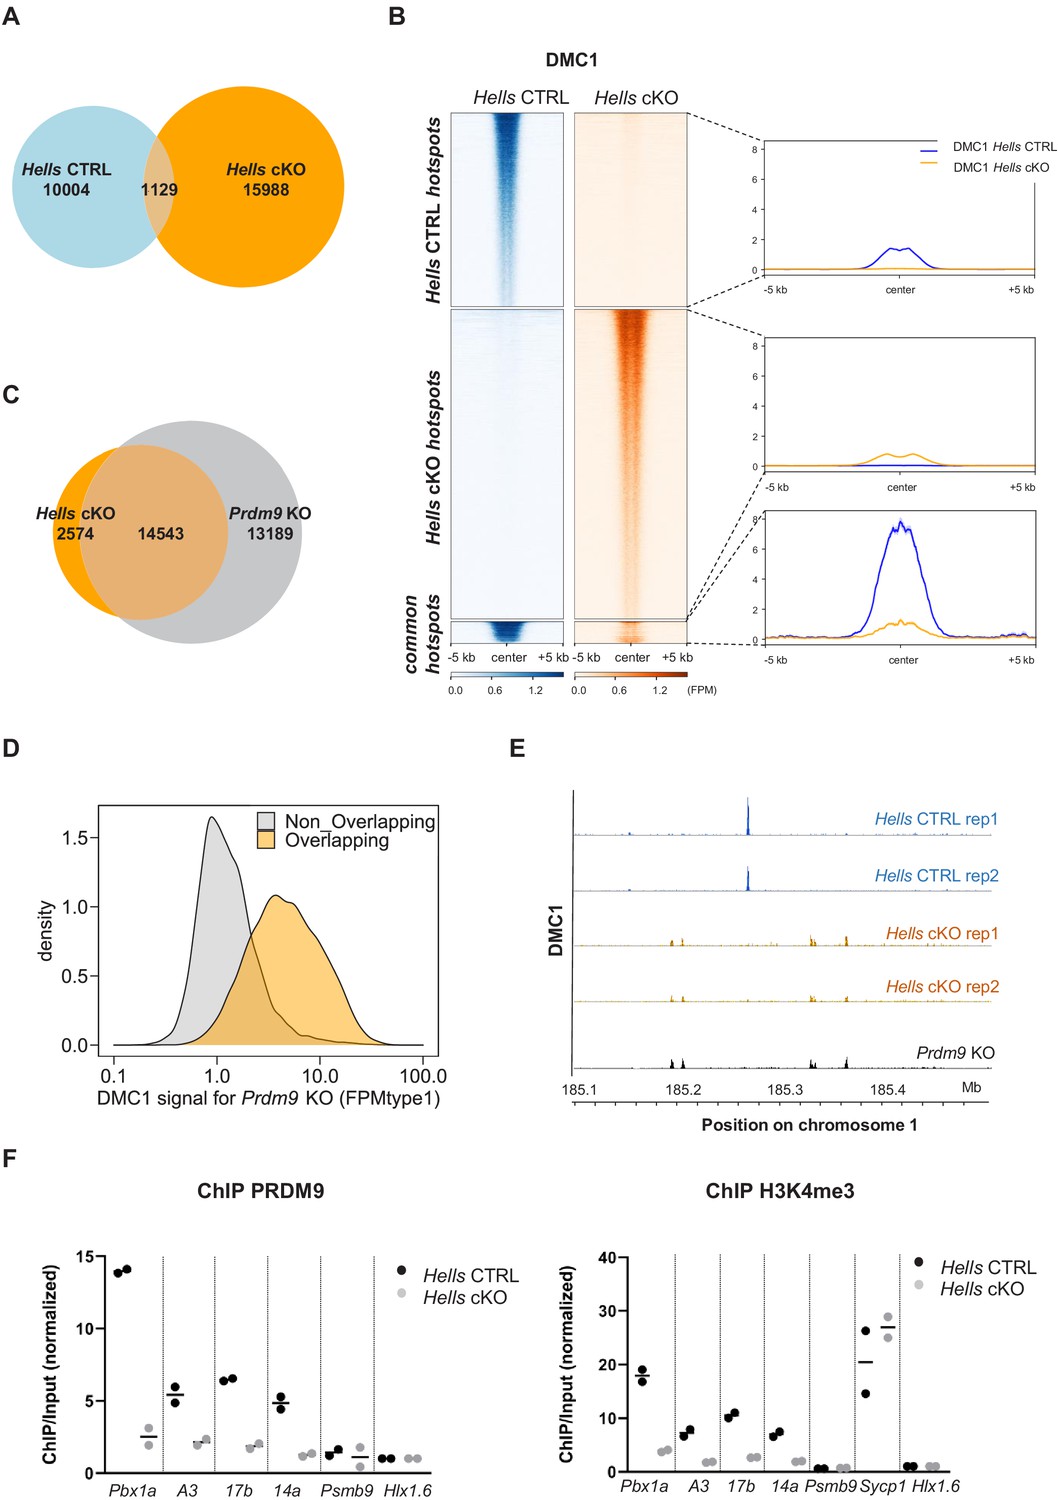
HELLS is required for the formation of meiotic DSBs at sites of PRDM9-dependent DSB formation; DSBs are directed at default sites in the absence of HELLS.
(A) Limited overlapping between DSB hotspots from Hells CTRL and Hells cKO testis samples. Only hotspot centers (DMC1-SSDS peaks) that overlapped within a 400bp-window were considered as common. The others were considered as Hells CTRL- or Hells cKO-specific hotspots. Controls are shown in Figure 3—figure supplement 1. (B) Distribution of the DMC1-SSDS signal from Hells CTRL and Hells cKO testis samples around Hells CTRL, Hells cKO and common hotspots (as defined in (A)). The heatmaps show the DMC1-SSDS normalized fragments per million, calculated in a −5 kb to +5 kb window around hotspot centers and averaged within 10bp-bins. For the Hells CTRL - or Hells cKO-specific hotspots, the sites on the heatmaps were ranked by decreasing DMC1 intensity (from top to bottom) in the genotype where the peaks were detected. For the common hotspots, the sites were ranked by decreasing DMC1 intensity (from top to bottom) in Hells CTRL mice. The averaged profiles represent the mean DMC1-SSDS signal for each group. The analysis of common hotspots is shown in Figure 3—figure supplement 2. (C) Wide overlapping of DSB hotspots from Hells cKO and Prdm9 KO testis samples. Hotspot (DMC1-SSDS peaks) centers that overlapped within a 400bp-window were considered as common. The others were considered to be Hells cKO- or Prdm9 KO-specific hotspots. Prdm9 KO data were from GSE99921 (Brick et al., 2012). (D) The DMC1-SSDS signal in Prdm9 KO testis samples is either Prdm9 KO-specific (i.e. not overlapping) or overlapping with Hells cKO-specific hotspots (as defined in (C)). Density of hotspot number is plotted as a function of the DMC1 signal in Prdm9 KO mice, expressed as FPMtype1 (type1-single-strand DNA fragments Per Million of mapped reads, see Materials and methods and Khil et al., 2012 for details). (E) DSB maps for Hells CTRL (blue) and Hells cKO (orange) testis samples (this study, two replicates for each genotype) and Prdm9 KO testis samples (black, GSE99921; Brick et al., 2012) at a representative region of chromosome 1 (185.1Mb-185.5Mb). (F) Enrichment of PRDM9 and H3K4me3 is reduced at hotspots in Hells cKO compared with Hells CTRL samples. PRDM9 and H3K4me3 ChIP/Input ratios were calculated at several B6 (PRDM9Dom2)-specific hotspots (Pbx1a, 14a, A3, 17b), at the Sycp1 promoter (only for H3K4me3), and at two control regions that contain PRDM9Cst-specific hotspots (Psmb9.8 and Hlx1.6). All ratios were normalized to the ratios at Hlx1.6. At the four B6-specific hotspots, the difference between Hells cKO and Hells CTRL was statistically significant (two-tailed Mann-Whitney, p=0.0002). Data are available in Figure 3—source data 1.
-
Figure 3—source data 1
PRDM9 and H3K4me3 ChIP-qPCR.
- https://cdn.elifesciences.org/articles/57117/elife-57117-fig3-data1-v2.xlsx
Figure 3—figure supplement 1
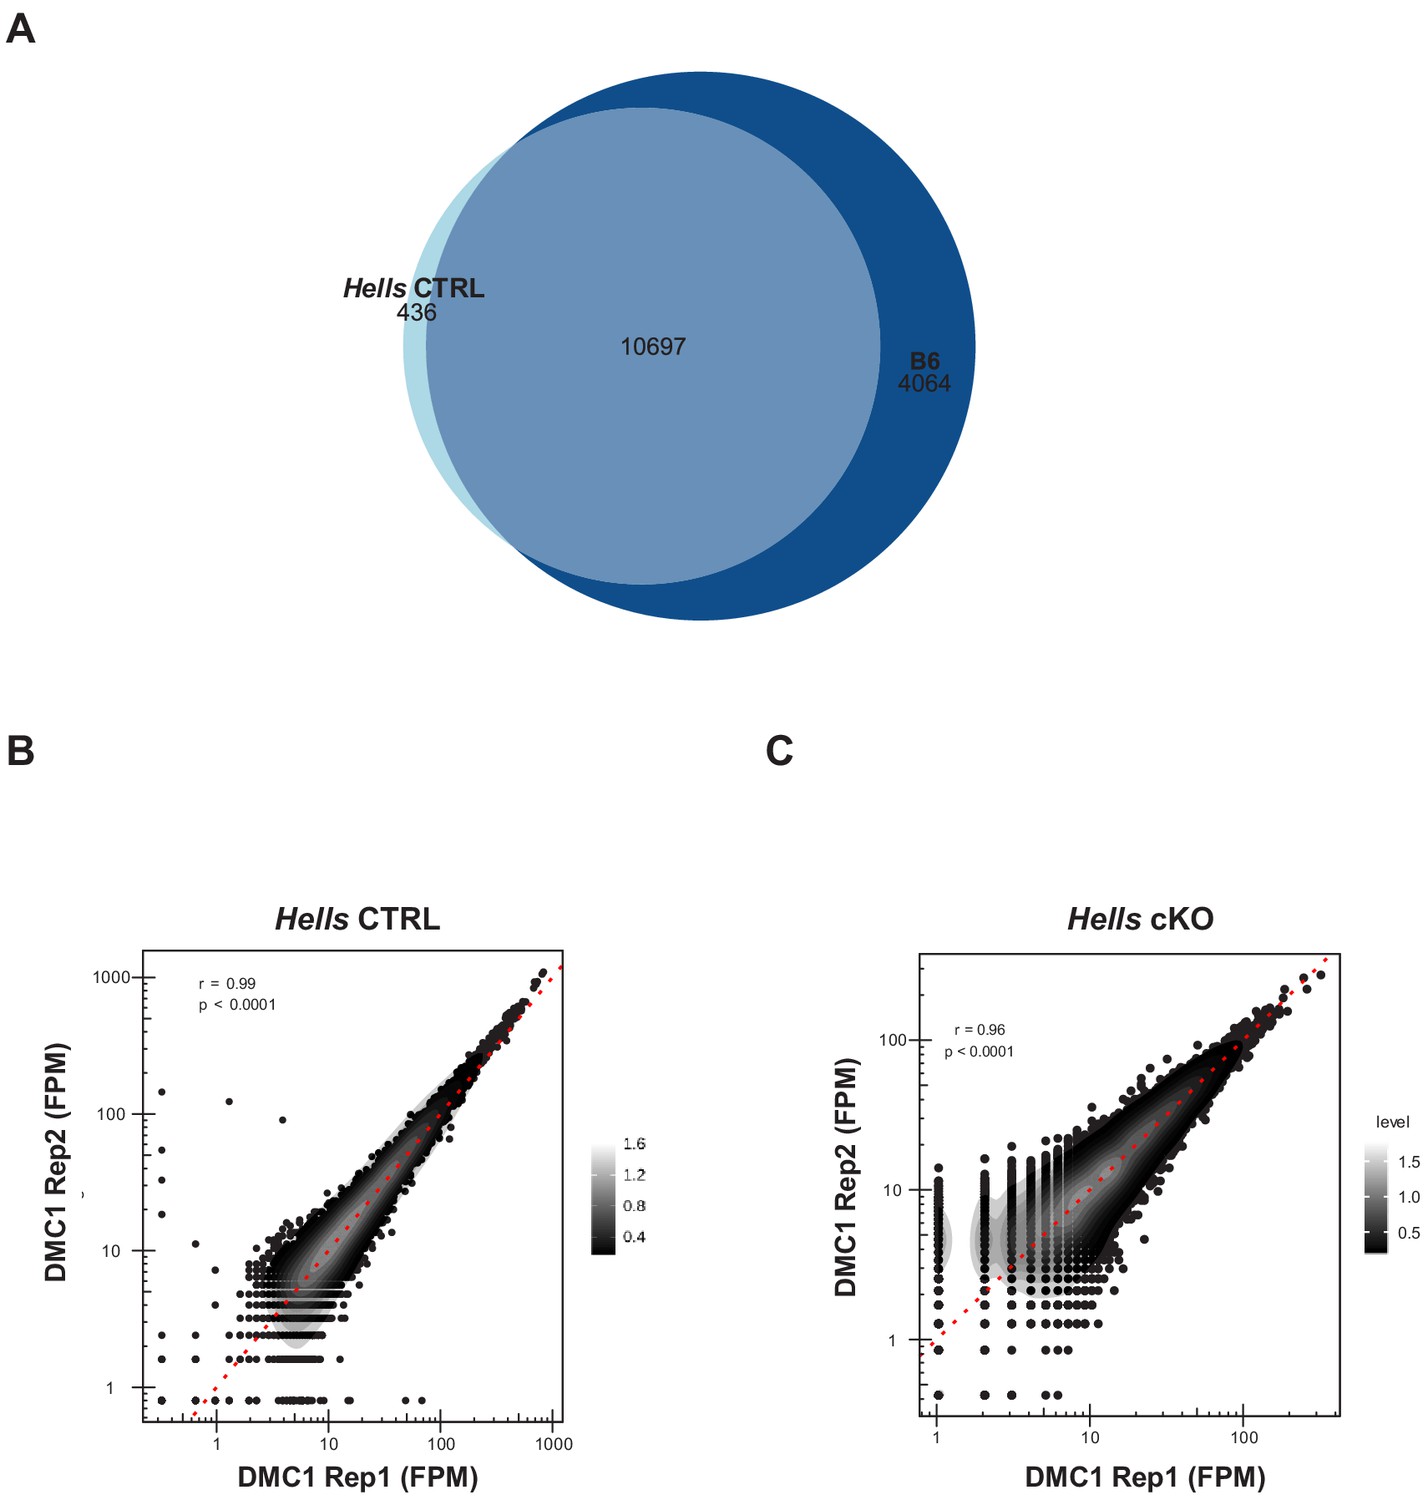
DMC1 ChIP-SSDS reproducibility and controls.
(A) The DSB map obtained using Hells CTRL testis samples reproduces the DSB map obtained using B6 testis samples. Hotspot (DMC1 ChIP-SSDS peaks) centers that overlapped within a 400bp-window were considered as common. The others were unique to Hells CTRL or B6. (B) Comparison of the DMC1 ChIP-SSDS signal distribution in Hells CTRL replicates. (C) Comparison of the DMC1 ChIP-SSDS signal distribution in Hells cKO replicates. (B–C) The red dotted line represents the x = y. The gray scale represents the density calculated with the density2d function from R. The correlation coefficient r is indicated with the significance level (p).
Figure 3—figure supplement 2
Common hotspots between Hells CTRL and Hells cKO testis samples.
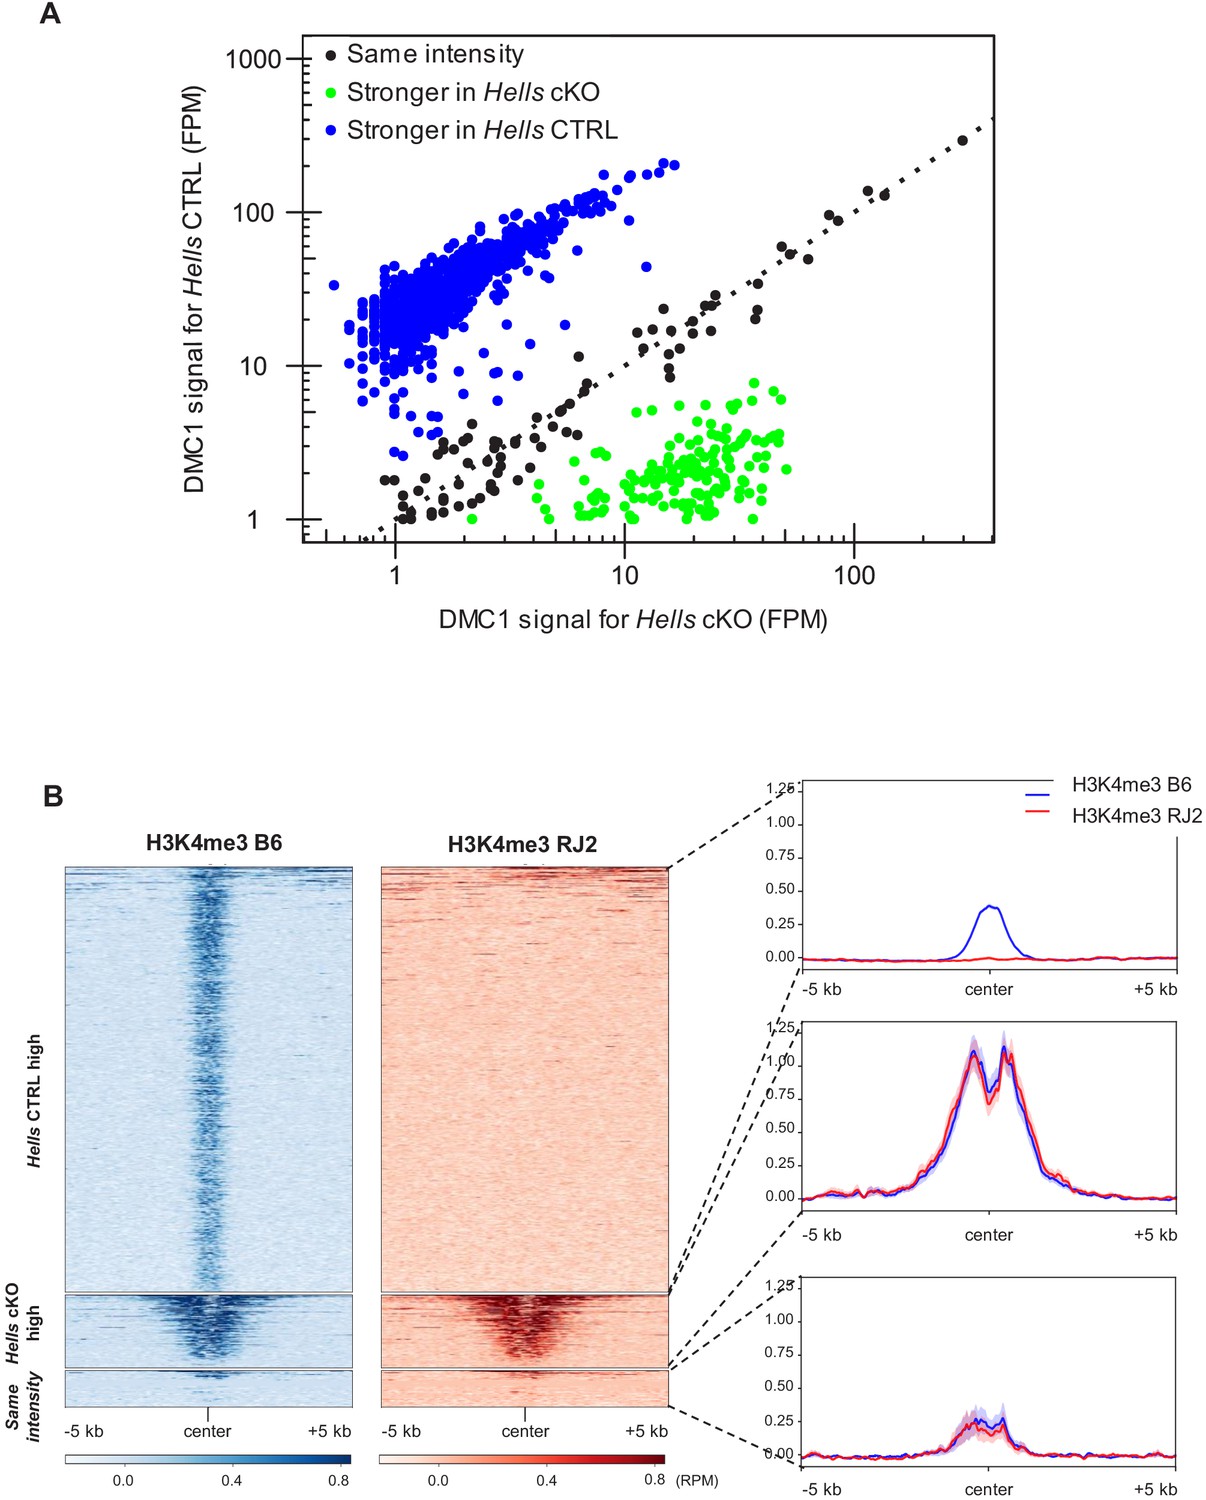
(A) Comparison of the DMC1 ChIP-SSDS signals in Hells CTRL and Hells cKO samples at the common hotspots (n = 1129), defined in Figure 3A. Three groups were identified: (i) hotspots in which the signal was stronger in Hells CTRL than in Hells cKO (log2(Hells CTRL/Hells cKO)>1) (blue dots) (n = 898 peaks); (ii) hotspots in which the signal was stronger in Hells cKO than in Hells CTRL (log2(Hells CTRL/Hells cKO)<-1) (green dots) (n = 154 peaks); and (iii) hotspots with comparable signal intensity in both genotypes (−1 < log2(Hells CTRL/Hells cKO)<1) (black dots) (n = 77 peaks). The black dotted line represents x = y. (B) H3K4me3 signal distribution in testis samples from the B6 (blue) and RJ2 (red) strains (GSE93955, Grey et al., 2017) around the three categories of common hotspots, as defined in (A). B6 carries a Dom2 allele of Prdm9 (like Hells CTRL and Hells cKO), whereas RJ2 carries the Cast allele. The heatmaps show a PRDM9-dependent H3K4me3 signal at the common hotspots with stronger signal in Hells CTRL (blue group from (A)), but not at the others.
Figure 4 with 2 supplements
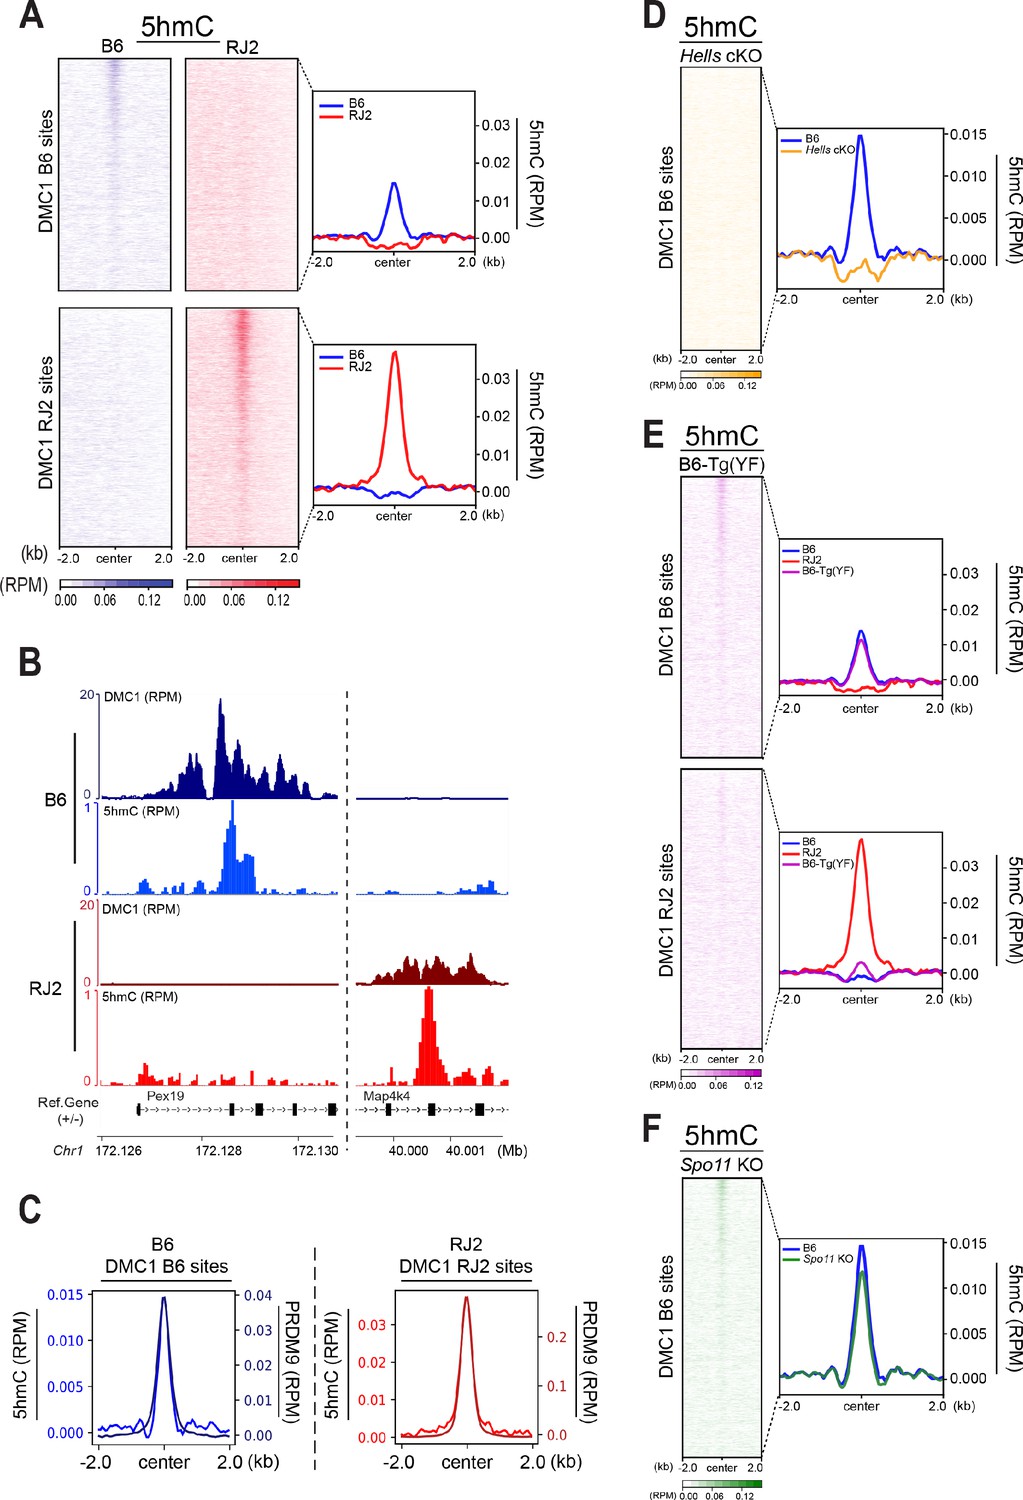
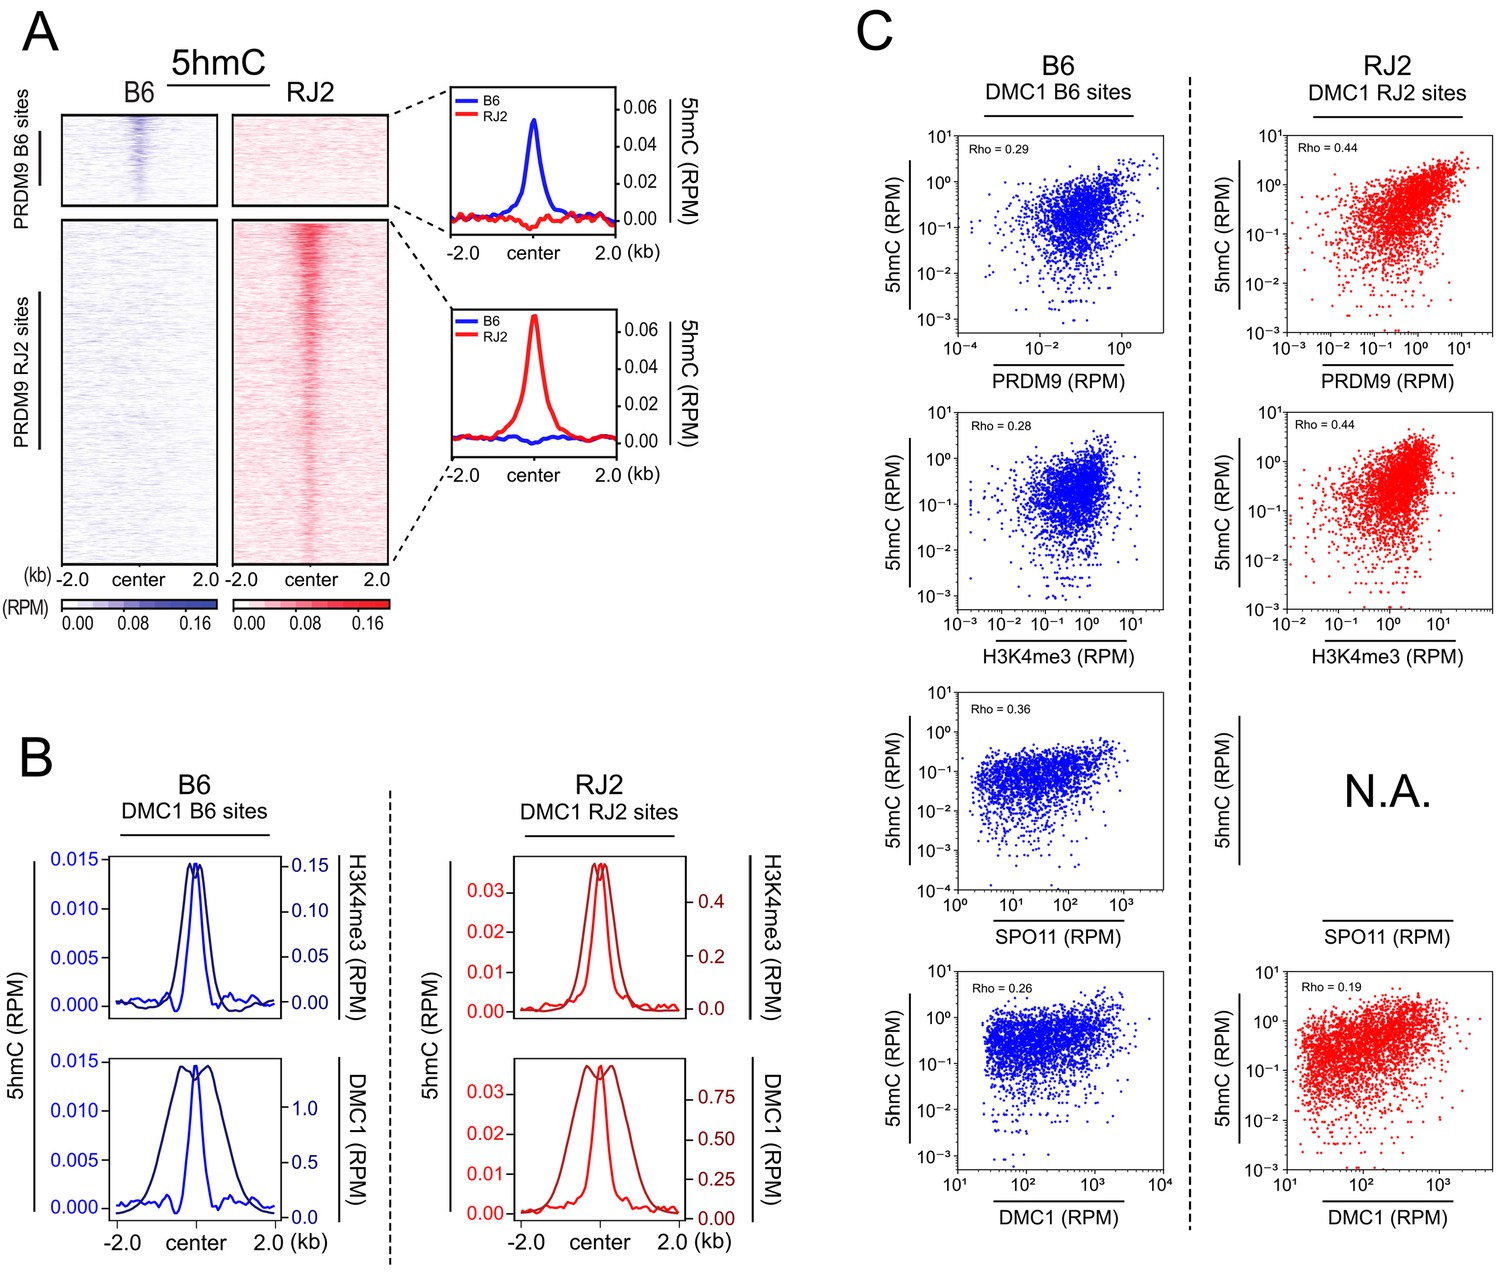
5hmC is enriched at PRDM9-dependent sites and correlates with PRDM9 occupancy.
(A) Average read enrichment and heatmaps showing 5hmC enrichment in the B6 (blue) and RJ2 (red) strains. Signal was calculated in a +/- 2 kb window around hotspot centers (determined by DMC1-SSDS). 5hmC enrichment was calculated from pooled replicates within 50bp bins and normalized by reads per million (RPM) and input. The sites on the heatmaps are ranked by decreasing DMC1-SSDS signal intensity from top to bottom. (B) Read distribution from DMC1 and 5hmC ChIP-seq experiments in the B6 (blue) and RJ2 (red) strains at representative DMC1 PRDM9Dom2 (B6) and PRDM9Cst (RJ2) specific sites on chromosome 1. Read distribution was calculated from pooled replicates within 50bp bins and normalized by library size and input, except for the DMC1 ChIP experiments. (C) Average read enrichment showing 5hmC enrichment (left y axis) and PRDM9 read enrichment (right y axis) in the B6 (blue) and RJ2 (red) strains centered in a +/- 2 kb window around DMC1 B6 and DMC1 RJ2 sites, respectively. Read distribution was calculated from pooled replicates within 50bp bins and normalized by library size and input. (D) 5hmC signal at hotspots is HELLS-dependent. Average read enrichment showing 5hmC in the B6 (blue) and Hells cKO (orange) strains centered in a +/- 2 kb window around the hotspot centers (DMC1-SSDS B6 sites). 5hmC enrichment was calculated from pooled replicates within 50bp bins and normalized by read per million (RPM) and input. (E) 5hmC signal at hotspots is dependent on PRDM9 methyltransferase activity. Average read enrichment showing 5hmC in the B6 (blue), RJ2 (red) and B6-Tg(YF)(magenta) strains centered in a +/- 2 kb window around the hotspot centers (DMC1-SSDS B6 and RJ2 sites). 5hmC enrichment was calculated from pooled replicates within 50bp bins and normalized by read per million (RPM) and input. (F) 5hmC signal at hotspots is independent of DSB formation. Average read enrichment showing 5hmC enrichment in the B6 (blue) and Spo11 KO (green) strain centered in a +/- 2 kb window around the hotspot centers (DMC1-SSDS B6 sites). 5hmC enrichment was calculated form pooled replicates within 50bp bins and normalized by read per million (RPM) and input. The duplicate analysis for all genotypes is shown in Figure 4—figure supplement 2.
Figure 4—figure supplement 1
Similar distributions of 5hmC and PRDM9 enrichments.
(A) Average read enrichment and heatmaps showing 5hmC enrichment in B6 (blue) and RJ2 (red) strains centered in a +/- 2 kb window around the PRDM9 B6 and RJ2 sites, respectively. 5hmC enrichment was calculated from pooled replicates within 50 bp bins and normalized by read per million and input. The sites on the heatmaps are ranked by decreasing PRDM9 signal intensity from top to bottom. (B) Average read enrichment showing 5hmC enrichment (left y axis) and H3K4me3 or DMC1 read enrichment (right y axis) in the B6 (blue) and RJ2 (red) strains centered in a +/- 2 kb window around the DMC1 B6 and DMC1 RJ2 sites, respectively. Read distribution was calculated from pooled replicates within 50 bp bins, and normalized by library size and input, except for the DMC1 ChIP experiments. (C) Top panels: Scatter plots of 5hmC enrichment versus PRDM9 and H3K4me3 enrichment in the B6 (blue) and RJ2 (red) strain at the DMC1 B6 and DMC1 RJ2 sites, respectively (only sites featuring the strongest 5hmC signals, containing at least 6 CpGs in a window within +/- 250 bp around hotspots were considered, see Figure 5 and Materials and methods). Read enrichment was calculated in a window within +/- 250 bp around hotspots (DMC1-SSDS) normalized by library size and input. Bottom panels: Scatter plot of 5hmC read enrichment versus SPO11-oligos peak strength (data available only for B6; Lange et al., 2016) and DMC1 peak strength. Rho is the Spearman correlation coefficient.
Figure 4—figure supplement 2
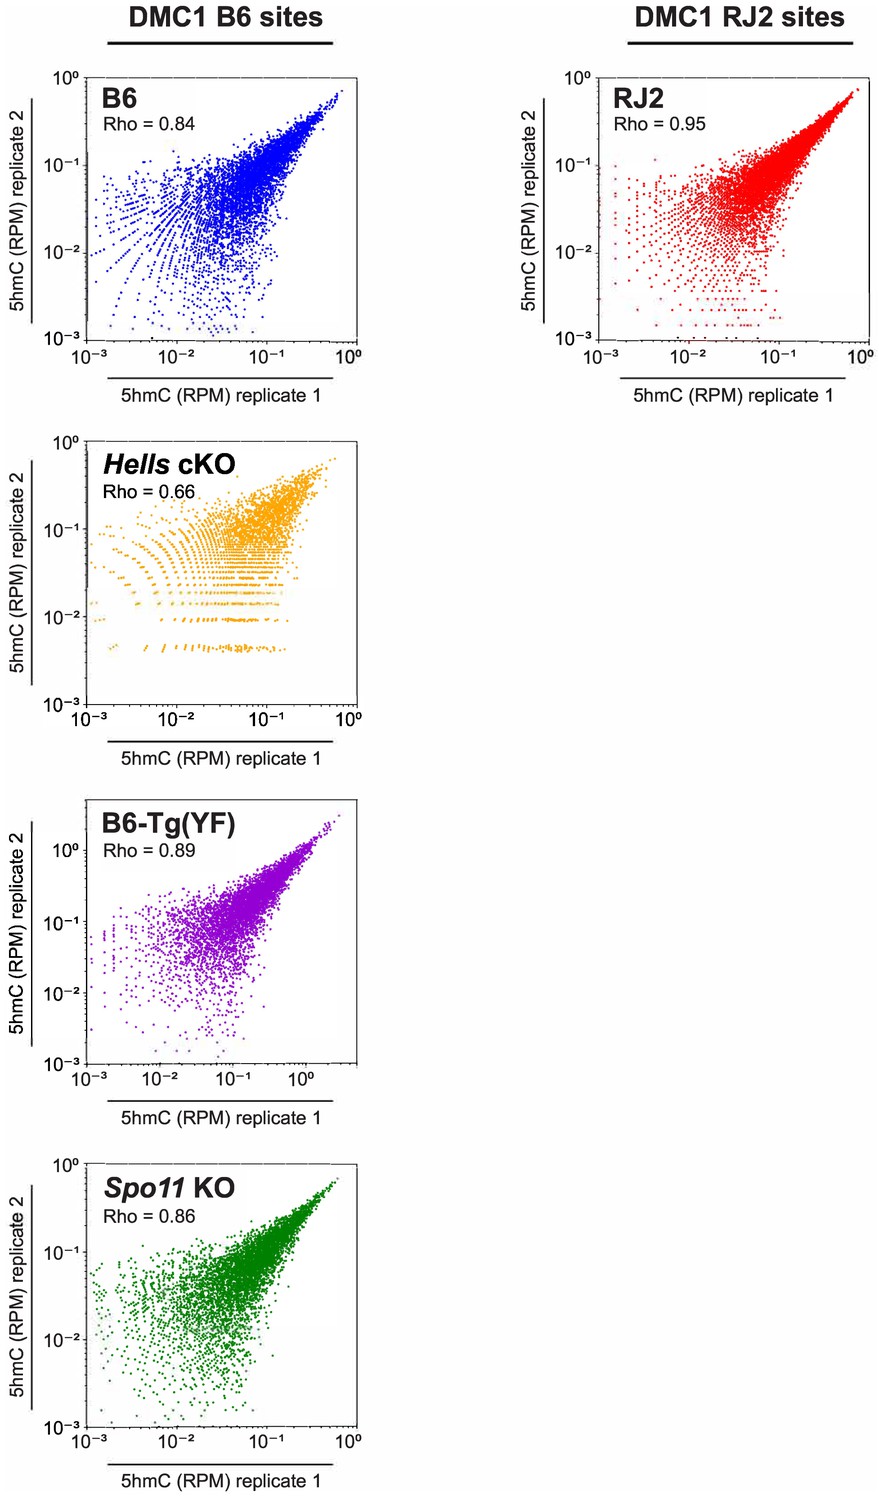
Reproducibility of 5hmC enrichment.
Reproducibility of 5hmC enrichment in B6, RJ2, Hells cKO, B6-Tg(YF), and Spo11 KO samples. Scatter plots of 5hmC read enrichment (RPM) in replicate 1 versus replicate 2. Blue: B6, Red: RJ2, Orange: Hells cKO, Purple: B6-Tg(YF), Green: Spo11 KO. Read enrichment was calculated in a +/- 250 bp window around the center of DMC1 sites normalized by library size and input. 5hmC enrichment was calculated at DMC1 B6 sites for the B6, Hells cKO and Spo11 KO strains, and at DMC1 RJ2 sites for the RJ2 strain.
Figure 5 with 1 supplement
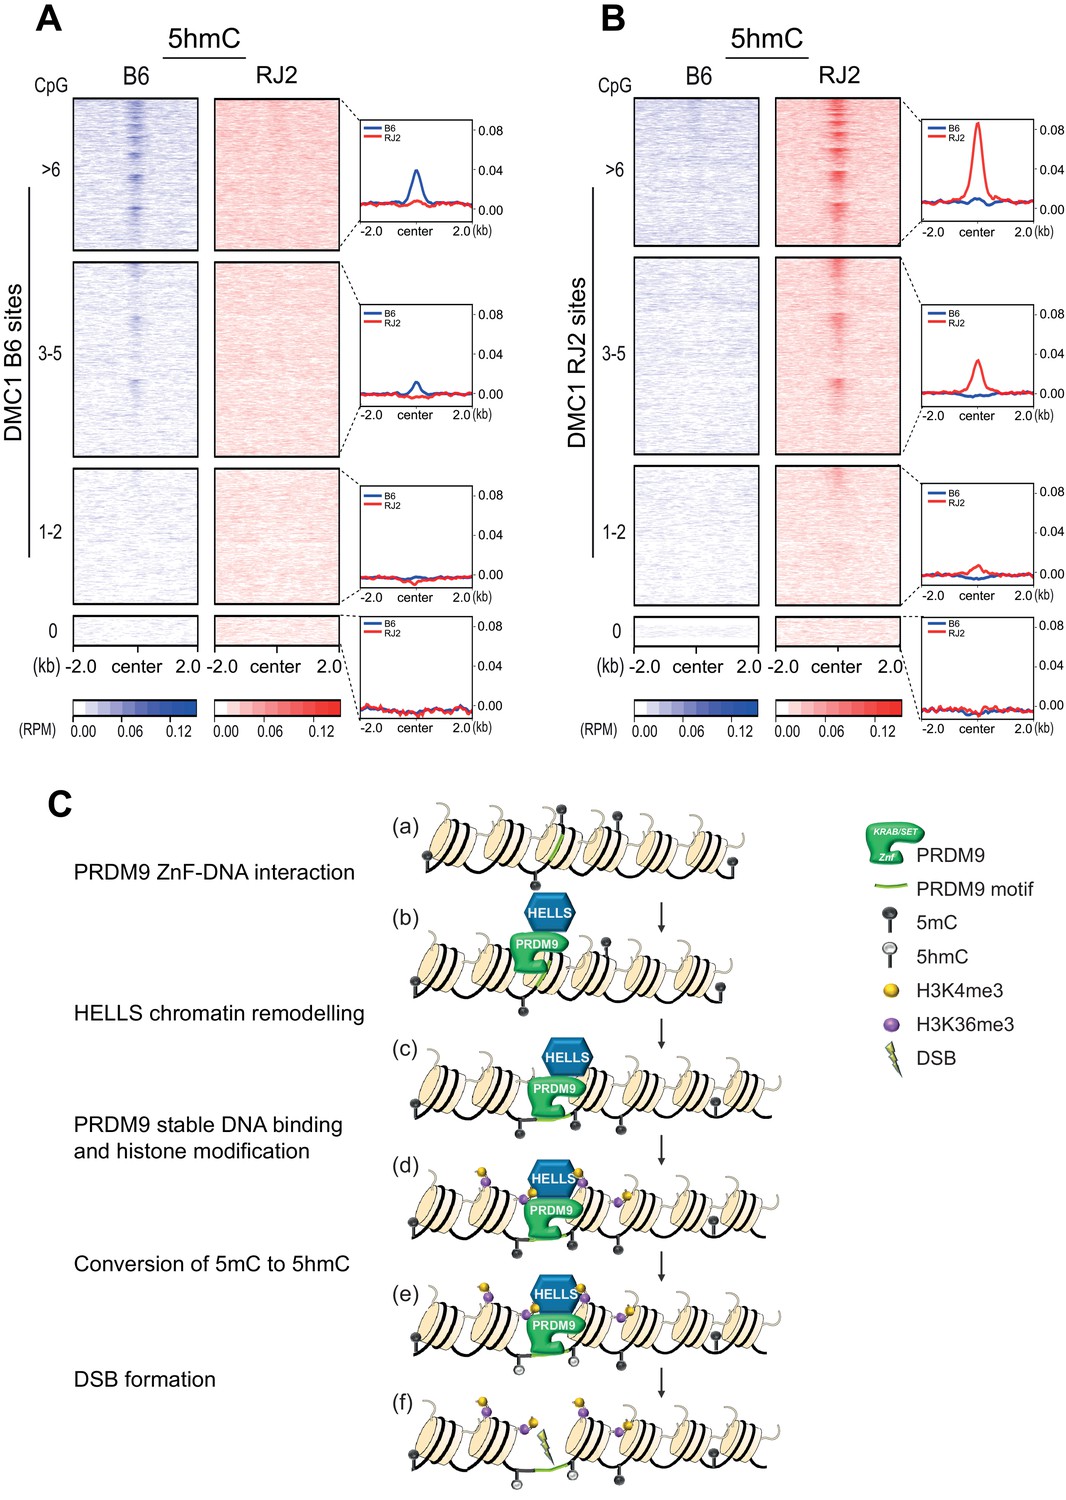
5hmC enrichment at DSB sites sorted by CpG content and model.
(A) Average read enrichment and heatmaps showing 5hmC enrichment at DMC1-SSDS B6 sites. (B) Average read enrichment and heatmaps showing 5hmC enrichment at DMC1-SSDS RJ2 sites. In both panels, the signal was calculated in the B6 (blue) and RJ2 (red) strain in a +/- 2 kb window around the hotspot centers (determined by DMC1-SSDS) and sorted by CpG content with hotspots clustered in four groups: hotspots without CpGs, and three groups of similar size containing increasing numbers of CpGs (1–2, 3–5, and at least 6 CpGs). The number of sites for each group is indicated in the Methods section. For a given CpG content, the sites are ranked by decreasing DMC1-SSDS signal intensity from top to bottom. CpG content was calculated in a +/- 250 bp window around the hotspot centers. The same analysis but at PRDM9 sites is shown in Figure 5—figure supplement 1C. (C) Model for the targeting of DSB activity by PRDM9/HELLS in mouse male meiosis. (a) A potential PRDM9-binding site is a specific DNA motif in a region of chromatin with no specific feature. For each nucleosome, only two histone tails (H3) are shown. (b) The zinc-finger domain of PRDM9 (ZnF) interacts with specific DNA motifs. PRDM9 may be interacting as a complex with HELLS before binding to its target sites as suggested by Spruce et al., 2020. (c) HELLS promotes chromatin remodeling, enhancing accessibility of PRDM9 to its DNA motif and a stable interaction. (d) PRDM9 methyltransferase catalyzes H3K4me3 and H3K36me3 on adjacent nucleosomes. These histone modifications may or not be symmetric (Lange et al., 2016). H3K9Ac is also known to be enriched near PRDM9 -binding site at this stage (not shown). (e) Putative methylated cytosines (5mC) near the PRDM9-binding site are converted to 5hmC, suggesting the recruitment of a TET enzyme. (f) DSB forms at or adjacent to the PRDM9-binding site.
Figure 5—figure supplement 1
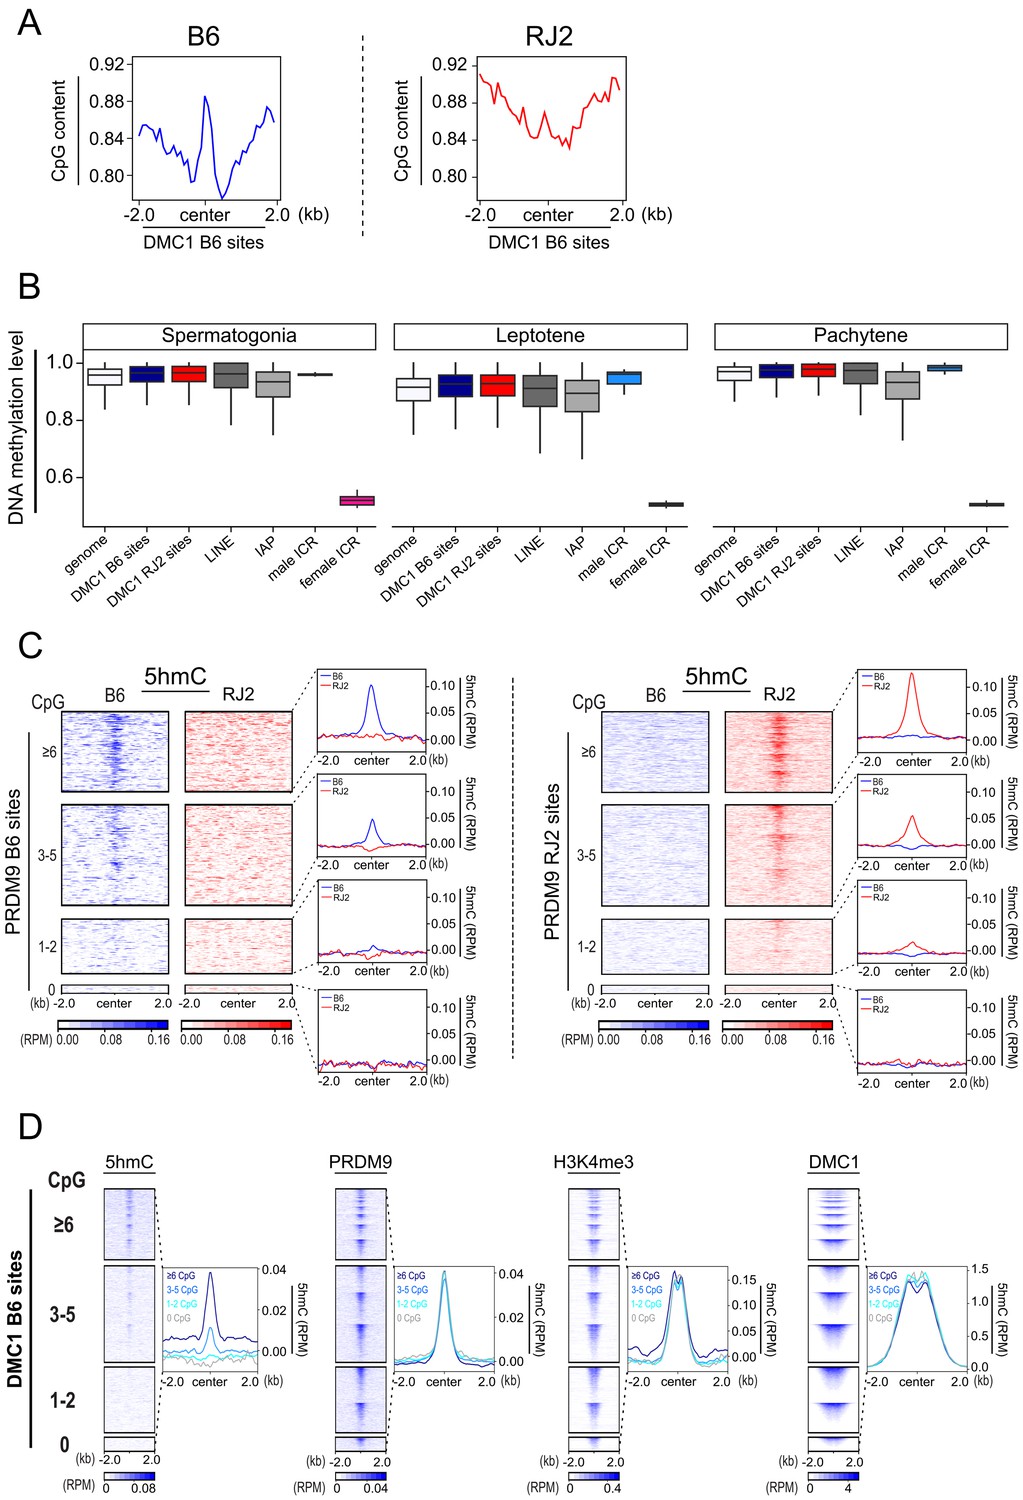
CpG content and 5hmC at meiotic hotspots.
(A) Average plot of CpG content in 100bp bins centered in a +/- 2 kb window around the DMC1 B6 and DMC1 RJ2 sites. (B) Boxplot of cytosine methylation level in the B6 mouse strain at different genomic sites. Boxes show the interquartile range (IQR; the middle 50% of scores) extending from the lower quartile (Q1; 25% of scores fall below this value) to the upper quartile (Q3; 25% of scores fall above this value). Black horizontal lines within boxes show median values. Upper and lower whiskers represent scores outside of IQR. Maximum and minimum scores show highest or lowest scores excluding outliers. DSB sites (B6 (PRDM9Dom2): blue, and RJ (PRDM9Cast): red), LINE (dark gray), IAP (gray), male imprinted control regions (light blue), female imprinted control regions (pink). Genome average (white). Only regions containing at least one CpG and one informative read were considered. (C) Average read enrichment and heatmaps showing 5hmC enrichment in the B6 (blue) and RJ2 (red) strains centered in a +/- 2 kb window around the PRDM9 B6 and RJ2 sites sorted by CpG content. CpG content was calculated within a window of +/- 250bp from the center of the PRDM9 sites. For a given CpG content, the sites on the heatmaps are ranked by decreasing PRDM9 signal intensity from top to bottom. (D) Average plots and heat maps of 5hmC, PRDM9, H3K4me3, H3K36me3 and DMC1 centered in a +/- 2 kb window around DMC1 B6 sites, sorted by CpG content. For a given CpG content, the sites on the heatmaps are ranked by decreasing PRDM9, H3K4me3, H3K36me3 and DMC1 signal intensity, from top to bottom.
Author response image 1

Author response image 2
Tables
Table 1
HELLS is co-immunoprecipitated with PRDM9.
Two independent immunoprecipitation experiments were performed using HeLa cells and mouse testis extracts. In the first experiment, HeLa S3 cells that express N-terminally (Nter) or C-terminally (Cter) tagged human PRDM9 or without PRDM9 expression vector (no PRDM9) were used to identify proteins that interacts with PRDM9 after size selection (95–120 kD and 70–80 kD), and without size selection. Mouse testis extracts were prepared without (rep1) or after incubation with benzonase (rep2) (in duplicate). IP were performed with an anti-PRDM9 antibody or with normal rabbit serum (mock). For each protein (PRDM9 and HELLS), the total number of peptides, the protein rank in the whole set of proteins with at least one peptide, and ranked by number of peptides, and the sequence coverage are indicated; na: not applicable. For mouse testis extracts, the rank difference of the label free quantification intensity (LFQ) between IPs with anti-PRDM9 and mock are indicated. The full list of the identified peptides is in Supplementary file 1. Extracts analysis by electrophoresis are presented in Table 1—source data 1.
| IP | Total peptides PRDM9 | Rank PRDM9 | Sequence coverage PRDM9 (%) | Total peptides HELLS | Rank HELLS | Sequence coverage HELLS (%) |
|---|---|---|---|---|---|---|
| HeLa with size selection | ||||||
| HeLa PRDM9 Nter 95–120 KD 70–80 KD | 0 7 | na 1/21 | na 6.4 | 11 0 | 1/16 na | 11.9 na |
| HeLa PRDM9 Cter 95–120 KD 70–80 KD | 0 7 | na 3/34 | na 7.3 | 4 0 | 2/32 na | 4.4 na |
| HeLa no PRDM9 95–120 KD 70–80 KD | 0 0 | na | na | 0 0 | na | na |
| HeLa without size selection | ||||||
| HeLa PRDM9 Nter | 38 | 6/447 | 29.4 | 97 | 1/447 | 48.1 |
| HeLa PRDM9 Cter | 35 | 4/364 | 33.7 | 44 | 1/364 | 37.6 |
| HeLa no PRDM9 | 0 | na | na | 0 | na | na |
| Mouse testis rep1 | ||||||
| IP PRDM9 | 24 | 27/571 | 35.1 | 14 | 75/571 | 24.1 |
| mock | 1 | 538/571 | 1.2 | 6 | 211/571 | 9.3 |
| LFQ Rank difference | 441 | 113 | ||||
| Mouse testis rep2 (+benzonase) | ||||||
| IP PRDM9 | 14 15 | 39/890 41/948 | 26.3 | 6 7 | 187/890 178/948 | 11 |
| mock | 1 0 | 782/890 na | 1.4 | 5 1 | 323/890 506/948 | 7.2 |
| LFQ Rank difference | 870 688 | 122 468 |
-
Table 1—source data 1
Purification of protein complexes.
(A) Western blot analysis after complex purification by Flag-HA of extracts from HeLa S3 cells. HeLa S3 cells without PRDM9 expression vector, or expressing human PRDM9 tagged with Flag-HA at the C-terminus (PRDM9-Ct) or N-terminus (PRDM9-Nt) were used. Protein fractions of the extracts before IP (S1: cytoplasmic fraction, S2: nuclear fraction as input for IPs, ppt: insoluble pellet) and after the affinity purification steps were analyzed by western blotting using an anti-PRDM9 antibody. (B) Analysis of affinity-purified proteins after silver staining (sample without size selection). Eluates 1, 2 and resin fractions obtained from affinity purification (HA) of extracts initially prepared from HeLa S3 cells without PRDM9 expression vector (M), or expressing human PRDM9 tagged with Flag-HA at the C-terminus (Ct) or at the N-terminus (Nt) were separated by electrophoresis and silver stained. Mixtures of Eluate 1 and 2 were used for mass spectrometry analysis. (C) Western blot analysis of complex purification using an anti-PRDM9 antibody and mouse testes extracts (Mouse testis rep1). Protein extracts obtained during the Dignam-based purification (S1: cytoplasmic fraction, S2: nuclear fraction, S3: DNase-treated, and ppt: pellet) were loaded. Input (S2), unbound (UB), and proteins immunoprecipitated (IP) with an anti-PRDM9 antibody or normal rabbit serum (mock) were analyzed by western blotting. Detection was with an anti-PRDM9 antibody. Loading: 1 and 10% of input and IP samples, respectively. (D) Analysis of affinity-purified proteins by silver staining (Mouse testis rep1). Input, and samples IP with an anti-PRDM9 antibody or with normal rabbit serum (mock) were loaded. Bovine serum albumin (BSA) was used as control. Proteins were separated by electrophoresis and silver stained. (E) Western blot analysis of complex purification using an anti-PRDM9 antibody in extracts from mouse testes incubated with benzonase (Mouse testis rep 2), in duplicate (a and b). Protein extracts obtained during the Dignam-based purification steps (S1: cytoplasmic fraction, S2: nuclear fraction, S3: DNase-treated, and ppt: pellet) were loaded. Input (S2) and proteins IP with an anti-PRDM9 antibody or rabbit serum (mock) were analyzed by western blotting. Detection was with an anti-PRDM9 antibody. Loading: 1% and 10% of input and IP samples. (F) Analysis of affinity purified proteins by silver staining (Mouse testis rep2). Input, and samples IP with an anti-PRDM9 antibody or with normal rabbit serum (mock) were loaded. BSA was used as control. Proteins were separated by electrophoresis and stained with silver.
- https://cdn.elifesciences.org/articles/57117/elife-57117-table1-data1-v2.pdf
Key resources table
| Reagent type (species) or resource | Designation | Source or reference | Identifiers | Additional information | |
|---|---|---|---|---|---|
| Mouse strains | |||||
| C57BL/6JOlaHsd | Envigo | C57BL/6JOlaHsd | Named B6 | ||
| B10.MOLSGR(A)-(D17Mit58-D17Jcs11)/Bdm (RJ2) | Grey et al., 2009 | MGI:5319075 | Named RJ2 | ||
| B6;129P2 < Prdm9tm1Ymat>/J | Hayashi et al., 2005 | MGI:3624989 | Named Prdm9 KO | ||
| Spo11 < tm1Mjn> | Baudat et al., 2000 | MGI:2178805 | Named Spo11 KO | ||
| Hells < tm1a(EUCOMM)Wtsi/Ieg> | EUCOM Bradley et al., 2012 | MGI:4431905 | |||
| C57BL/6 Tg(CAG-Flpo)1Afst | Kranz et al., 2010 | MGI:4453967 | |||
| C57BL/6 Tg(CMV-cre)1Cgn | Schwenk et al., 1995 | MGI:2176180 | |||
| Tg(Stra8-icre)1Reb/J <(Stra8-iCre)> | Sadate-Ngatchou et al., 2008 | MGI:3779079 | |||
| Tg(RP23-159N6*)23Bdm | Diagouraga et al., 2018 | MGI:5565212 | Named B6-Tg(YF) | ||
| Cell lines | |||||
| HeLa | ATCC | HeLa S3 ATCC CCL-2.2 | |||
| Yeast strains | |||||
| AH109 | James et al., 1996 | S. cerevisiae | |||
| Y187 | Harper et al., 1993 | S. cerevisiae | |||
| Recombinant DNA reagents | |||||
| PRDM9A-Flag-HA-Nt into retroviral pOZ-FH-N vector | This study | N/A | Vector from Addgene DB3781 | ||
| PRDM9A-Flag-HA-Ct into retroviral pOZ-FH-C vector | This study | N/A | Vector from Addgene cat# 32516 | ||
| pGAD GH for fusion to Gal4 activation domain, modified for Gateway cloning | Van Aelst et al., 1993 | Clontech No. 638853 | LEU2 marker | ||
| pAS2dd for fusion to Gal4 DNA-binding domain, modified for Gateway cloning | Fromont-Racine et al., 1997 | TRP1 marker | |||
| pB29 for PRDM9 (aa 1–511) expression fused to LexA for yeast two-hybrid screen | Hybrigenics | ||||
| Antibodies | |||||
| Guinea-pig anti-SYCP3 | Grey et al., 2009 | N/A | Home-made WB: 1/2000 IF: 1/500 | ||
| Rabbit anti-SYCP1 | Abcam | Cat# ab15090 RRID:AB_301636 | IF: 1/400 | ||
| Rabbit anti-DMC1 | Santa Cruz | Cat# scH100 RRID:AB_2277191 | IF: 1/200 | ||
| Goat anti-DMC1 | Santa Cruz | Cat# scC20 RRID:AB_2091206 | ChIP: 24 µg | ||
| Rabbit anti-HELLS | Novus | Cat# NB 100–278 RRID:AB_350198 | WB: 1/2000 IF: 1/200 | ||
| Mouse monoclonal anti-HELLS | Santa Cruz | Cat# sc46665 RRID:AB_627895 | IF: 1/100 | ||
| Mouse monoclonal anti-phospho-histone H2AFX (Ser139) | Millipore | Cat# MP05-636 RRID:AB_309864 | Named γH2AFX IF: 1/10000 | ||
| Rabbit anti-Gal4 activation domain (GAD) (Millipore, 06–283) | Now at Sigma-Aldrich Cat# ABE476 | WB: 1/3000 | |||
| Rabbit anti-Gal4 DNA-Binding domain | Sigma–Aldrich | Cat# G3042 RRID:AB_439688 | WB: 1/2000 | ||
| Rat monoclonal anti-Tubulin [YOL1/34] | Abcam | Cat# ab 6161 RRID:AB_305329 | WB: 1/3000 | ||
| Rabbit anti-5hmC | Active Motif | Cat# AM 39791 RRID:AB_2630381 | hMeDIP: 5 µg | ||
| Rabbit anti-PRDM9 | Grey et al., 2017 | N/A | Home-made WB: 1/2000 IF: 1/200 ChIP: 4 µg | ||
| Rabbit anti-H3K4me3 | Abcam | ab8580 RRID:AB_306649 | ChIP: 4 µg | ||
| Goat anti-rabbit IgG-HRP | Pierce | Cat# 1858415 RRID:AB_1185567 | WB: 1/10000 | ||
| Goat anti-Guinea-pig IgG-HRP | Jackson Immuno Research | Cat# 706-035-148 RRID:AB_2340447 | WB: 1/3000 | ||
| Goat anti-rabbit IgG-Alexa 555 | Thermo Fisher Scientific | Cat# ab150078 RRID:AB_2535849 | IF: 1/400 | ||
| Goat anti-guinea-pig IgG-Alexa 488 | Thermo Fisher Scientific | Cat# ab150185 RRID:AB_2534117 | IF: 1/400 | ||
| Donkey anti-mouse IgG-Alexa 680 | Thermo Fisher Scientific | Cat# ab175774 RRID:AB_2534014 | IF: 1/100 | ||
| Donkey anti-mouse IgG-Alexa 647 | Thermo Fisher Scientific | Cat# ab150107 RRID:AB_162542 | IF: 1/400 | ||
| Oligonucleotides | |||||
| Genotyping Hells cKO mice, see Supplementary file 2 | This study | ||||
| RT-qPCR, see Supplementary file 3 | This study, Buard et al., 2009, Diagouraga et al., 2018 | N/A | |||
| Commercial assays or kits | |||||
| DeadEnd Fluorometric TUNEL System | Promega | Cat# G3250 | |||
| Anti-HA beads | Santa Cruz | Cat# sc-500773 | |||
| EZview anti-FLAG M2 Affinity Gel | Sigma–Aldrich | Cat# F2426 | |||
| hMeDIP Kit | Actif Motif | Cat# AM55010 | |||
| NEB Next Ultra Library Preparation Kit | New England Biolabs | Cat# NEB7370S | |||
| ChIP-IT High Sensitivity Kit | Actif Motif | Cat# AM53040 | |||
| MMLV-based retroviral transduction system | Nakatani and Ogryzko, 2003 | N/A | |||
| Chemical compounds | |||||
| HA peptide | Covance | Cat #PEP-101P-1000 | |||
| FLAG peptide | Sigma | Cat #F4799 | |||
| Optiprep Idoixanol | Sigma–Aldrich | Cat# D1556 | |||
| Sytox Green | Thermo Fisher Scientific | Cat# S70020 | |||
| WIN 18466 | Tocris Bioscience | Cat# 4736 | Hogarth et al., 2013 | ||
| Retinoic Acid | Sigma–Aldrich | Cat# R2625 | |||
| Deposited data | |||||
| Mass spectrometry proteomics | ProteomeXchange Consortium | Dataset identifier PXD017337 | |||
| NGS SSDS ChIP (DMC1) and hMeDIP | GEO | GSE145768 | |||
| Softwares and Algorithms | |||||
| Bowtie 2 | http://bowtie-bio.sourceforge.net/bowtie2/index.shtml | ||||
| Modified BWA algorithm | Khil et al., 2012 | N/A | |||
| Tim Galore! | https://www.bioinformatics.babraham.ac.uk/projects/trim_galore/ | ||||
| Bismark | https://www.bioinformatics.babraham.ac.uk/projects/bismark/ | ||||
| Bedtools suite | https://bedtools.readthedocs.io/en/latest/content/bedtools-suite.html | ||||
Additional files
-
Supplementary file 1
List of all the proteins identified by mass spectrometry after purification of protein complexes by immunoprecipitation of PRDM9.
Proteins are displayed in four separate sheets: HeLa S3 cell extracts with size selection. Six samples: two from Hela S3 cells that express N-terminally tagged (Nter1 and Nter2) PRDM9, two that express C-terminally tagged (Cter1 and Cter2) PRDM9, and two that do not express PRDM9 (no PRDM9). HeLa S3 cell extracts without size selection. Three samples from Hela S3 cells that express N-terminally tagged (Nter) PRDM9, C-terminally tagged (Cter) PRDM9, or that do not express PRDM9 (no PRDM9). Mouse testis rep1. Two samples from the IP with the anti-PRDM9 antibody and with rabbit serum (mock). Mouse testis rep2. Four samples: two from the IP with the anti-PRDM9 antibody (PRDM9-1 and PRDM9-2) and two with rabbit serum (mock-1 and mock-2). Proteins are ranked by peptide counts after the PRDM9 IP. Additional quantifications were performed in the mouse testis samples. These include MS/MS count, iBAQ, iBAQ rank difference between PRDM9 IP and mock, LFQ intensity and LFQ intensity rank difference between PRDM9 IP and mock.
- https://cdn.elifesciences.org/articles/57117/elife-57117-supp1-v2.xlsx
-
Supplementary file 2
Sequences of the primers used for genotyping.
- https://cdn.elifesciences.org/articles/57117/elife-57117-supp2-v2.docx
-
Supplementary file 3
Sequences of the primers used for qPCR.
- https://cdn.elifesciences.org/articles/57117/elife-57117-supp3-v2.docx
-
Transparent reporting form
- https://cdn.elifesciences.org/articles/57117/elife-57117-transrepform-v2.docx
Download links
A two-part list of links to download the article, or parts of the article, in various formats.
Downloads (link to download the article as PDF)
Open citations (links to open the citations from this article in various online reference manager services)
Cite this article (links to download the citations from this article in formats compatible with various reference manager tools)
PRDM9 activity depends on HELLS and promotes local 5-hydroxymethylcytosine enrichment
eLife 9:e57117.
https://doi.org/10.7554/eLife.57117


