Estrogen exacerbates mammary involution through neutrophil-dependent and -independent mechanism
- NTU Institute for Health Technologies, Interdisciplinary Graduate School, Nanyang Technological University, Singapore
- School of Biological Sciences, Nanyang Technological University, Singapore
- Division of Chemistry and Biological Chemistry, School of Physical and Mathematical Sciences, Nanyang Technological University, Singapore
- School of Basic and Applied Sciences, Dayananda Sagar University, India
- School of Computer Science and Engineering, Nanyang Technological University, Singapore
Figures
Figure 1 with 1 supplement
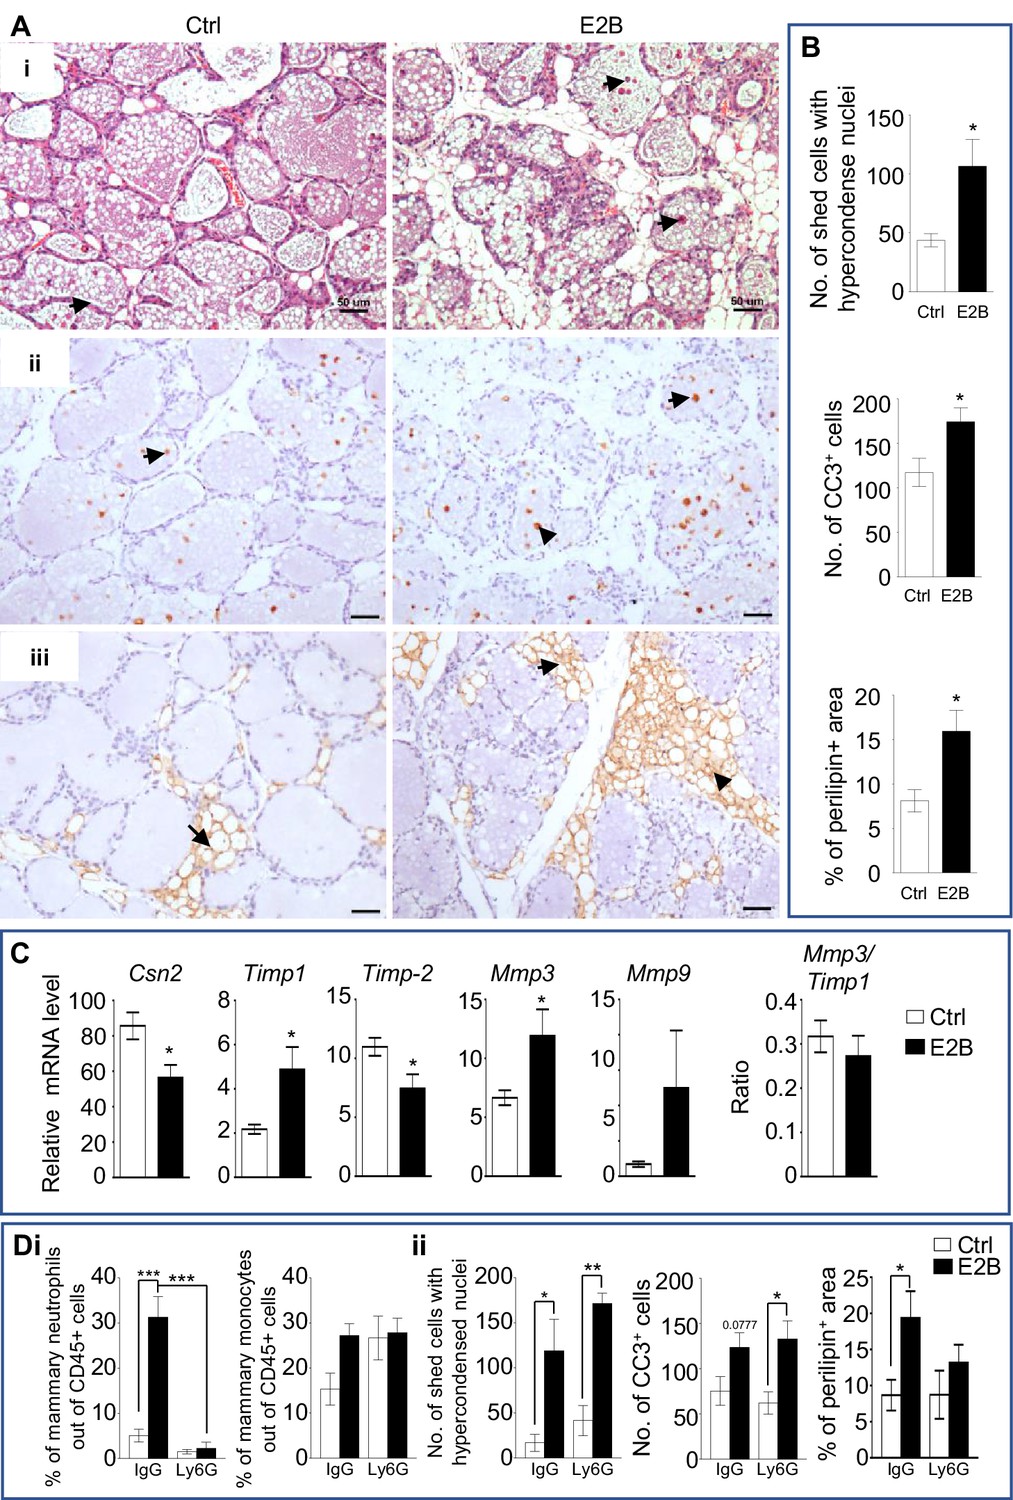
Estrogen accelerates mammary involution.
(A-C) Mice on the day of weaning (involution day 1-INV D1) were treated with vehicle control (Ctrl) or E2B for 48 hr before mammary tissues were collected for analysis; (A) (i) H and E stained mammary tissue sections; shed cells with hyper-condensed nuclei are indicated by arrows; (ii) IHC of cleaved caspase-3 (CC3); arrows indicate CC3+ cells; (iii) Perilipin IHC; arrows indicate perilipin+ adipocytes; Scale bars: 50 µm; (B) The number of shed cells with hyper-condensed nuclei in the lumens of H and E sections is based on the total of 5 random field per mouse (Ctrl n = 9, E2B n = 8); the number of CC3+ cells is based on the average of CC3+ cells of 5 random field per mouse (Ctrl n = 7, E2B n = 6); adipocytes repopulation is based on the percentage of perilipin stained area of the total section (Ctrl n = 7, E2B n = 8); (C) Gene expression of Csn2 and tissue remodelling enzymes Timp1, Timp2, Mmp3, and Mmp9 relative to Rplp0 by qPCR analysis (Ctrl n = 7, E2B n = 6). (D) Mice at INV D1 was treated with anti-Ly6G antibody (Ly6G) or isotype control (IgG). 6 hr later, they were treated with vehicle control (Ctrl) or E2B for 48 hr; Di, E2B treatment in mice given IgG significantly increased the percentage of mammary neutrophils by 9-folds which was abolished by neutrophil depletion with Ly6G; Percentage of mammary neutrophils (CD45+ CD11b+ Gr1+ F4/80-) and monocytes (CD45+ CD11b+ Ly6Chi) out of live CD45+ population; Dii, Neutrophil depletion had no effect on cell shedding and number of Cc3+ cells, but attenuated estrogen-induced adipocytes repopulation (Ctrl+IgG n = 4, E2B+IgG n = 4, Ctrl+Ly6G n = 3, E2B+Ly6G, n = 3). Data represented as mean ± SEM.
Figure 1—figure supplement 1

Effect of neutrophil depletion on estrogen-induced cell death and adipocytes repopulation.
Mice at INV D1 were administered with isotype control (IgG) or anti-neutrophil antibody (Ly6G) and treated with Ctrl or E2B for 48h. (A) Neutrophil depletion attenuates E2B-induced adipocyte repopulation but did not affect the E2B-stimulated cell death in involuting mammary gland; (i) H&E stained mammary tissue sections; shed cells with hyper-condensed nuclei are indicated by arrows. (ii) IHC of cleaved caspase-3 (CC3); arrows indicate CC3+ cells. (iii) Perilipin IHC; arrows indicate perilipin+ adipocytes. Scale bars: 50µm.
Figure 2 with 1 supplement
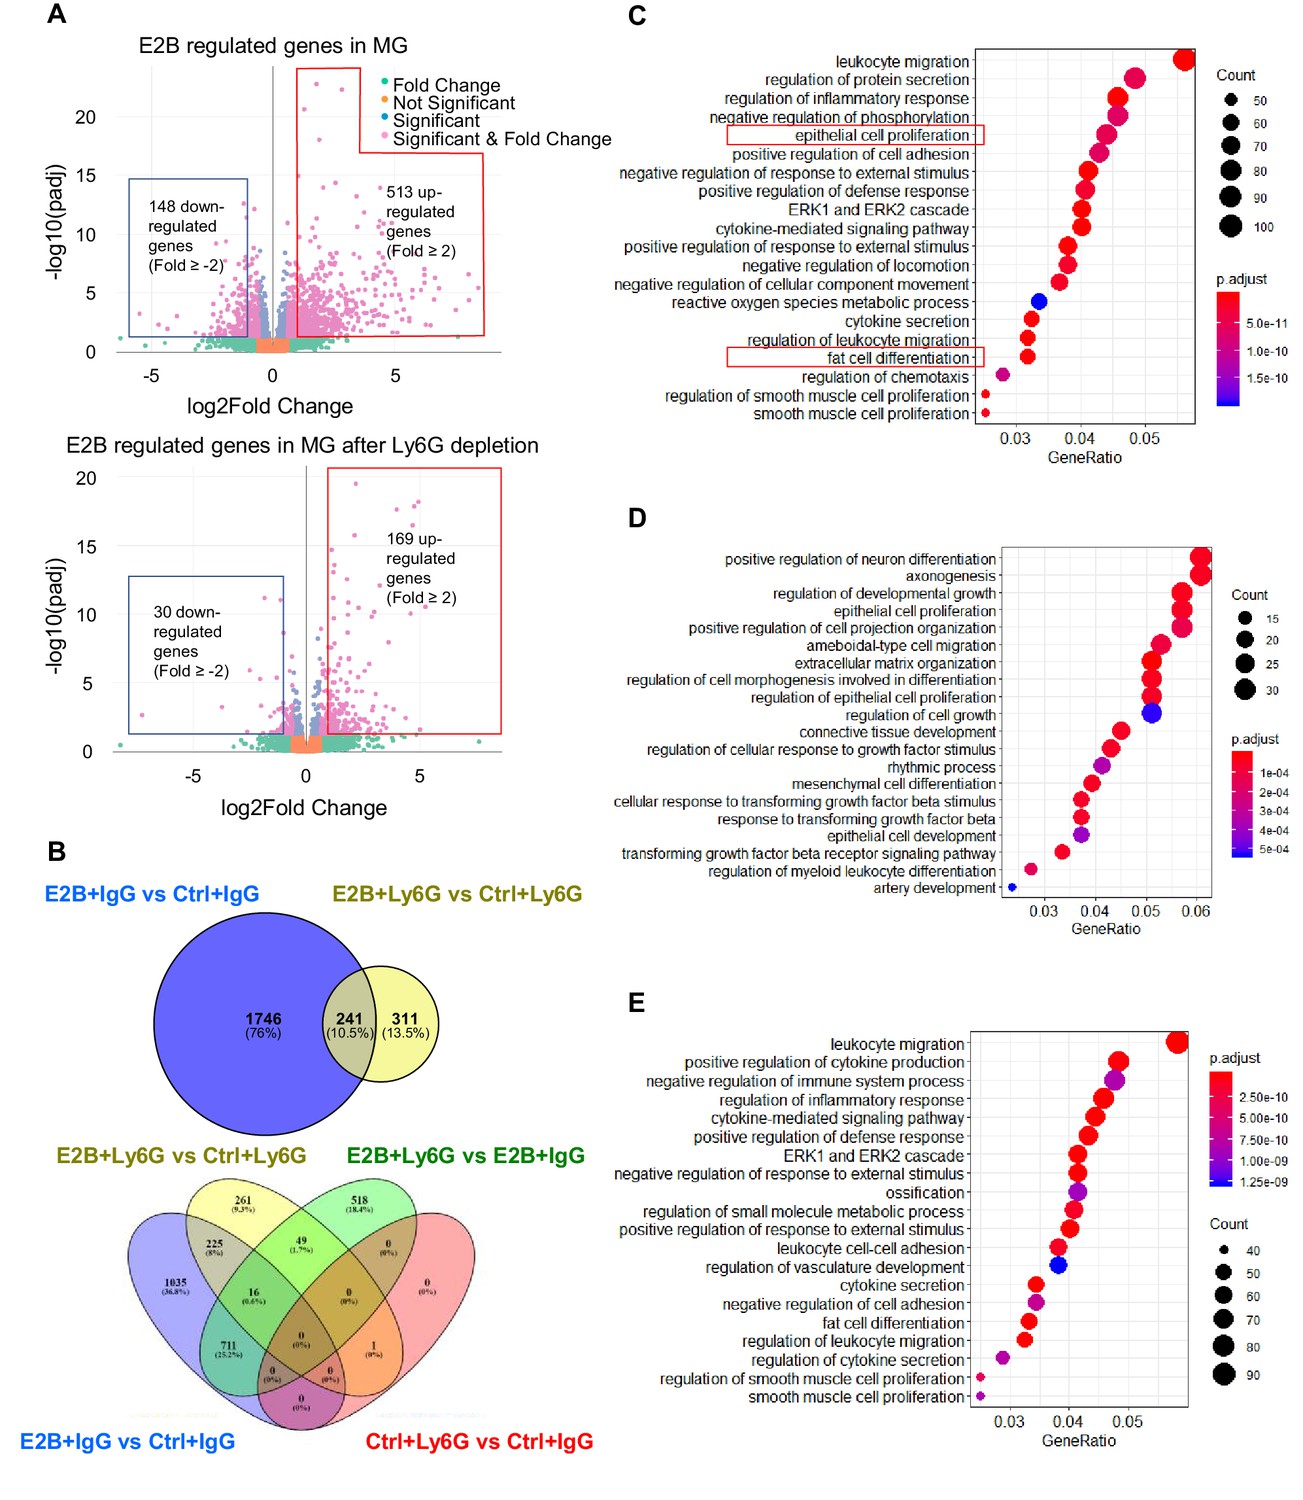
Estrogen regulates a multitude of neutrophil-dependent and –independent biological processes in involuting mammary gland.
Mice at INV D1 were treated with anti-Ly6G antibody (Ly6G) or isotype control (IgG). 24h later, they were treated with vehicle control (Ctrl) or E2B for 24h (Ctrl+IgG n=3, Ctrl+Ly6G n=3, E2B+IgG n=3, E2B+Ly6G n=3). RNA-Seq data were processed and analyzed with DESeq2 followed by GO over-representation analysis. (A) Volcano plot for the differentially expressed E2B regulated genes in mammary gland (MG) from IgG- and Ly6G-treated animals. (B) Venn diagram for the differentially expressed genes identified from the DESeq2 analysis of the RNA-Seq data. (C) Top 20 Gene Ontology (GO) terms for E2B regulated genes in MG without neutrophil depletion. (D) Top 20 GO terms for the E2B regulated genes in MG after neutrophil depletion. E, Top 20 GO terms for E2B regulated genes lost as a result of neutrophil depletion.
-
Figure 2—source data 1
DESeq2 analysis result between Ctrl+IgG and Ctrl+Ly6G.
- https://cdn.elifesciences.org/articles/57274/elife-57274-fig2-data1-v2.xlsx
-
Figure 2—source data 2
DESeq2 analysis result between E2B+IgG and Ctrl+IgG.
- https://cdn.elifesciences.org/articles/57274/elife-57274-fig2-data2-v2.xlsx
-
Figure 2—source data 3
DESeq2 analysis result between E2B+Ly6G and Ctrl+Ly6G.
- https://cdn.elifesciences.org/articles/57274/elife-57274-fig2-data3-v2.xlsx
-
Figure 2—source data 4
DESeq2 analysis result between E2B+IgG and E2B+Ly6G.
- https://cdn.elifesciences.org/articles/57274/elife-57274-fig2-data4-v2.xlsx
-
Figure 2—source data 5
GO over-representation analysis result of DE genes between E2B+IgG and Ctrl+IgG.
- https://cdn.elifesciences.org/articles/57274/elife-57274-fig2-data5-v2.xlsx
-
Figure 2—source data 6
GO over-representation analysis result of DE genes between E2B+Ly6G and Ctrl+Ly6G.
- https://cdn.elifesciences.org/articles/57274/elife-57274-fig2-data6-v2.xlsx
-
Figure 2—source data 7
GO over-representation analysis result of DE genes found only in E2B+IgG.
- https://cdn.elifesciences.org/articles/57274/elife-57274-fig2-data7-v2.xlsx
Figure 2—figure supplement 1
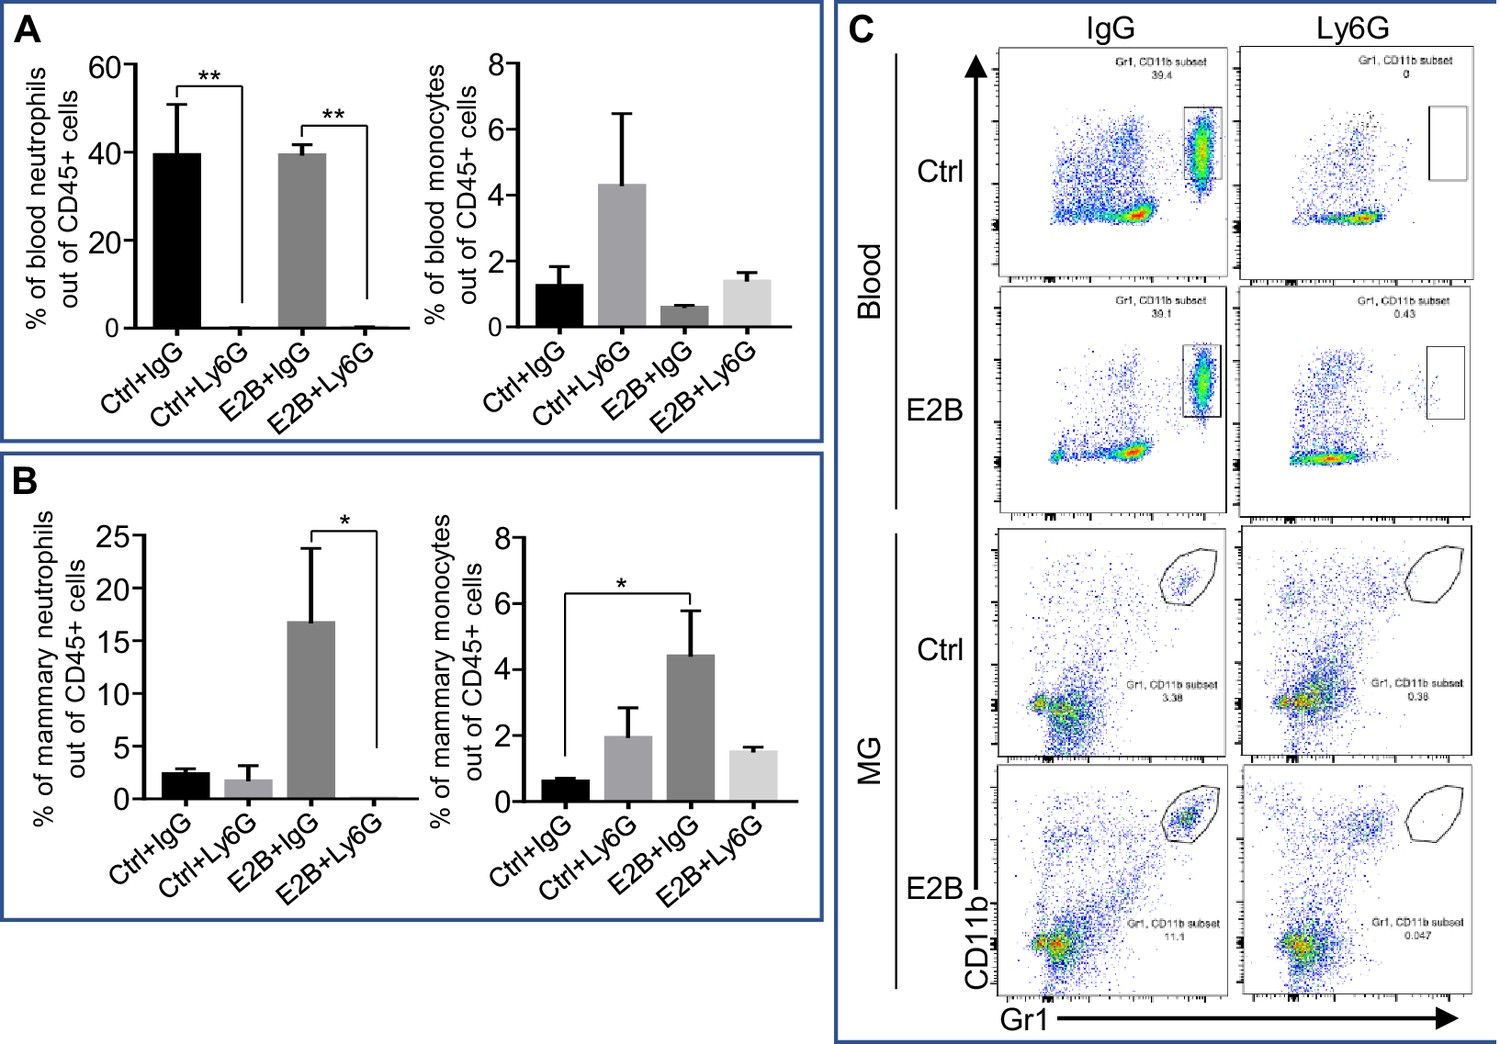
Depletion efficiency of neutrophils with anti-neutrophil antibody Ly6G.
Mice at INV D1 was treated with anti-Ly6G antibody (Ly6G) or isotype control (IgG). 24 hr later, they were treated with vehicle control (Ctrl) or E2B for 24 hr. Flow cytometry analysis was performed on total blood cells and from digested mammary gland (MG) tissue after red blood cells lysis. (A) Ly6G treatment significantly reduces circulating blood neutrophils by more than 90% while not affecting blood monocytes; Percentage of blood neutrophils (CD45+ CD11b+ Gr1hi) and monocytes (CD45+ CD11b+ Ly6Chi) out of live CD45+ population. (B) E2B treatment in mice given IgG increased the percentage of mammary neutrophils by six folds and this effect was abolished by neutrophil depletion with Ly6G. Mammary monocytes was also increased significantly by E2B treatment and was attenuated with Ly6G but to a non-statistically significant level; Percentage of mammary neutrophils (CD45+ CD11b+ Gr1hi) and monocytes (CD45+ CD11b+ Ly6Chi) out of live CD45+ population. Ctrl+IgG n = 3, Ctrl+Ly6G n = 3, E2B+IgG n = 3, E2B+Ly6G n = 3. (C) Representative flow cytometry dot plot for the neutrophils in the blood and MG. Data represented as mean ± SEM.
Figure 3 with 2 supplements
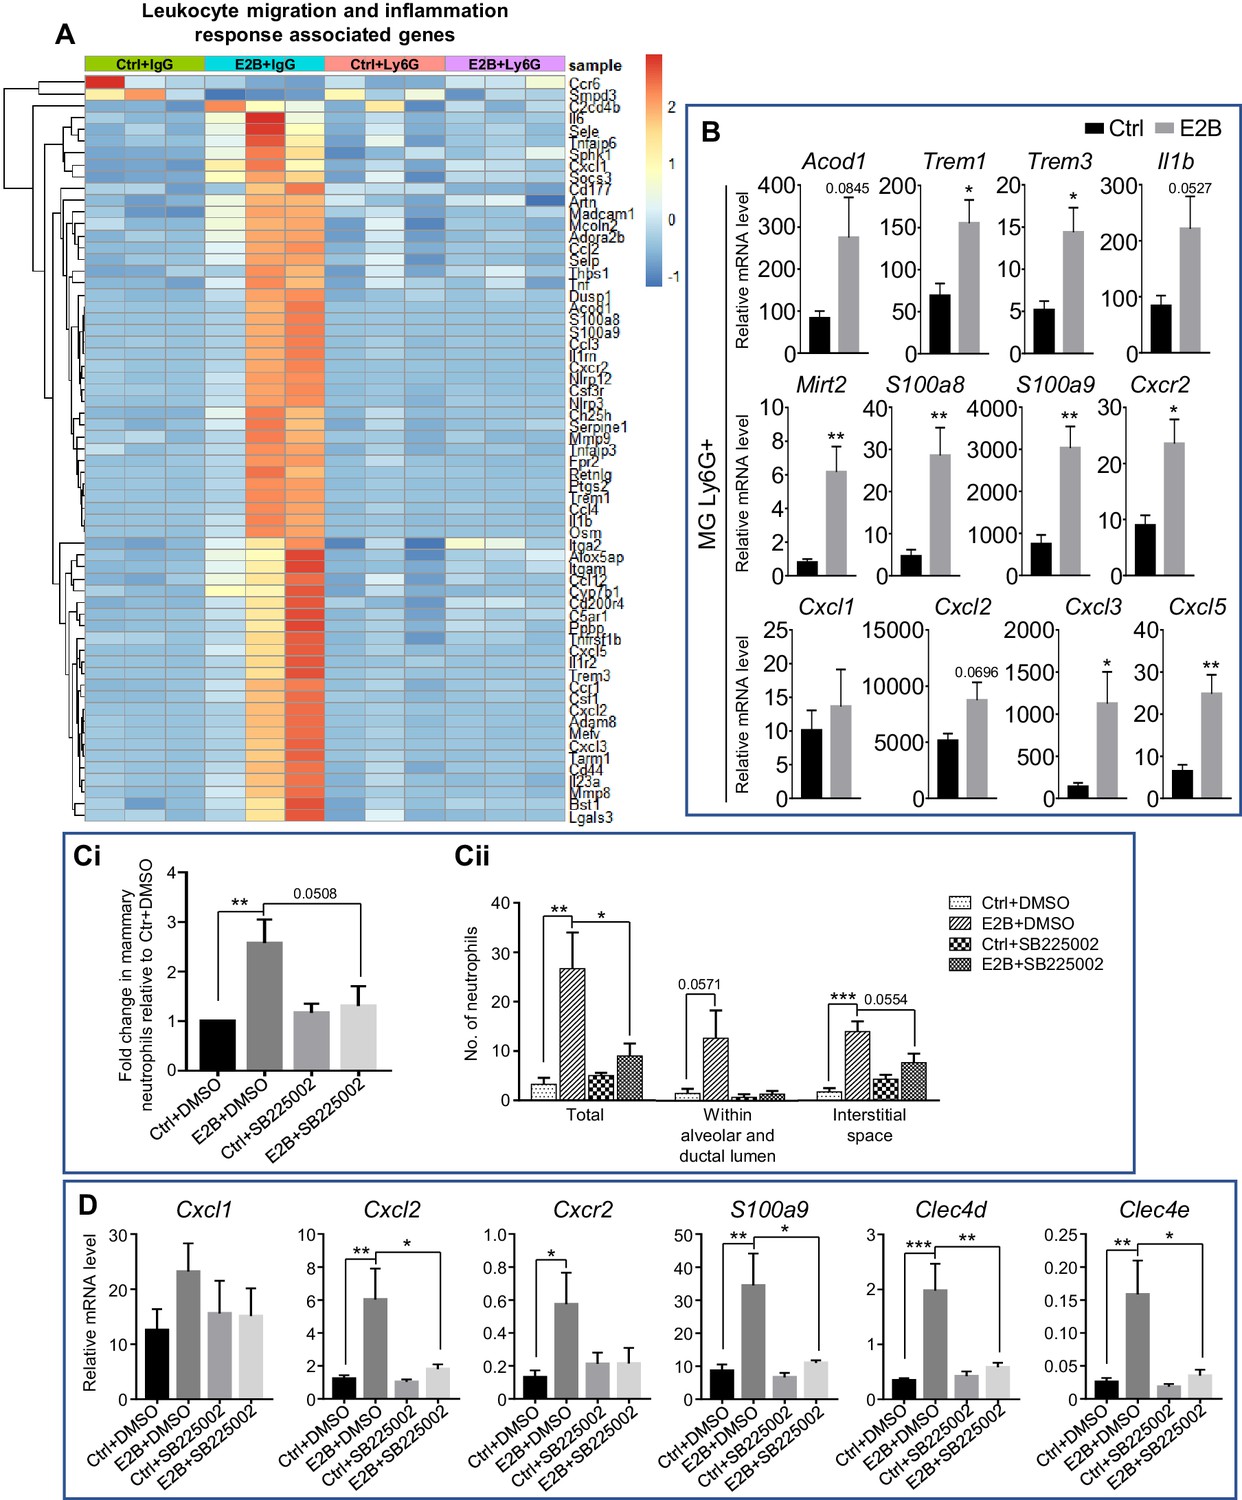
Estrogen-induced Cxcr2 signalling in neutrophils plays a key role in neutrophil infiltration into the involuting mammary gland.
(A) Heatmap representation of estrogen-regulated genes associated to leukocyte migration and inflammation in neutrophils (≥3 and ≤ −3-fold); Experiment is conducted according to the description in Figure 2. (B) qPCR analysis of estrogen-regulated expression of Acod1, Mirt2, Trem1, Trem3, S100a9, S100a8, Cxcl1, Cxcl2, Cxcl3, Cxcl5, Cxcr2, and Il1b relative to Gapdh in isolated mammary neutrophils following treatment with or without E2B for 24 hr (Ctrl n = 5, E2B n = 5). (C-D) E2B-induced Cxcr2 in neutrophils is critical for E2B-induced neutrophil infiltration. Mice at INV D1 were treated with Ctrl or E2B in the absence or presence of CXCR2 inhibitor SB225002 for 48 hr; (C) SB225002 reduces E2B-induced mammary neutrophil (CD45+ CD11b+ Ly6G+) by flow cytometry analysis (Ci) (Ctrl+DMSO n = 7, E2B+DMSO n = 7, Ctrl+SB225002 n = 7, E2B+SB225002 n = 6), and the number of infiltrated neutrophils in 20 mm2 of mammary sections (Cii) (Ctrl+DMSO n = 4, E2B+DMSO n = 3, Ctrl+SB225002 n = 3, E2B+SB225002 n = 3); (D) SB225002 reduces E2B-induced Cxcl2, Cxcr2, S100a9, Clec4d, and Clec4e expression in the involuting gland (Ctrl+DMSO n = 7, E2B+DMSO n = 6, Ctrl+SB225002 n = 7, E2B+SB225002 n = 5). Data represented as mean ± SEM.
Figure 3—figure supplement 1
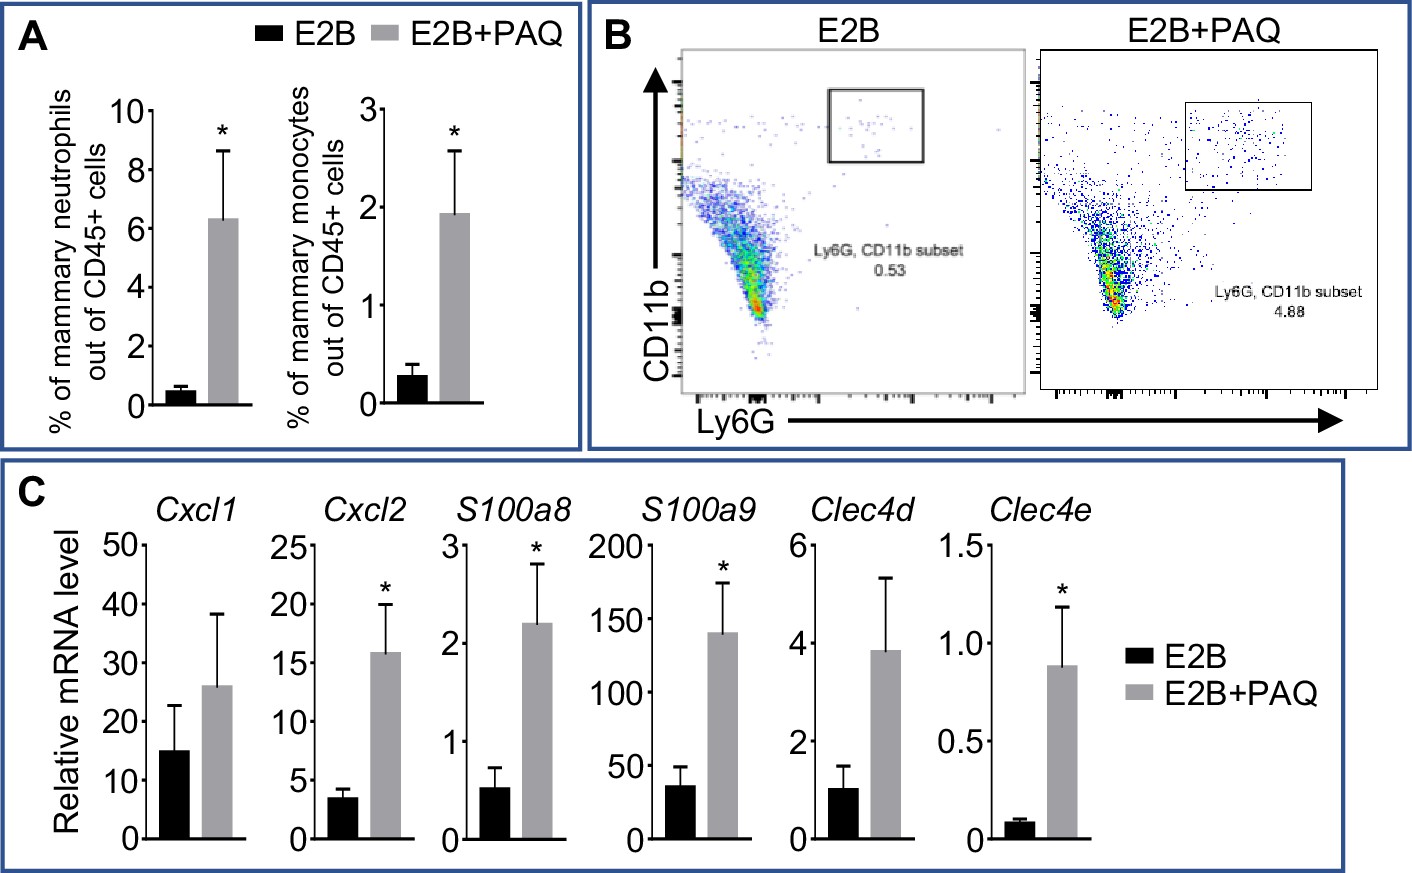
Putative S100A9 inhibitor Paquinimod promotes neutrophil infiltration.
Mice were treated at INV D1 with either E2B or E2B+PAQ for 48h. (A) Treatment with E2B and PAQ significantly induces neutrophil and monocyte infiltration into the involuting MG as compared to E2B-treated; Flow cytometry analysis of mammary neutrophils (CD45+ CD11b+ Ly6G+) and monocytes (CD45+ CD11b+ Ly6Chi) out of live CD45+ cell population. (B) Representative flow cytometry dot plot for the percentage of neutrophils in the MG. (C) Treatment with E2B and PAQ increases the expression of some inflammatory genes as compared to E2B-treated; Gene expression of inflammatory genes Cxcl1, Cxcl2, S100a8, S100a9, Clec4d, and Clec4e relative to Rplp0 by qPCR analysis. E2B n=6, E2B+PAQ n=5. Data represented as mean ± SEM.
Figure 3—figure supplement 2
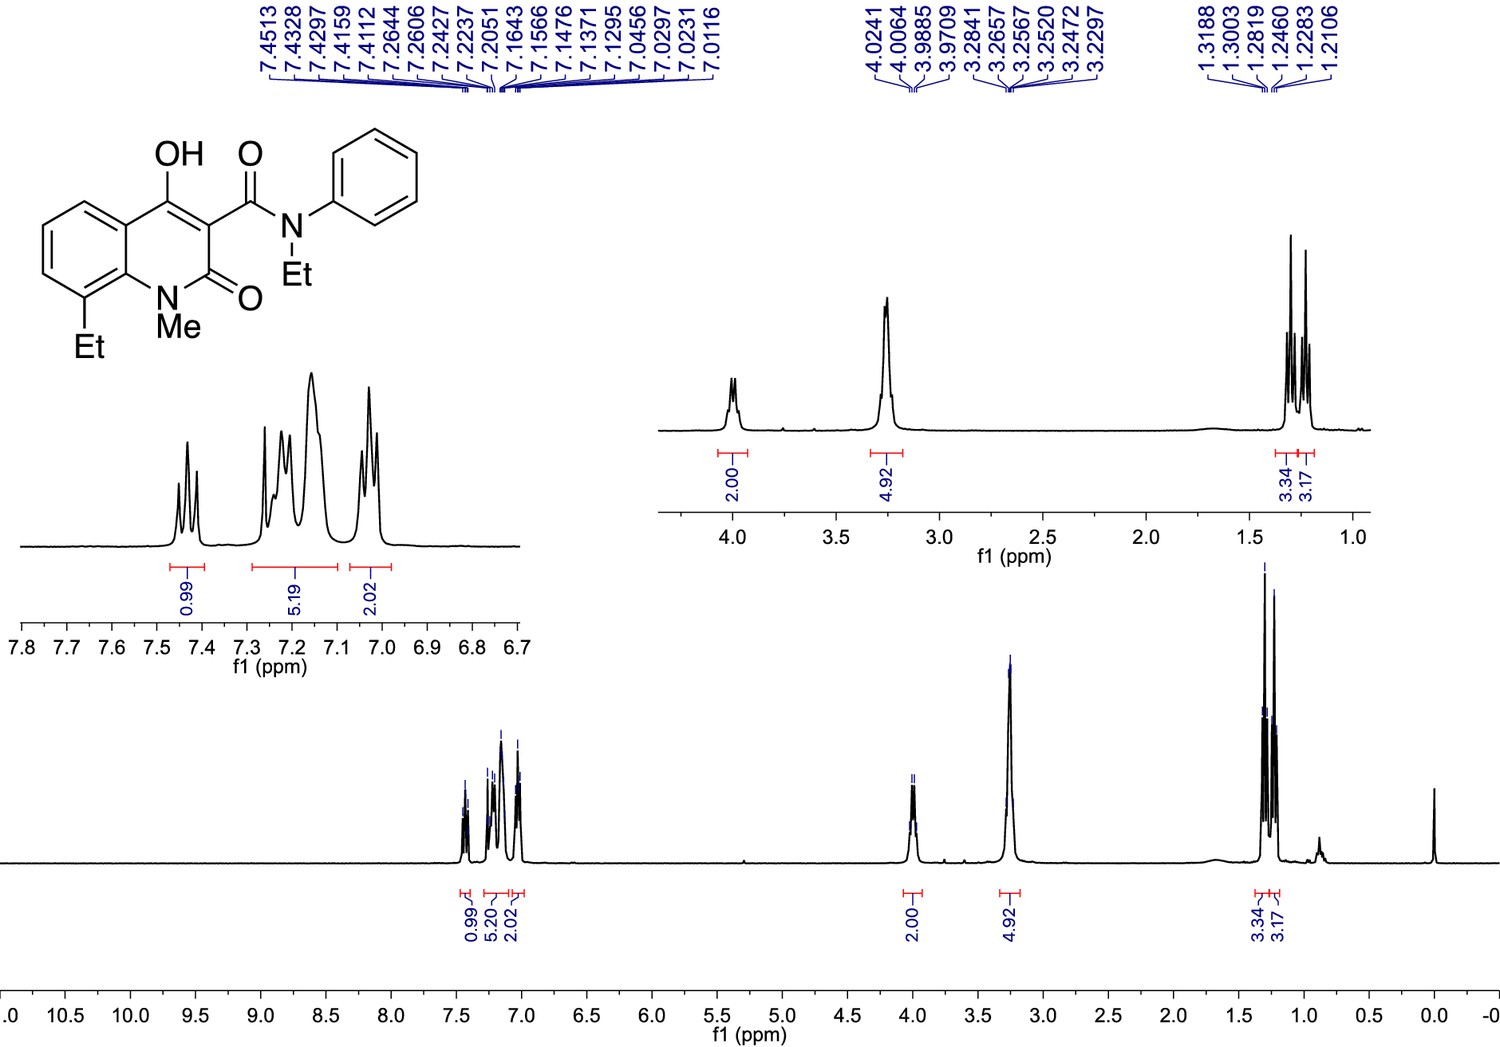
1H NMR Spectrum of the synthesized Paquinimod (PAQ): 1H NMR (CDCl3, 400 MHz) δ 7.43 (1H, dd, J = 8.6, 7.4 Hz), 7.29 – 7.10 (5H, m), 7.03 (2H, dd, J = 8.1, 5.5 Hz), 4.00 (2H, q, J = 7.1 Hz), 3.28 – 3.23 (3H+2H m), 1.30 (3H, t, J = 7.4 Hz), 1.23 (3H, t, J = 7.1 Hz).
1H NMR spectrum was recorded on a Bruker Avance 400 spectrometer.
Figure 4 with 3 supplements
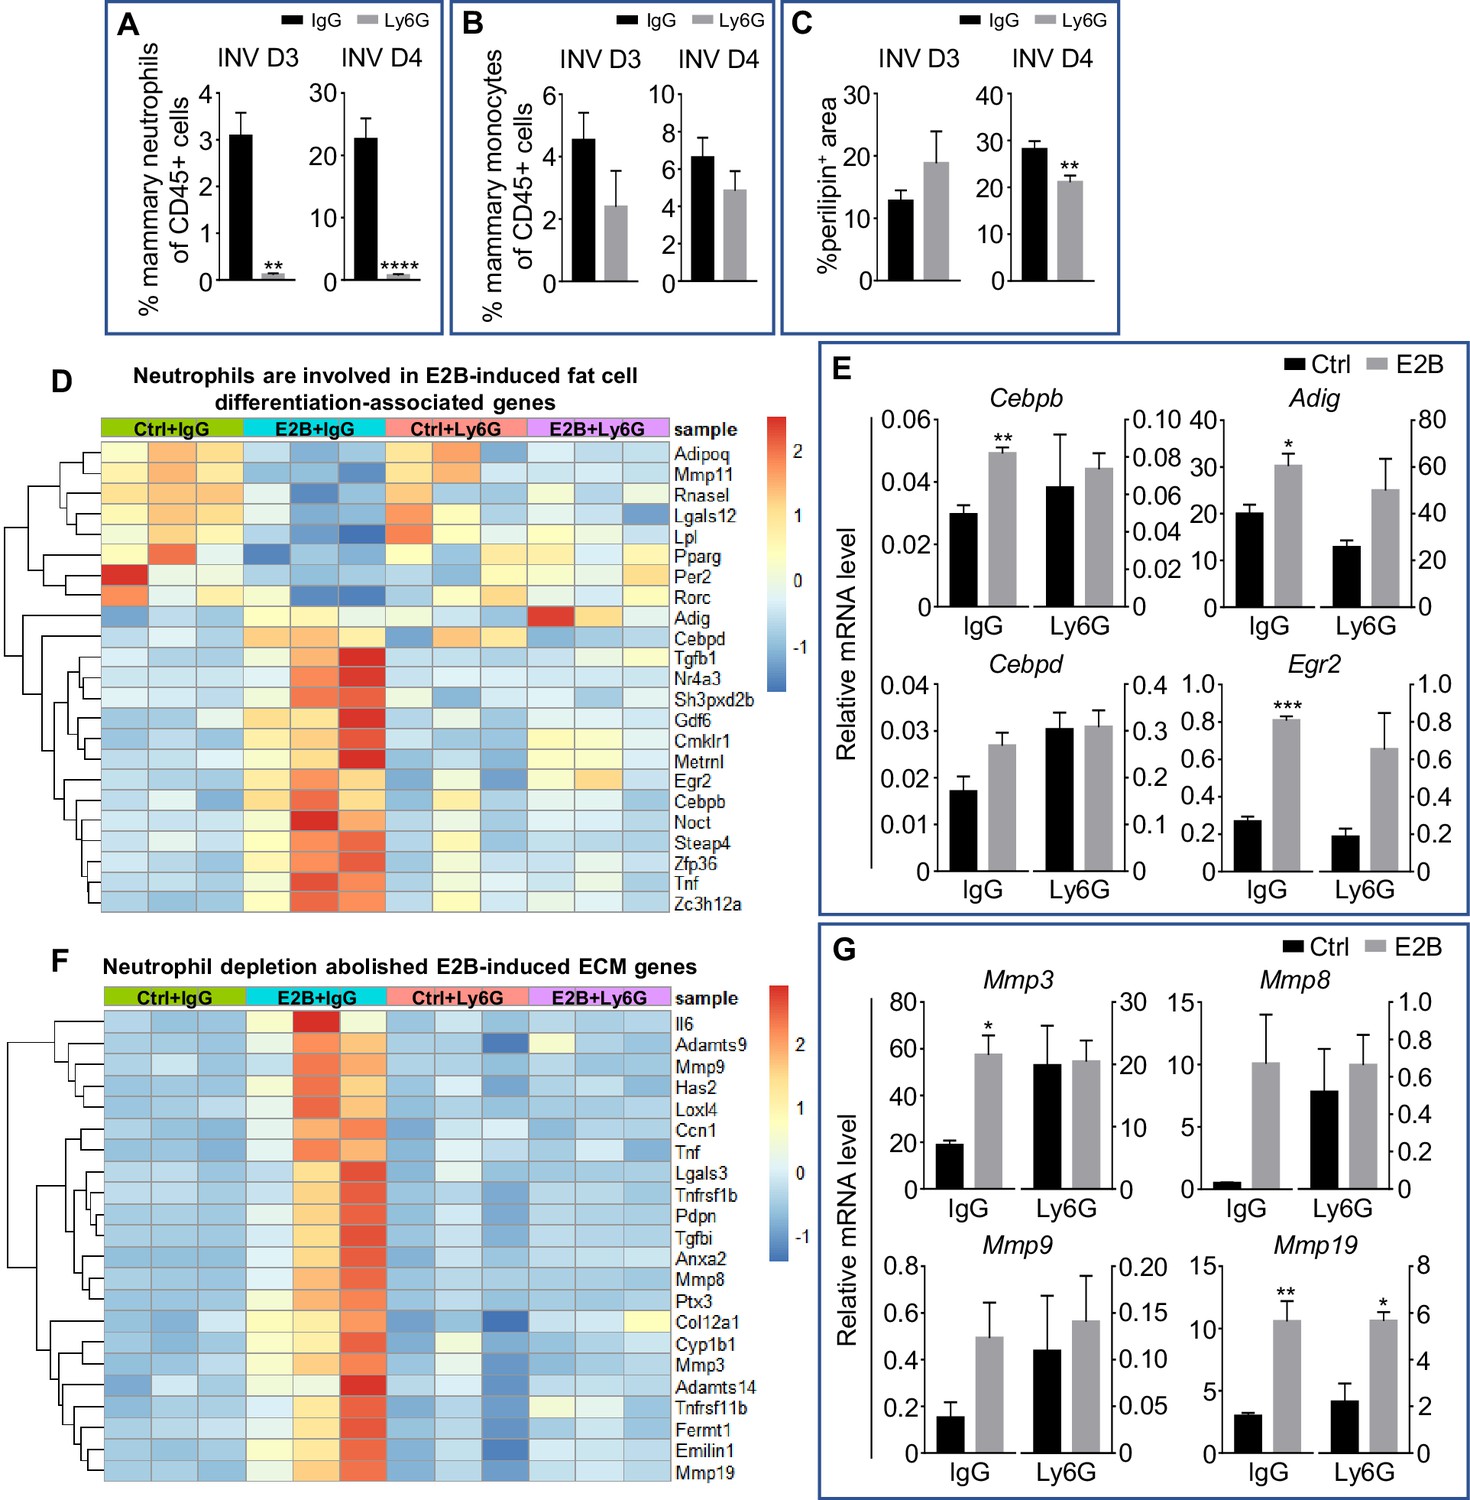
Estrogen-induced adipocyte repopulation is associated with induction of adipogenic and tissue remodelling genes in neutrophils.
(A-C) Non-OVX mice were treated daily with either anti-Ly6G antibody (Ly6G) or isotype control (IgG) from 24h post-weaning (INV D1); (A) Flow cytometry analysis of mammary neutrophils (CD45+ CD11b+ Gr1hi) from mice treated with IgG or Ly6G; (B) Flow cytometry analysis of mammary monocytes (CD45+ CD11b+ Ly6Chi) from mice treated with IgG or Ly6G; (C) Quantification of percentage of perilipin stained area at INV D3 (IgG n=3, Ly6G n=4) and INV D4 (IgG n=10, Ly6G n=9). (D) Heatmap representation of genes associated to fat cell differentiation identified from the GO over-representation analysis (≥ 1.5 and ≤ -1.5-fold); Experiment is conducted according to the description in Figure 2; (E) Gene expression of adipogenesis genes Adig, Egr2, Cebpb, and Cebpd relative to Rplp0 by qPCR analysis. (F) Heatmap representation of genes associated to extracellular matrix organization identified from the GO over-representation analysis (≥ 2 and ≤ -2-fold); Section of heatmap replotted from Figure 4—figure supplement 2; Experiment is conducted according to the description in Figure 2; (G) Gene expression of tissue remodelling genes Mmp3, Mmp8, Mmp9, and Mmp19 relative to Rplp0 by qPCR analysis (Ctrl+IgG n=3, Ctrl+Ly6G n=3, E2B+IgG n=3, E2B+Ly6G n=3). Data represented as mean ± SEM.
Figure 4—figure supplement 1
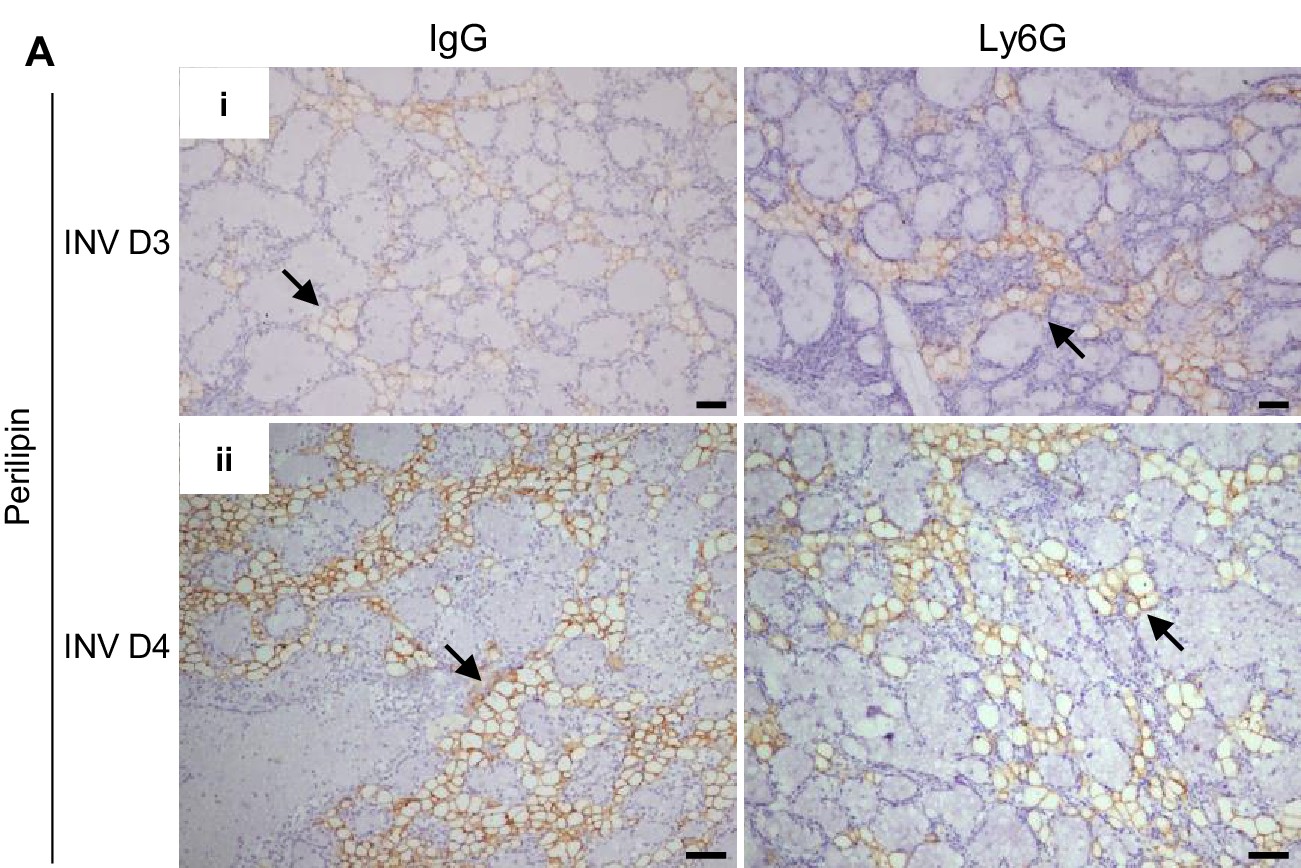
Neutrophil depletion transiently reduces E2B-induced adipocyte repopulation during mammary involution.
Non-OVX mice were treated daily with either anti-Ly6G antibody (Ly6G) or isotype control (IgG) from 24 hr post-weaning (INV D1). Mammary tissue was collected for analysis at INV D3 and INV D4. (A) (i) Perilipin IHC at INV D3; (ii) Perilipin IHC at INV D4; arrows indicate perilipin+ adipocytes. Scale bars: 50 µm.
Figure 4—figure supplement 2
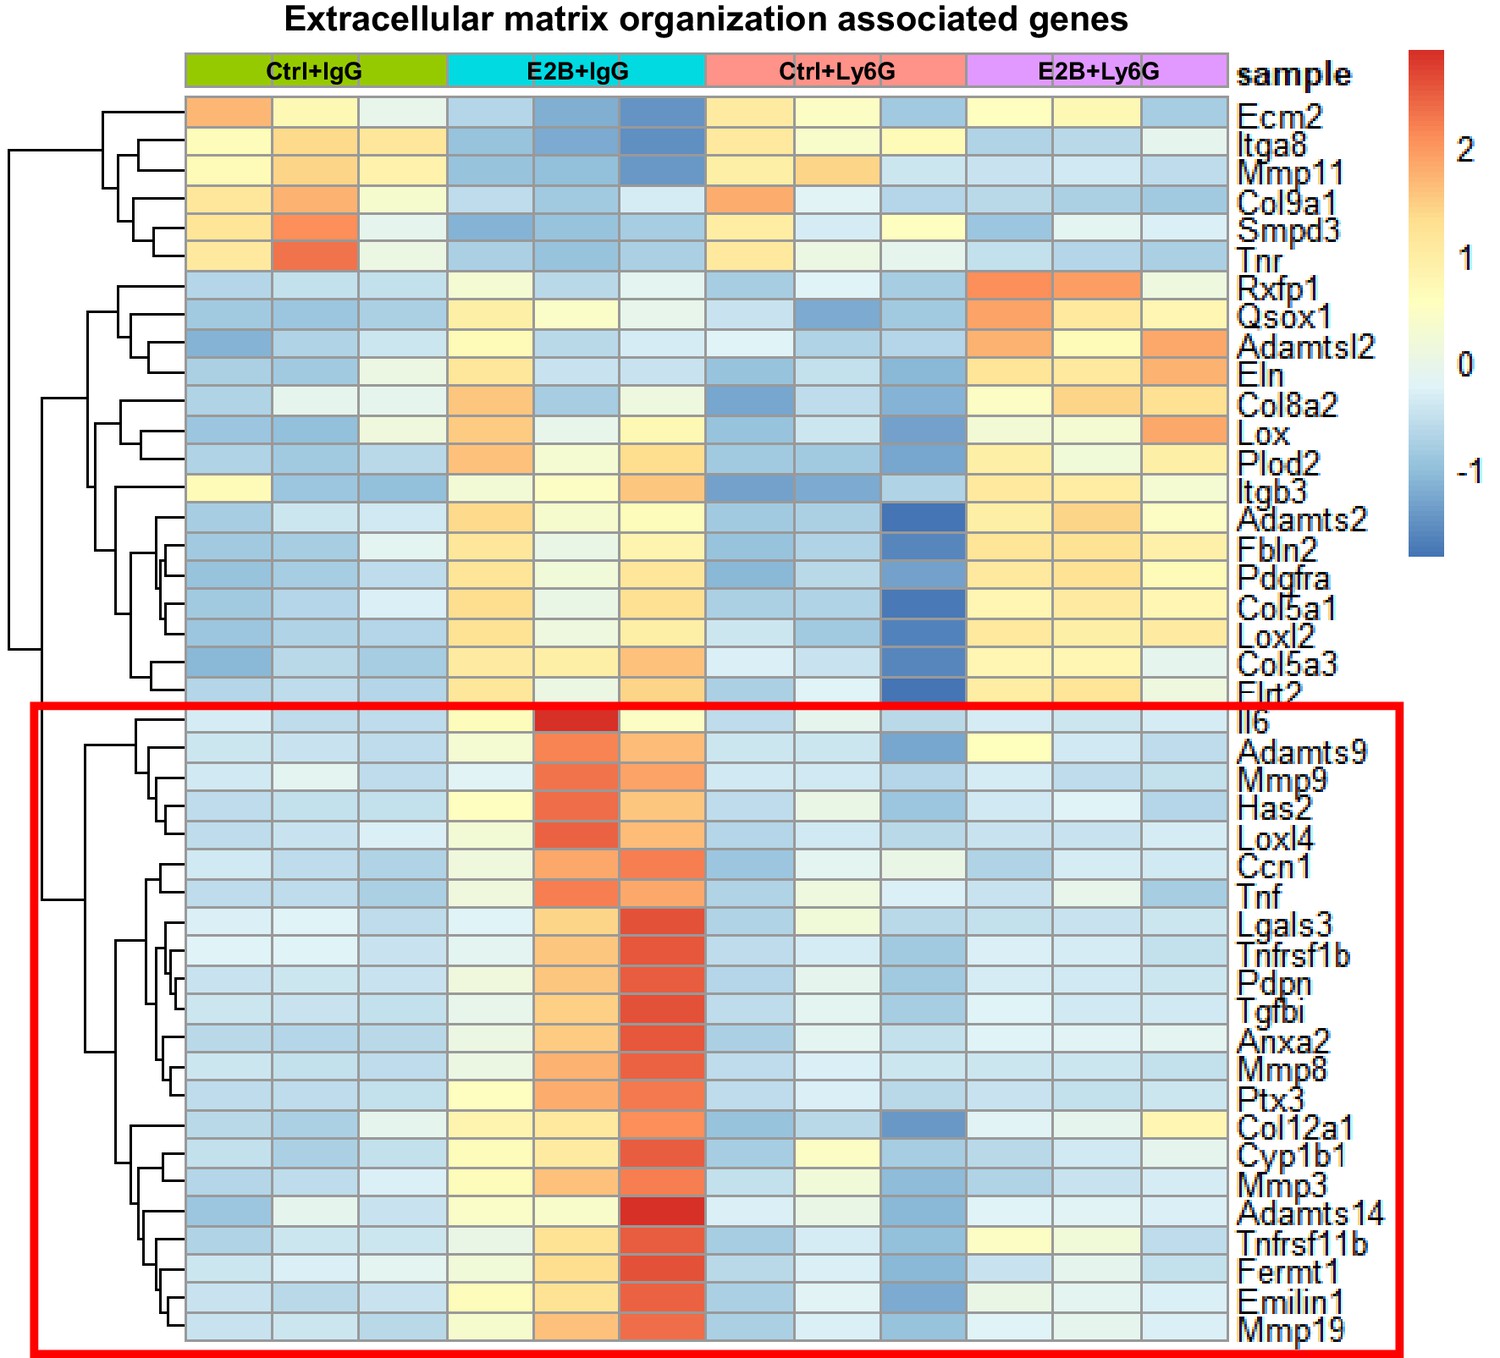
50% of estrogen-regulated ECM genes are abolished by neutrophil depletion.
Mice at INV D1 was treated with anti-Ly6G antibody (Ly6G) or isotype control (IgG). 24 hr later, they were treated with vehicle control (Ctrl) or E2B for 24 hr. Heatmap representation of genes associated to extracellular matrix organization identified from the GO over-representation analysis (≥2 and ≤ −2-fold) with padj < 0.05 from the DESeq2 analyzed RNA-Seq data; Highlighted red box indicates part of the heatmap replotted and presented in Figure 4F; Ctrl+IgG n = 3, Ctrl+Ly6G n = 3, E2B+IgG n = 3, E2B+Ly6G n = 3.
Figure 4—figure supplement 3
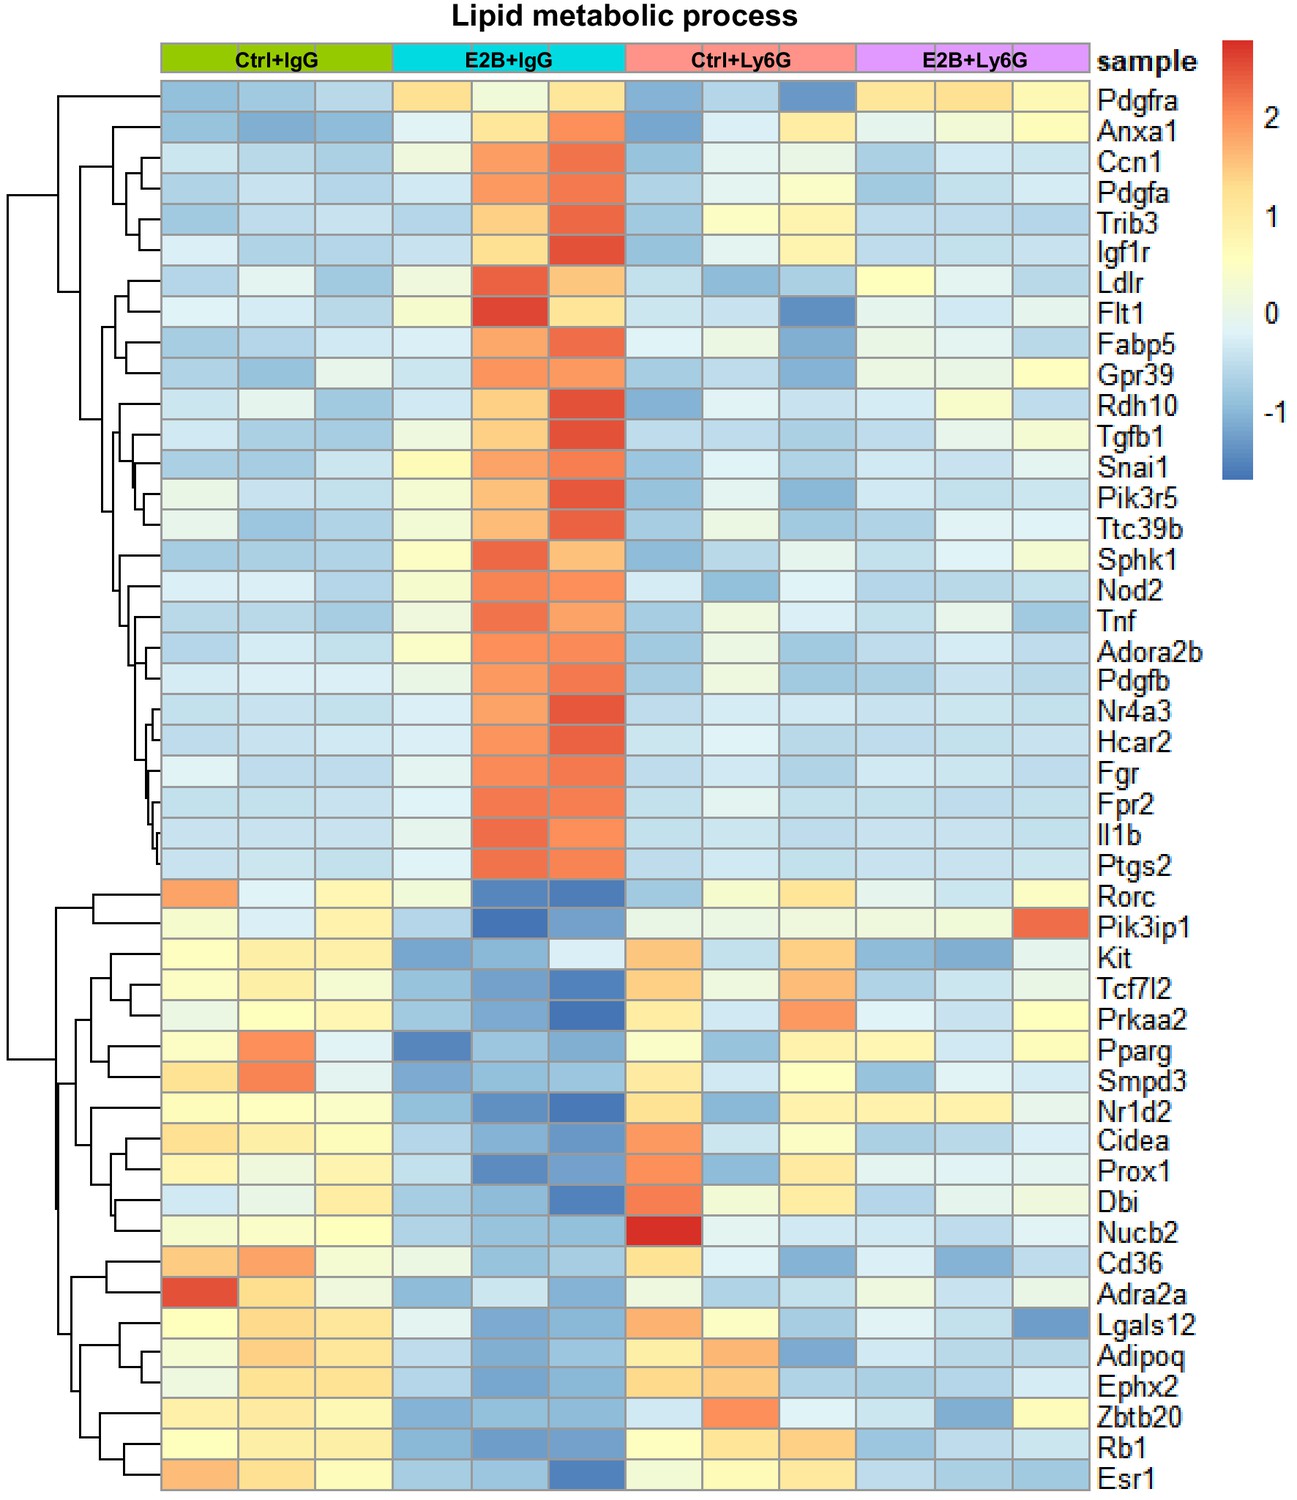
Estrogen regulation of lipid metabolism during post-weaning mammary involution were attenuated with neutrophil depletion.
Mice at INV D1 was treated with anti-Ly6G antibody (Ly6G) or isotype control (IgG). 24 hr later, they were treated with vehicle control (Ctrl) or E2B for 24 hr. Heatmap representation of genes associated to lipid metabolic process identified from the GO over-representation analysis (≥1.5 and≤−1.5 fold) with padj < 0.05 from the DESeq2 analyzed RNA-Seq data; Ctrl+IgG n = 3, Ctrl+Ly6G n = 3, E2B+IgG n = 3, E2B+Ly6G n = 3.
Figure 5 with 2 supplements

Estrogen stimulates the activity of lysosomal proteases that are critical for LM-PCD.
(A) qPCR validation of E2B-induced expression of Bid, Ctsb, and Tnf relative to Rplp0 identified from DESeq2 analysis (Figure 5—figure supplement 1) (Ctrl+IgG n = 3, Ctrl+Ly6G n = 3, E2B+IgG n = 3, E2B+Ly6G n = 3). Mice on INV D1 were treated with Ctrl or E2B for 48 hr before MG were collected for analysis; (B) Western blots of cathepsin B, D and L proteins (sc, single-chain; dc, heavy chain of the double-chain form) in mammary tissue of 48 hr treatment (Ctrl n = 3, E2B n = 4). (C) Western blotting analysis shows that depletion of neutrophils did not affect estrogen-induced increase of single-chain (sc) and double-chain (dc) forms of CTSB (Ctrl+IgG n = 3, E2B+IgG n = 4, Ctrl+Ly6G n = 3, E2B+Ly6G n = 3). (D) Effect of E2B on protein levels of lysosomal and cytosolic CTSB and CTSL proteins after subcellular fractionation. LAMP2 is used as a lysosomal marker (s.e, short exposure; l.e., long exposure) (Ctrl n = 3, E2B n = 3). Data are presented as Mean ± SEM.
Figure 5—figure supplement 1
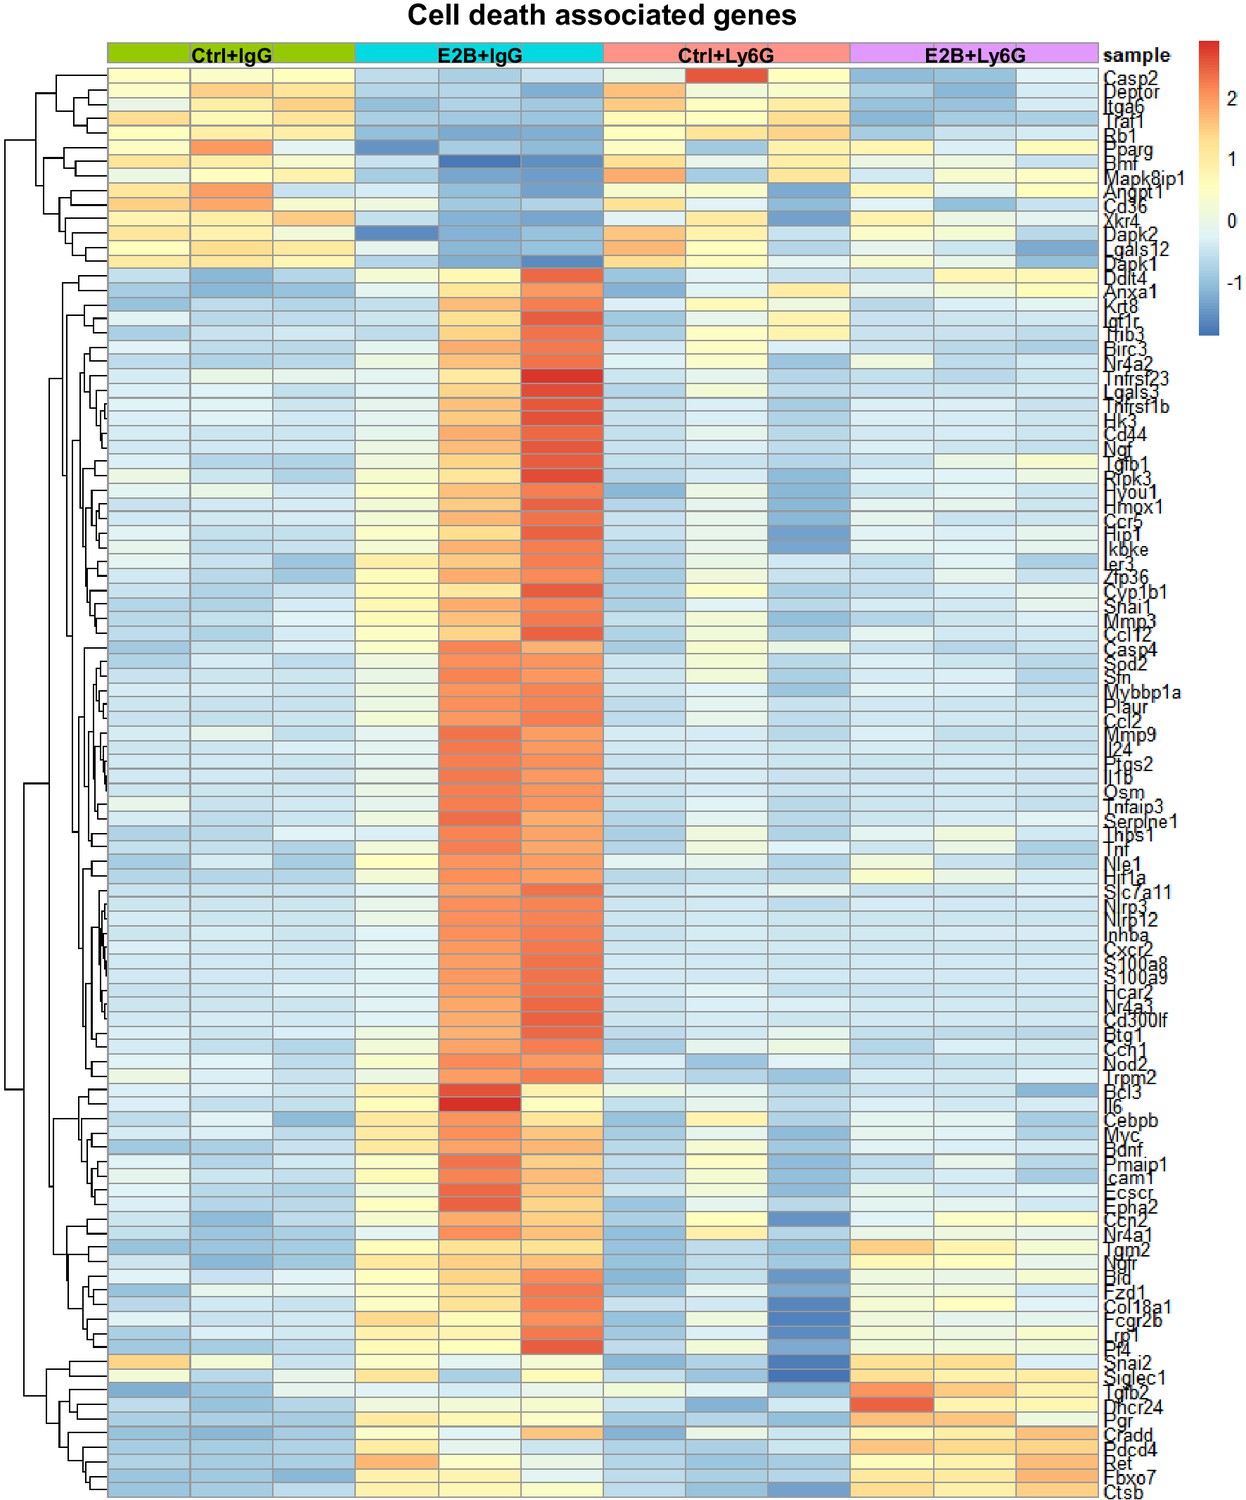
Heatmap representation of estrogen-regulated genes associated with cell death from the GO over-representation analysis.
Mice at INV D1 was treated with anti-Ly6G antibody (Ly6G) or isotype control (IgG). 24h later, they were treated with vehicle control (Ctrl) or E2B for 24h. The genes plotted exhibit fold change of ≥ 1.5 and ≤ -1.5 with padj<0.05 from the DESeq2 analysis of the RNA-Seq data. Ctrl+IgG n=3, Ctrl+Ly6G n=3, E2B+IgG n=3, E2B+Ly6G n=3.
Figure 5—figure supplement 2
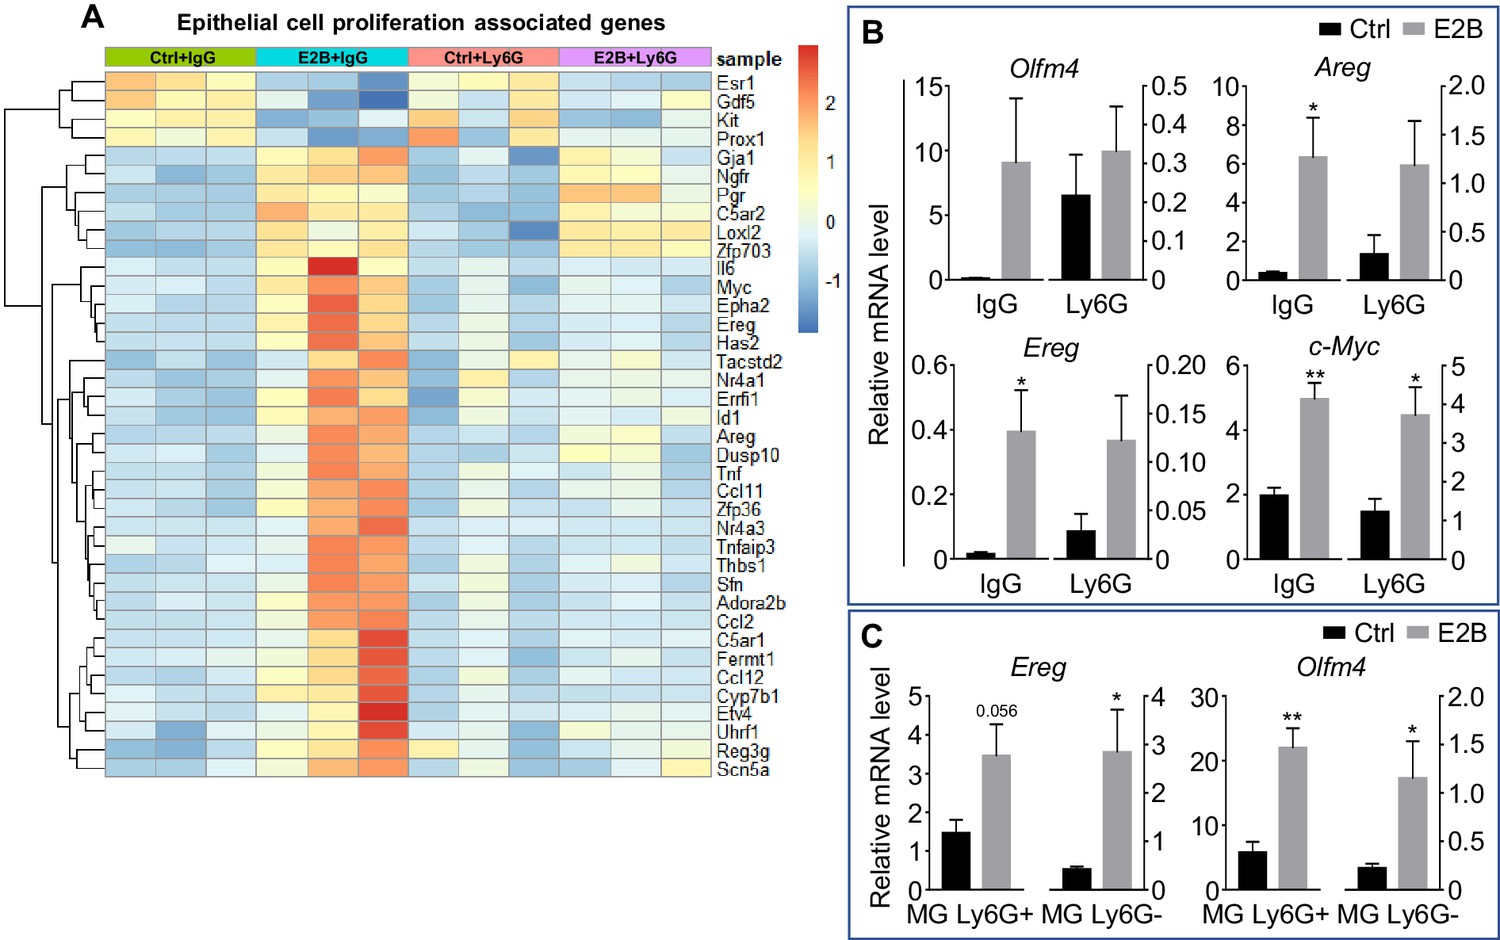
Estrogen-induced genes associated with cell proliferation are regulated in both mammary gland and neutrophil population.
(A-B) Mice at INV D1 was treated with anti-Ly6G antibody (Ly6G) or isotype control (IgG). 24 hr later, they were treated with vehicle control (Ctrl) or E2B for 24 hr; (A) Heatmap representation of genes associated to epithelial cell proliferation identified from the GO over-representation analysis (≥2 and ≤ −2-fold) of the DESeq2 analyzed RNA-Seq data; (B) E2B induces proliferative gene expression independent of neutrophil presence; qPCR validation of estrogen-induced expression of Areg, c-Myc, Olfm4, and Ereg relative to Rplp0 (Ctrl+IgG n = 3, Ctrl+Ly6G n = 3, E2B+IgG n = 3, E2B+Ly6G n = 3). (C) Ereg and Olfm4 were induced by estrogen in both mammary neutrophil and non-neutrophil population; Mice at INV D2 was treated with Ctrl or E2B for 24 hr. Gene expression of Ereg and Olfm4 analyzed in both Ly6G+ and Ly6G-population by qPCR analysis (Ctrl n = 5, E2B n = 5). Data represented as mean ± SEM.
Figure 6
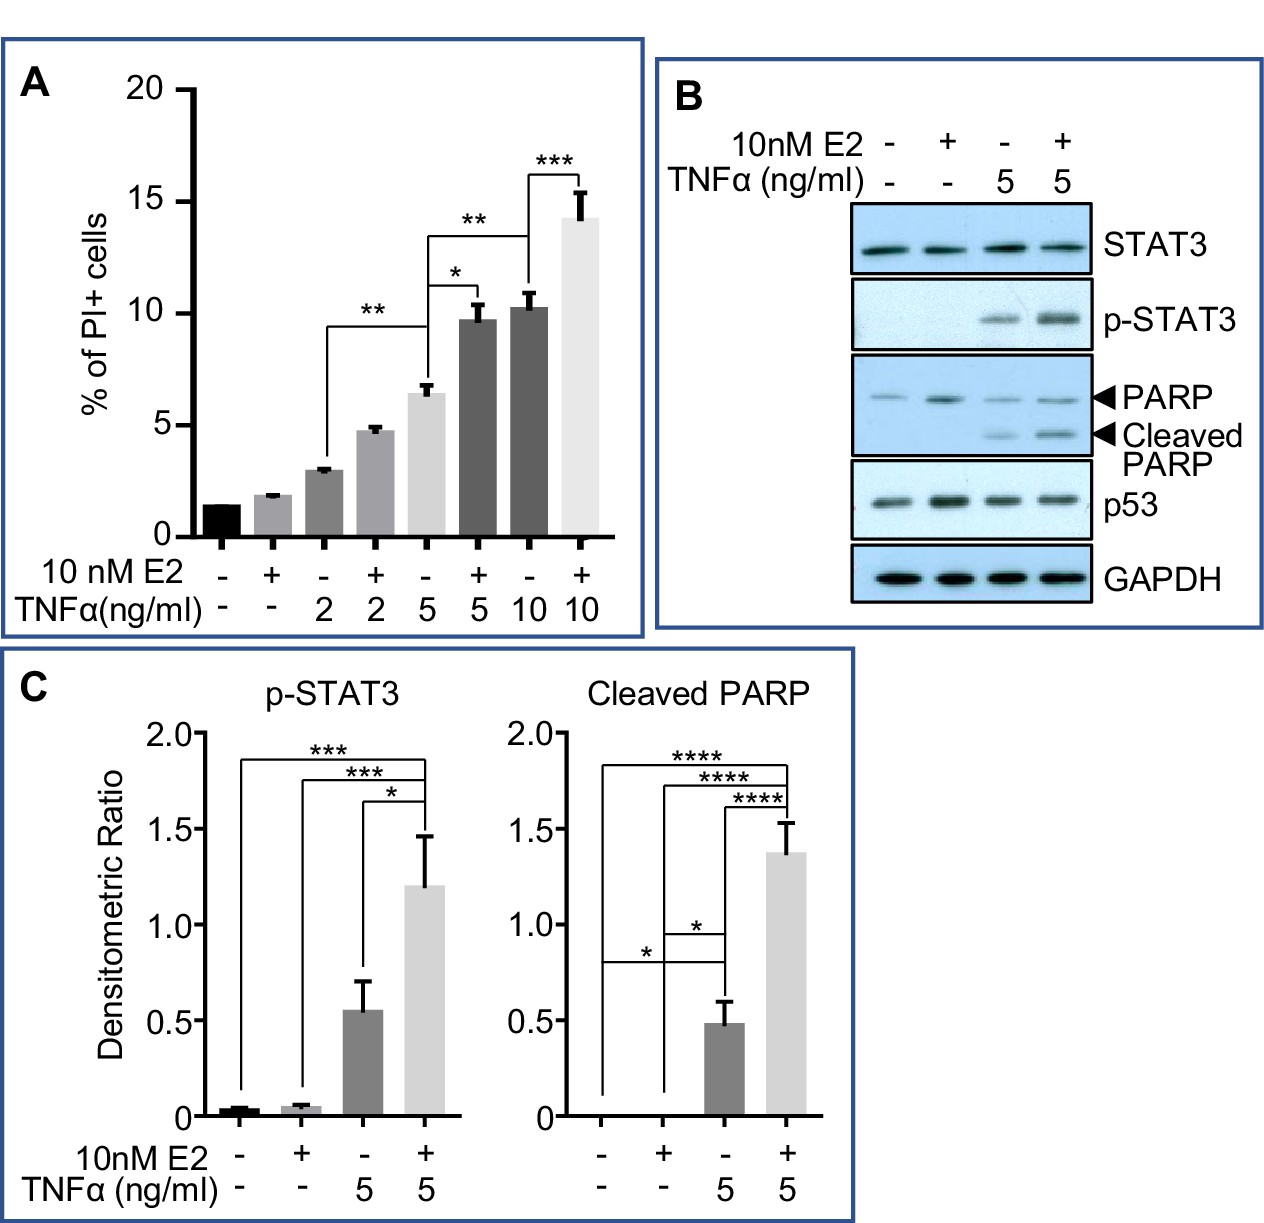
Estrogen accelerates TNFα-induced cell death in vitro.
MCF7-caspase3(+) cells were treated with either vehicle control (1xPBS) or TNFα of varying concentrations. An hour later, cells were treated with either vehicle control (0.01% ethanol) or 10nM 17β-estradiol (E2) for 24h, after which they were collected for analysis. (A) Flow cytometry analysis for the percentage of propodium iodide (PI)-positive cells (dead cells) after treatment (4 independent experiments with triplicates for each group). (B) Representative western blotting analysis of various proteins from the treated cells. (C) Densitometric analysis of protein expressions normalized against GAPDH (3 independent experiments with duplicates for each group). Data represented as mean ± SEM.
Figure 7
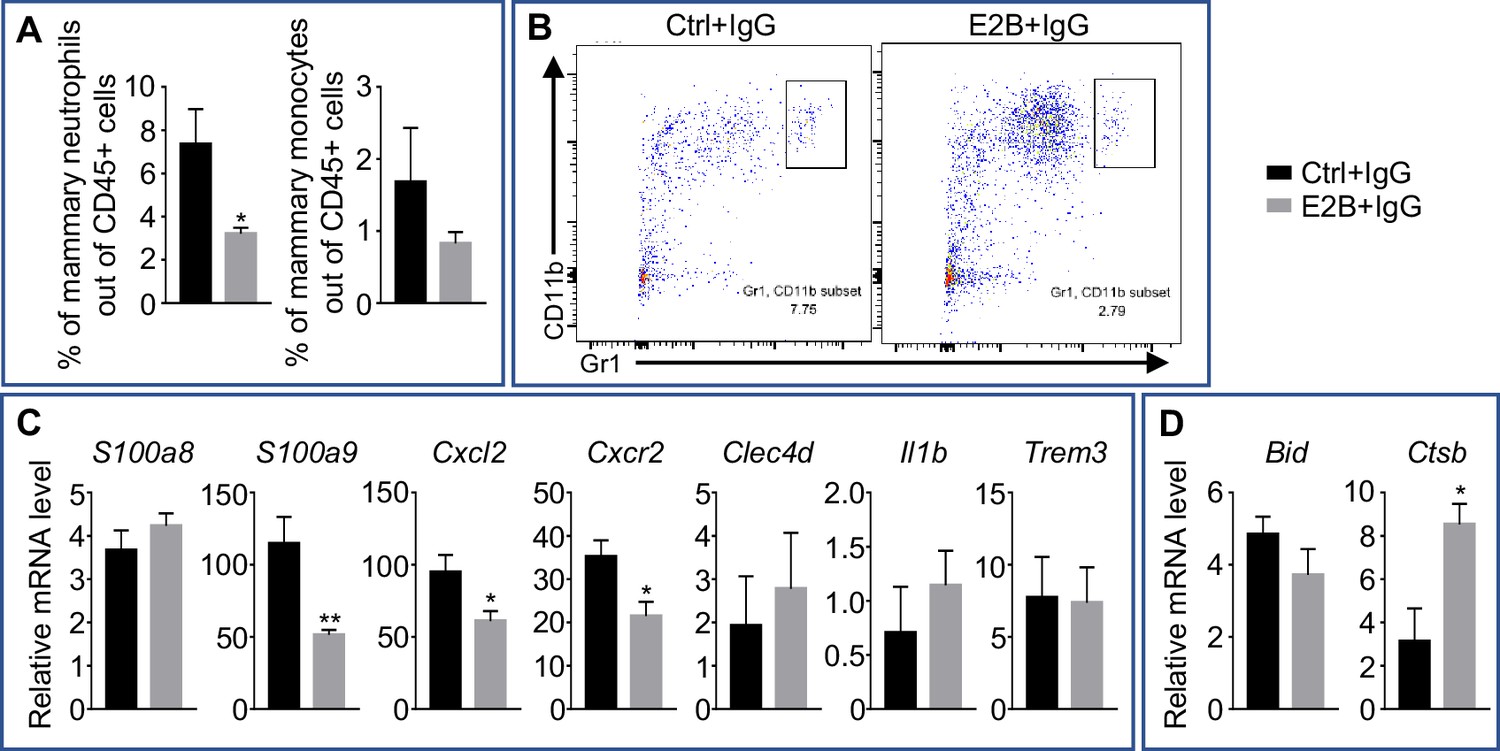
Estrogen regulation of inflammatory and apoptotic genes in nulliparous mammary tissue.
OVX nulliparous mice were treated with isotype control (IgG). 24 hr later, they were treated with either Ctrl or E2B for 24 hr. (A) Flow cytometry analysis of mammary neutrophils (CD45+ CD11b+ Gr1hi) and monocytes (CD45+ CD11b+ Ly6Chi). (B) Representative flow cytometry dot plot for the percentage of neutrophils in the MG. (C) Gene expression of pro-inflammatory genes S100a8, S100a9, Cxcl2, Cxcr2, Clec4d, Il1b, and Trem3 relative to Rplp0 by qPCR. (D) Gene expression of cell death associated genes Bid and Ctsb relative to Rplp0 by qPCR. Ctrl+IgG n = 5, E2B+IgG n = 5. All data are presented as mean ± SEM.
Figure 8 with 1 supplement
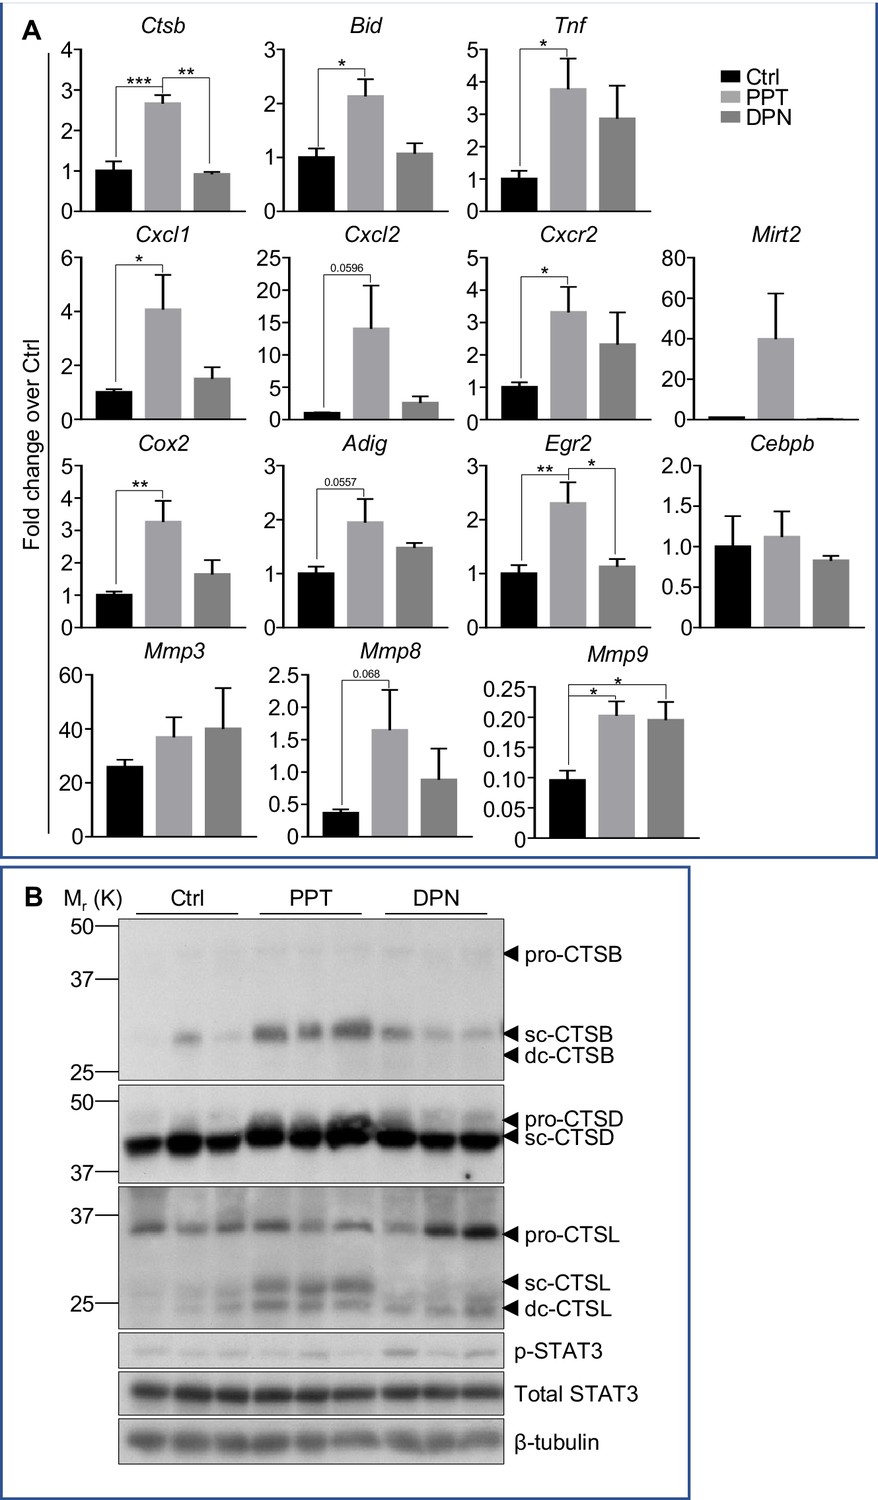
Estrogenic stimulations of neutrophil gene expression and mammary cell death are mediated by ERα.
Mice at INV D1 was treated with vehicle control (Ctrl), ER-α agonist PPT, or ER-β agonist DPN for 48h before mammary gland were collected for analysis. (A) qPCR analysis of gene expression in mammary tissue. The results are expressed as fold change (Mean ± SEM) in response to PPT or DPN (Ctrl n=7, PPT n=5, DPN n=3). (B) Western blotting analysis of cathepsin B, D, L, and STAT3 proteins (sc, single-chain; dc, heavy chain of the double-chain form) in mammary tissue (Ctrl n=3, PPT n=3, DPN n=3).
Figure 8—figure supplement 1

Expression of Esr1 (ERα) is about 40 times higher than Esr2 (ERβ) in mammary neutrophils during mammary involution.
Mice at INV D2 was treated with either vehicle control (Ctrl) or E2B for 8h. Mammary neutrophils were isolated from tissue using Dynabeads bound anti-Ly6G antibody. Gene expression of Esr1 and Esr2 relative to Rplp0 were analyzed in Ly6G+ population by qPCR analysis (Ctrl n=4, E2B n=4). Data represented as mean ± SEM.
Figure 9
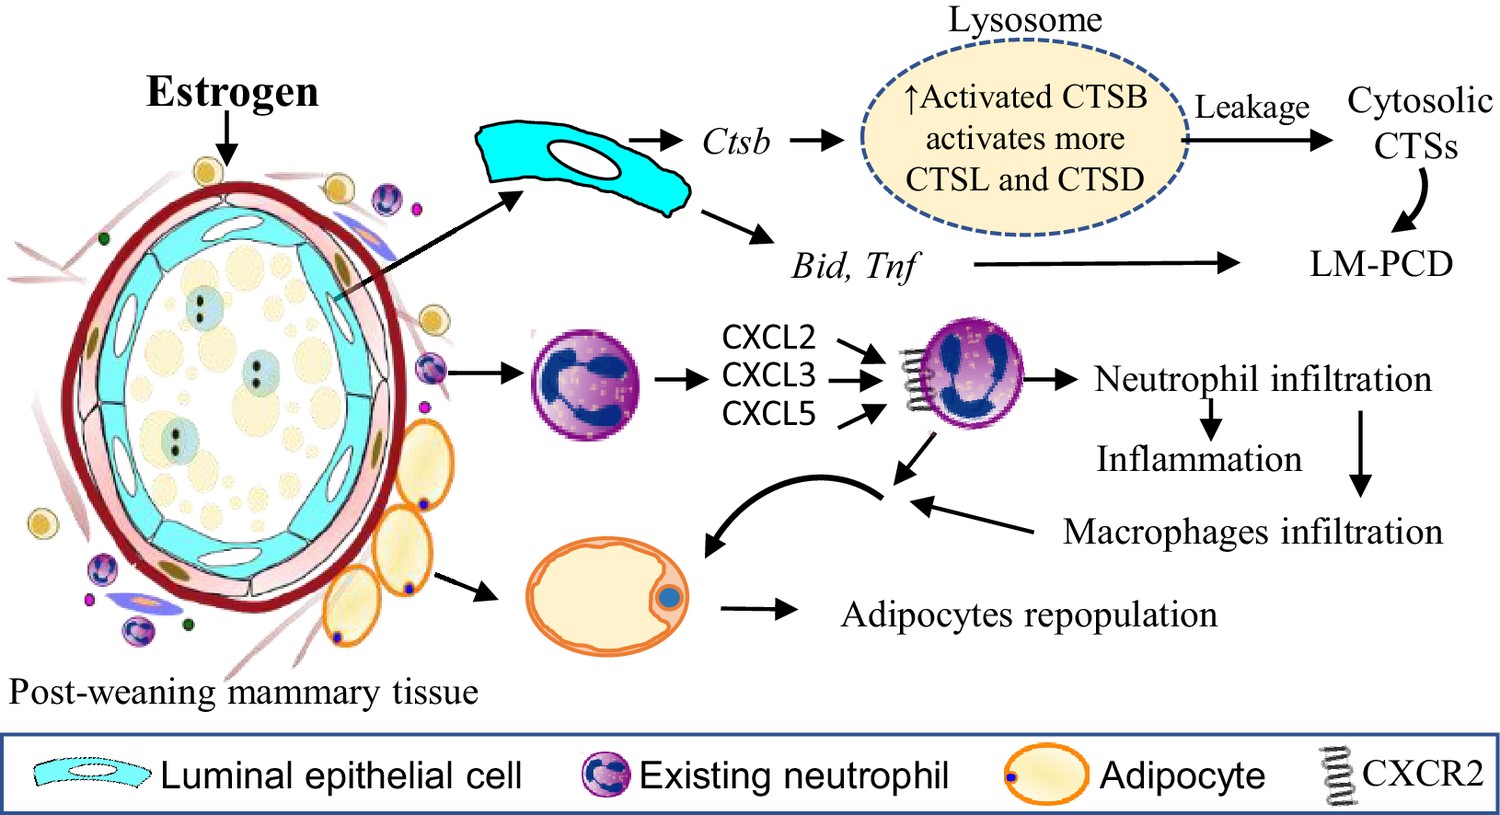
Estrogen exacerbates mammary cell death, inflammation and adipocytes repopulation through distinct mechanisms.
Estrogen induces Ctsb gene expression in the mammary cells leading to increased pro-CTSB which is cleaved and activated in lysosomes. The increased active sc-CTSB further activates CTSD and CTSL. Increased CTSB activity enhanced lysosomal permeabilization during mammary involution resulting in the leakage of more activated CTS into the cytosol stimulating a heightened LM-PCD. Estrogen treatment also induces expression of Bid and Tnf gene which are reported to be involved in the induction of LM-PCD (Hennigar and Kelleher, 2015; Stoka et al., 2001). The apoptotic protein BID is cleaved into the active tBID by the activated cytosolic CTSs. TNFα is known to induce LM-PCD via the ZnT2-mediated zinc accumulation in lysosomes, leading to PCD (Hennigar and Kelleher, 2015). Estrogen stimulates neutrophil infiltration into the involuting mammary tissue via CXCR2 signalling by up-regulating CXCR2 and its ligands CXCL2, CXCL3, CXCL5 in neutrophils in a autocrine fashion. Meanwhile, estrogen promotes the expression of numerous proinflammatory genes such as Trem1, Trem3, Il1b, S100a8, S100a9 in neutrophils that likely heighten mammary inflammation. Estrogen induction of genes coding for adipogenic proteins (e.g. CEBPB, Adig and Egr2), for extracellular matrix remodelling enzymes (e.g. Mmp19, Mmp3, Mmp8, Ptx3, Col8a2, Has2) and for Cox-2 etc can facilitate adipocyte repopulation. In addition, estrogen-induced monocytes infiltration and macrophage activity may further contribute to estrogen-induced adipocyte repopulation.
Additional files
-
Supplementary file 1
List of qPCR primers used.
- https://cdn.elifesciences.org/articles/57274/elife-57274-supp1-v2.xlsx
-
Supplementary file 2
List of antibodies used.
- https://cdn.elifesciences.org/articles/57274/elife-57274-supp2-v2.xlsx
-
Transparent reporting form
- https://cdn.elifesciences.org/articles/57274/elife-57274-transrepform-v2.pdf
Download links
A two-part list of links to download the article, or parts of the article, in various formats.
Downloads (link to download the article as PDF)
Open citations (links to open the citations from this article in various online reference manager services)
Cite this article (links to download the citations from this article in formats compatible with various reference manager tools)
Estrogen exacerbates mammary involution through neutrophil-dependent and -independent mechanism
eLife 9:e57274.
https://doi.org/10.7554/eLife.57274


