Universal and taxon-specific trends in protein sequences as a function of age
- Department of Ecology and Evolutionary Biology, University of Arizona, United States
- Department of Physics, University of Arizona, United States
- Department of Mathematics, University of Arizona, United States
- Department of Molecular and Cellular Biology, University of Arizona, United States
Figures
Figure 1 with 4 supplements

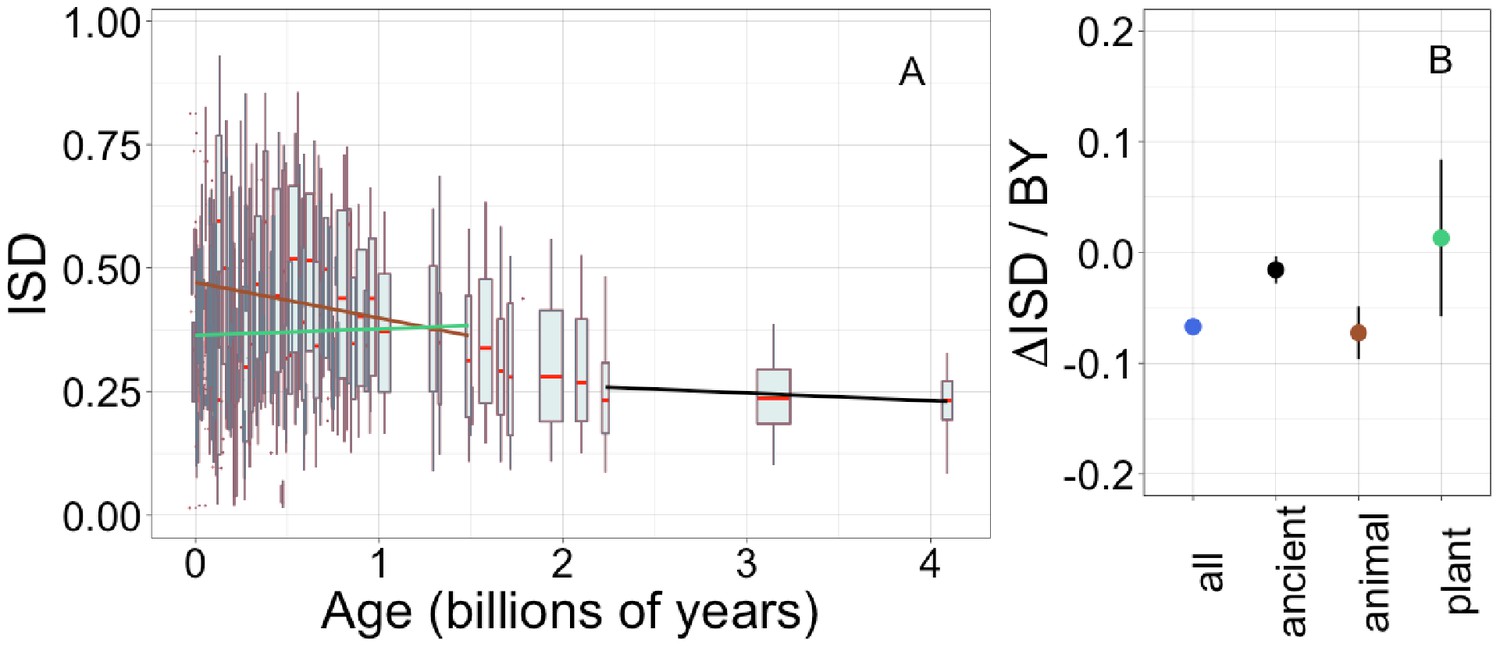
Young domains have high intrinsic structural disorder (ISD), but this trend is driven exclusively by recent animal domains.
Results are for non-transmembrane pfams. (A) The brown linear regression was calculated for recent animal pfams (slope = −0.062, R2 = 0.0097, p = 6 × 10⁻⁷, n (number of pfams) = 2456), green for recent plant pfams (slope = 0.056, p = 0.1, n = 183), and black line over ancient pfams in all lineages (slope = −4.2 × 10⁻⁴, p = 0.9, n = 3102). Data underlying animal and plant curves is visualized separately in Figure 1—figure supplement 3. Slopes represent the decrease in average IUPred2 score, that is, the predicted propensity of the average amino acid to be disordered, per billion years. Each data point consists of the average across all instances of homologous pfams, across all species in which it occurs. Phylostratigraphy assigns these to age classes, dated using timetree. To help visualize the data, every age class is represented in the figure by a weighted box plot, where the width of the plot indicates the number of pfams in that age class. The median is shown in red, with the boxes representing upper and lower quartiles (the 75th and 25th percentile), and the whiskers indicating 9 and 91 quantiles. For age classes with only a single pfam, values are presented as small red dots. For clarity of presentation our plots do not show outliers, although we note that these are included in our linear regression models. (B) Phylostratigraphy slopes for pfams calculated over different subsets of the data are plotted with their 95% confidence intervals. The point colors correspond to the regression slopes in (A).
Figure 1—figure supplement 1
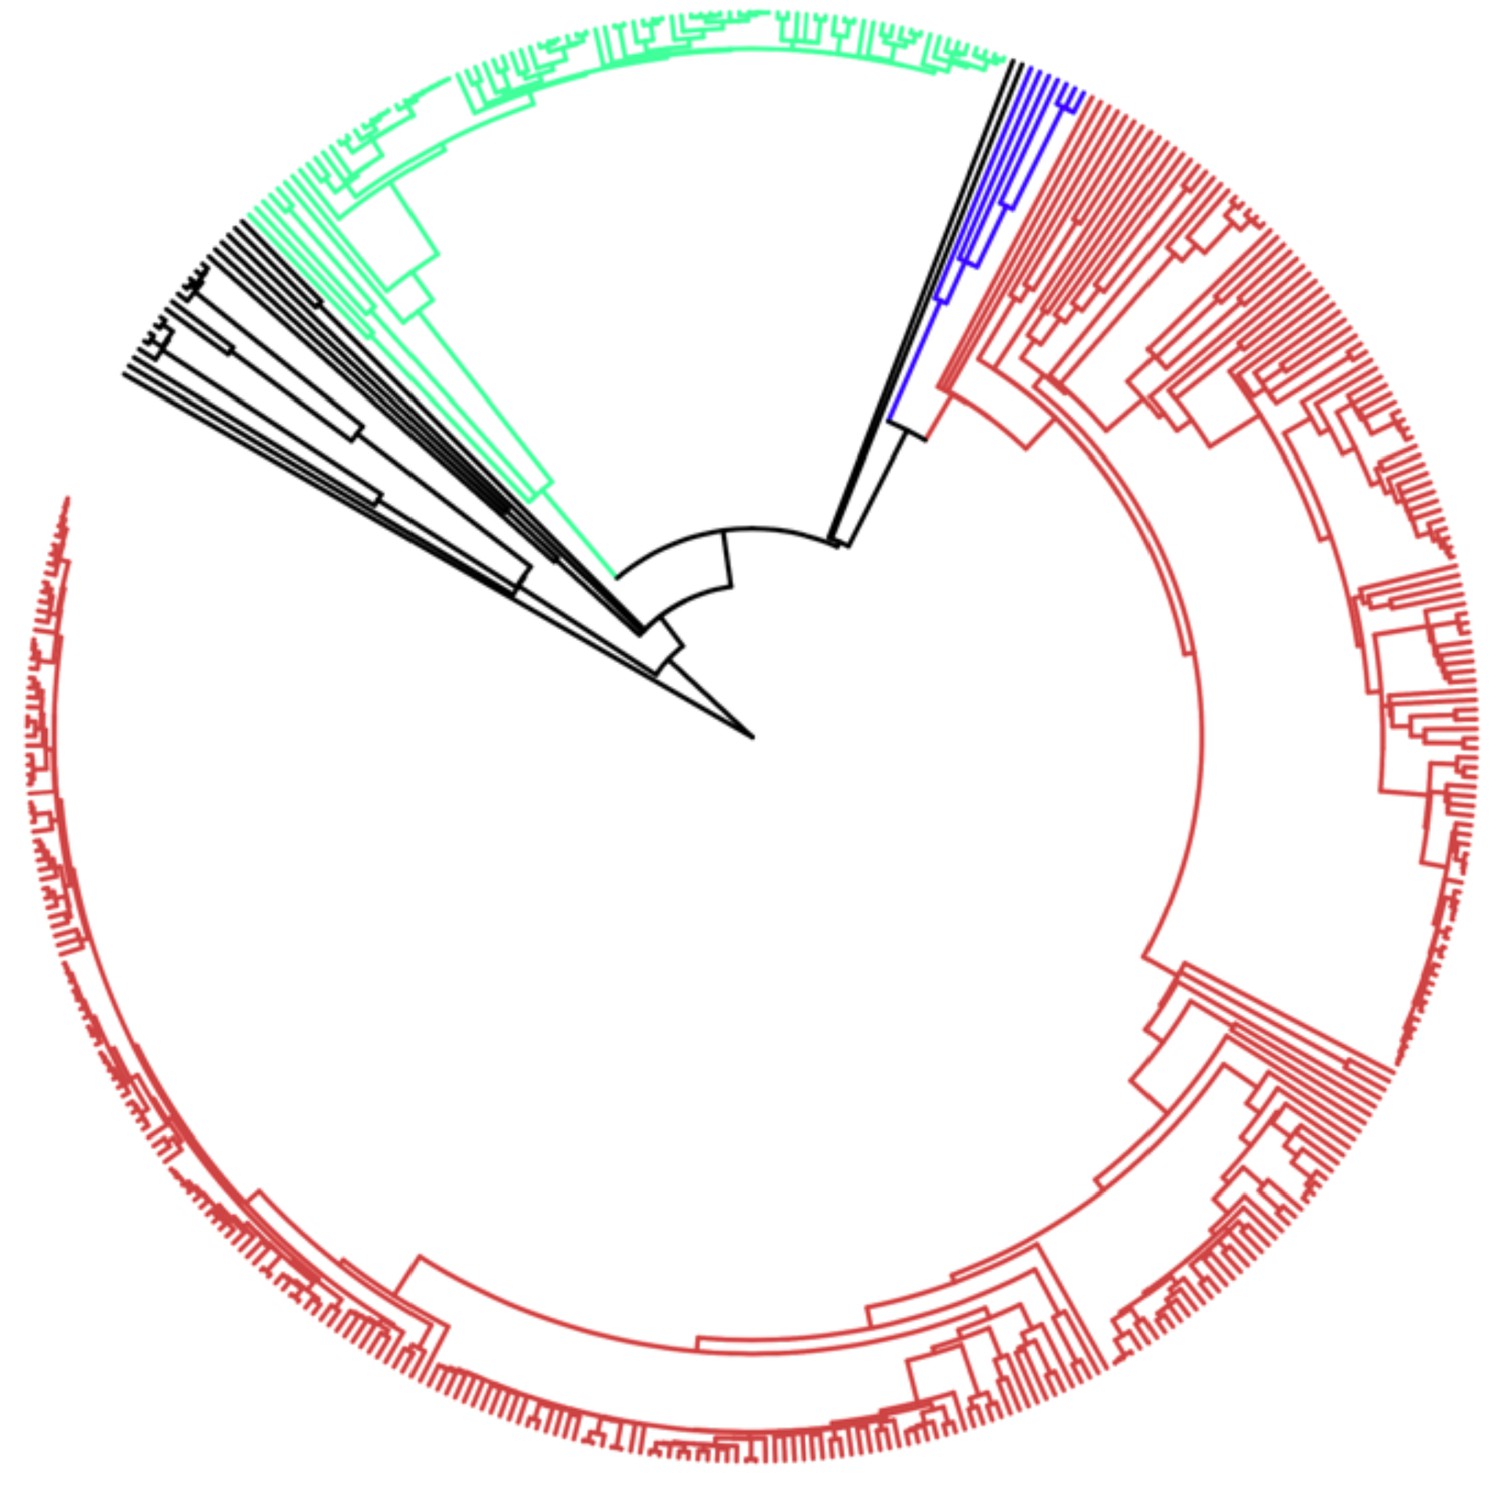
Phylogenetic tree of all species used in this analysis.
Lineages have been color coded as follows: black, protists; green, plants; blue, fungi; brown; animals. Labels omitted for clarity, full species list and phylogenetic tree available at https://github.com/MaselLab/ProteinEvolution and https://doi.org/10.6084/m9.figshare.12037281. Tree visualization generated using iTOL (Letunic and Bork, 2006).
Figure 1—figure supplement 2

Intrinsic structural disorder (ISD) depends on age for whole genes, as previously reported by Foy et al., 2019.
Each data point consists of the average across all instances of a homologous gene family (see Materials and methods) across all species (A) or just in mouse (B), dated according to the oldest pfam the gene contains. Each age class is represented by a weighted box plot, where the width of the plot indicates the number of gene families in that age class. The median is shown in red, with the boxes representing upper and lower quartiles (the 75th and 25th percentile), and the whiskers indicating 9 and 91 quantiles. For age classes with only a single gene family, values are presented as small red dots. For clarity of presentation our plots do not show outliers, although we note that these are included in our linear regression models. (A) Blue slope = −0.032, R2 = 0.057, p = 1 × 10−229. (B) Blue slope = −0.050, R2 = 0.091, p = 3 × 10−85. Slope represents the decrease in average IUPred2 score, that is, the predicted propensity of the average amino acid to be disordered, per billion years. Yellow points show the average ISD scores and phylostratum assignments taken from Foy et al., 2019 and assigned dates using our scheme, with corresponding yellow linear regression with age (slope = −0.028, R2 = 0.042, p = 3 × 10−136). Our improved gene age assignments thus increased the strength of the relationship for mouse genes, where the relationship is stronger than for genes across all taxa.
Figure 1—figure supplement 3
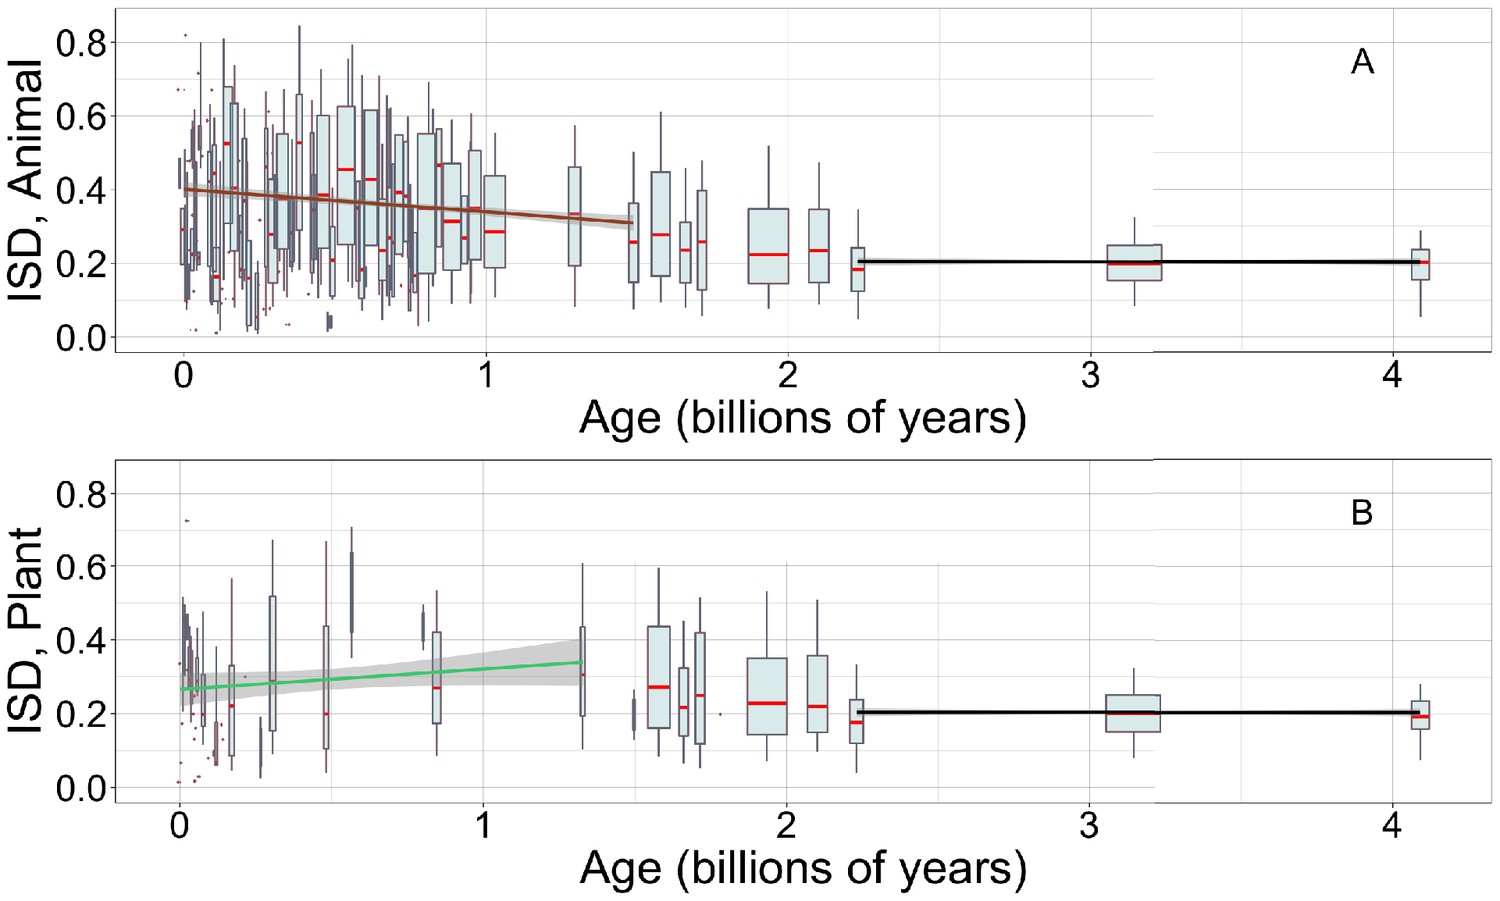
Young animal domains have high intrinsic structural disorder (ISD), while we have limited power to detect trends in young plant domains.
Linear regressions are calculated over recent animal (A, brown line) or recent plant domains (B, green line), and over ancient pfams (black lines), specific to occurrences in either animals (A) or plants (B). Gray areas indicate 95% confidence intervals on the linear regression slopes, which are so small for the ancient slope as to be difficult to see. Y-axes are cropped for easier comparison of slopes. Other details are as in Figure 1A.
Figure 1—figure supplement 4
Recalculating intrinsic structural disorder (ISD) after excising cysteine residues has very little effect on our results.
Details are as in Figure 1. Regression calculated for recent animal pfams (brown slope = −0.073, R2 = 0.014, p = 3 × 10⁻⁹), recent plant pfams (green slope = 0.013, p = 0.7), and ancient pfams in all lineages (black slope = −0.016, R2 = 0.0016, p = 0.014).
Figure 2 with 1 supplement
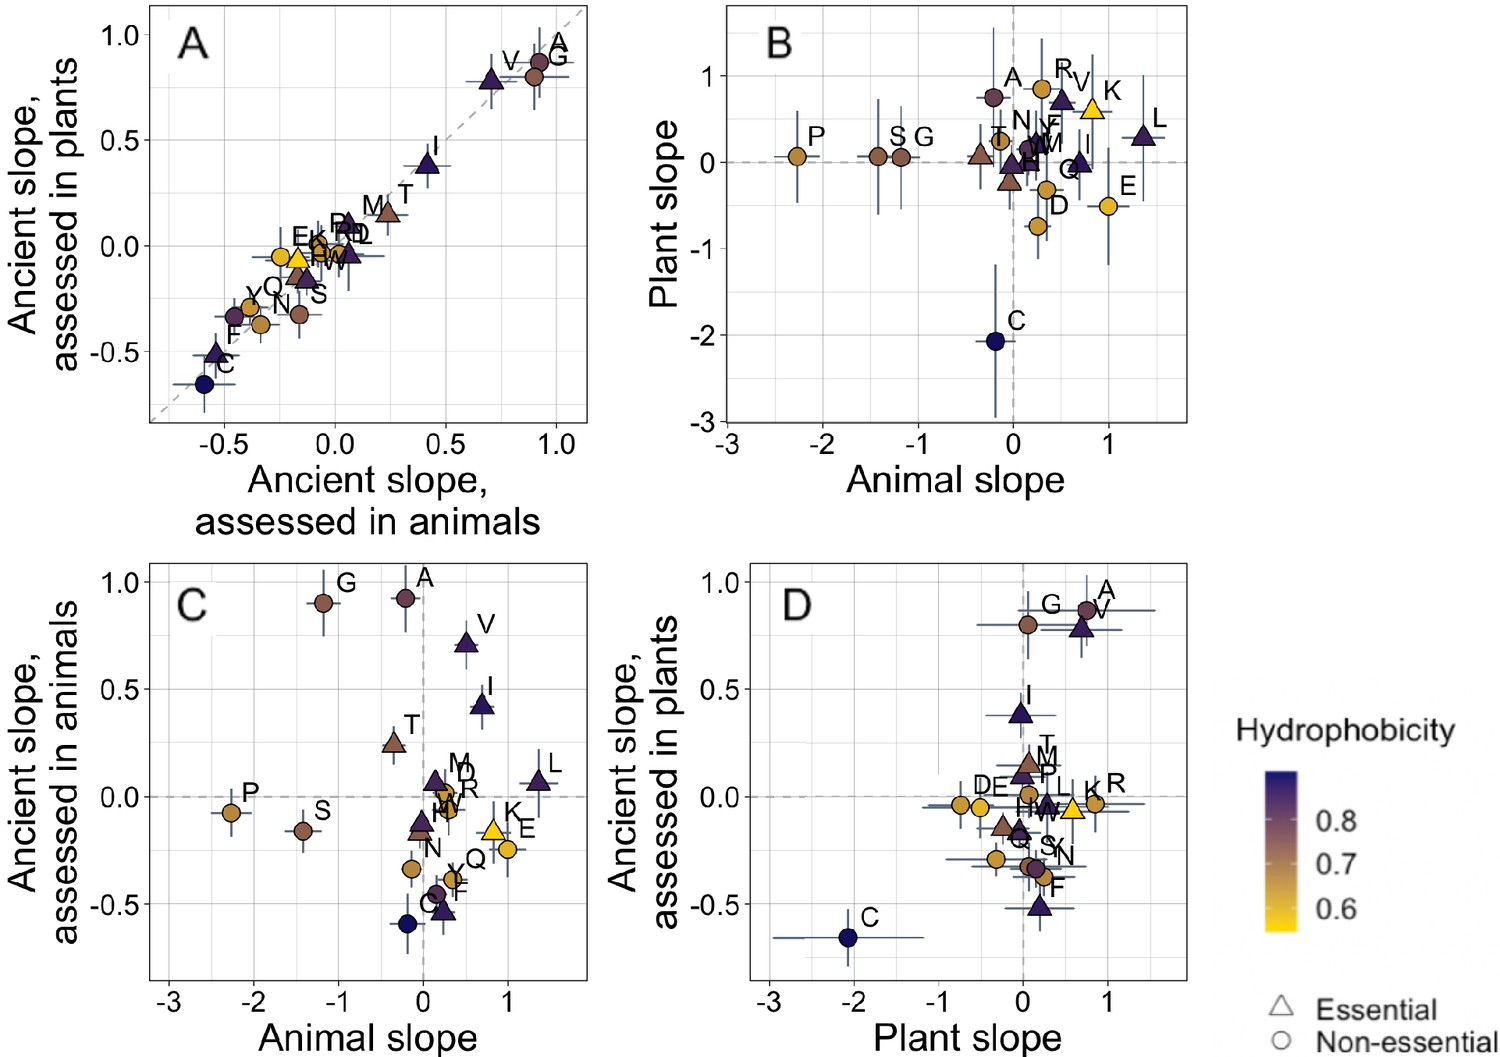
Trends in amino acid frequencies as a function of age differ across lineages.
Results are shown for non-transmembrane pfams. Phylostratigraphy slopes are in units of the change in percentage points of an amino acid per billion years. ‘Ancient’ refers to pfams older than 2101 MY, assessed in only plant or only animal instances, whereas ‘plant’ and ‘animal’ slopes are calculated over pfams appearing after the divergence between the animal/fungi and plant lineages, 1496 MY, again assessed in only plant or only animal instances. Lines indicate the standard errors on the slopes. Points are color-coded by their hydrophobicity, as measured by 1-mean relative solvent accessibility (RSA) (Tien et al., 2013), such that buried, hydrophobic amino acids are dark purple, and exposed, hydrophilic amino acids are yellow. RSA scores are based on the water-accessible surface area of amino acids in a training set of proteins of known structure. Amino acid shapes indicate whether they are essential in animals. In (A), y=x is shown as a dashed line, in all other plots dashed lines for x=0 and y=0 are shown for clarity. In (A), Spearman’s ρ = 0.94, p = 6 × 10⁻⁶. Spearman correlations for (B), (C), and (D) are not significant (p = 0.8, 0.8, and 0.2, respectively).
Figure 2—figure supplement 1
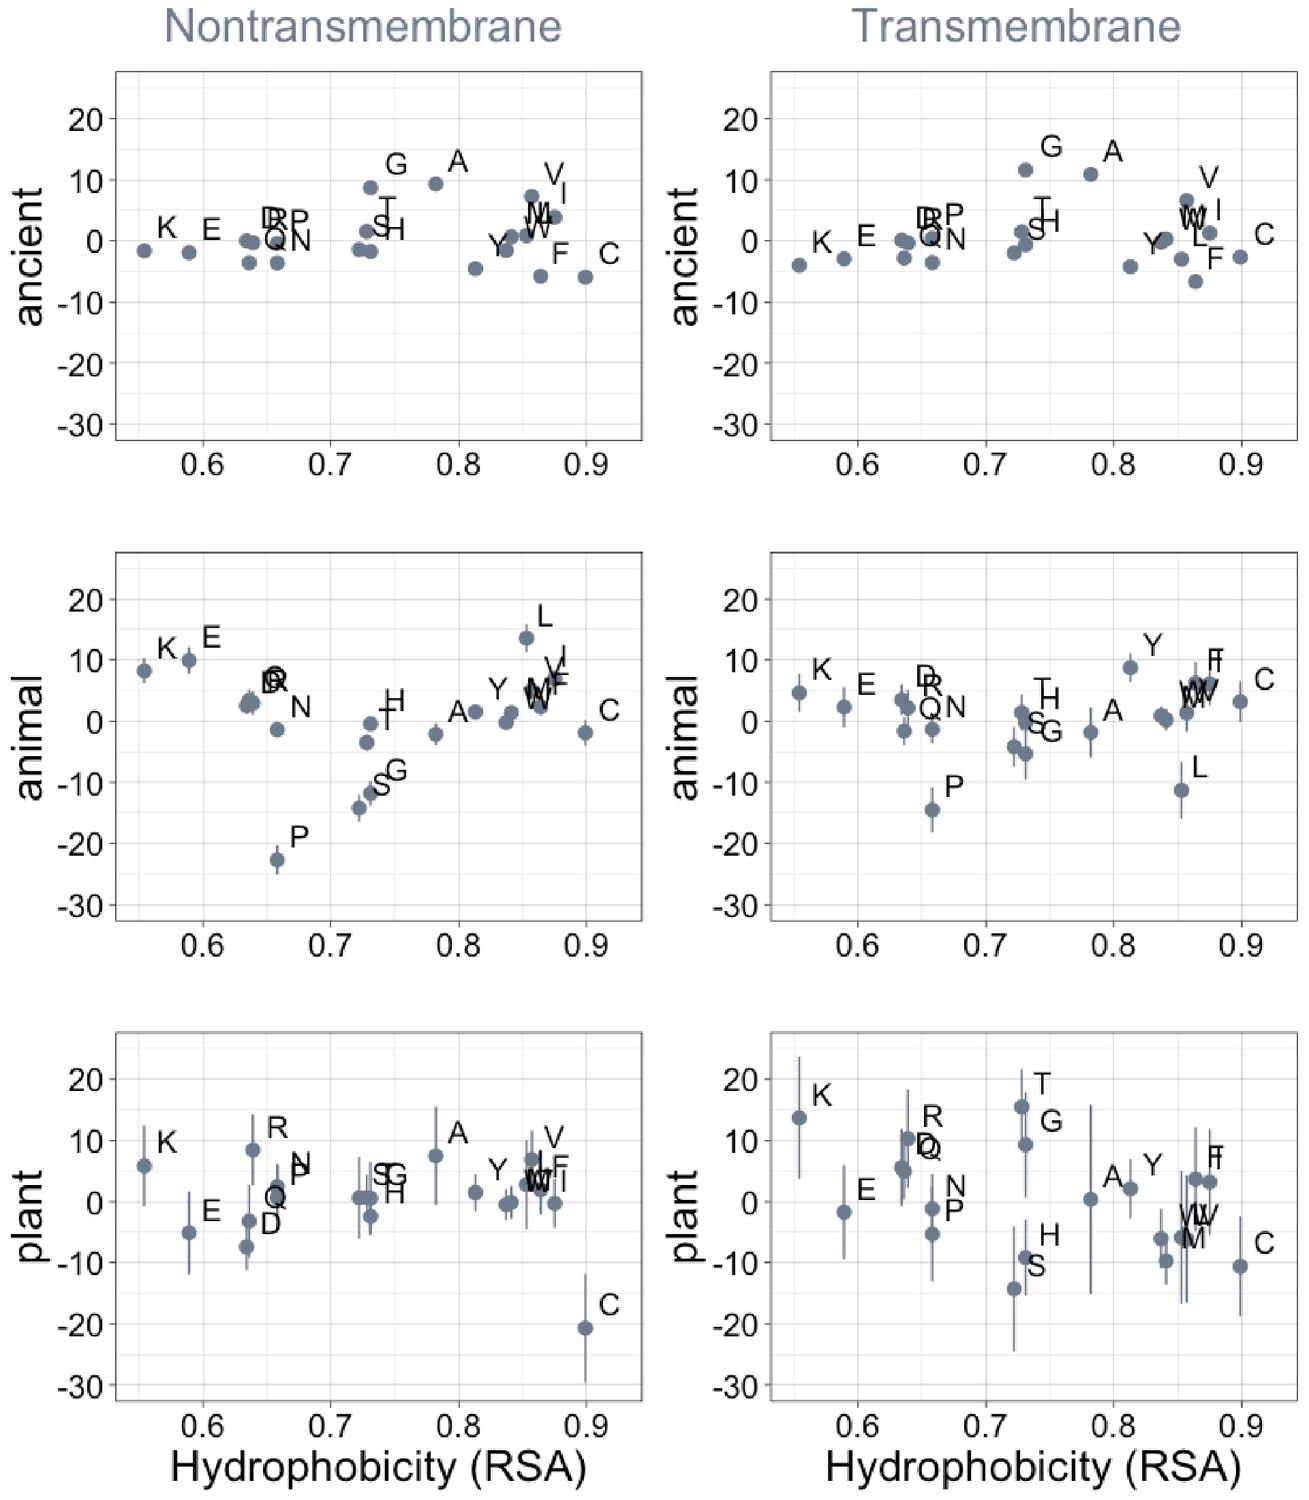
Phylostratigraphy slopes are not significantly correlated with hydrophobicity, as measured by 1-relative solvent accessibility (RSA) (Tien et al., 2013).
Phylostratigraphy slopes are in units of percentage points of composition per billion years. Lines indicate the standard errors on the slopes. ‘Ancient’ refers to pfams older than 2101 MY (nontransmembrane and transmembrane, Spearman’s p = 0.7 and 0.5), calculated over all lineages, whereas ‘animal’ (nontransmembrane and transmembrane, Spearman’s p = 0.8 and 0.6) and ‘plant’ (nontransmembrane and transmembrane, Spearman’s p = 0.9 and 0.05) slopes are calculated over pfams appearing after the divergence between the animal/fungi and plant lineages, 1496 MY, assessed in only animal or only plant instances.
Figure 3 with 2 supplements
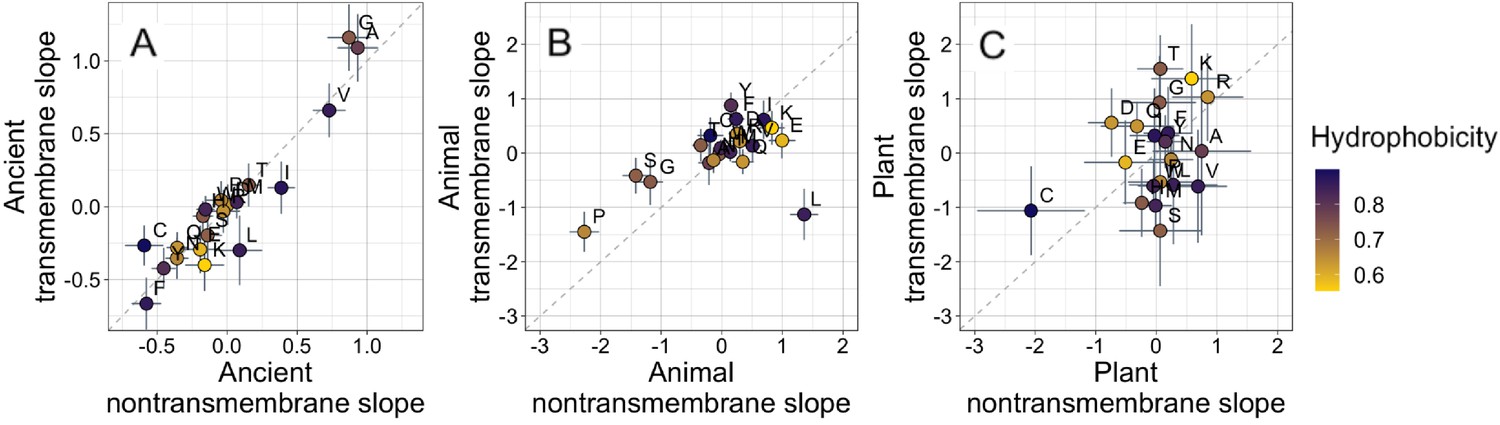
Ancient domains exhibit similar amino acid trends, whether transmembrane or non-transmembrane.
Phylostratigraphy slopes are in units of percentage point change in composition per billion years. Taxonomic and temporal sub sets of the data are as the same as in Figure 2. Lines indicate the standard errors on the slopes. Points are color-coded by their hydrophobicity, as measured by 1-relative solvent accessibility (RSA) (Tien et al., 2013), such that buried, hydrophobic amino acids are dark blue, and exposed, hydrophilic amino acids are yellow. In all plots, y=x is shown as a dashed line. Congruence is strong for ancient pfams in (A) (Spearman’s ρ = 0.83, p = 5 × 10⁻⁶), weakly significant for animal-specific pfams in (B) (p = 0.06) where transmembrane trends tend to be weaker and leucine is an outlier, and not detectable in our weakly powered plant-specific data set in (C) (p = 0.3).
Figure 3—figure supplement 1
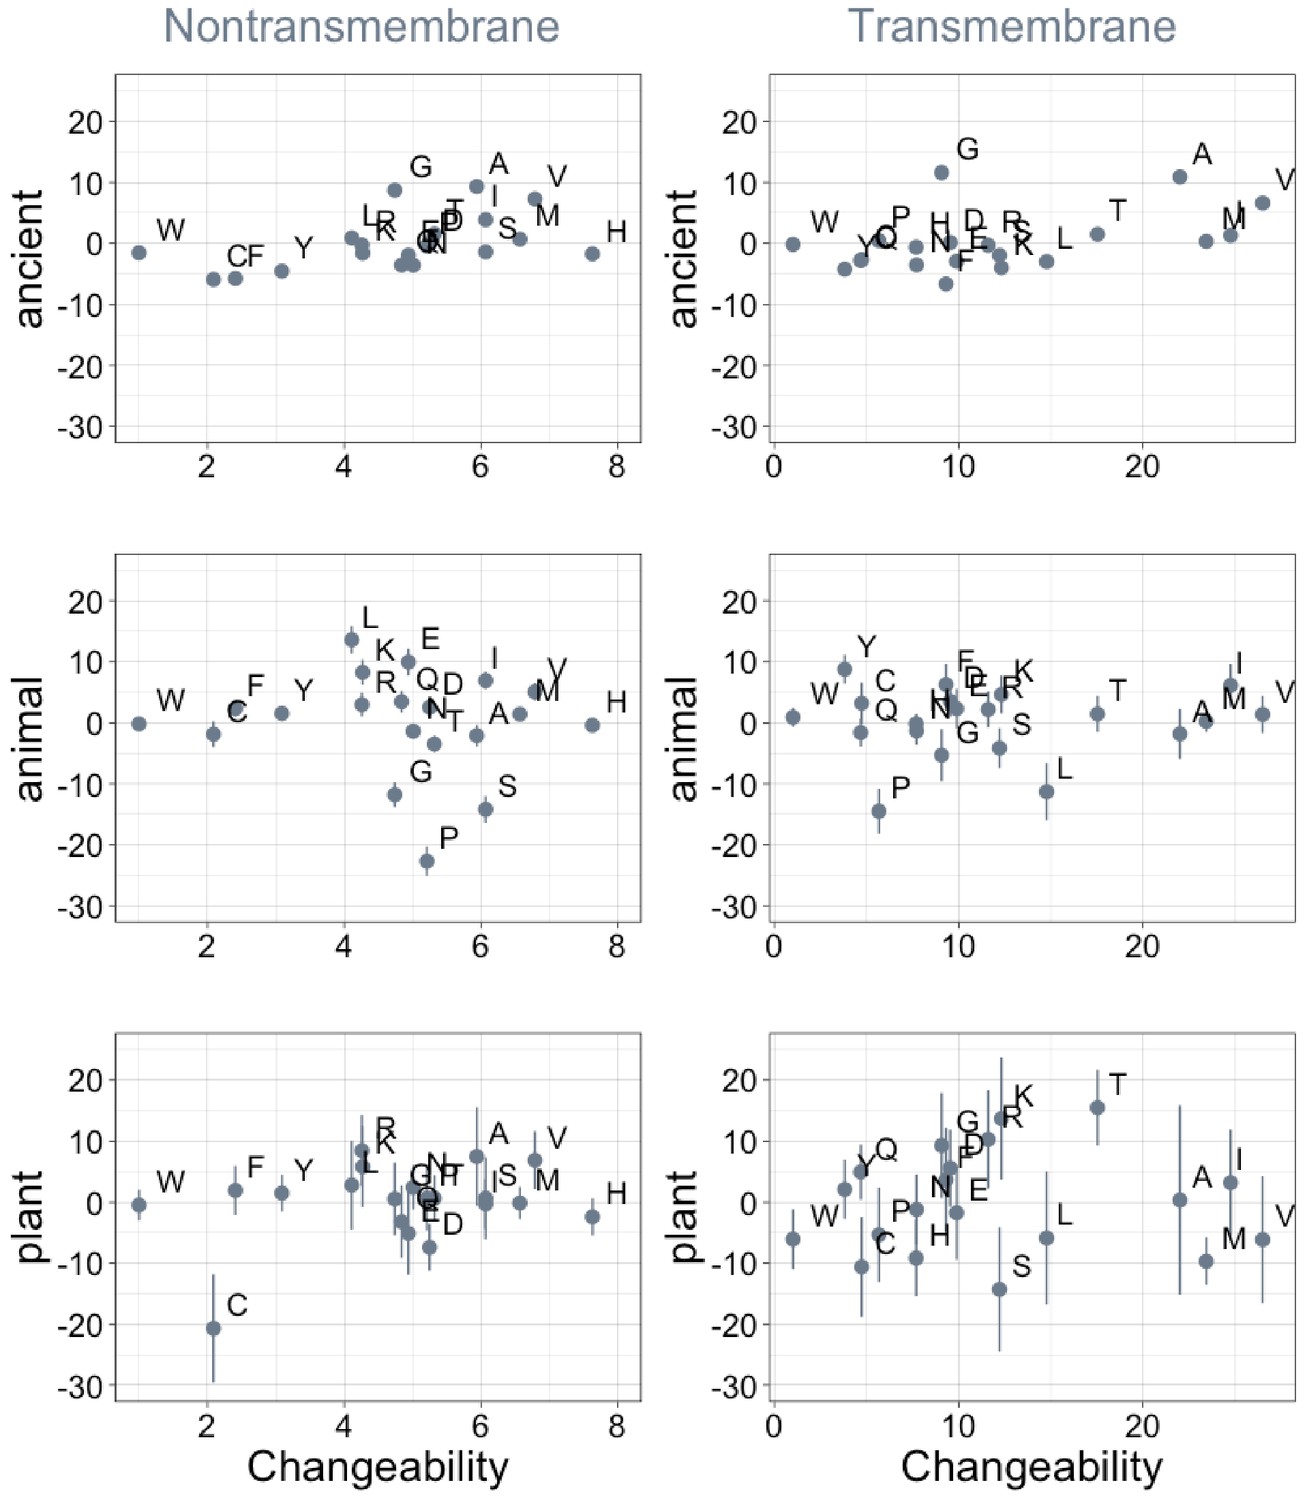
Phylostratigraphy slopes are not significantly correlated (after correction for multiple testing) with relative amino acid changeability.
Changeability scores are relative to the least changeable amino acid, tryptophan (W), which (Tourasse and Li, 2000) assigned a value of 1 in both the transmembrane and the non-transmembrane cases. Larger absolute changeability scores for transmembrane residues may therefore reflect low changeability of tryptophan, rather than higher changeability across the board. Phylostratigraphy slopes are in units of percentage points of composition per billion years. Insofar as changeability predicts phylostratigraphy slopes, especially for ancient trends, the relationship goes in the opposite direction to that predicted by homology detection bias. Lines indicate the standard errors on the slopes. ‘Ancient’ refers to pfams older than 2101 MY (nontransmembrane Spearman’s ρ = 0.50, p = 0.02; transmembrane ρ = 0.40, p = 0.08), calculated over all lineages, whereas ‘animal’ (nontransmembrane and transmembrane Spearman’s p = 0.53 and 0.9) and ‘plant’ (nontransmembrane and transmembrane Spearman’s p = 1.0 and 0.8) slopes are calculated over pfams appearing after the divergence between the animal/fungi and plant lineages, 1496 MY, assessed in only animal or only plant instances.
Figure 3—figure supplement 2
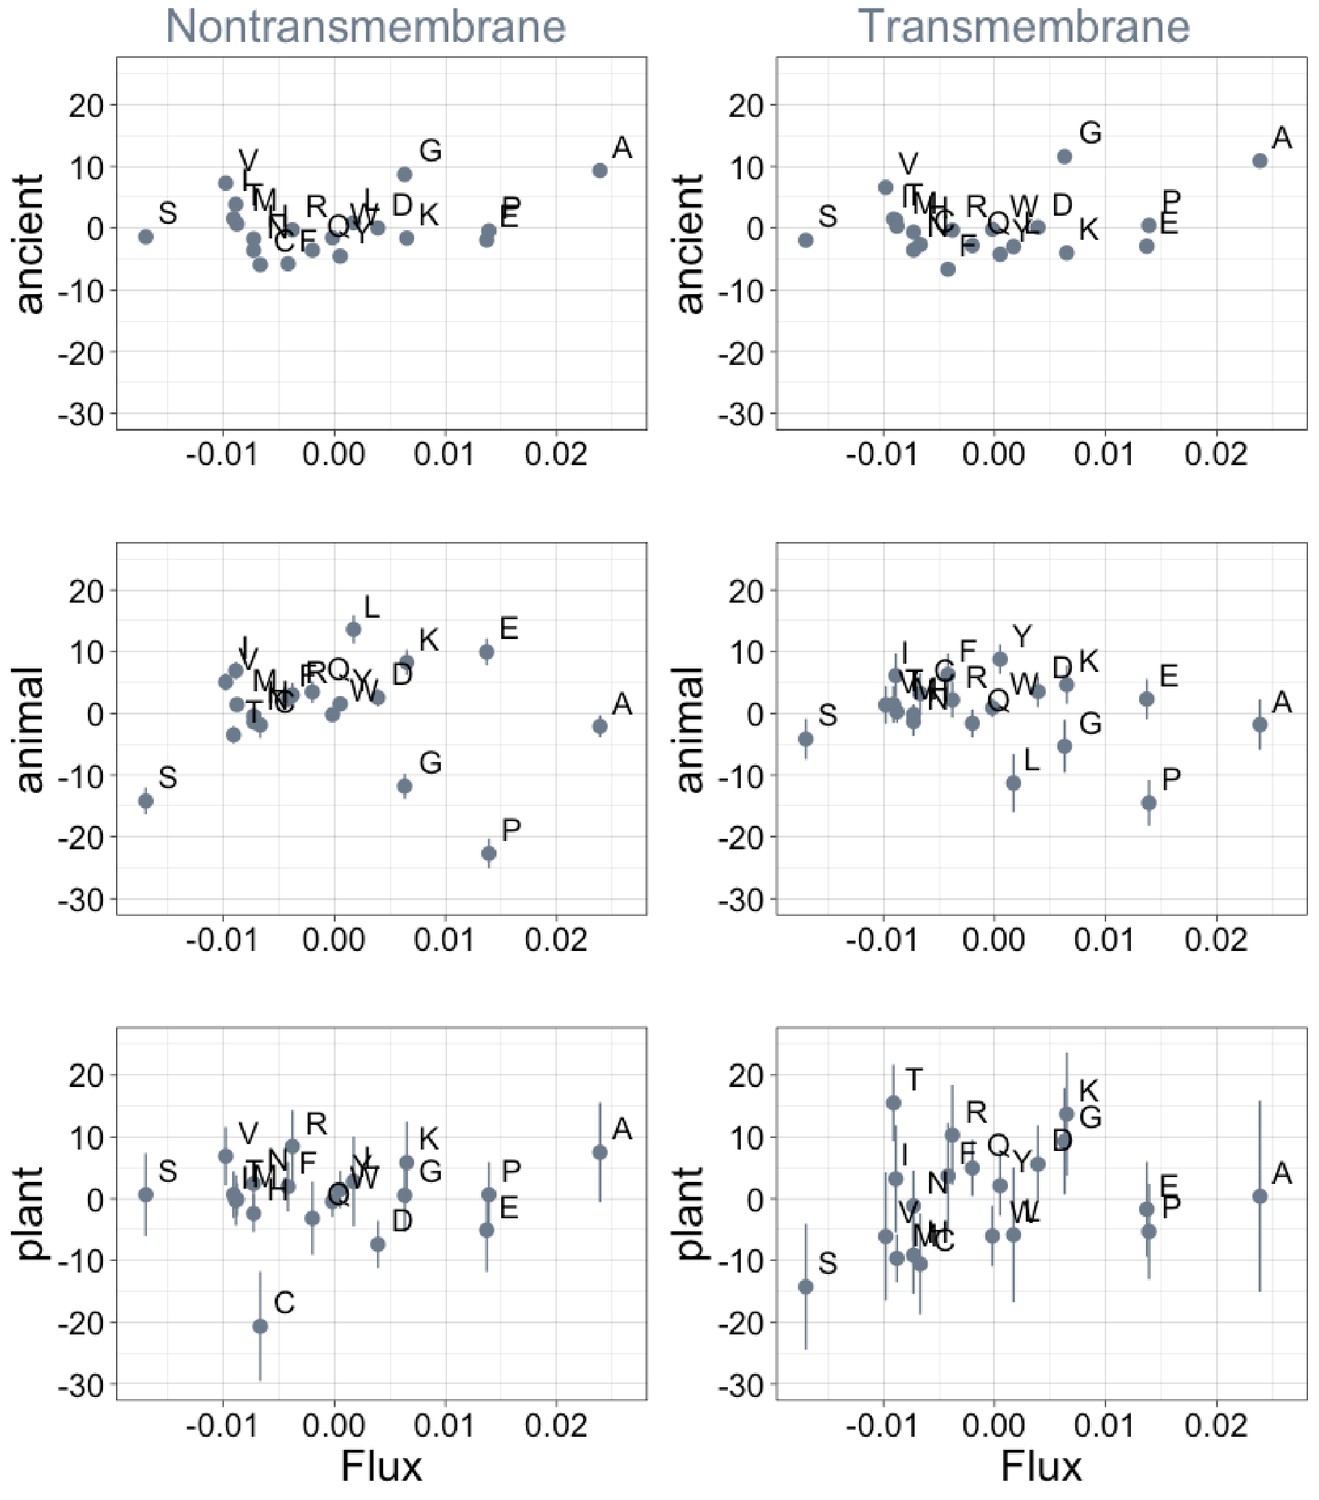
Phylostratigraphy slopes are not significantly correlated with the amino acid flux estimates of Jordan et al., 2005.
Phylostratigraphy slopes are in units of percentage points of composition per billion years. Lines indicate the standard errors on the slopes. ‘Ancient’ refers to pfams older than 2101 MY (nontransmembrane and transmembrane, Spearman’s p = 1.0 and 0.7), calculated over all lineages, whereas ‘animal’ (nontransmembrane and transmembrane, Spearman’s p = 0.7 and 0.6) and ‘plant’ (nontransmembrane and transmembrane, Spearman’s p = 0.9 and 0.2) slopes are calculated over pfams appearing after the divergence between the animal/fungi and plant lineages, 1496 MY, assessed in only animal or only plant instances.
Figure 4 with 2 supplements
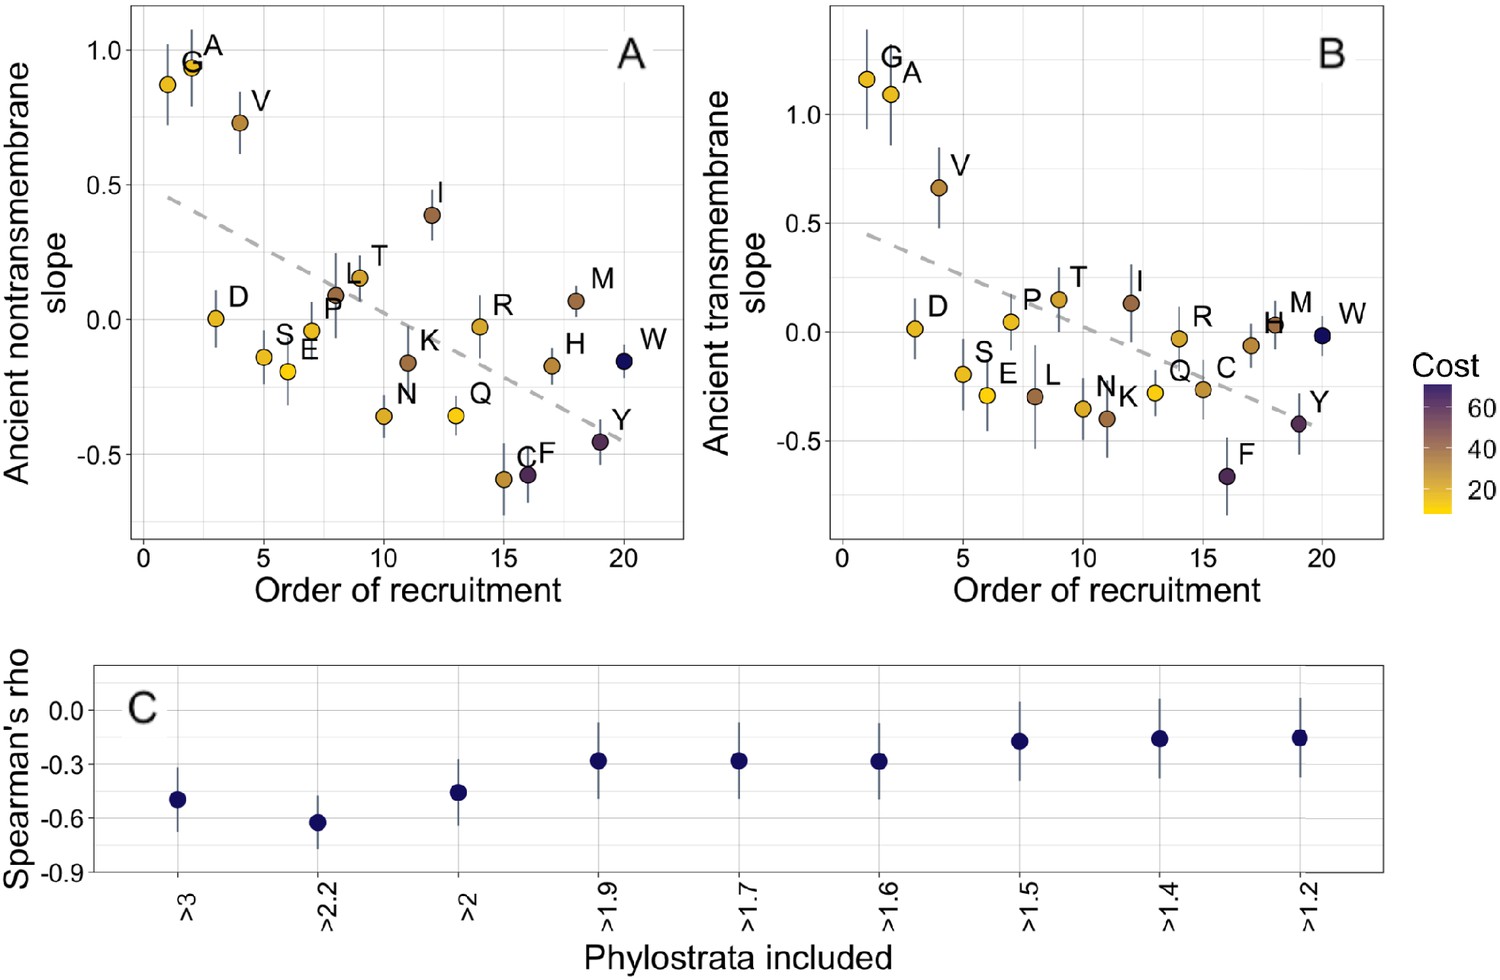
Ancient amino acid phylostratigraphy slopes reflect the order of recruitment of amino acids into the genetic code.
Phylostratigraphy slopes for non-transmembrane (A) and transmembrane (B) pfams are in units of percentage points of composition per billion years, with lines indicating the standard errors on the slopes. Phylostratigraphy slopes for ancient pfams are calculated over all lineages, and include all pfams over 2101 MY. Consensus order is modified from Trifonov, 2000 (see description in Results) and is given as rank data, such that the first amino acid to be recruited is given a rank of 1. Regression slopes are shown as dashed lines. Late-recruited amino acids are rare in the most ancient non-transmembrane pfams (A) (Spearman’s ρ = −0.58, p = 0.008) and transmembrane pfams (B) (Spearman’s ρ = −0.47, p = 0.04). Points are color-coded by their metabolic costliness to produce (measured as the number of high energy phosphate bonds required for synthesis, plus the energy lost due to the precursors used in the synthesis), as estimated for aerobic conditions in yeast (Raiford et al., 2008), such that the most costly amino acids are blue, and the least costly are yellow. (C) The correlation (Spearman’s ρ) between amino acid phylostratigraphy slope and order of recruitment over different subsets of our data set. X-axis labels indicate the minimum age of pfams included, in billion years. Lines are the standard errors of the Spearman’s ρ values, calculated using the Fisher transformation (Fisher, 1915).
Figure 4—figure supplement 1
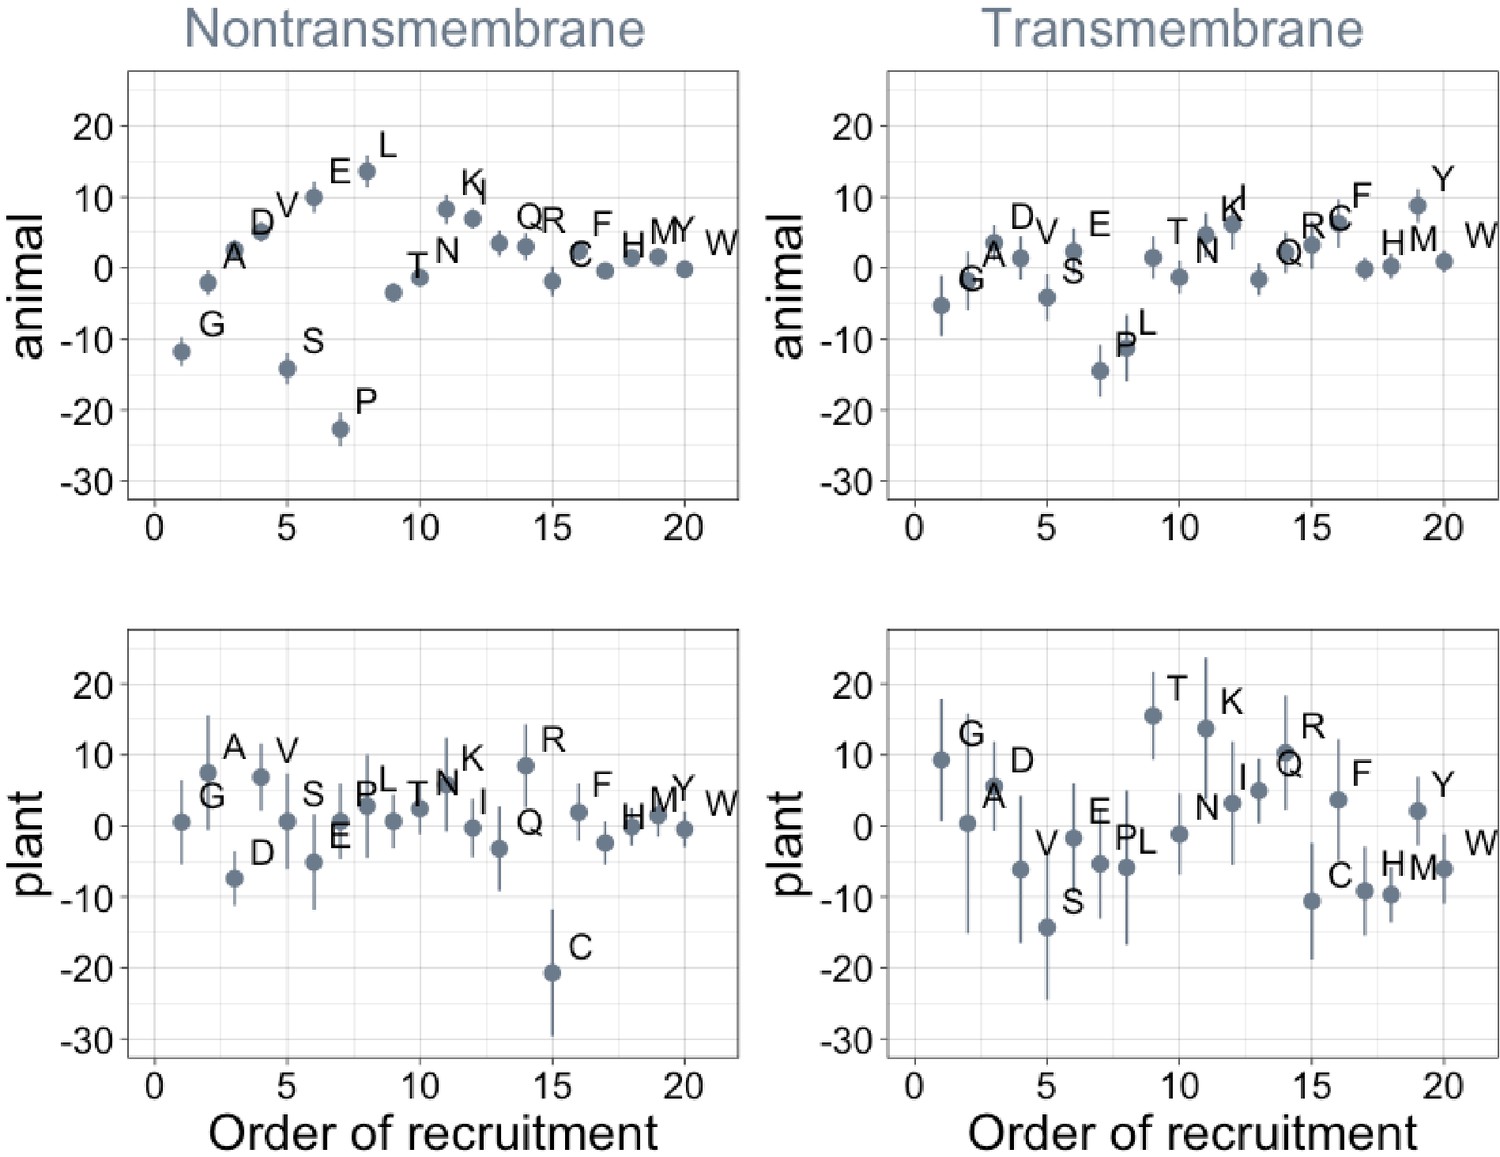
Order of amino acid recruitment does not affect domain composition in more recent lineages.
Phylostratigraphy slopes are in units of percentage points of composition per billion years. Lines indicate the standard errors on the slopes. ‘Animal’ (nontransmembrane and transmembrane Spearman’s p = 0.6 and 0.07) and ‘plant’ (nontransmembrane and transmembrane Spearman’s ρ = 0.5 and 0.5) slopes are calculated over pfams appearing after the divergence between the animal/fungi and plant lineages, 1496 MY, assessed in only animal or only plant instances.
Figure 4—figure supplement 2
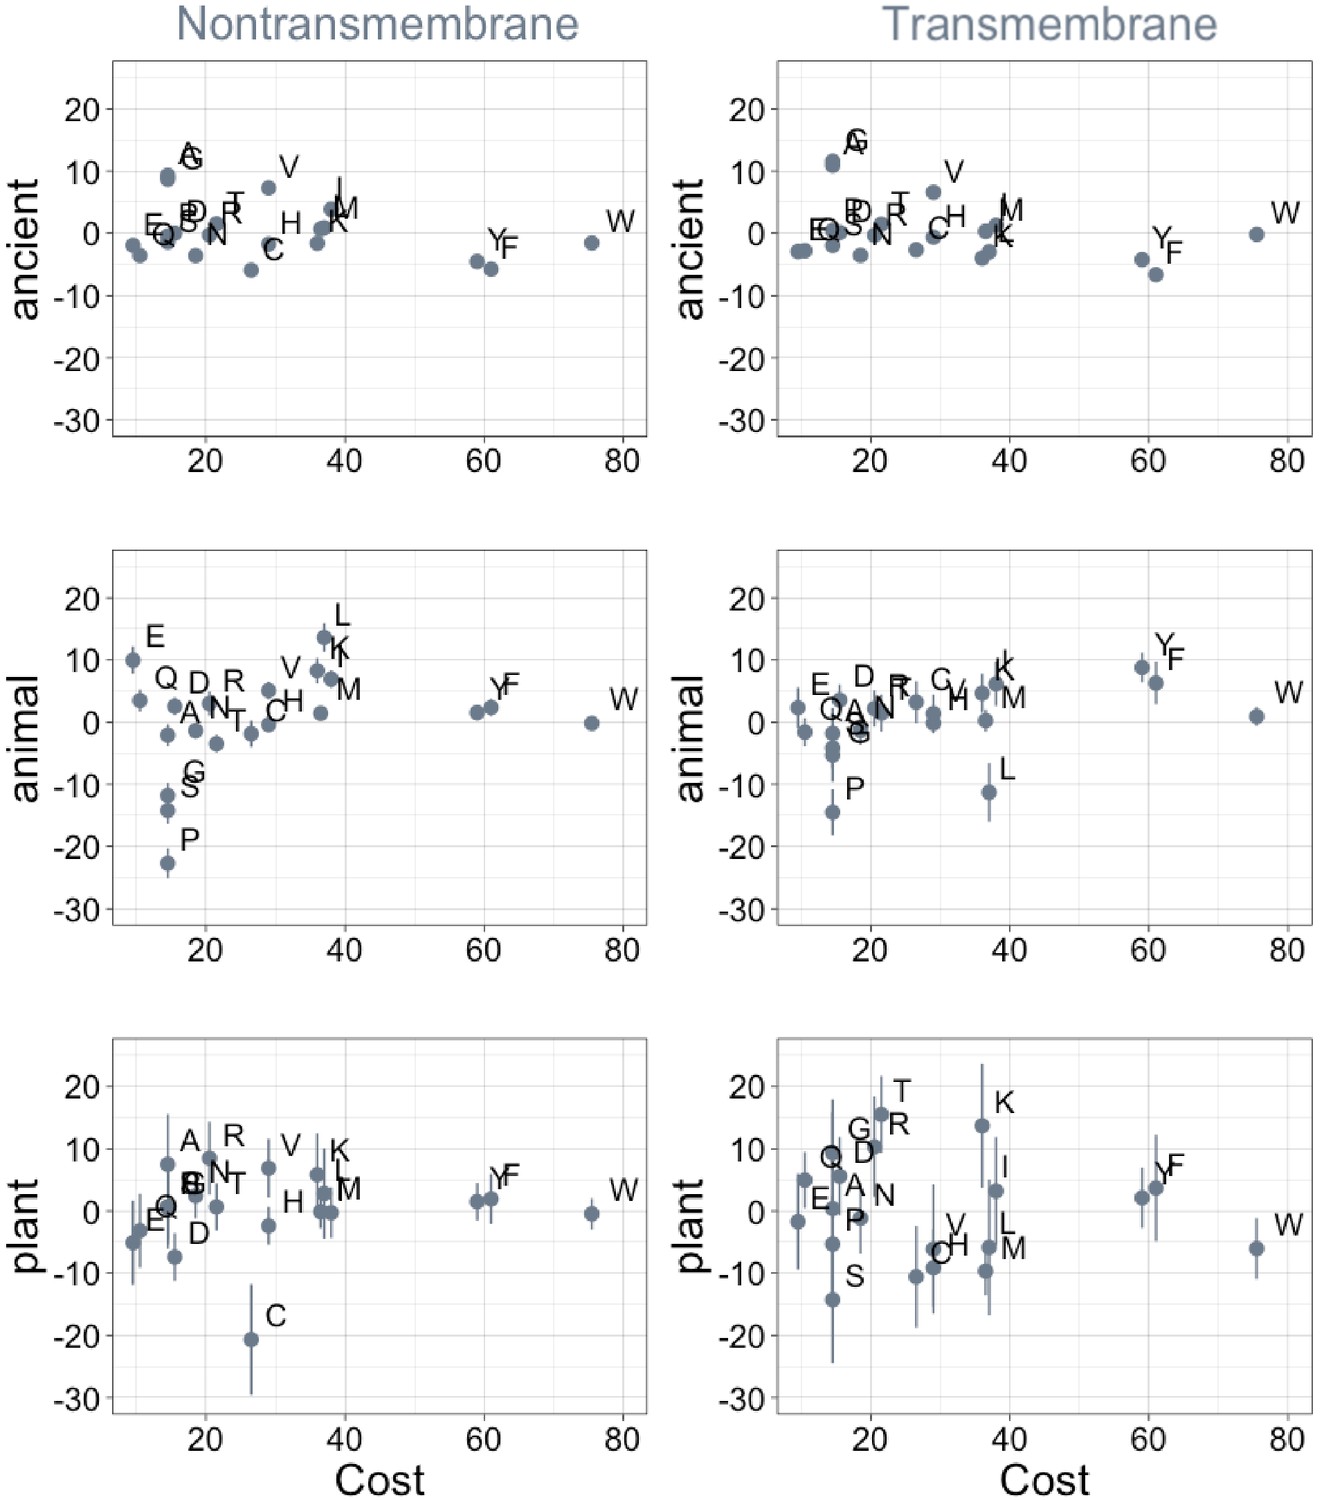
Phylostratigraphy slopes are not significantly correlated (after correction for multiple testing) to the cost of production of amino acids (aerobic metabolic cost, as estimated in yeast [Raiford et al., 2008]).
Phylostratigraphy slopes are in units of percentage points of composition per billion years, with lines indicating the standard errors on the slopes. ‘Ancient’ refers to pfams older than 2101 MY (nontransmembrane and transmembrane, Spearman’s p = 0.6 and 0.3), calculated over all lineages, whereas ‘animal’ (nontransmembrane and transmembrane, Spearman’s p = 0.2 and 0.03) and ‘plant’ (nontransmembrane and transmembrane, Spearman’s p = 0.5 and 0.7) slopes are calculated over pfams appearing after the divergence between the animal/fungi and plant lineages, 1496 MY, assessed in only animal or only plant instances.
Figure 5 with 2 supplements
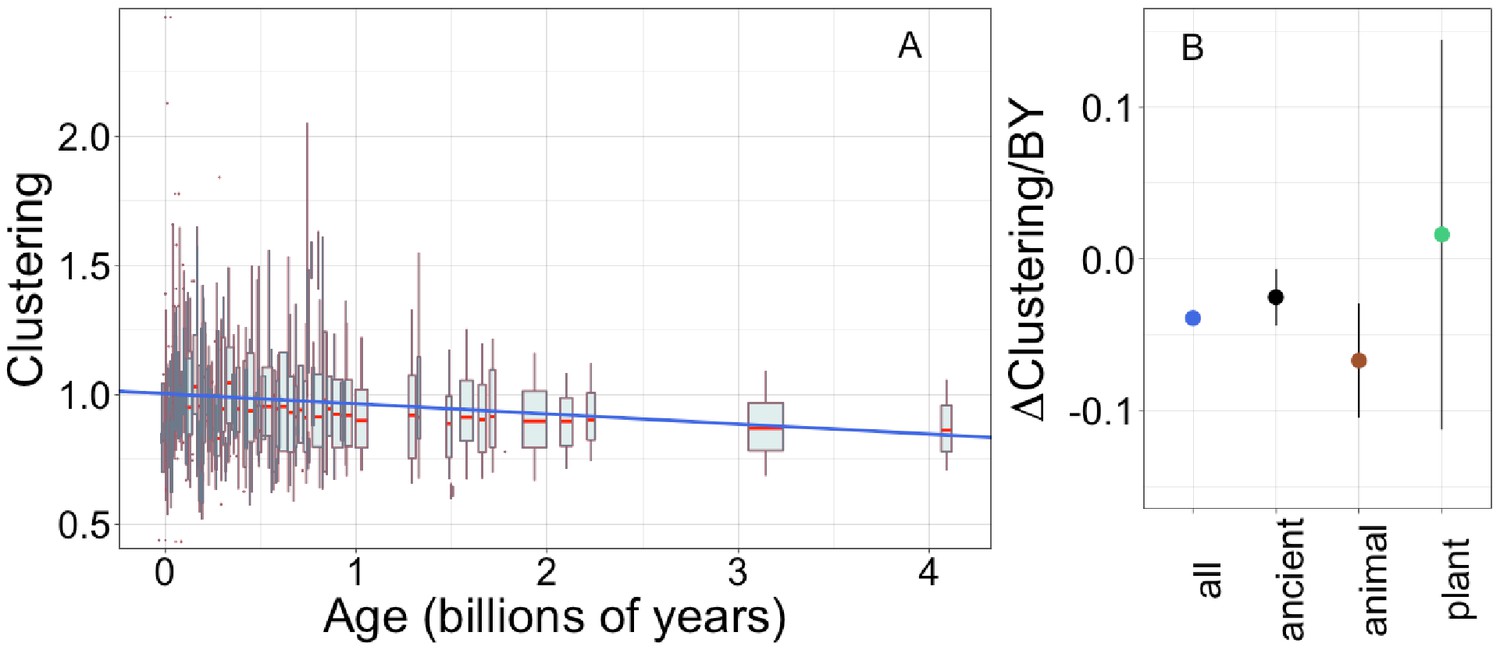
Young domains have more clustered hydrophobic amino acids (A), and the trend in clustering with age is consistent across time and taxonomic groups (B).
n (number of pfams) = 8002, 3100, 2456, and 183 for all, ancient, animal, and plant groups, respectively. Clustering has an expected value of 1 for randomly distributed amino acids. Results are shown for non-transmembrane pfams. (A) Each data point consists of the average across all homologous instances of a pfam, across all species in which the pfam occurs. Phylostratigraphy assigns these to age classes, dated using timetree. To visualize our results, every age class is represented by a weighted box plot, where the width of the plot indicates the number of pfams in that age class. The median is shown in red, with the boxes representing upper and lower quartiles (the 75th and 25th percentile), and the whiskers indicating 9 and 91 quantiles. For age classes with only a single pfam, values are presented as red dots. For clarity of presentation our plots do not show outliers, although these are included in our linear regression models. The blue line is the linear regression slope calculated over all lineages. Slope = −0.039, R2 = 0.030, p = 3 × 10−54. Slope represents the average decrease in clustering score per billion years. (B) Phylostratigraphy slopes (in units of change in clustering per billion years) for pfams are calculated over different phylostrata subsets of the data (Figure 5—figure supplement 2), and shown with their 95% confidence intervals. The left-most point corresponds to the regression slope in (A).
Figure 5—figure supplement 1
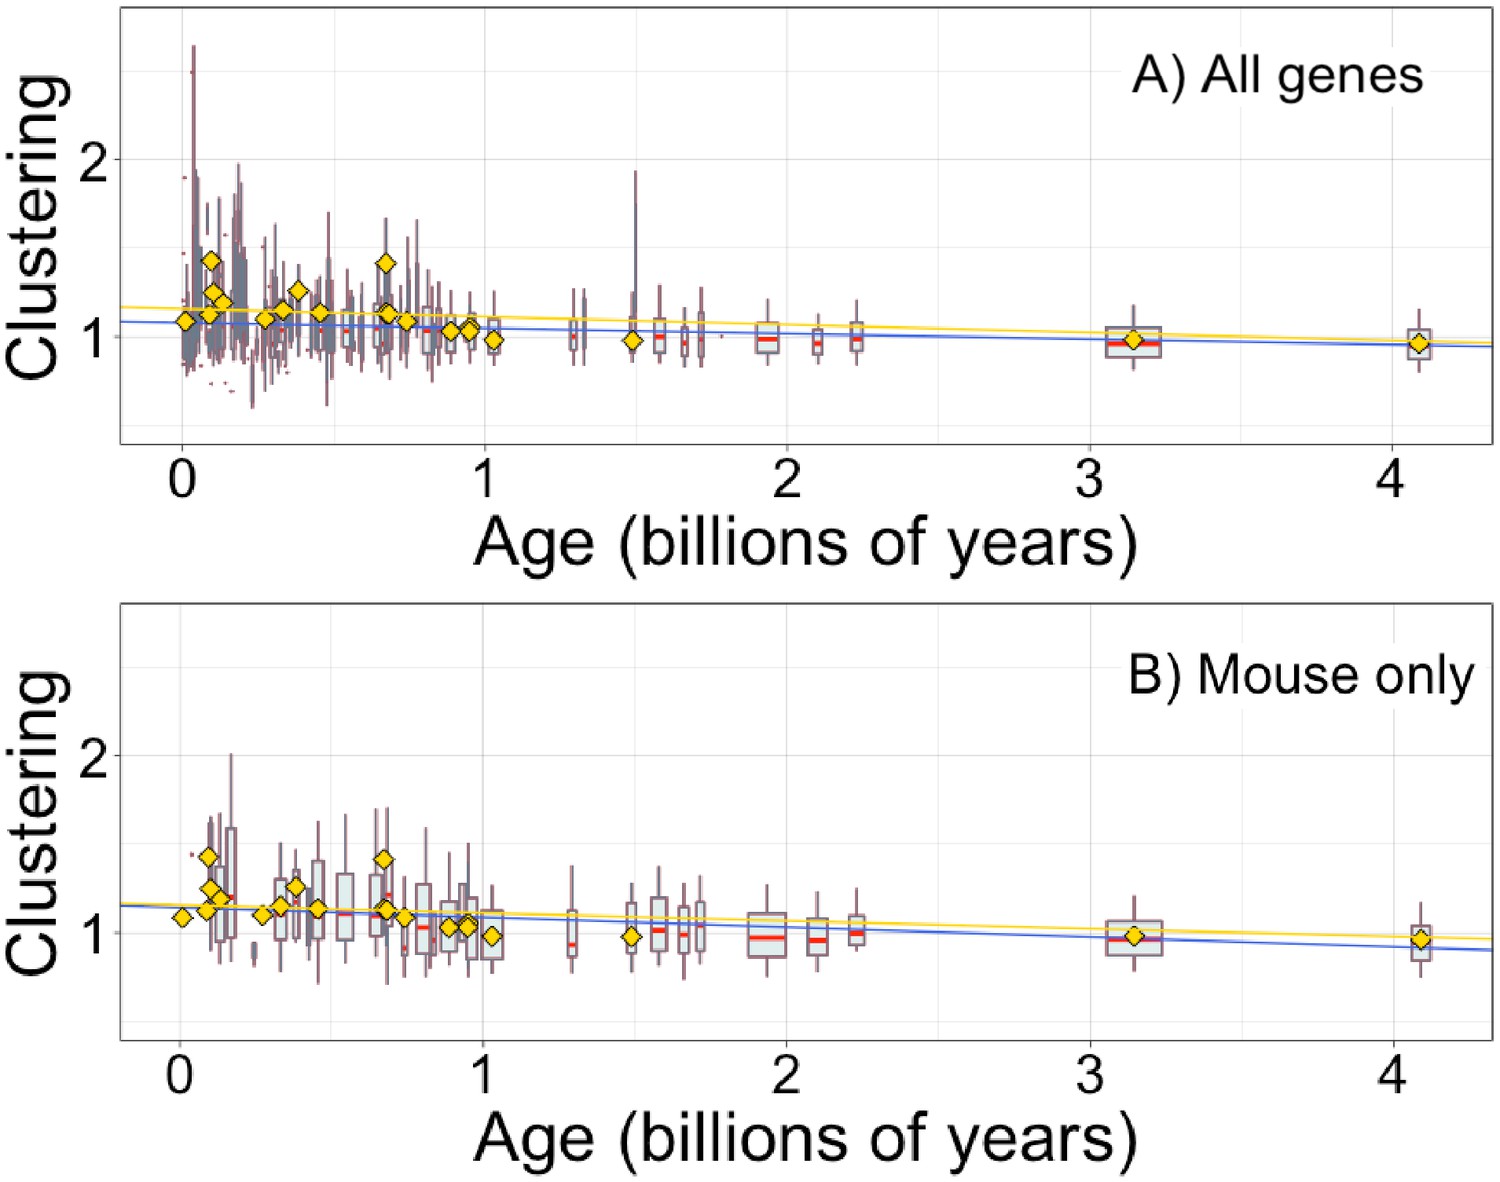
Hydrophobic clustering of complete genes depends on age, as previously reported by Foy et al., 2019.
Clustering has an expected value of 1 for randomly distributed amino acids. Each data point consists of the average across all instances of homologous pfams, across all species in which it occurs. Phylostratigraphy assigns these to age classes, dated using timetree. Each age class is represented by a weighted box plot, where the width of the plot indicates the number of pfams in that age class. The median is shown in red, with the boxes representing upper and lower quartiles (the 75th and 25th percentile), and the whiskers indicating 9 and 91 quantiles. For age classes with only a single pfam, values are presented as small red dots. For clarity of presentation our plots do not show outliers, although we note that these are included in our linear regression models. The relationship is a little weaker for all genes (A; blue linear regression slope = −0.031, R2 = 0.033, p = 5 × 10−132) than it is for genes found in mouse (B; blue linear regression slope = −0.056, R2 = 0.060, p = 4 × 10−56). In both plots, yellow points show the average clustering scores taken from Foy et al., 2019 mouse gene analysis, with corresponding yellow linear regression, slope = −0.045, R2 = 0.067, p = 8 × 10−221. Our improved gene age assignments thus increased the strength of the relationship for mouse genes, where the relationship is stronger than for genes across all taxa.
Figure 5—figure supplement 2
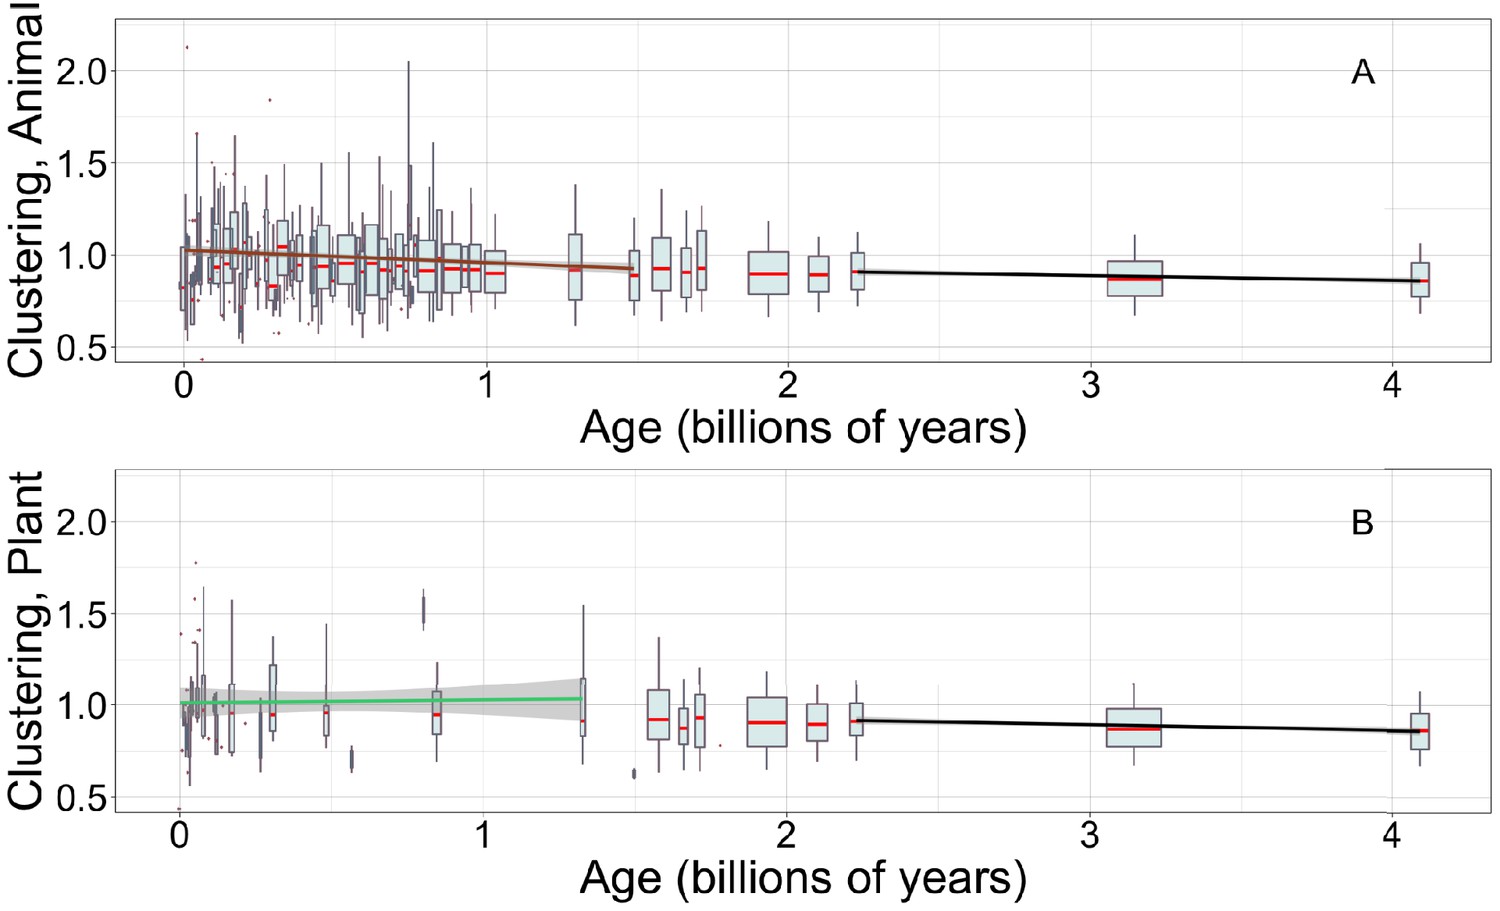
Young animal domains have more clustered hydrophobic amino acids, continuing the trend among ancient domains that can be seen in both animals and plants.
There is limited power to see trends among young plant domains. Linear regressions are calculated over recent animal (A, brown line) or recent plant domains (B, green line), and over ancient pfams (black lines), specific to occurrences in either animals (A) or plants (B). Gray areas indicate 95% confidence intervals on the linear regression slopes, which are so small for the ancient slope as to be difficult to see. Y-axes are cropped for easier comparison of slopes. Other details are as in Figure 5A.
Additional files
-
Supplementary file 1
Pfam amino acid frequency phylostratigraphy slopes, calculated over different subsets of the data.
- https://cdn.elifesciences.org/articles/57347/elife-57347-supp1-v2.xlsx
-
Supplementary file 2
The full set of species used in the analysis.
- https://cdn.elifesciences.org/articles/57347/elife-57347-supp2-v2.xlsx
-
Transparent reporting form
- https://cdn.elifesciences.org/articles/57347/elife-57347-transrepform-v2.docx
Download links
A two-part list of links to download the article, or parts of the article, in various formats.
Downloads (link to download the article as PDF)
Open citations (links to open the citations from this article in various online reference manager services)
Cite this article (links to download the citations from this article in formats compatible with various reference manager tools)
Universal and taxon-specific trends in protein sequences as a function of age
eLife 10:e57347.
https://doi.org/10.7554/eLife.57347


