Population-scale proteome variation in human induced pluripotent stem cells
- European Molecular Biology Laboratory, European Bioinformatics Institute, Wellcome Genome Campus, United Kingdom
- Centre for Gene Regulation & Expression, School of Life Sciences, University of Dundee, United Kingdom
- Wellcome Sanger Institute, United Kingdom
- King's College, United Kingdom
- European Molecular Biology Laboratory, Genome Biology Unit, Germany
- Division of Computational Genomics and Systems Genetic, German Cancer Research Center, Germany
Figures
Figure 1 with 6 supplements
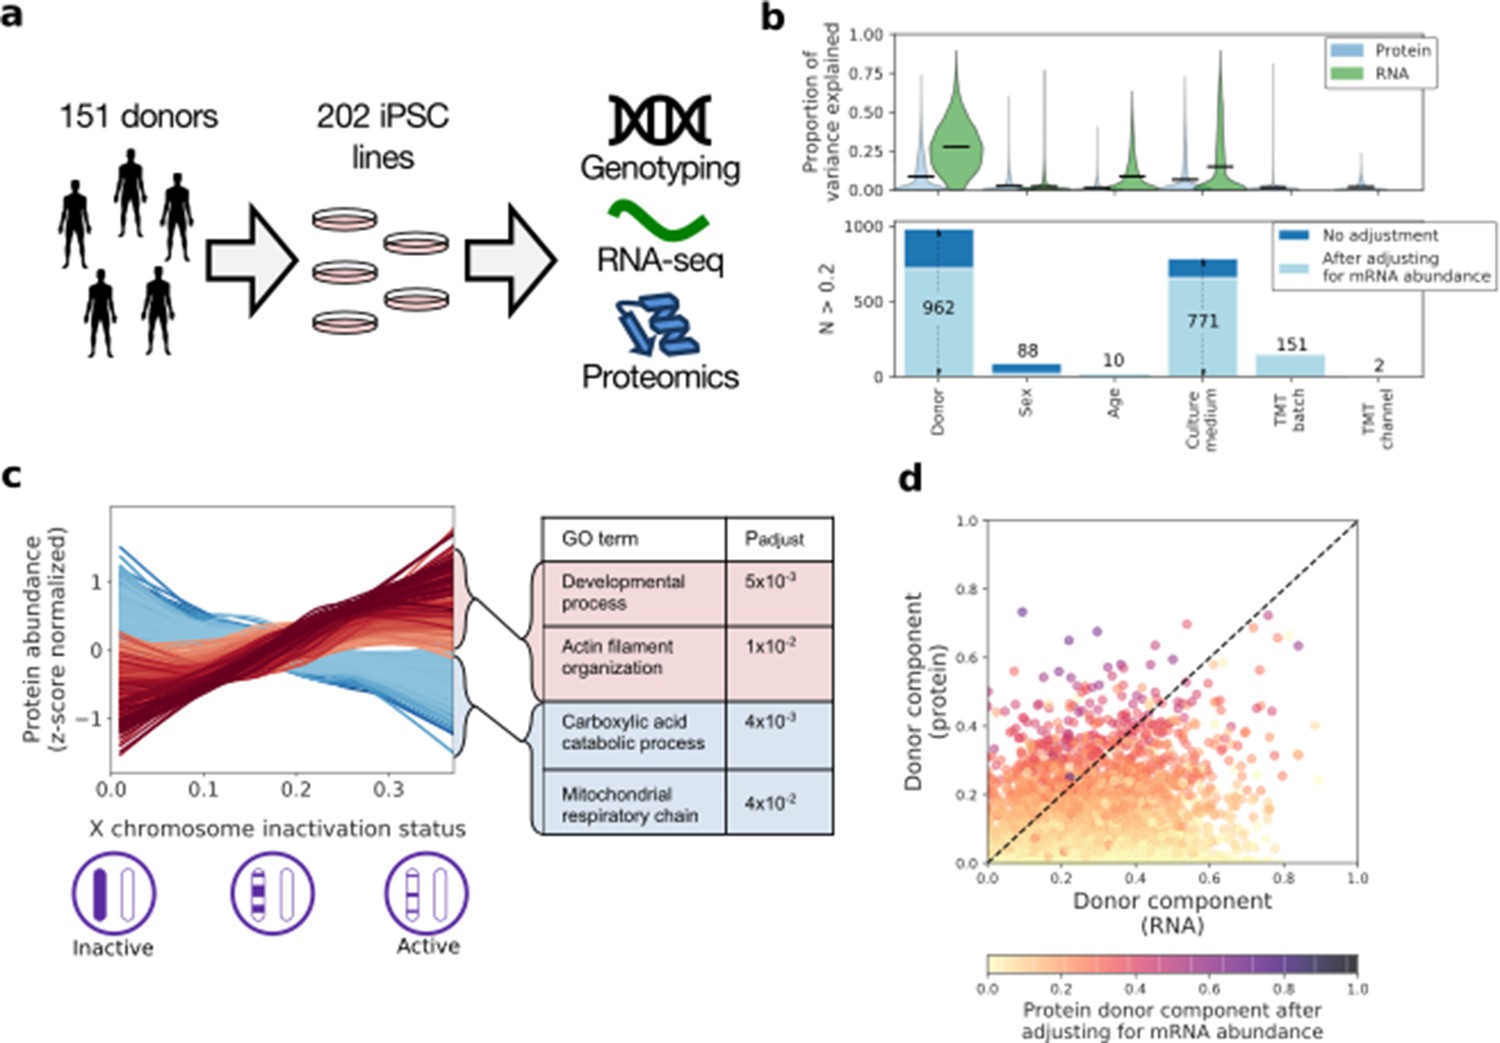
| Characterising variation in the iPSC proteome and transcriptome.
(a) Experimental design and assays considered in this study. Genotype, RNA-Seq and quantitative proteomics data were obtained from the same cell material of 202 iPSC lines derived from 151 unrelated donors. (b) Variance component analysis of RNA and protein abundances across genes, considering different technical and biological factors. Shown is the distribution of the fraction of variance explained by different factors (upper panel) across proteins, and the number of genes with substantial variance contribution for each factor (>20% contribution; lower panel). Also shown are the number of genes that retain greater than 20% contribution after adjusting for the effect of the corresponding RNA profiles on protein abundance (light blue; see Materials and methods). (c) Association of protein level with X chromosome inactivation (XCI) status across 110 female iPSC lines. Shown are lowess regression curves for 322 and 312 proteins respectively that were identified as significantly up (red) - and down (blue) - regulated with loss of XCI in female iPSC lines (lower panel; 10% FDR). Selected gene ontology enrichments for these sets of proteins are shown (right-hand panel; Materials and methods). XCI status was estimated as the average fraction of allele-specific expression for the inactive chromosome across all chromosome X genes (Materials and methods). (d) Scatter plot of the fraction of variance explained by donor at the RNA (x-axis) versus protein (y-axis) level. Encoded in colour is the fraction of variance explained by donor effects at the protein level after adjusting for the effect of the corresponding RNA profiles on protein abundance (Materials and methods).
-
Figure 1—source data 1
HipSci proteomics iPSC lines.
The public ids, TMT batch, donor, gender, age and growth media for the HipSci iPSC lines used in this study are shown.
- https://cdn.elifesciences.org/articles/57390/elife-57390-fig1-data1-v3.xls
-
Figure 1—source data 2
RNA gene level expression across the 202 lines for genes recurrently detected at the protein level.
Lines are indexed by protein Ensembl gene Id. Columns are the line public names.
- https://cdn.elifesciences.org/articles/57390/elife-57390-fig1-data2-v3.xls
-
Figure 1—source data 3
Protein abundance values across the 202 and reference lines for genes recurrently detected at the protein level and with RNA expression (TPM >1).
Lines are indexed by protein Uniprot Id. First 229 columns contain intensity values after quality line filtering, batch correction and quantile normalisation. Line names are encoded as follows: [line public name]@[TMT batch]@[TMT channel]. Last columns include protein information: ‘gene_chromosome', 'gene_start', 'gene_end', 'ensembl_gene_id', 'gene_name', 'gene_strand', 'number_of_peptides', 'in_CORUM’.
- https://cdn.elifesciences.org/articles/57390/elife-57390-fig1-data3-v3.xls
-
Figure 1—source data 4
Protein and RNA variance components.
Variance decomposition for 6009 genes high RNA expression (TPM >1) and detected in lines at the protein level.
- https://cdn.elifesciences.org/articles/57390/elife-57390-fig1-data4-v3.xls
-
Figure 1—source data 5
Protein and RNA correlation with X chromosome inactivation.
Correlation with XCI status of protein and RNA profiles for the 6336 genes (6406 proteins) with high RNA expression (TPM >1) and detected in all female lines at the protein level.
- https://cdn.elifesciences.org/articles/57390/elife-57390-fig1-data5-v3.xls
-
Figure 1—source data 6
Functional enrichment of genes with protein or RNA profiles correlated with XCI.
This table enumerates the significant Genome Ontology terms and DNA regulatory motifs (FDR 0.05; fields 'source' and 'term_name') for different gene sets (field ‘molecular_layer’ and ’change_direction’): 1) RNA positively correlated with XCI inactivation, 2) RNA negatively correlated with XIC, 3) proteins positively correlated with XIC and without RNA nominal significance, and 4) proteins negatively correlated with XIC and without RNA nominal significance.
- https://cdn.elifesciences.org/articles/57390/elife-57390-fig1-data6-v3.xls
Figure 1—figure supplement 1
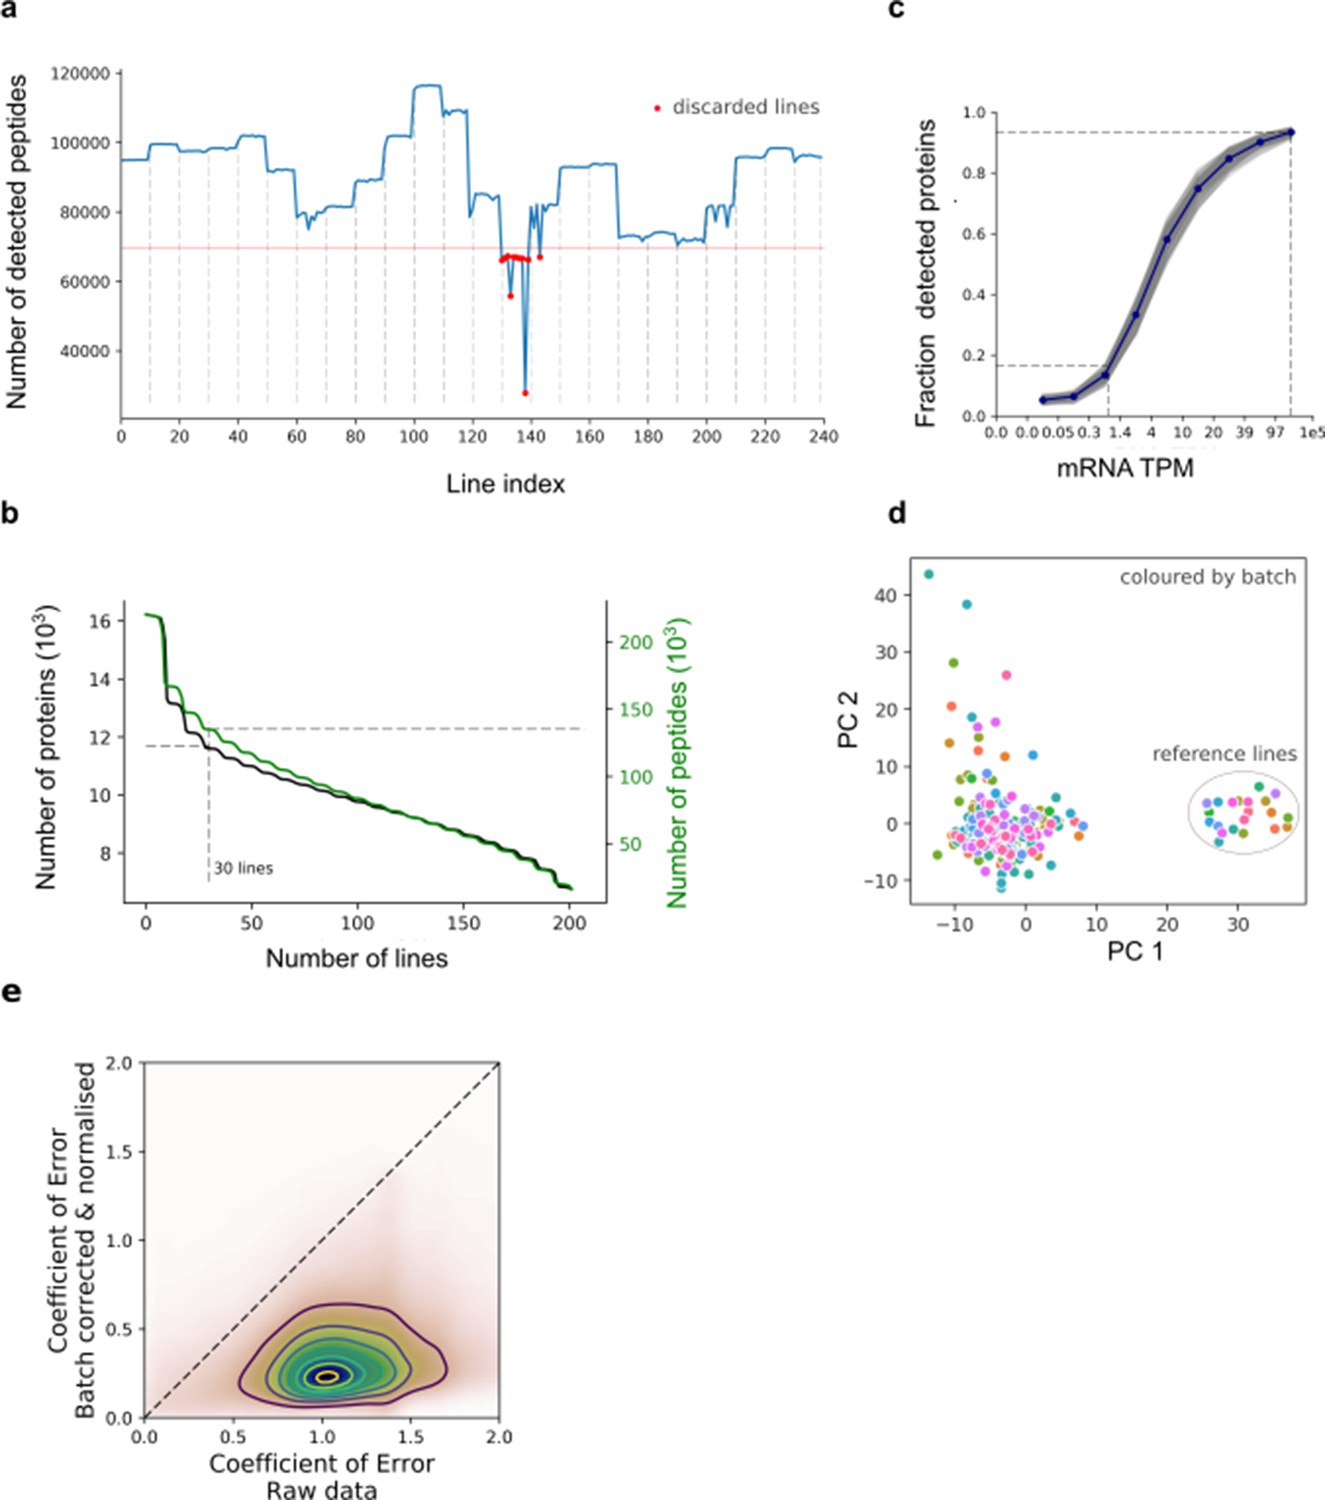
Protein quantification, quality control and batch correction.
(a) Number of detected peptides across all 240 iPSC lines (including 23 replicates of the reference line) ordered by TMT processing batch (dashed vertical lines). The horizontal lines denote the QC cutoff of 75% of the median across lines (67,000 peptides). (b) Distribution of the number lines in which the peptides and proteins were detected. The number of recurrently detected peptides, or protein groups (at least one detected peptide per group), are shown as a function of the recurrence (considering 202 lines with QC-passing RNA and protein data). (c) Fraction of expressed genes detected at the protein level for increasing levels of expression at the RNA level (for each decile of RNA expression; grey: values for each cell line ; blue: average across cell lines). (d) Assessment of batch correction across TMT batches. Principal component analysis of all 202 iPS lines + 22 additional technical replicates of the reference cell line (HPSI0314i-bubh_3), which was included in each TMT batch. Colour denotes the TMT batch. (e) Scatter plot of the coefficient of variation of peptide abundance estimates across processing batches for the reference line, before (x-axis) and after (y-axis) batch correction and quantile normalisation. Note that the reference line is not used for estimating parameters of the batch adjustment (Materials and methods).
Figure 1—figure supplement 2
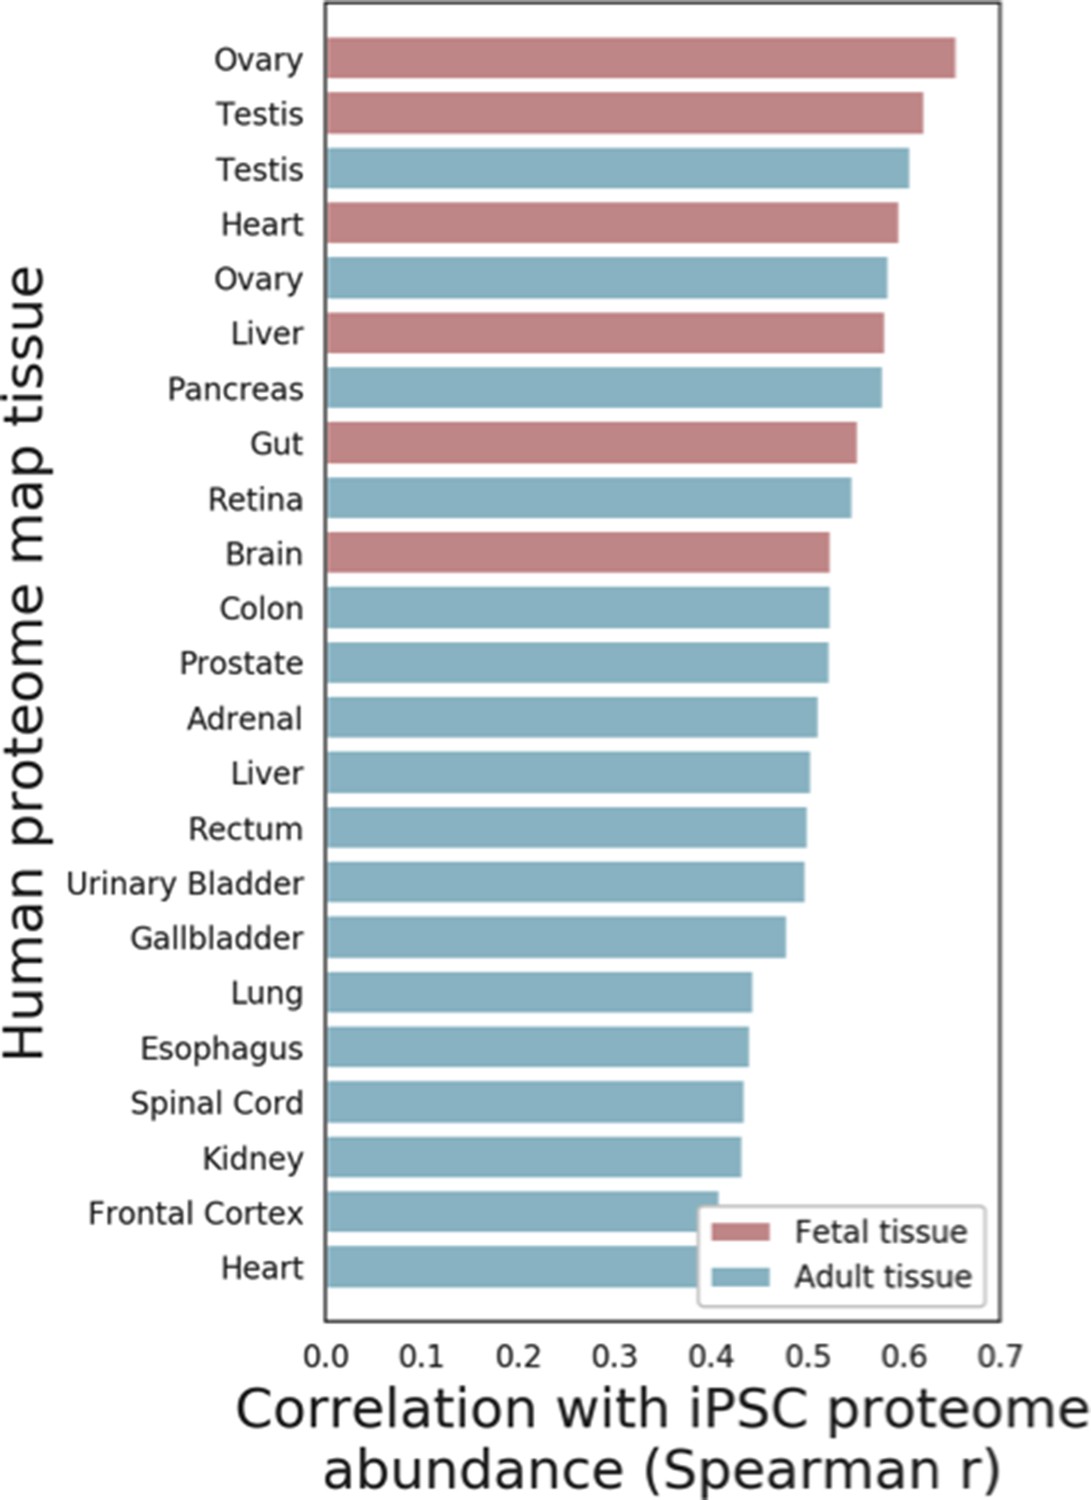
Comparison of iPSC proteome and somatic human tissues.
Spearman correlation coefficients between the average iPSC proteome abundance and proteome profiles of 23 tissues obtained from the Human Proteome Map, including Fetal (Red) and Adult (Blue) tissues are shown (see Materials and methods for details).
Figure 1—figure supplement 3
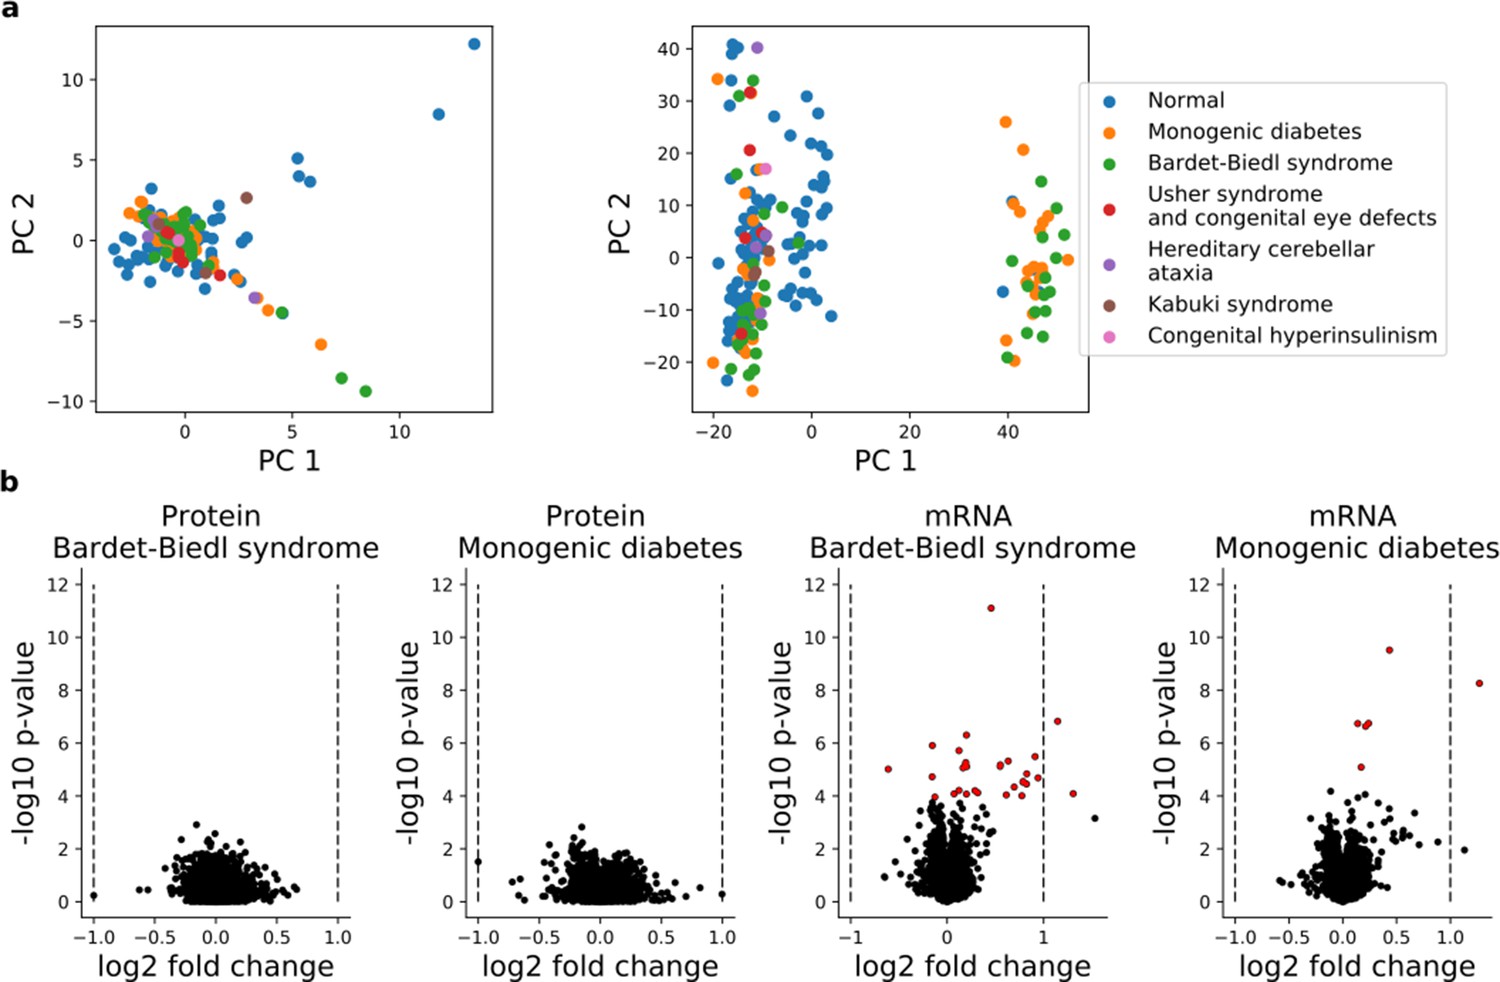
Comparison of the iPS transcriptome and proteome of disease and normal lines.
(a) Principal components analysis of protein (left panel) and RNA (right panel) profiles of 202 iPSC lines, with individual lines color coded by disease status. In total 6583 proteins detected in all 202 cell lines and 16,852 genes with RNA expression (TPM >1) in at least 30 lines were considered. (b) Differential expression analysis between the largest disease entities (Bardet-Biedl;N = 38 and Monogenic diabetes; N = 38 and ‘Normal’; N = 112; Supplementary file 2) for protein (left panels) and RNA (right panels). p-Values and effect size estimates obtained from a linear model with the disease indicator as an exogenous variable are shown. For protein, the fold change is computed for each batch and averaged across batches. Significantly differential RNA or protein levels (FDR < 10%, Benjamini-Hochberg adjusted) are indicated in red.
Figure 1—figure supplement 4

Comparisons of variance component estimates before and after regressing out mRNA effects.
Briefly, for each protein-RNA pair, the effect of RNA abundance on protein abundance was accounted for using a linear model, regressing out its effect on the protein abundance. The analogous variance component model as considered in Figure 1b is then fitted on this adjusted protein abundance (Materials and methods).
Figure 1—figure supplement 5
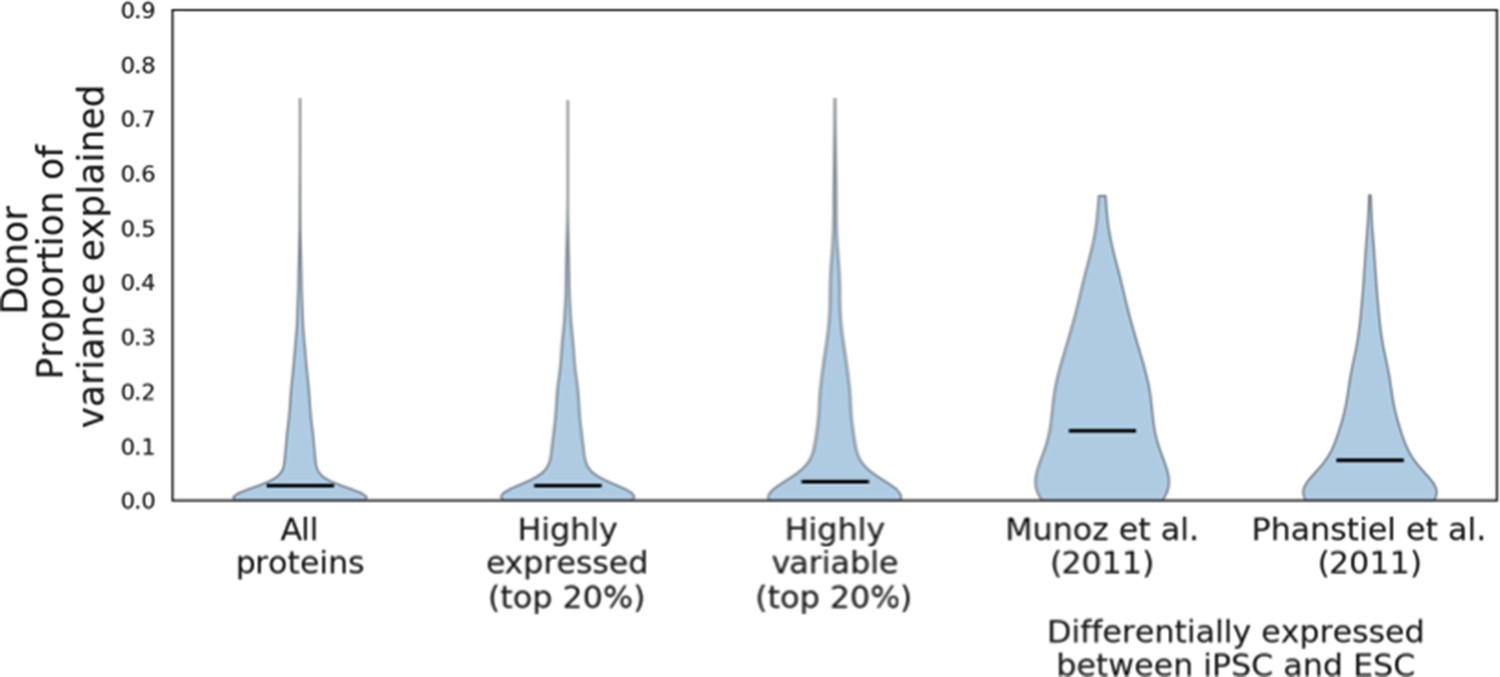
Donor variance components of proteins differentially expressed between iPSC and ESC.
Donor variance component results for all proteins and subsets of highly expressed and highly variable proteins, compared to the donor variance components for proteins reported as differentially expressed between iPSC and Munoz et al., 2011 (a set of 81 proteins) and Phanstiel et al., 2011 (a set of 255 proteins) (see Materials and methods). Horizontal black bars denote median variance components.
Figure 1—figure supplement 6
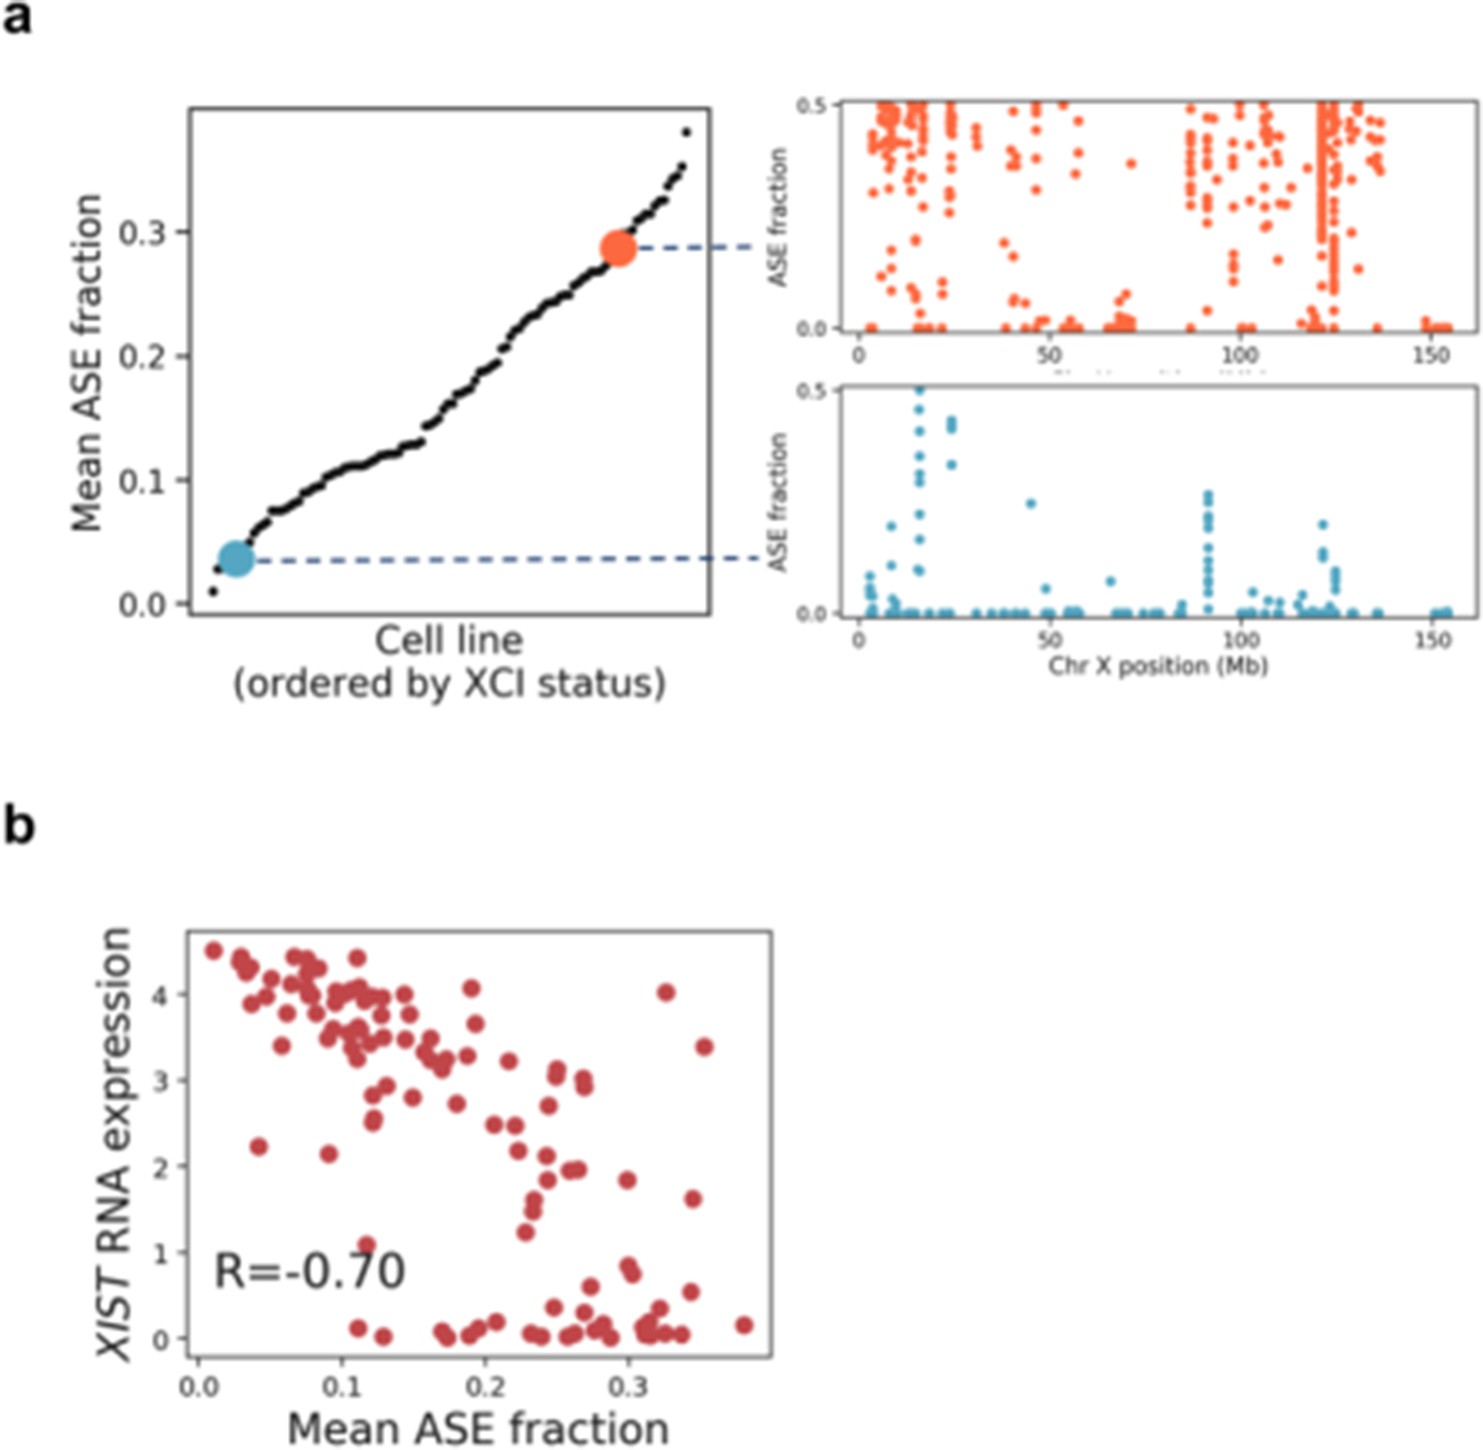
Quantification of X chromosome inactivation status in female iPSC lines using chromosome X ASE SNPs.
(a) Mean allele-specific expression (ASE), averaged across all chromosome X heterozygous variants for all female iPSC lines included in this study (left), with illustrative examples of the distribution of SNP ASE measured across chromosome X (right). (b) Scatter plot between XIST RNA expression and mean ASE for chromosome X.
Figure 2 with 4 supplements
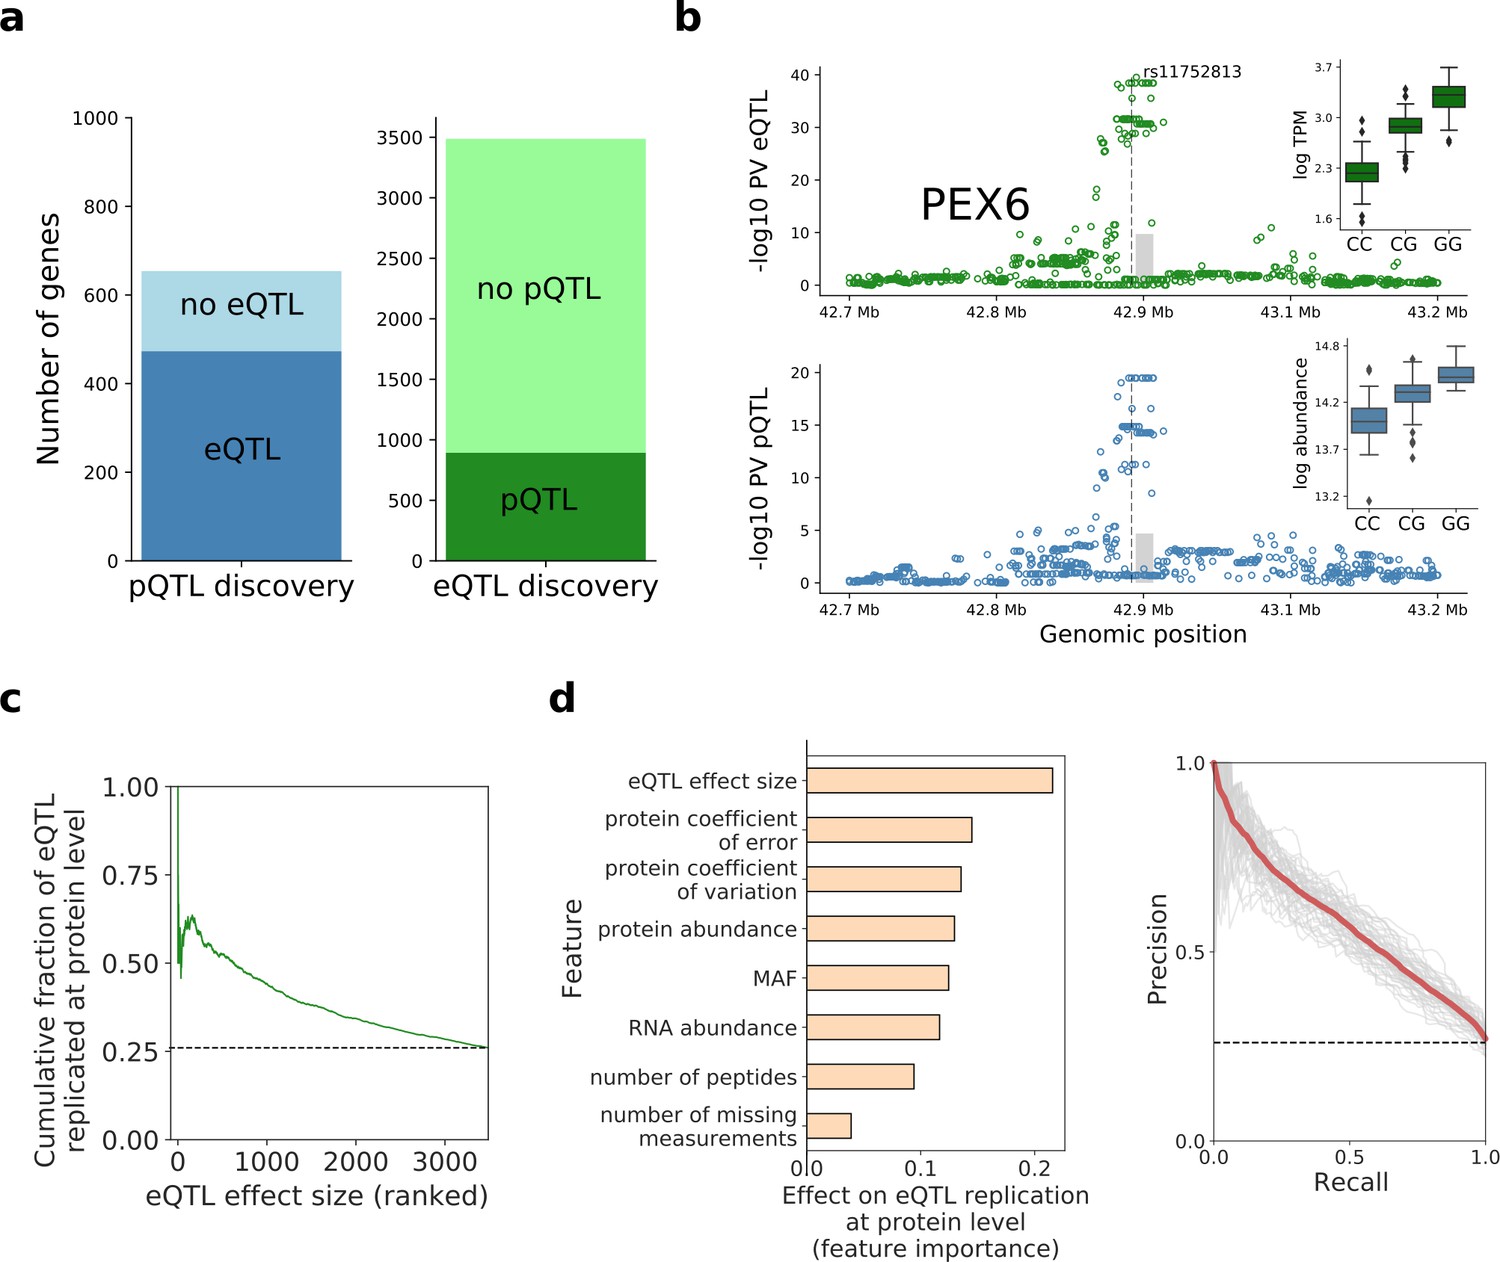
Human iPSC cis protein and RNA QTLs.
(a) Number of genes with a protein (blue) or RNA (green) cis QTL (FDR < 10%) and pairwise replication of genetic effects. Left: Number of genes with a pQTL, either with (dark blue) or without (light blue) replicated RNA effect. Right: Number of genes with an eQTL, either with (dark green) or without (light green) replicated protein effect. Replication defined by assessing nominal significance (PV <0.01) of QTL in the respective other layer. (b) Local Manhattan plots displaying negative log p-values (PV) from cis RNA (top) and protein (bottom) QTL mapping for PEX6. The dashed line and the grey box indicate the genomic positions of the lead QTL and of the gene. Boxplots show RNA and protein expression for different alleles at the pQTL lead variant rs11752813, a variant in LD (r2 = 1, 1000 Genomes European populations phase 3) with the Alzheimer risk variant rs1129187 (Jun et al., 2016) (OR 1.13). (c) Cumulative fraction of eQTLs with replicated protein effects as a function of the eQTL effect size (from highest to lowest). (d) Prediction of protein replication of eQTLs, considering features derived from gene annotations, eQTL, RNA and protein data. Predictions were obtained using a random forest model trained on the protein replication status of eQTL (as in a; Materials and methods). Left: Feature importance scores. Right: Precision-recall curve for the model, evaluated in independent test fractions. The model performance was assessed by random sampling of training/testing data with a 80/20 split, performed 50 times. Shown in red is the average precision-recall across all sampled training/test splits and in thin grey lines results of individual folds.
-
Figure 2—source data 1
pQTL_results.
The list of significant (FDR < 10%) genes with a pQTL provided as a supplementary file. Data fields are described in the table below.
- https://cdn.elifesciences.org/articles/57390/elife-57390-fig2-data1-v3.xls
-
Figure 2—source data 2
eQTL_results.
Reported are genes with a significant (FDR < 10%) QTL. It consists of variants mapped at RNA, gene resolution, for genes detected at both RNA and protein levels. This table includes the features used in the prediction of the pQTL status. The table columns are analogous to Figure 2—source data 1 pQTL_results.
- https://cdn.elifesciences.org/articles/57390/elife-57390-fig2-data2-v3.xls
Figure 2—figure supplement 1
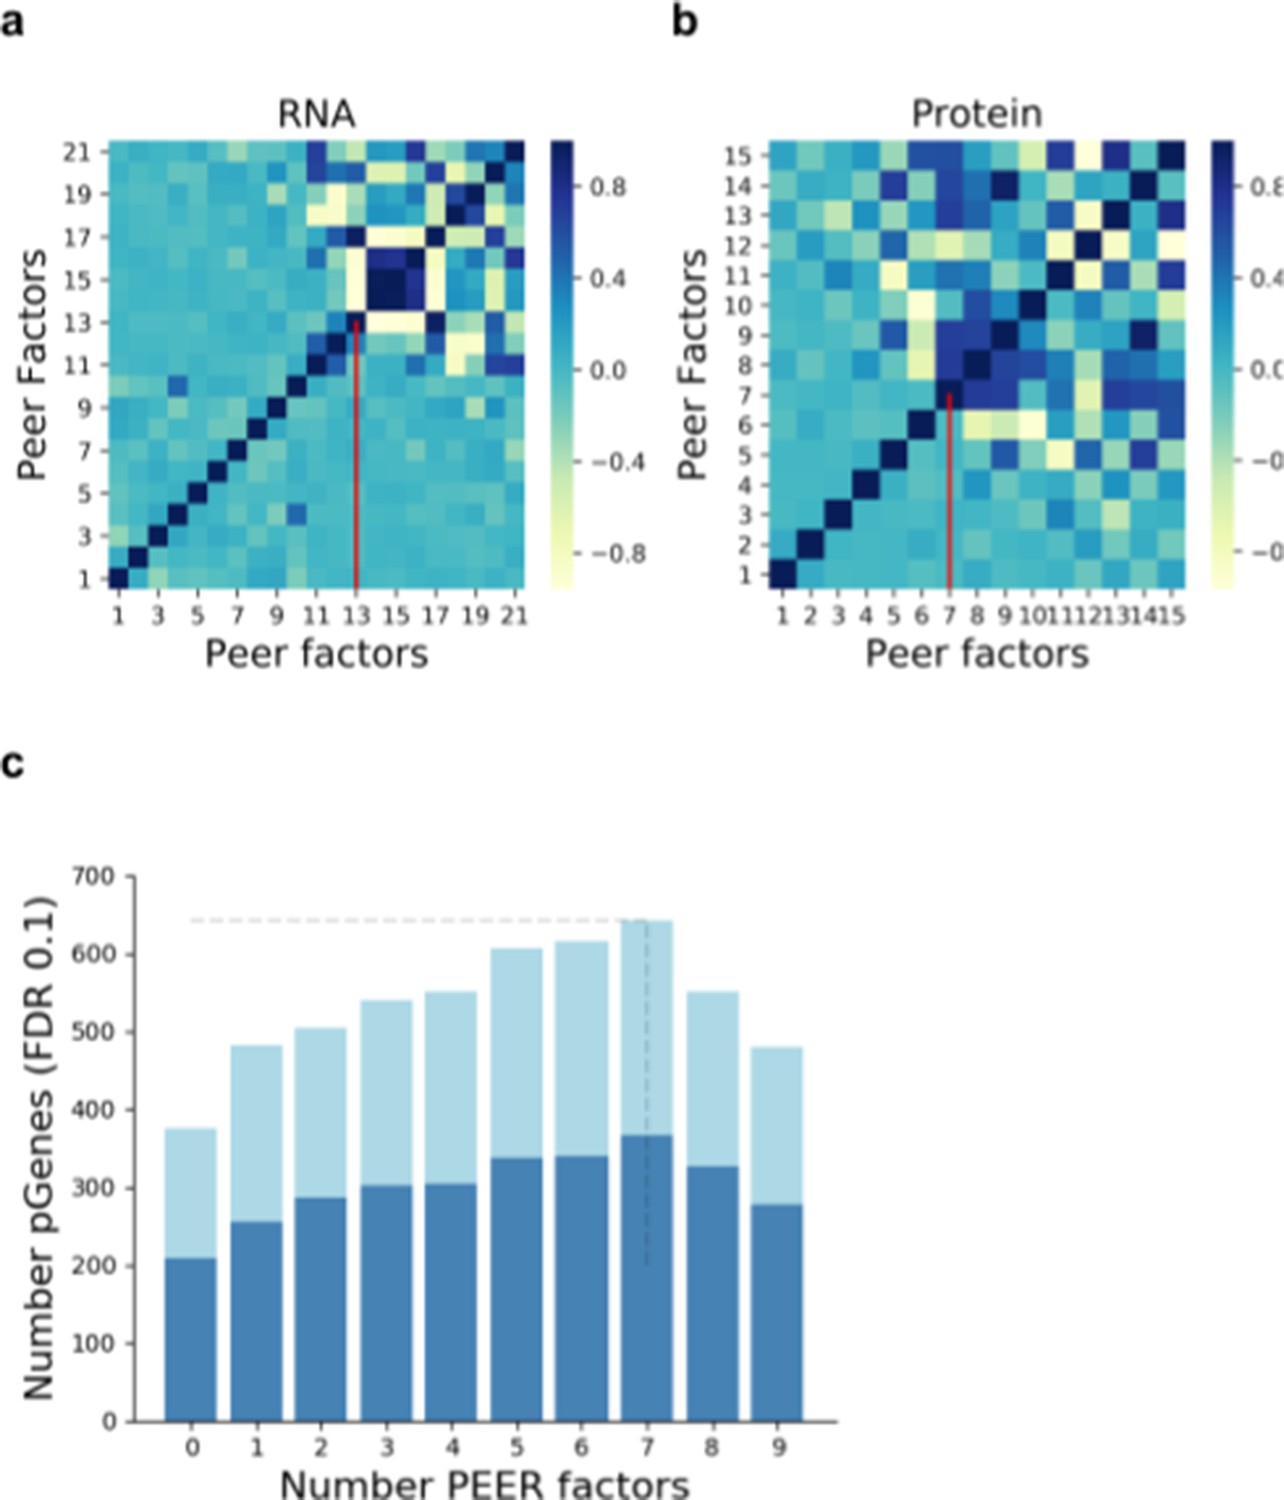
Selection of the number of PEER factors to adjust for unwanted variation.
Pairwise correlation (Pearson correlation coefficient) between the Peer factors fitted on RNA (a) and protein data (b). Vertical red lines indicate the number of factors used within this study. (c) Number of genes with a pQTL (FDR < 10%) when accounting for increasing numbers of factors in the analysis. Dark blue denotes pQTLs replicated at RNA level (defined as nominal PV <0.01; Materials and methods).
Figure 2—figure supplement 2

Relationship between estimates of donor variance component and cis pQTLs.
(a) Barplot showing the fractions of genes with significant variance donor component for genes with and without cis pQTLs. (a) Barplot showing the fractions of genes with a cis pQTL for genes stratified by the relative donor variance.
Figure 2—figure supplement 3
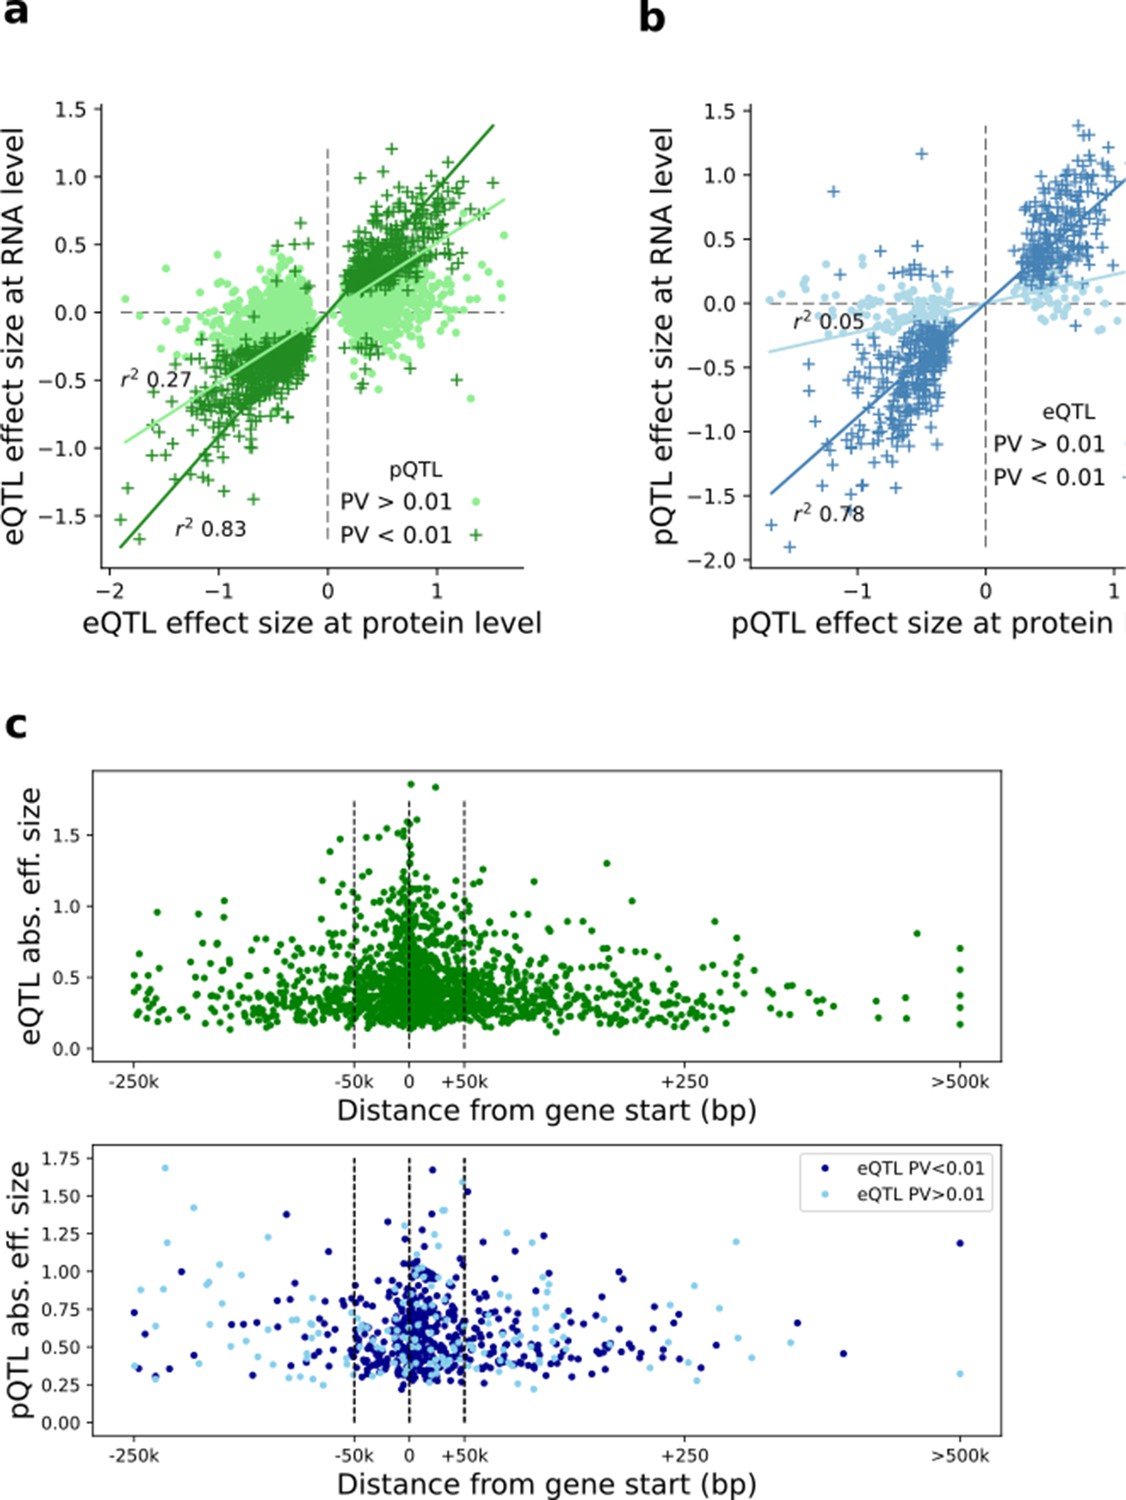
Comparison of eQTL and pQTL effect sizes and genomic positions.
(a) Scatter plot of QTL effect size estimates for eQTL lead variants (FDR < 0.1) at the RNA and protein level, respectively. Dark green denotes eQTLs nominally significant at pQTL; Light green denotes eQTLs lacking protein replication. (b) Scatter plot of QTL effect size estimates for lead pQTL variants (FDR < 0.1) at the protein and RNA level, respectively. Dark blue denotes pQTLs nominally significant at eQTL; Light blue denotes pQTLs lacking eQTL replication. (c) Distribution of eQTL(top) and pQTL (bottom) around the gene start. Y-axis indicates the QTL effect size. pQTLs are stratified by eQTL replication status.
Figure 2—figure supplement 4

Example iPS eQTL and pQTL variance with evidence for co-localisation with GWAS variants.
(a) Left - local Manhattan plot for the cis region of gene SMC2 (lead pQTL rs7872034), displaying eQTL and pQTL association negative log p-values, as well as negative log p-values obtained from a GWAS of invasive ovarian cancer (Phelan et al., 2017) (pQTL cumulative co-localisation posterior probability 0.8; eCAVIAR). Right: scatter plot with eQTL and pQTL effect sizes (y-axis) juxtaposed with effect sizes on invasive ovarian cancer (x-axis). The red triangle indicates the lead pQTL for protein and mRNA effects. (b) Local Manhattan plot of the cis region for the gene TRIM5 (lead pQTL missense variant rs11601507) displaying eQTL and pQTL association negative log p-values, as well as negative log p-values obtained from a GWAS study for coronary artery disease risk (van der Harst and Verweij, 2018). Right: scatter plot with eQTL and pQTL effect sizes juxtaposed with effect sizes on coronary artery disease risk. Left plot insert shows the position in Q9C035, the protein encoded by TRIM5, of the missense variant rs11601507 and of the peptides used for protein quantification.
Figure 3 with 4 supplements
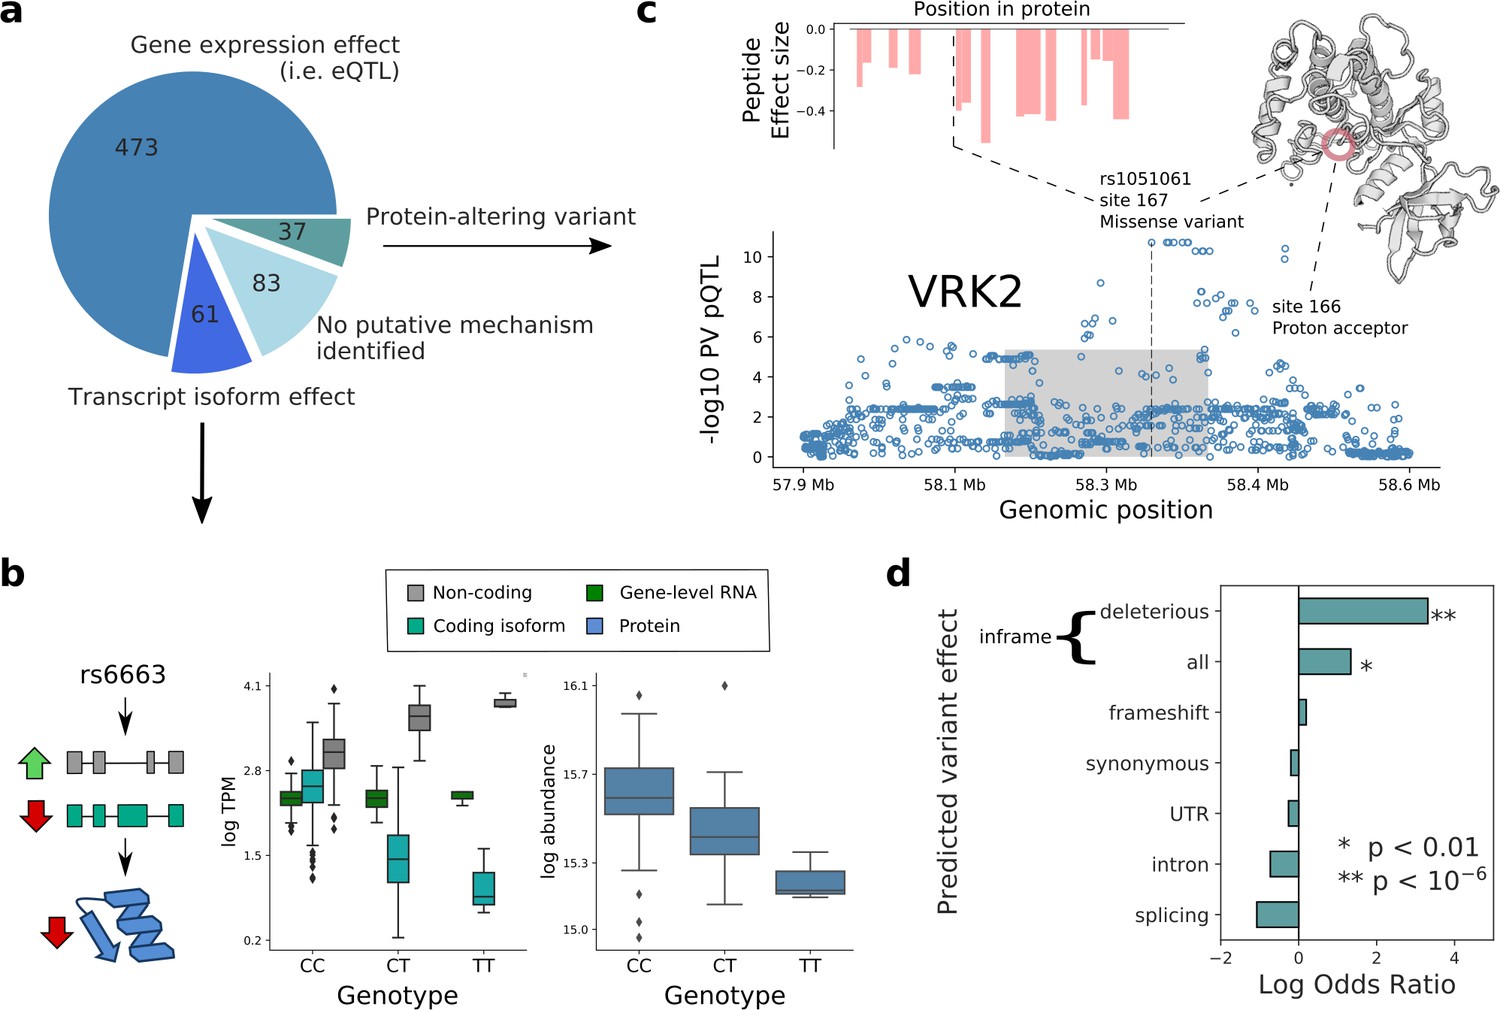
Putative mechanisms of pQTL from transcript isoform regulation and protein-altering variants.
(a) Categorisation of 654 pQTL into four classes according to their putative mechanism: gene expression effect (i.e. replicated at eQTL level), transcript-isoform specific effect (i.e. not replicated at eQTL level, but significant at transcript isoform level), protein-altering variant (i.e. at least one inframe variant in LD with lead pQTL variant) without expression effect at RNA level, and without any putative mechanism identified. (b) Example pQTL without eQTL replication (rs6663; gene MMAB), with a directional opposite effect on a coding and non-coding isoform (cyan: ENST00000540016; grey: ENST00000537496), resulting in no overall change in gene expression level. (c) The pQTL variant (rs1051061) is a protein-altering variant associated with VRK2 protein abundance (below), and lacks detectable effect on RNA expression. The pQTL signal is observed across 15 peptides spanning the VRK2 protein sequence (above, left). This variant is associated with schizophrenia risk, and is located at the kinase active site, proximal to the proton acceptor residue (above, right). The dashed line and the grey box indicate the genomic positions of the lead QTL and of the gene. (d) Enrichment of RNA-independent pQTL in different categories of predicted variant effects, using gene variants in high LD with pQTLs (proxy gene variants; r2 >0.8; within the cis gene boundaries). Enrichment calculated using Fisher’s exact test.
-
Figure 3—source data 1
tQTL_results.
Consists of variants mapped at RNA, transcript isoform resolution, for genes detected at both RNA and protein levels. The table columns are analogous to Figure 2—source data 1 pQTL_results.
- https://cdn.elifesciences.org/articles/57390/elife-57390-fig3-data1-v3.xls
-
Figure 3—source data 2
pepQTL results.
Consists of variants mapped at the protein level, peptide resolution, for genes detected at both RNA and protein levels. The table columns are analogous to Figure 2—source data 1 pQTL_results.
- https://cdn.elifesciences.org/articles/57390/elife-57390-fig3-data2-v3.xls
Figure 3—figure supplement 1
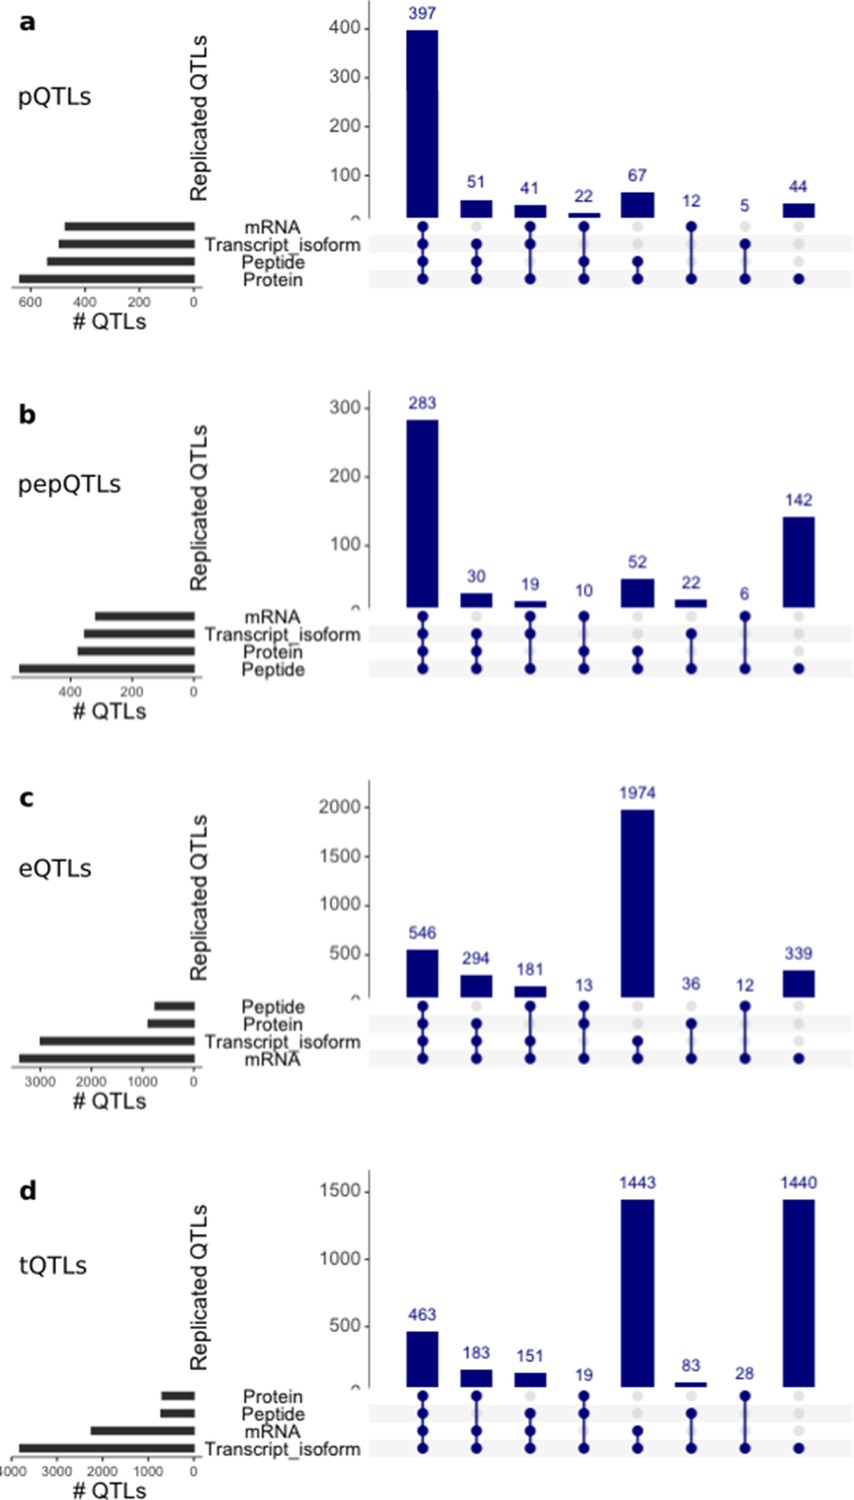
Discovery and replication of cis QTLs at protein and RNA levels.
Upset plots showing from top to bottom: genome-wide significant cis QTLs (FDR < 10%) for protein (pQTLs), peptides (pepQTLs), gene expression (eQTLs) and transcript isoforms (tQTLs) summarised at gene level. For each discovery set the replication (i.e. nominal PV <0.01 and effect sizes of the same direction) is assessed in the respective other layers, and the number of genes with replicated effects for each intersection is displayed. For comparison purposes, we show only QTLs assessed in all the four layers.
Figure 3—figure supplement 2
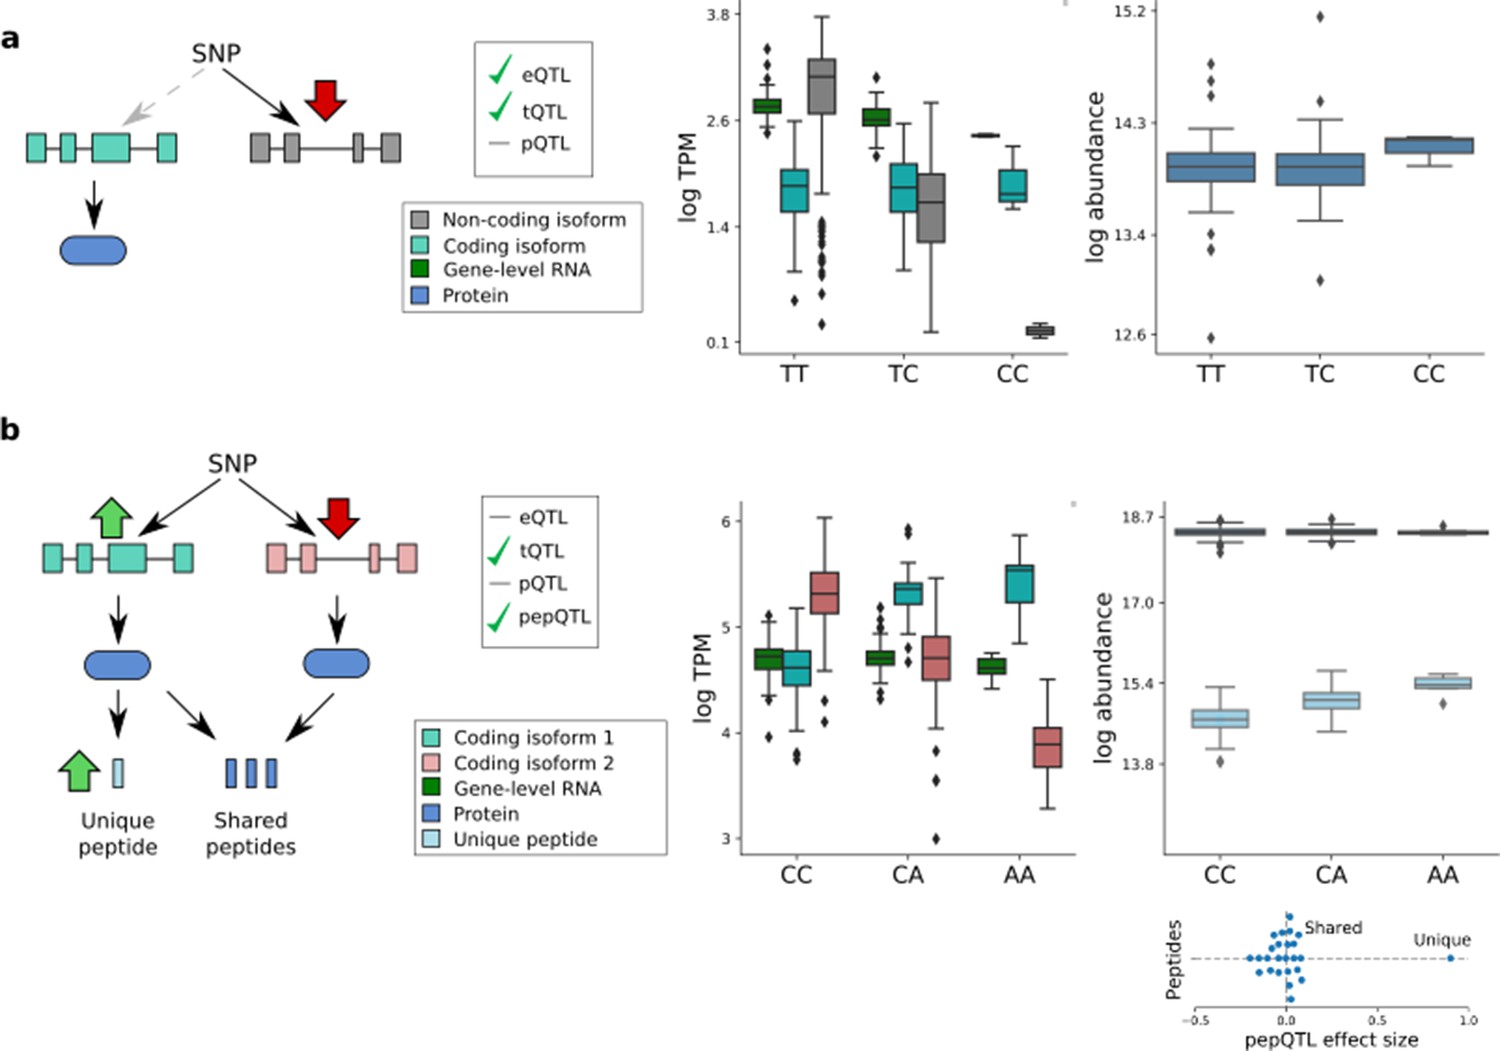
Isoform-specific genetic effects.
(a) An eQTL arising from a non-coding transcript QTL. The variant rs2709373, an eQTL variant for METTL21A, was associated with the abundance of the non-coding transcript isoform ENST00000477919 without detectable effect on the abundance of any protein-coding transcript isoform and thus not altering protein expression levels from this locus. (b) A transcript QTL that is neither an eQTL nor a pQTL. The variant rs12795503 has effects in opposite directions on the coding transcripts ENST00000301843 (light blue) and ENST00000346329 (light red), resulting in no detectable effects on either the RNA or protein level. The transcript-specific effect on ENST00000301843 is detectable at the peptide level (peptide QDSAAVGFDYK; uniquely mapping to exon 11 of ENST00000301843). Subplot shows genetic effect sizes for all peptides mapped to CTTN, with the peptides that are shared by both isoforms, and unique to the ENST00000301843 isoform, labelled.
Figure 3—figure supplement 3

Peptide resolution assessment of pQTLs.
(a) Fraction of peptides supporting the genetic effects of missense variants detected at the protein level and not replicated in RNA. For each missense variant - cis pQTL lacking mRNA replication (either eQTL or tQTL), we show the fraction of peptides mapped to the protein with direction of genetic effects consistent with the effect at the protein level. The grey area indicates the random agreement fraction (assuming equal probability of either effect direction; CI: 5–95%). Right panels illustrate genetic effects at protein (dashed horizontal line) and peptide (vertical bars) levels. (b) Fraction of peptides supporting the 68 trans protein QTL. For peptides mapping to the trans protein, we show the fraction of peptideQTLs with direction of genetic effects consistent with the pQTL. (c) Assessment of protein sequence similarity for cis/trans gene pairs. For the top 69 (FDR 0.1) trans pQTLs, the number of missmatching aminoacids are shown, based on the local alignment between peptides of the source cis pQTL and the affected trans protein (Materials and methods). For each cis - trans association, we report the minimal number of mismatches across all peptides used for the cis protein. Right: barplot showing the number of amino acid differences between pairs of detected peptides. The proportion was calculated from detected peptides ordered by sequence, using 10 random groups of 1000 peptides.
Figure 3—figure supplement 4
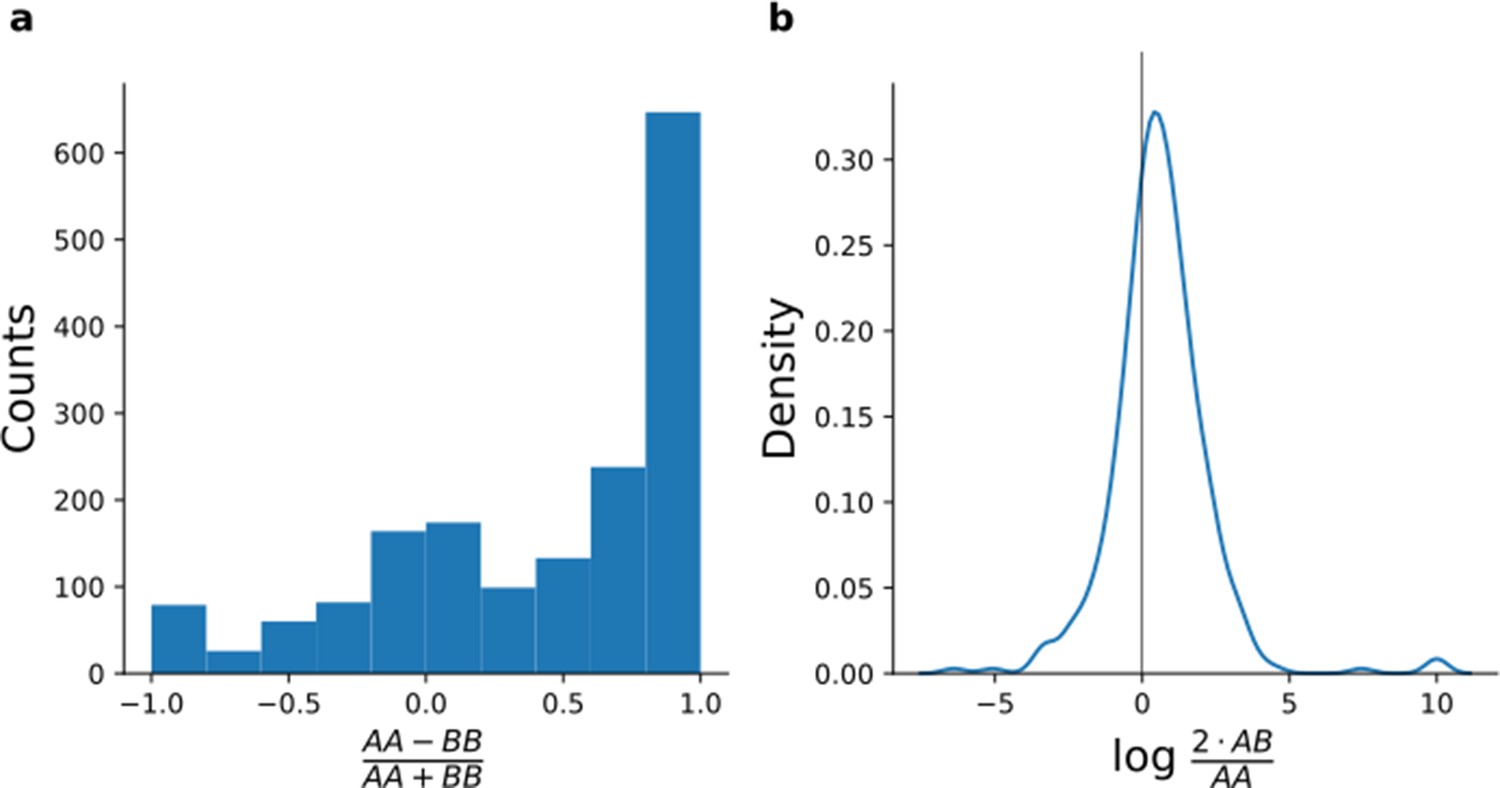
Quantification of peptides containing coding polymorphisms.
(a, b) For each peptide with an SNP changing the peptide sequence (Materials and methods), peptide intensities were averaged across samples from donors who were homozygous for the reference allele (AA), heterozygous (AB), and homozygous for the alternative allele (BB). To increase robustness, we limit the analysis to variants with at least three alternative homozygous and at least three heterozygous lines. (a) Histogram comparing the intensity average of homozygous samples for peptides containing coding polymorphisms. (b) Density plot of the ratio between the average of the heterozygous samples and the reference homozygous samples restricted on the peptides which were not detected for the alternative homozygous samples.
Figure 4
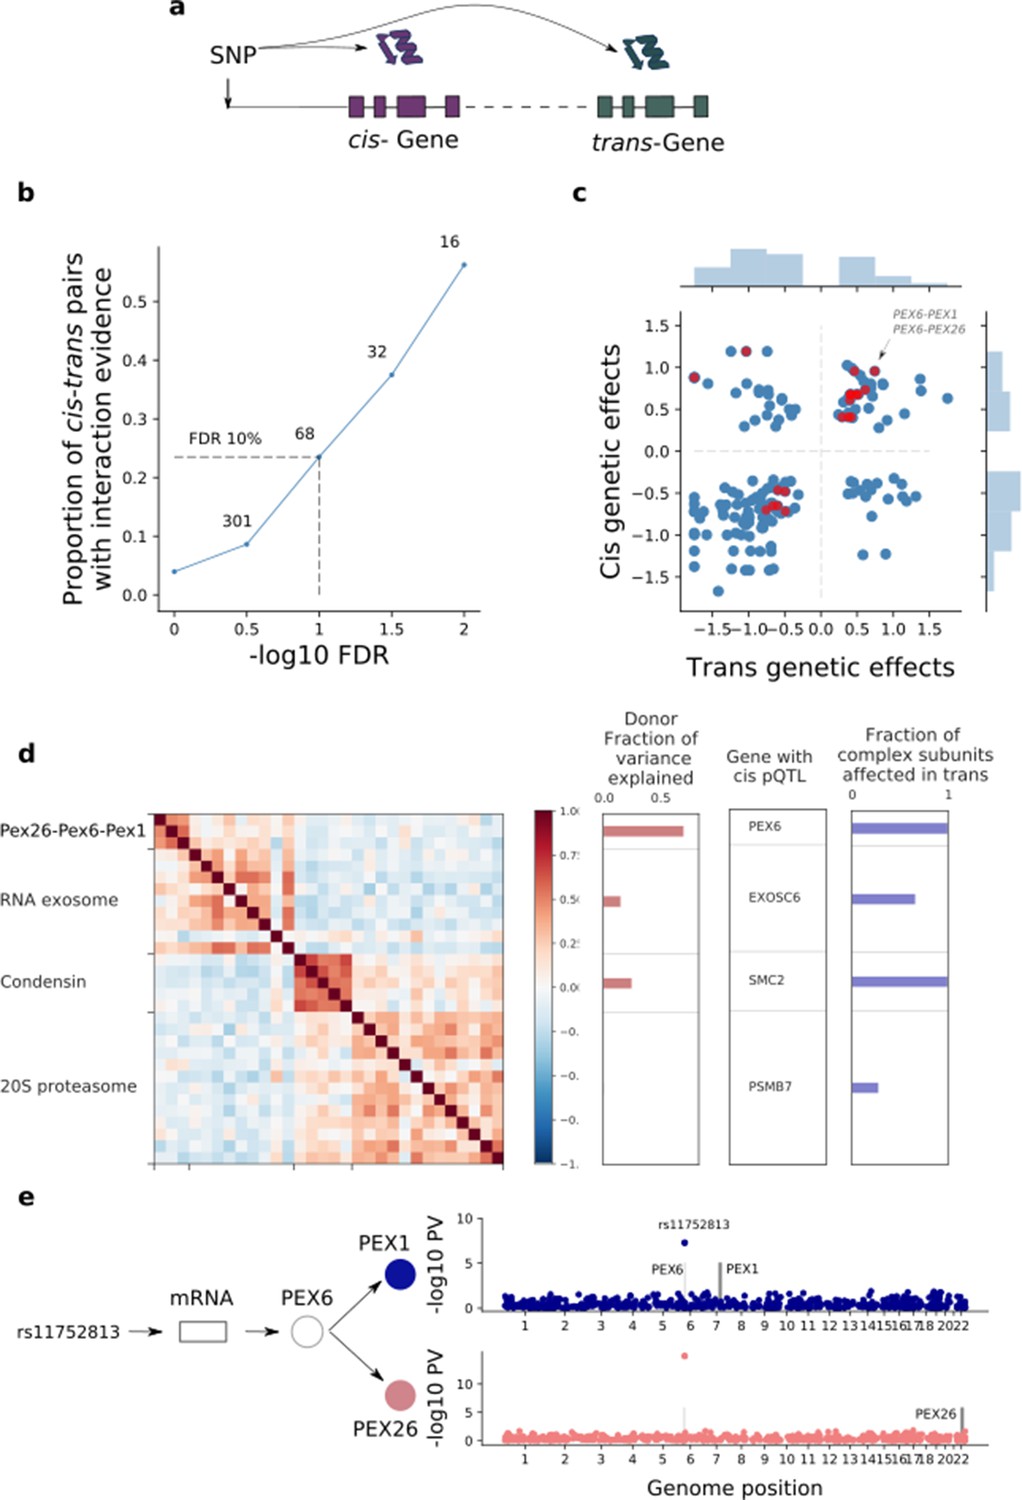
| Trans effects on the iPSC proteome.
(a) Strategy for mapping trans genetic effects on protein abundance. Lead cis pQTL variants were considered for proteome-wide association analysis. (b) Enrichment of previously catalogued protein-protein interactions among significant trans pQTLs. Shown is the fraction of cis-trans gene pairs linked by a trans pQTL with evidence of protein-protein interactions (based on the union of CORUM, IntAct, and StringDB), as a function of the considered FDR threshold for trans pQTL discovery. The dashed lines correspond to FDR < 10%. Numbers indicate the number of trans pQTL identified for each FDR threshold. (c) Comparison of genetic effect sizes, in cis and trans, for significant (FDR < 10%) trans pQTLs. Red points indicate cis-trans pairs with evidence for protein-protein interactions defined as in b. (d) Left: Protein co-expression of protein complex subunits defined based on CORUM. Right: i) subunit with the most significant cis pQTL; ii) fraction of subunits in association with the cis pQTL at nominal significance (PV <0.01). iii) fraction of the average cluster protein expression level explained by donor effects. (e) Trans regulation of the PEX26-PEX6-PEX1 complex. The variant rs11752813 (LD r2 = 1 with rs1129187) is associated in cis with changes in the RNA and protein abundance of PEX6 and in trans with changes in the protein abundance of PEX1 and PEX26.
-
Figure 4—source data 1
trans-pQTL_results.
Reported are the trans pQTL (FDR < 10%).
- https://cdn.elifesciences.org/articles/57390/elife-57390-fig4-data1-v3.xls
Tables
Key resources table
| Reagent type (species) or resource | Designation | Source or reference | Identifiers | Additional information |
|---|---|---|---|---|
| Cell line (Homo-sapiens) | iPSC | www.hipsci.org | RRID:SCR_003909 | |
| Software, algorithm | MaxQuant | https://www.maxquant.org/ | RRID:SCR_014485 | |
| Software, algorithm | Trim Galore | https://www.bioinformatics.babraham.ac.uk/projects/trim_galore/ | RRID:SCR_011847 | |
| Software, algorithm | STAR | https://www.ncbi.nlm.nih.gov/pmc/articles/PMC3530905/ | RRID:SCR_015899 | |
| Software, algorithm | Salmon | https://combine-lab.github.io/salmon/ | NA | |
| Software, algorithm | g:Profiler | http://biit.cs.ut.ee/gprofiler/ | RRID:SCR_006809 | |
| Software, algorithm | eCAVIAR | http://zarlab.cs.ucla.edu/tag/ecaviar/ | NA | |
| Software, algorithm | VEP | https://www.ensembl.org/info/docs/tools/vep/index.html | RRID:SCR_007931 | |
| Software, algorithm | MutFunc | http://www.mutfunc.com/ | NA | |
| Software, algorithm | Limix | https://github.com/limix/limix | NA | |
| Software, algorithm | Peer | http://www.sanger.ac.uk/resources/software/peer/ | RRID:SCR_009326 | |
| Software, algorithm | Scikit-learn | http://scikit-learn.org/ | RRID:SCR_002577 |
Additional files
-
Supplementary file 1
Comparison of proteome coverage across human proteomics datasets.
To facilitate comparison with other datasets we report here the number of proteins and peptides at FDR 1%.
- https://cdn.elifesciences.org/articles/57390/elife-57390-supp1-v3.docx
-
Supplementary file 2
Disease status.
Shown are the number of lines and donors for which matched mRNA and protein data are available.
- https://cdn.elifesciences.org/articles/57390/elife-57390-supp2-v3.docx
-
Supplementary file 3
Peptides overlapping protein altering variants detected in this study.
File containing the list of peptides overlapping protein altering variants or unmapped to the reference genome.
- https://cdn.elifesciences.org/articles/57390/elife-57390-supp3-v3.tsv
-
Transparent reporting form
- https://cdn.elifesciences.org/articles/57390/elife-57390-transrepform-v3.docx
Download links
A two-part list of links to download the article, or parts of the article, in various formats.
Downloads (link to download the article as PDF)
Open citations (links to open the citations from this article in various online reference manager services)
Cite this article (links to download the citations from this article in formats compatible with various reference manager tools)
Population-scale proteome variation in human induced pluripotent stem cells
eLife 9:e57390.
https://doi.org/10.7554/eLife.57390


