Tissue-resident macrophages promote extracellular matrix homeostasis in the mammary gland stroma of nulliparous mice
- Department of Laboratory Medicine and Pathology, University of Minnesota, United States
- University of Minnesota Supercomputing Institute, University of Minnesota, United States
- Comparative and Molecular Biosciences Graduate Program, University of Minnesota, United States
- Department of Biochemistry and Molecular Biology, Tulane Cancer Center, Tulane School of Medicine, United States
- Department of Zoology, Faculty of Science, Cairo University, Egypt
- Masonic Cancer Center, University of Minnesota, United States
- Center for Immunology, University of Minnesota, United States
Figures
Figure 1 with 2 supplements
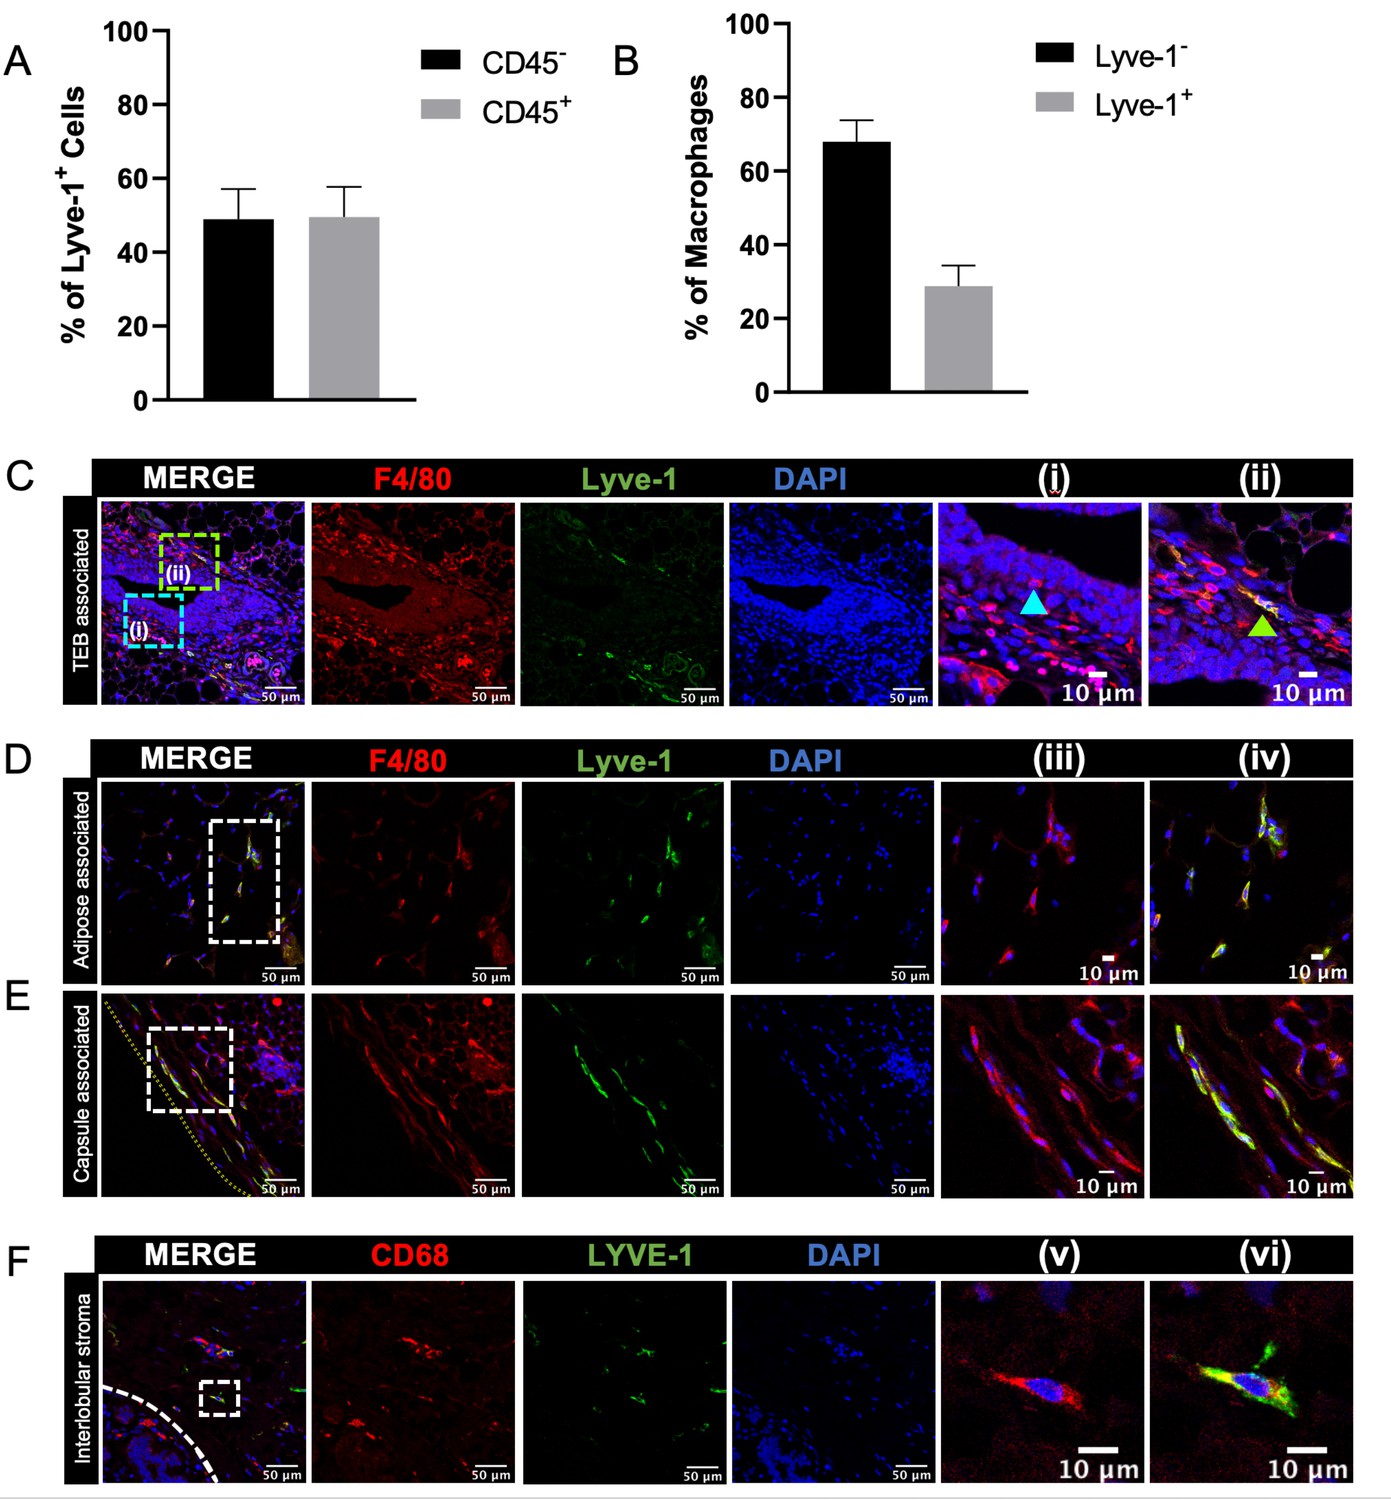
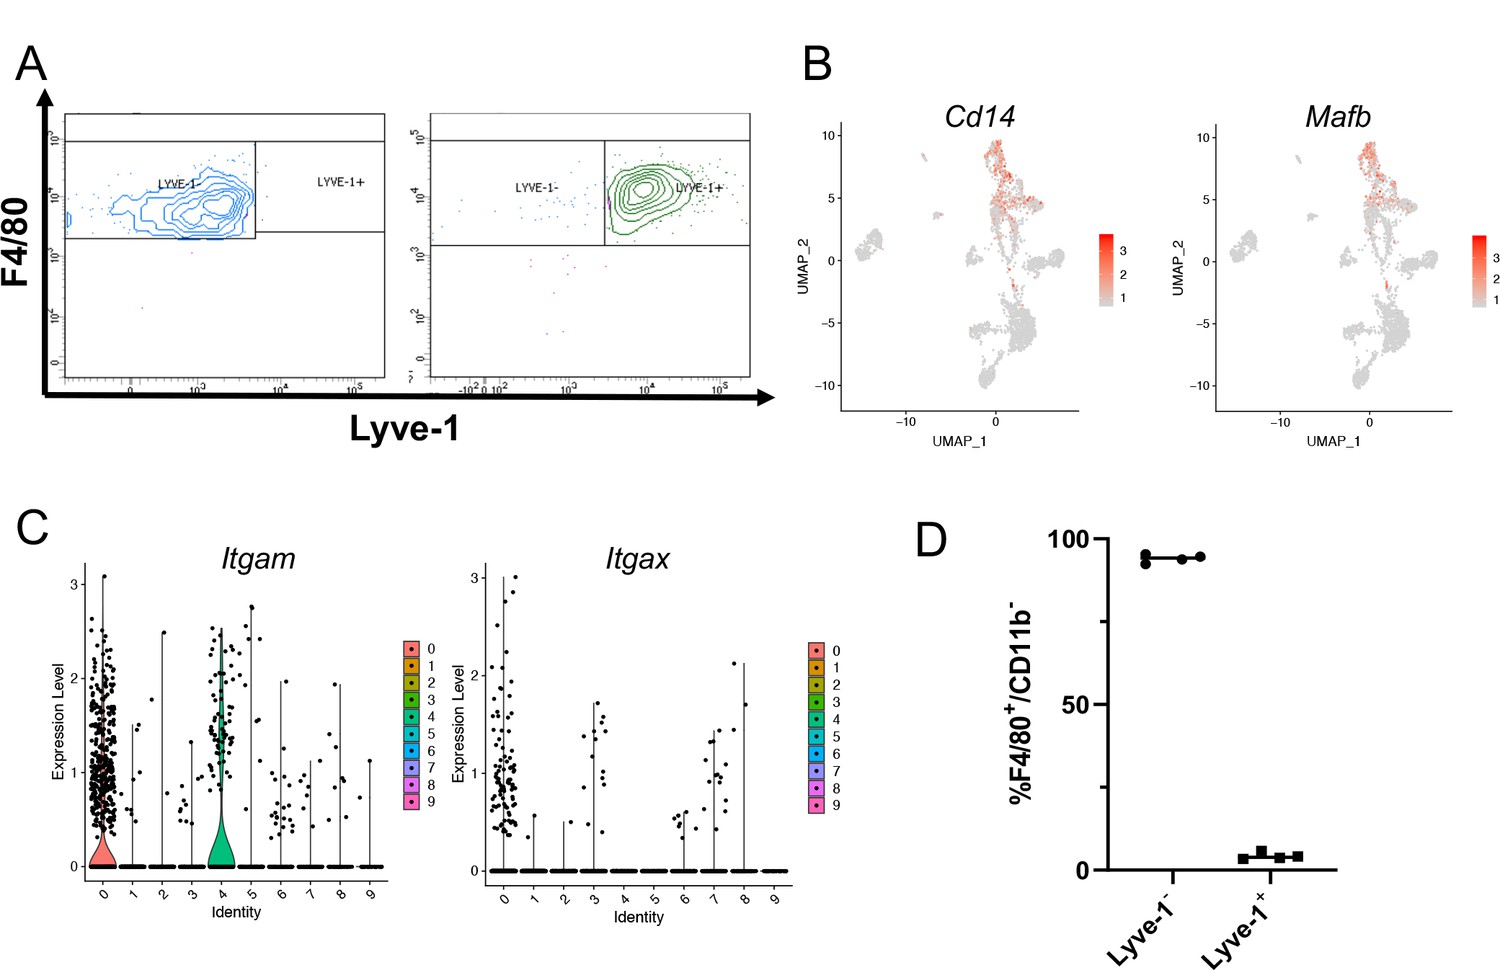
Identification of Lyve-1+ macrophages in the mammary gland.
(A) Mammary glands from 10-week-old mice (n = 4) were assessed for CD45+ and CD45– Lyve-1+ cells by flow cytometry. (B) Mammary glands from 10-week-old mice (n = 4) were assessed for CD45+CD11b+F4/80+Lyve-1– and CD45+CD11b+F4/80+Lyve-1+ cells by flow cytometry. (C) Mammary glands were harvested from 6-week-old mice, immunostaining was performed for F4/80 and Lyve-1, and the localization of single- and double-positive cells associated with TEBs was examined (n = 5, three images/localization). Representative images of F4/80+Lyve-1– (i, arrowhead) and F4/80+Lyve-1+ (ii, arrowhead) cells are shown. Yellow lines show the margin of the mammary gland. Insets show higher magnification. (D, E) Representative images of F4/80+Lyve-1+ cells in the adipose stroma and fibrous capsule of the mammary gland. Representative images show F4/80 (iii) and co-staining (iv). Inserts show higher magnification. (F) Human mammary glands obtained from reduction mammoplasty samples demonstrate the presence of CD68+Lyve-1+ macrophages in the interlobular stroma (n = 5, three images/sample). Representative images show F4/80 (v) and co-staining (vi).
-
Figure 1—source data 1
Source data for graphs in panels A and B.
- https://cdn.elifesciences.org/articles/57438/elife-57438-fig1-data1-v3.xlsx
Figure 1—figure supplement 1
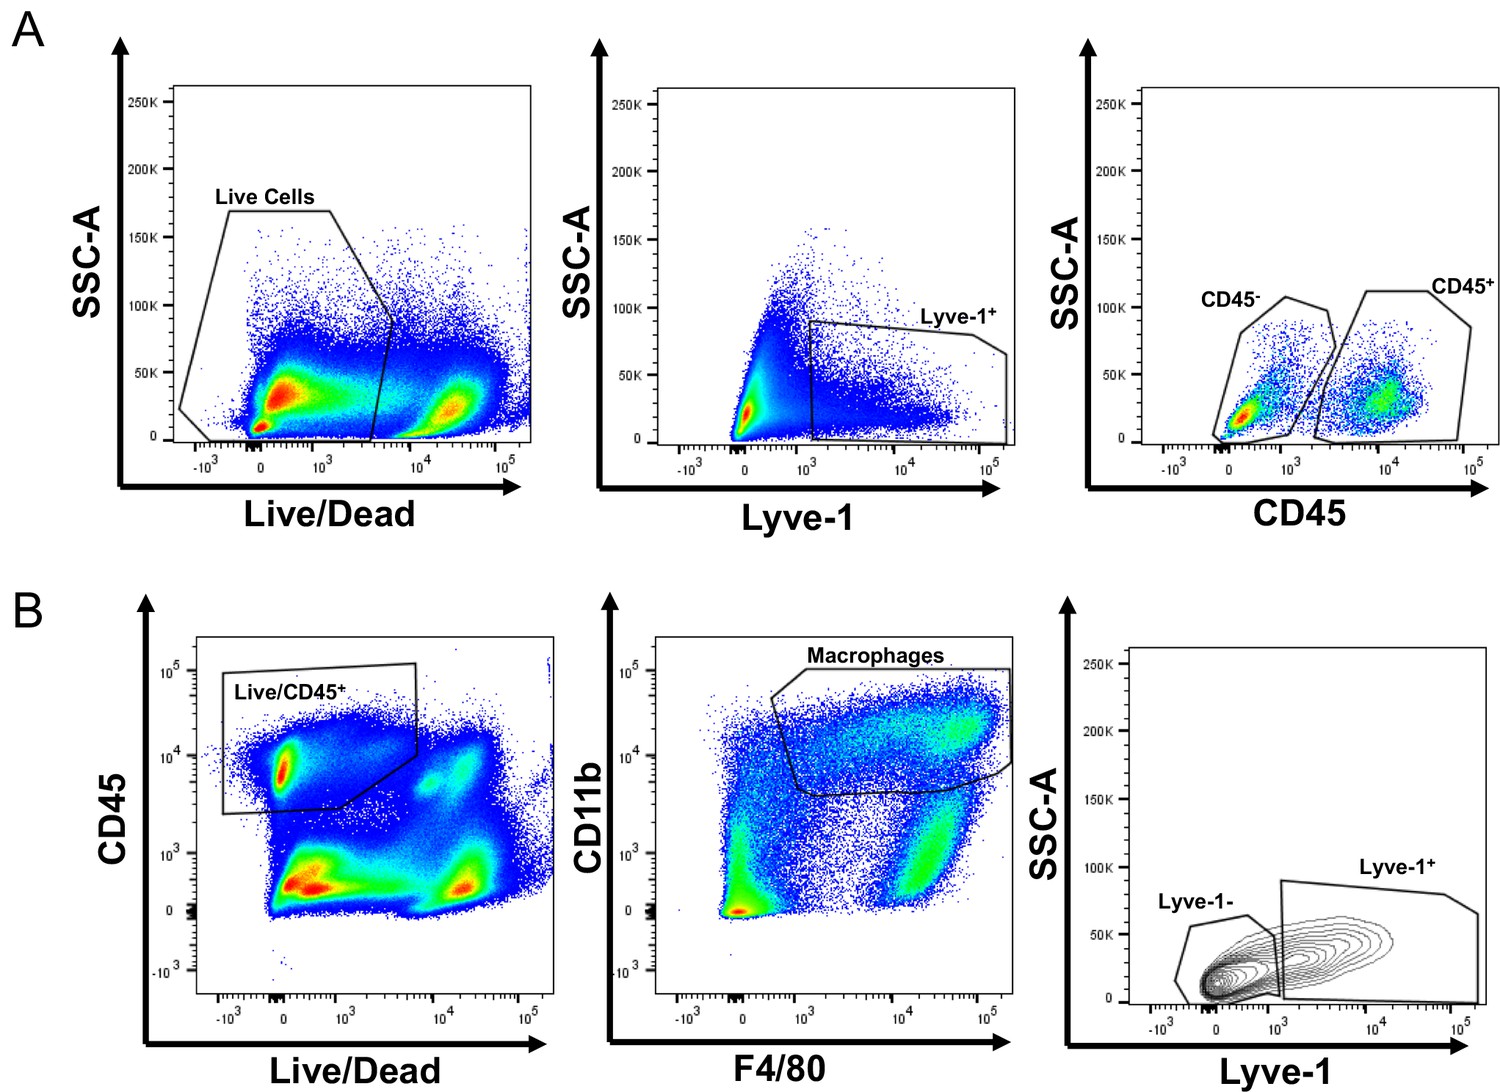
Identification of Lyve-1+ macrophages in the mammary gland.
(A) Gating of flow cytometry for CD45+ and CD45– Lyve-1+ cells. (B) Gating of flow cytometry for CD45+CD11b+F4/80+Lyve-1– and CD45+CD11b+F4/80+Lyve-1+ cells.
Figure 1—figure supplement 2
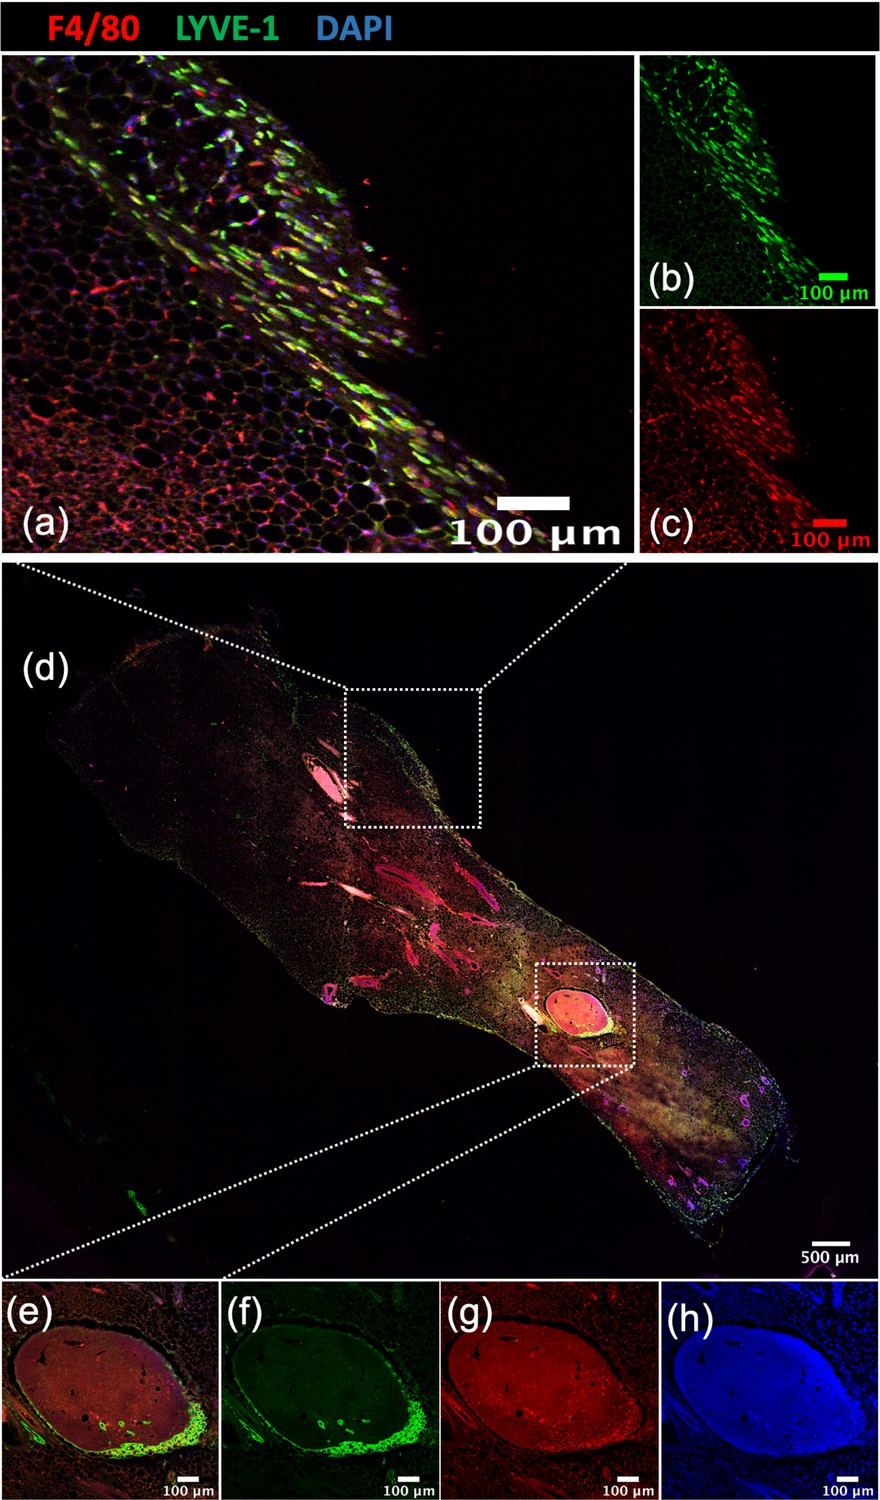
Localization of Lyve-1+ macrophages in the mammary gland.
Image of a mammary gland from a 6-week-old female mouse (n = 3) stained for F4/80 (red), Lyve-1 (green) and DAPI (blue). Insets show examples of the mammary gland capsule (a–d) and lymph nodes (e–h).
Figure 2 with 1 supplement
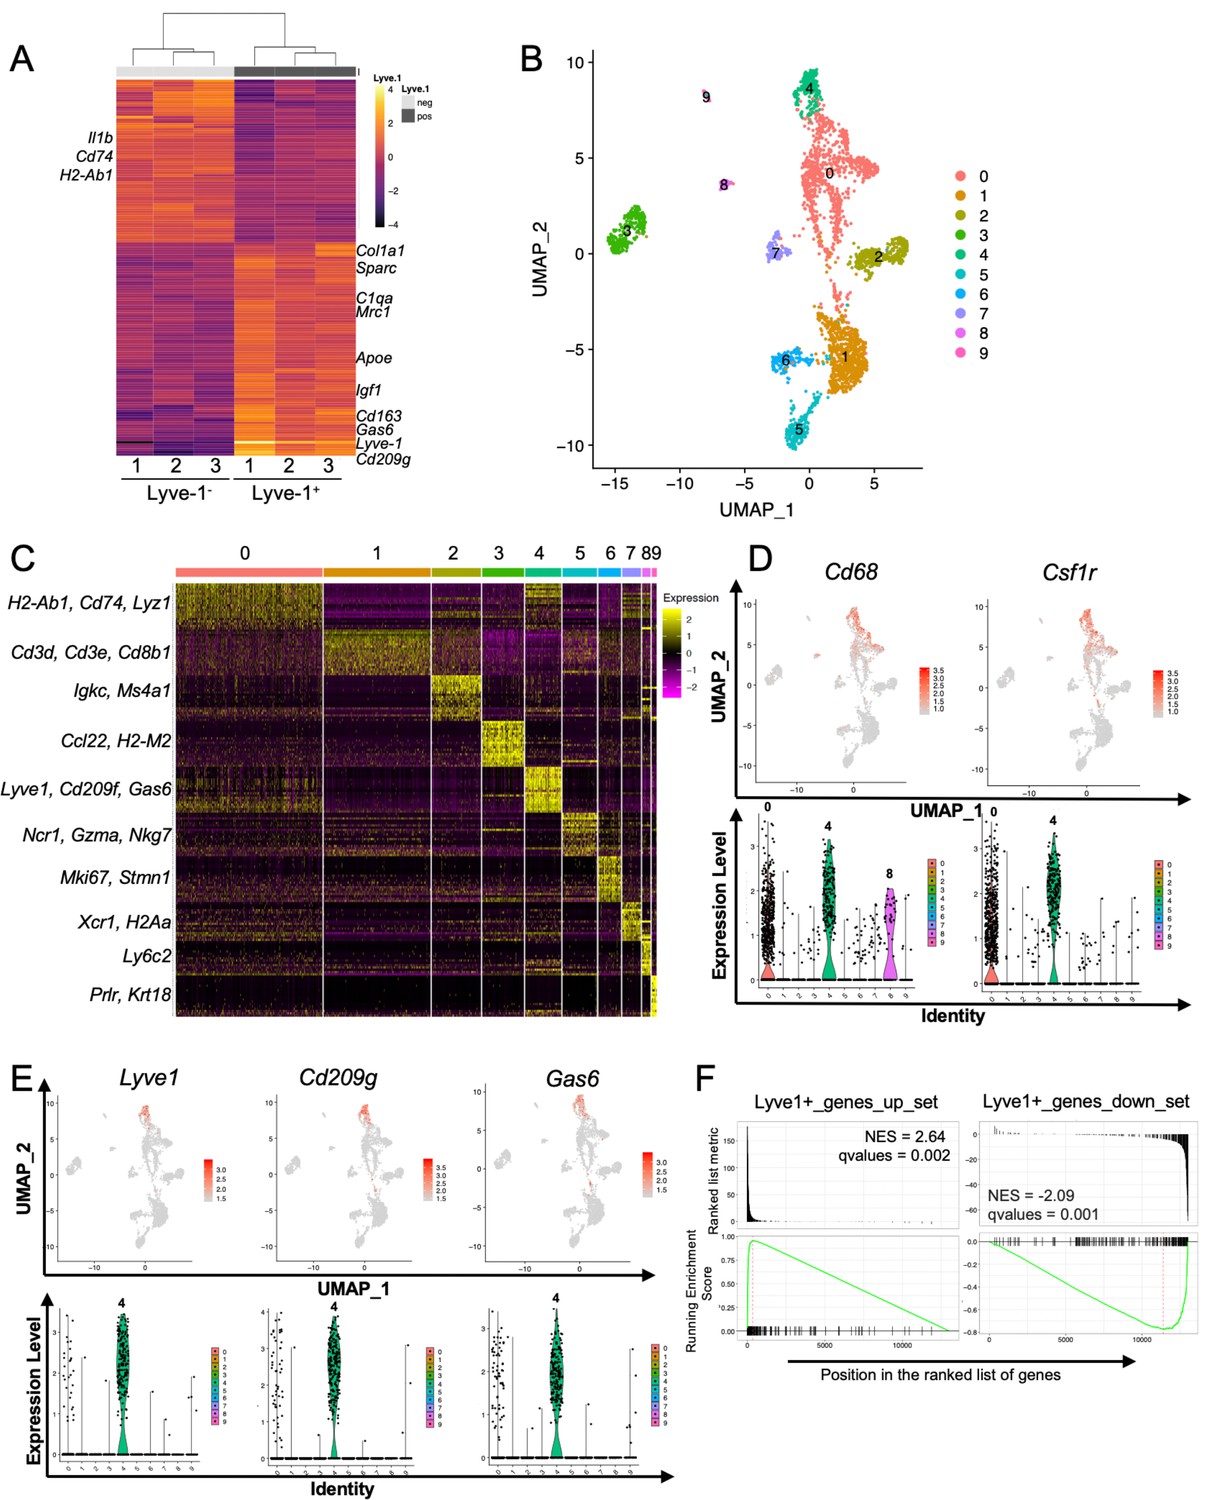
Identification of a distinct Lyve-1+ macrophage subpopulation by transcriptional profiling.
(A) Heat map of RNA-seq analysis of CD45+CD11b+F4/80+Lyve-1– and CD45+CD11b+F4/80+Lyve-1+ cells isolated from 6-week-old (lane 1) and 10-week-old (lanes 2–3) mice. Genes shown have an adjusted p-value <0.01 and a fold-change of >1 and <10 (abs values). For each lane, n = 4 pooled mice. (B) UMAP of scRNA-seq analysis of CD45+ cells isolated from 10-week-old mice as generated by Seurat. (C) Heat map of the top 20 differentially regulated genes in each cluster. (D) Feature plots and violin plots of selected macrophage genes. (E) Feature plots and violin plots of genes associated with cluster four that were also found in the bulk RNA-seq analysis. (F) GSEA demonstrating that the single-cell populations (clusters) are enriched for in the data from the bulk RNA-seq analysis.
Figure 2—figure supplement 1
Identification of a distinct Lyve-1+ macrophage subpopulation by transcriptional profiling.
(A) Post-sort analysis of CD45+CD11b+F4/80+Lyve-1– and CD45+CD11b+F4/80+Lyve-1+ cells that were submitted for bulk RNA-seq analysis. (B) scRNA-seq data showing genes associated with macrophages expressed in clusters 0 and 4. (C) Violin plots showing expression levels of Itgam and Itgax across clusters. (D) Graph showing Lyve-1 expression in F4/80+/CD11b– macrophages by flow cytometry.
Figure 3 with 1 supplement
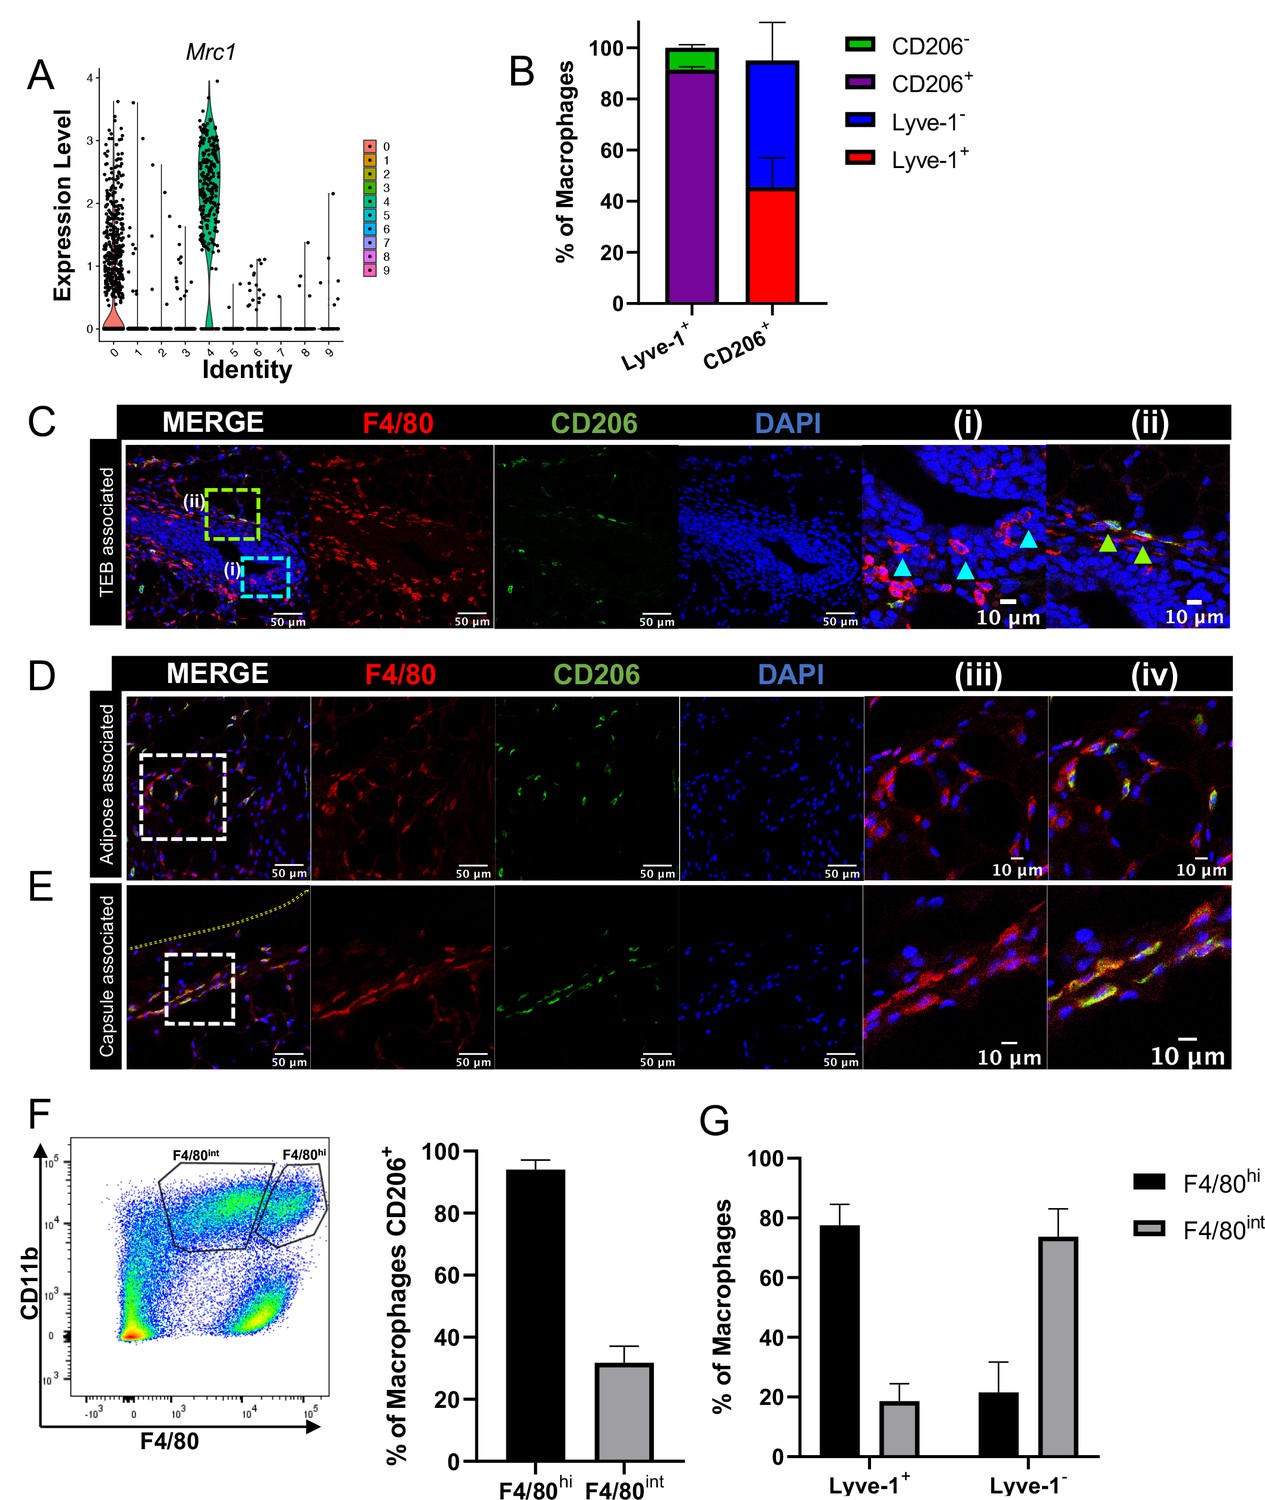
F4/80+Lyve-1+ cells are enriched for CD206 expression.
(A) Violin plot of Mrc1 expression in the single-cell RNA-seq dataset shown in Figure 2. (B) Mammary glands from 10-week-old mice (n = 4) were assessed for CD206 expression in CD45+CD11b+F4/80+Lyve-1- and CD45+CD11b+F4/80+Lyve-1+ cells by flow cytometry. (C) Mammary glands were harvested from 6-week-old mice (n = 5, three images/localization), immunostaining was performed for F4/80 and CD206, and the localization of single- and double-positive cells associated with TEBs was examined. Representative images of F4/80+CD206– (i, arrowheads) and F4/80+CD206+ (ii, arrowheads) cells are shown. (D, E) Representative images of F4/80+CD206+ cells in the adipose stroma and fibrous capsule of the mammary gland. Representative images show F4/80 (iii) and co-staining (iv). The yellow line in panel (E) shows the margin of the mammary gland. Insets show higher magnification. (F) Flow cytometry analysis showing F4/80hi and F4/80int cells in the mammary gland and CD206 expression in each population. (G) Flow cytometry analysis of F4/80 expression on Lyve-1– and Lyve-1+ cells. n = 4 mice analyzed.
-
Figure 3—source data 1
Source data for graphs in panels B, F, and G.
- https://cdn.elifesciences.org/articles/57438/elife-57438-fig3-data1-v3.xlsx
Figure 3—figure supplement 1

F4/80+Lyve-1+ cells are enriched for CD206 expression.
(A) Gating of flow cytometry for Lyve-1 expression in CD45+CD11b+F4/80+CD206– and CD45+CD11b+F4/80+CD206+ cells. (B) Gating of flow cytometry for CD206 expression in CD45+CD11b+F4/80+Lyve-1– and CD45+CD11b+F4/80+Lyve-1+ cells.
Figure 4
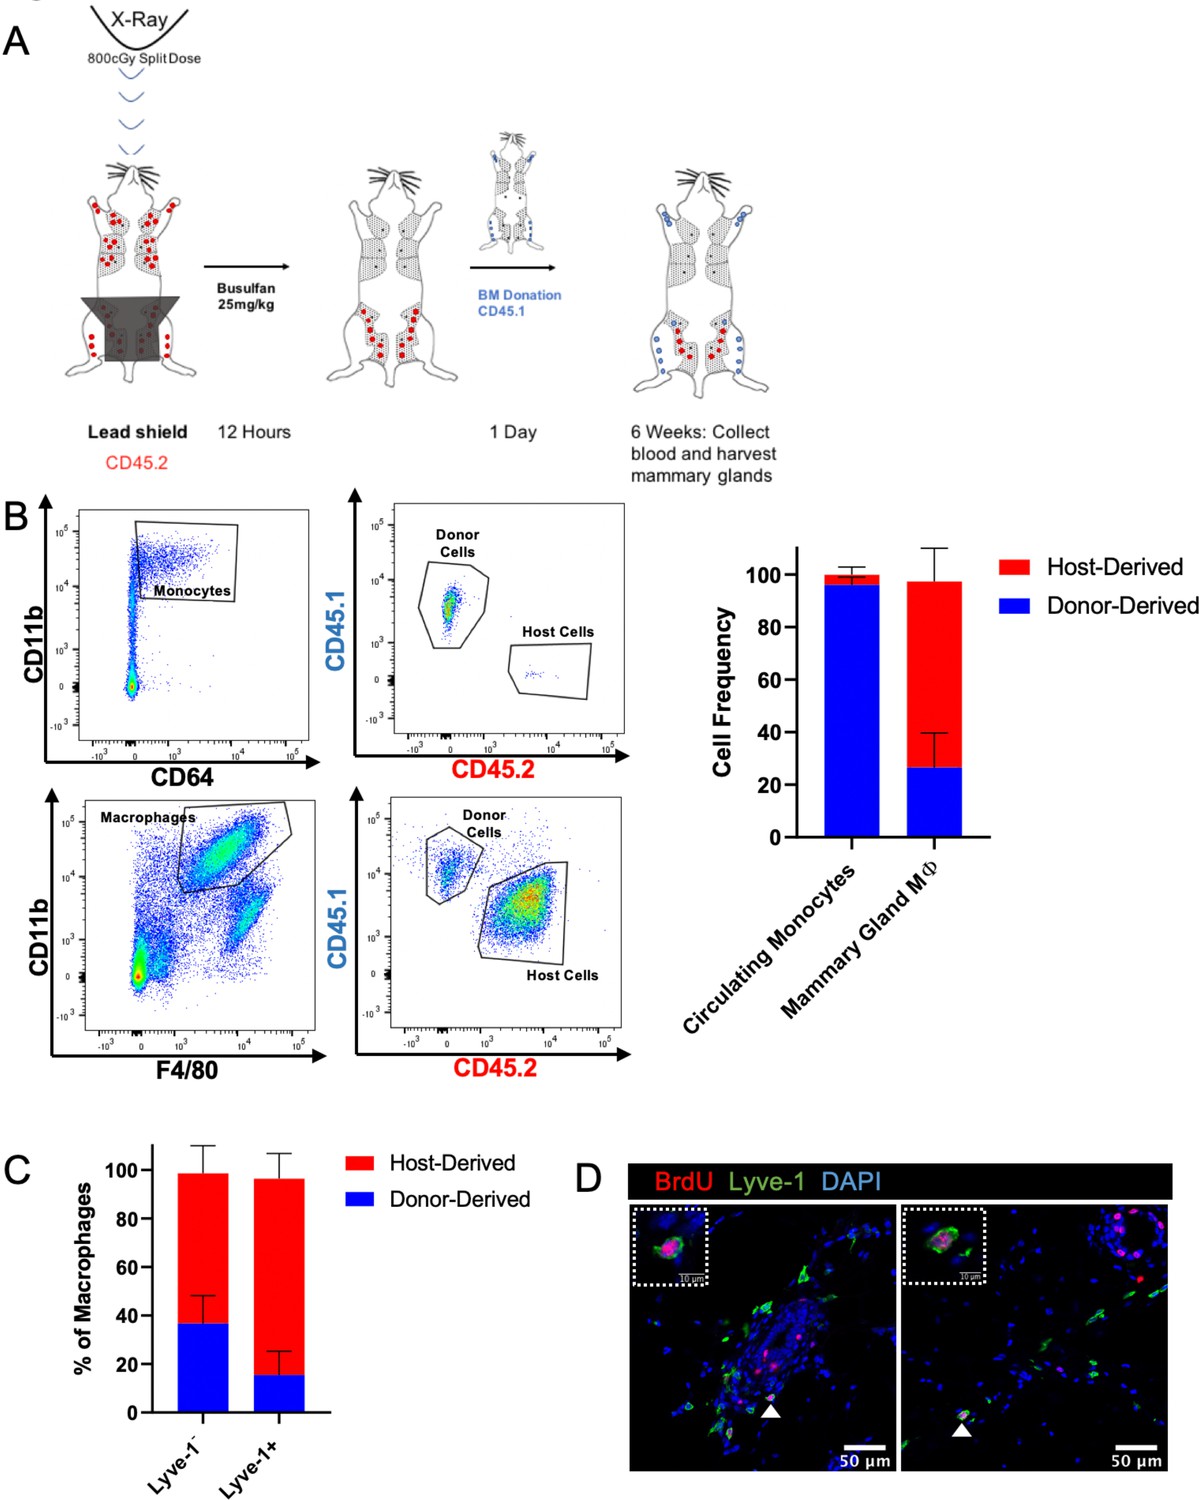
Lyve-1+ macrophages exhibit low turnover and self-renewal in the mammary gland.
(A) Schematic of shielded bone marrow chimera experiment. (B) Representative flow cytometry plots showing the gating and identification of host (CD45.2) and donor (CD45.1) cells in the blood and mammary gland. Quantification of flow cytometry demonstrates that although most of the monocytes in the blood are donor-derived, the majority of macrophages in the mammary gland are host-derived. Cells were first gated on Live and pan-CD45 expression. In the quantification graphs, n = 23 mice from three separate experiments. (C) Quantification of flow cytometry demonstrates that the majority of Lyve-1+ macrophages remain host-derived 6 weeks after bone marrow transplant. (D) Mammary glands were isolated from mice after a 2 hr BrdU pulse and immunostained for BrdU and Lyve-1 (n = 3, three images/localization). Examples of BrdU+Lyve-1+ cells are shown, insets show higher magnification.
-
Figure 4—source data 1
Source data for graphs in panels B and C.
- https://cdn.elifesciences.org/articles/57438/elife-57438-fig4-data1-v3.xlsx
Figure 5 with 1 supplement
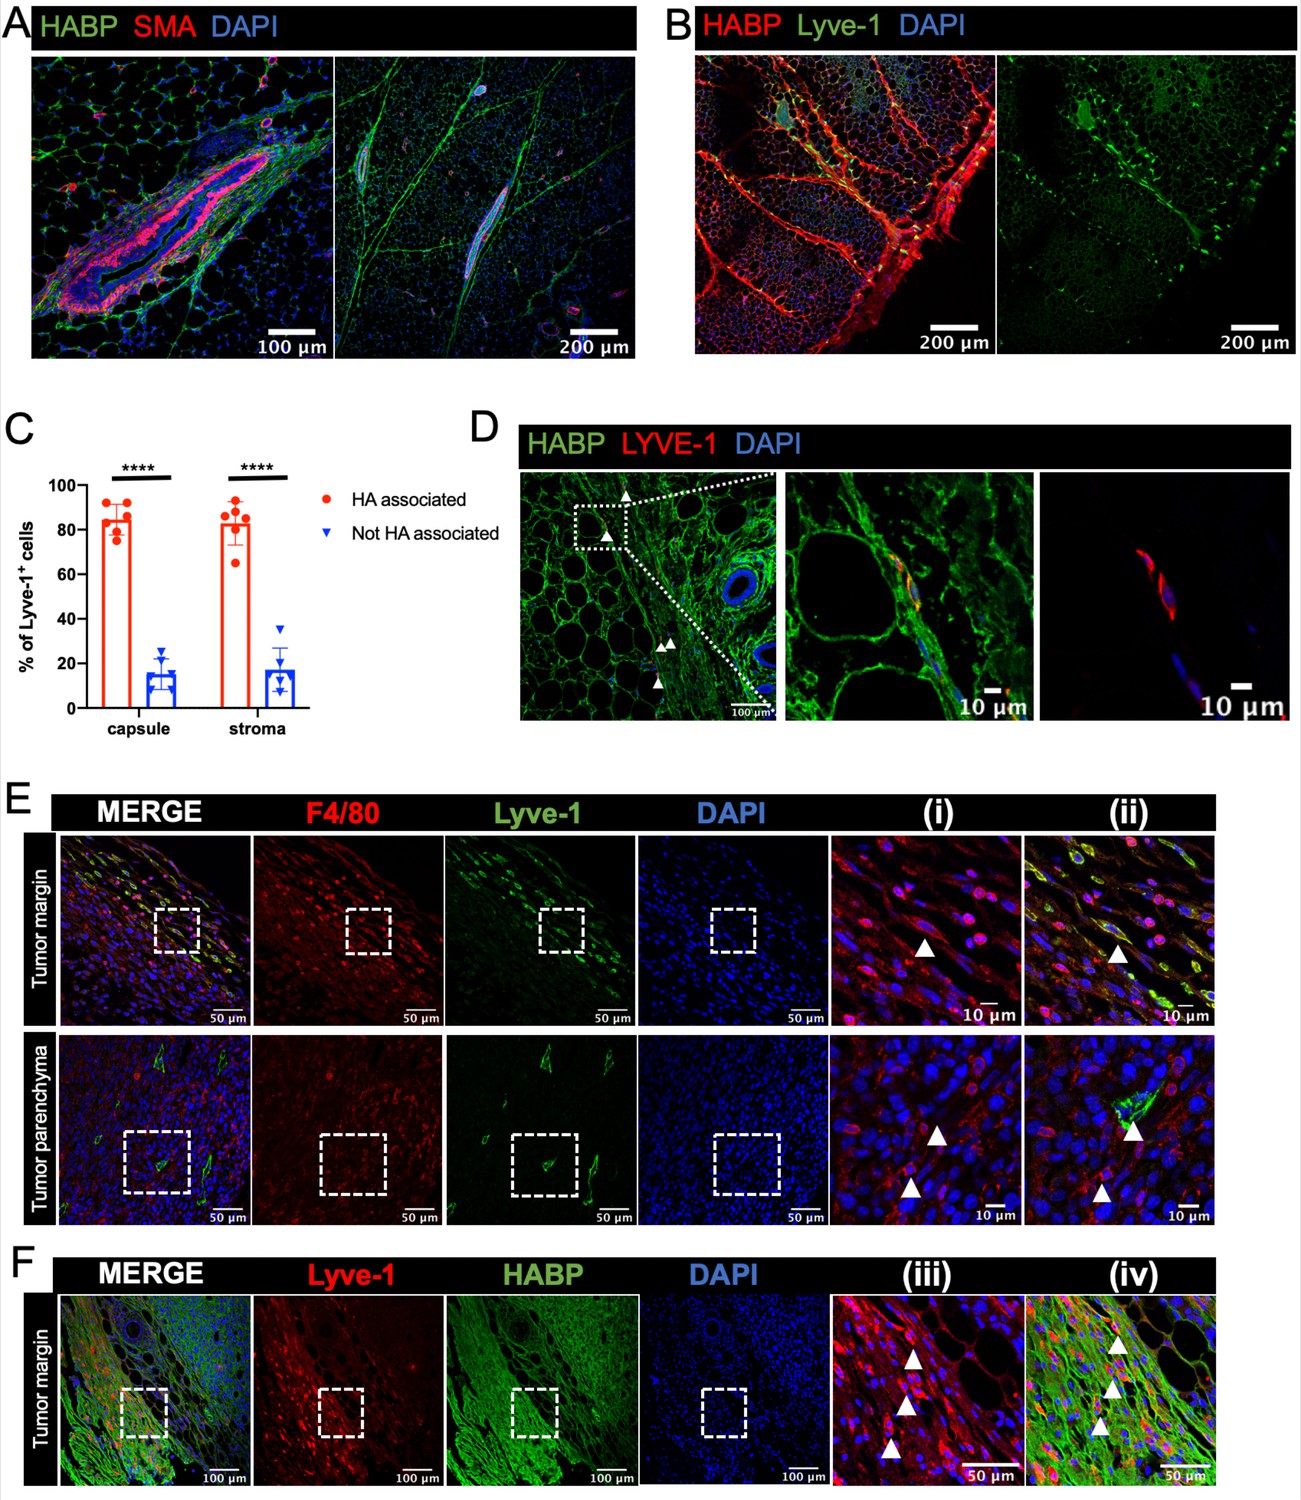
Lyve-1+ cells localize to HA-enriched ECM in the mammary gland.
(A) Mammary glands from 6-week-old mice were immunostained for HA using HA binding protein (HABP, green) and smooth muscle actin (SMA, red) (n = 3, three images/sample). (B) Mammary glands from 6-week-old mice were immunostained for HA using HA binding protein (HABP, red) and Lyve-1 (green) showing staining of the fibrous capsule and fibrous septae in the adipose stroma. (C) Quantification of Lyve-1+ cells associated with the capsule and adipose stromal regions in the mammary gland. N = 6 mice, three images analyzed per mammary gland. ****p<0.0001. (D) Co-staining of HABP and Lyve-1 in human mammary gland demonstrating the presence of HA-associated Lyve-1+ cells (n = 3, five images/sample). Arrowheads show Lyve-1+ cells and inserts show higher magnification. (E) Mammary tumor sections from 4T1 tumors were immunostained for F4/80 (red) and Lyve-1 (green) (n = 4, three images/localization). Representative images are shown of the peri-tumoral stroma and the tumor parenchyma. Inserts show higher magnification. (F) Mammary tumor sections from 4T1 tumors were immunostained for Lyve-1 (red) and HABP (green). Insets show higher magnification.
-
Figure 5—source data 1
Source data for graph in panel C.
- https://cdn.elifesciences.org/articles/57438/elife-57438-fig5-data1-v3.xlsx
Figure 5—figure supplement 1
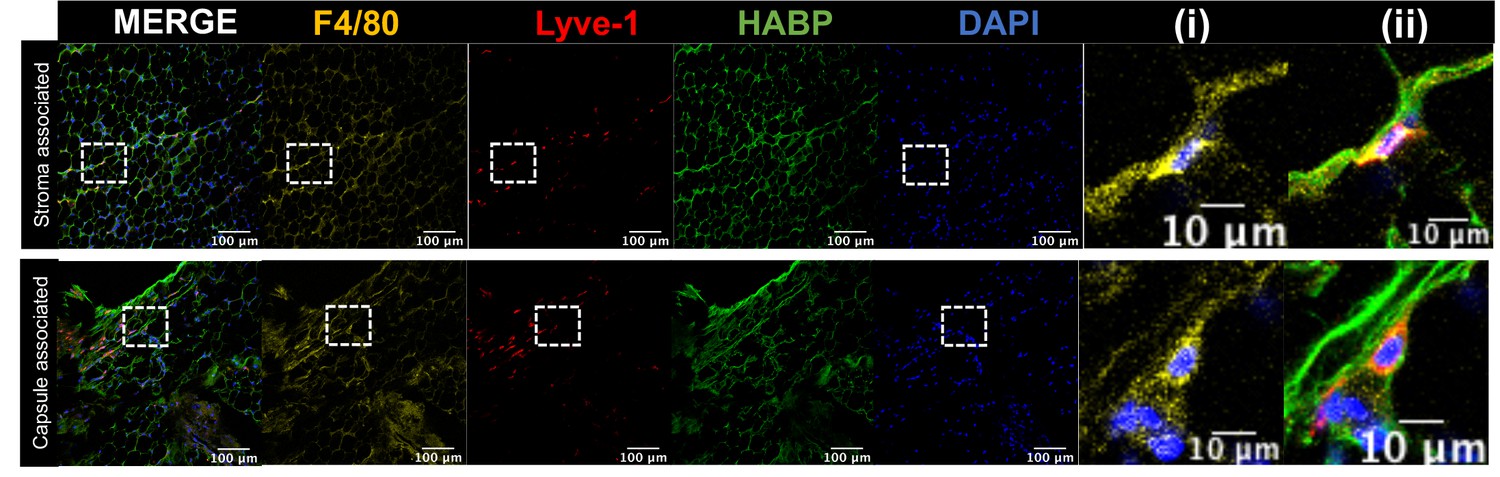
Lyve-1+ cells localize to HA-enriched ECM in the mammary gland.
Mammary glands were stained for F4/80, Lyve-1 and HABP to confirm that Lyve-1+ cells associated with HA are also F4/80+. Insets show higher magnification.
Figure 6 with 1 supplement
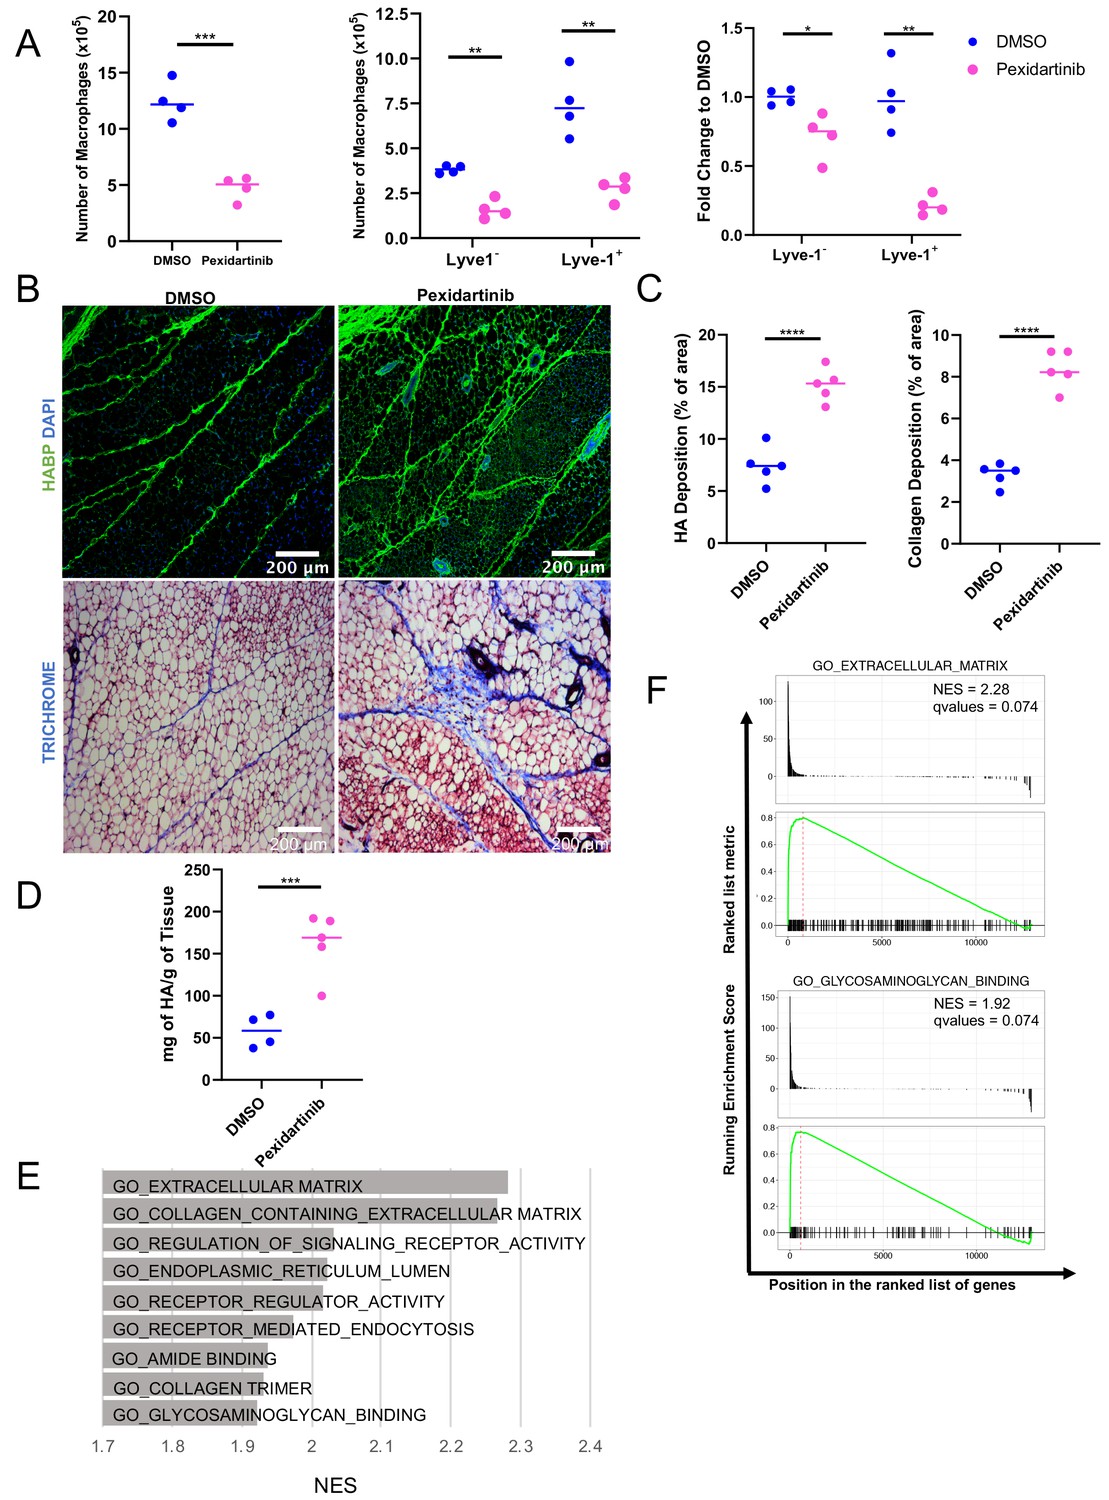
Macrophage depletion impacts ECM in the stroma.
(A) 5-week-old female mice were treated with pexidartinib for 2 weeks and mammary glands were harvested for analysis of macrophages for CD45+CD11b+F4/80+ by flow cytometry. Flow cytometry demonstrated depletion of CD45+CD11b+F4/80+Lyve-1– and CD45+CD11b+F4/80+Lyve-1+ cells in the mammary gland following pexidartinib treatment. Quantification of total cell counts and fold-change depletion are shown. Total Macrophages Number DMSO vs pexidartinib, p=0.0007; Lyve1– Macrophages Number DMSO vs pexidartinib, p=0.0015; Lyve1+ Macrophages Number DMSO vs pexidartinib, p=0.0095; Lyve1– Fold Change DMSO vs pexidartinib, p=0.037; Lyve1+ Fold Change DMSO vs pexidartinib, p=0.0052. These data demonstrate one representative experiment, experiments were repeated three times with similar results, n = 4 mice per treatment group. (B) Mammary glands from mice treated with either pexidartinib or solvent control were stained for HA (HABP, green) or with trichrome to visualize collagen-containing ECM (collagen, blue). (C) Quantification of HABP and collagen staining. Between 3 and 6 images/sample were analyzed for HABP and collagen staining, n = 5 per treatment group. Three replicates were used for HABP analysis and one replicate was done for collagen analysis. HA deposition (% of area) DMSO vs pexidartinib, p<0.0001 (pooled) and collagen deposition (% of area) DMSO vs pexidartinib, p<0.0001. (D) Quantification of HA in mammary glands isolated from mice treated with pexidartinib or solvent control normalized to gland weight, p=0.0015, n = 4 mice for control group and n = 5 mice for pexidartinib group. (E) GSEA analysis of the C5 database for gene sets enriched in cluster 4 from the scRNA-seq analysis showing the top nine enriched gene sets by NES. (F) GSEA plots of representative lists identified in panel (E). *, p<0.05; **, p<0.01; ***, p<0.005; ****, p<0.0001; using Welch’s t-test.
-
Figure 6—source data 1
Source data for graphs in panels A, C, and D.
- https://cdn.elifesciences.org/articles/57438/elife-57438-fig6-data1-v3.xlsx
Figure 6—figure supplement 1
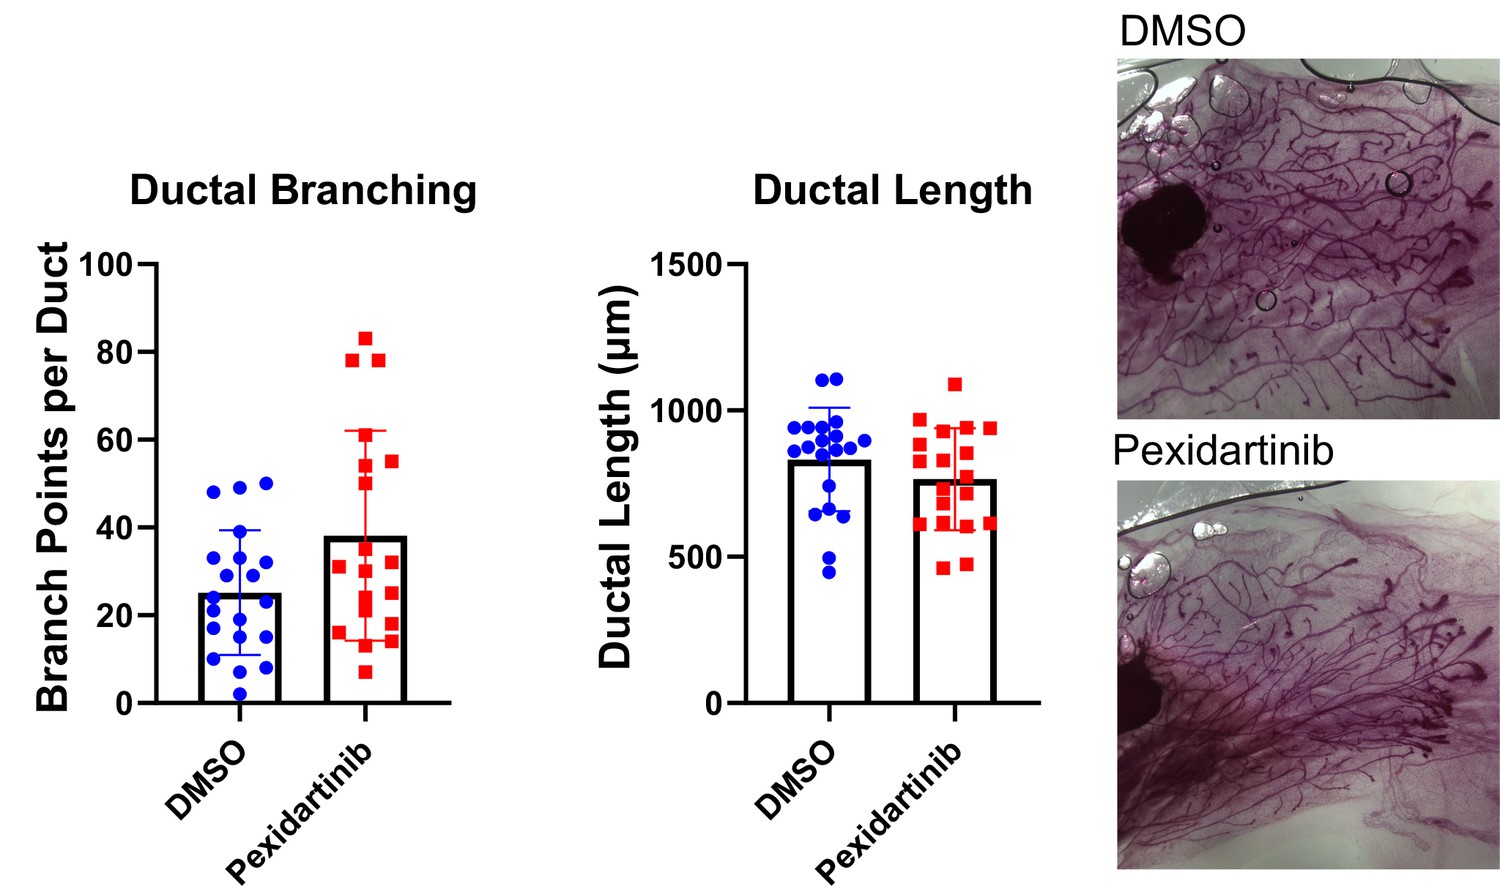
Macrophage depletion does not impact ductal elongation of branching.
Quantification of ductal elongation and branching in mammary glands from mice treated with either solvent or pexidartinib for 2 weeks. Ductal Branching DMSO vs pexidartinib, p=0.1081; Ductal Length DMSO vs pexidartinib, p=0.1661. P values generated using Mann-Whitney U Test.
Tables
Key resources table
| Reagent type (species) or resource | Designation | Source or reference | Identifiers | Additional information |
|---|---|---|---|---|
| Strain, strain background (Mus musculus, female) | FVB/N | Envigo | FVB/NHsd | |
| Strain, strain background (Mus musculus, female) | Balb/c CD45.2 Mice | Jackson Laboratories | Stock No.: 000651 | Balb/cJ Mouse Strain |
| Strain, strain background (Mus musculus) | Balb/c CD45.1 Mice | Jackson Laboratories | Stock No.: 006584 | CByJ.SJL(B6)-Ptprca/J Mouse Strain |
| Antibody | violetFluor 450-Conjugated anti-CD45.1 (mouse monoclonal) | Tonbo Biosciences | Cat #: 75–0453 U025 RRID:AB_2621949 | Flow cytometry: 1:200 |
| Antibody | Alexa Fluor 700-Conjugated anti-CD45.2 (mouse monoclonal) | BioLegend | Cat #: 109822 RRID:AB_493731 | Flow cytometry: 1:200 |
| Antibody | BUV395-conjugated anti-Ly6G (rat monoclonal) | BioLegend | Cat #: 563978 RRID:AB_2716852 | Flow cytometry: 1:400 |
| Antibody | Brilliant Violet 421-Conjugated Anti-CD64 (mouse monoclonal) | BioLegend | Cat #: 139309 RRID:AB_2562694 | Flow cytometry: 1:100 |
| Antibody | Brilliant violet 711-conjugated anti-CD11c (Armenian hamster monoclonal) | BioLegend | Cat #: 117349 RRID:AB_2563905 | Flow cytometry: 1:200 |
| Antibody | PE/Cy7-conjugated anti-CD11b (rat monoclonal) | BioLegend | Cat #: 101216 RRID:AB_312799 | Flow cytometry: 1:200 |
| Antibody | PE-conjugated anti-F4/80 (rat monoclonal) | BioLegend | Cat #: 123109 RRID:AB_893498 | Flow cytometry: 1:200 |
| Antibody | Biotinylated anti-Lyve-1 (goat polyclonal) | R and D Systems | Cat #: BAF2125 RRID:AB_2138529 | Flow cytometry:4 μg/mL |
| Antibody | Anti-CD16/CD32 (rat monoclonal) | eBioscience | Cat #: 14-0161-82 RRID:AB_467133 | Flow cytometry: 1:200 |
| Antibody | Rat anti-mouse monoclonal F4/80 (clone: CI: A3-1) | Bio-Rad laboratories | Cat# MCA497GA RRID:AB_323806 | IF 1:100 |
| Antibody | Goat polyclonal anti-mouse LYVE-1 (Ala24-Thr234) | R and D Systems | Cat# AF2125 RRID:AB_2297188 | IF 1:60 |
| Antibody | Anti-mannose receptor (rabbit polyclonal) | Abcam | Cat# ab64693 RRID:AB_1523910 | IF 1:1000 |
| Antibody | Anti-BrdU antibody [BU1/75 (ICR1)] | Abcam | Cat# ab6326 RRID:AB_305426 | IF 1:200 |
| Antibody | Hyaluronic acid bindingprotein, biotinylated | Millipore Sigma | Cat# 385911–50 UG | IF 1:100 |
| Antibody | Actin-smooth muscle (rabbit polyclonal) | Spring Bioscience | Cat# E2464 RRID:AB_95752 | IF 1:50 |
| Antibody | CD68 monoclonal antibody (514H12) | Thermo- Fisher Scientific | Cat# MA1-80133 RRID:AB_929283 | IF 1:100 |
| Antibody | Human LYVE-1 antibody (goat polyclonal) | R and D Systems | Cat# AF2089 RRID:AB_355144 | IF 1:60 |
| Antibody | Alexa 594 secondary antibody (donkey anti-mouse) | Thermo- Fisher Scientific | Cat# A-32744 RRID:AB_2762826 | IF 1:400 |
| Antibody | Alexa 594 secondary antibody (donkey anti-rat) | Thermo- Fisher Scientific | Cat# A-21209 RRID:AB_2535795 | IF 1:400 |
| Antibody | Alexa Fluor 488 conjugated streptavidin secondary antibody | Thermo- Fisher Scientific | Cat# S11223 | IF 1:400 |
| Antibody | Alexa 488 secondary antibody (donkey anti-goat) | Thermo- Fisher Scientific | Cat# A-11055 RRID:AB_2534102 | IF 1:400 |
| Antibody | Alexa 488 secondary antibody (goat anti-rabbit) | Thermo- Fisher Scientific | Cat# A-11008 RRID:AB_143165 | IF 1:400 |
| Antibody | Alexa 594 secondary antibody (goat anti-rat) | Thermo- Fisher Scientific | Cat # A-11007 RRID:AB_10561522 | IF 1:400 |
| Antibody | Alexa 594 secondary antibody (goat anti-rabbit) | Thermo- Fisher Scientific | Cat# A-11012 RRID:AB_2534079 | IF 1:400 |
| Antibody | Alexa Fluor 647 conjugated streptavidin secondary antibody | Thermo- Fisher Scientific | Cat# S-32357 | IF 1:400 |
| Commercial assay or kit | Hyaluronan enzyme-linked immunosorbent assay | Echelon Biosciences | Cat #: K-1200 | |
| Chemical compound, drug | Busulfan | Sigma-Aldrich | Cat #: B2635-10G | |
| Chemical compound, drug | Pexidartinib | Selleck Chem | Cat #: S7818 | |
| Chemical compound, drug | Heparin | Sigma-Aldrich | Cat #: H3149-10KU | |
| Chemical compound, drug | Collagenase A | Sigma-Aldrich | Cat #: 10103586001 | |
| Chemical compound, drug | DNase I | Sigma-Aldrich | Cat #: DN25-100MG | |
| Software, algorithm | GraphPad Prism 8.0 | GraphPad Prism 8.0 | RRID:SCR_002798 | http://www.graphpad.com/scientific-software/prism/ |
| Software, algorithm | ImageJ 2.0.0 | ImageJ 2.0.0 | RRID:SCR_003070 | https://imagej.nih.gov/ij/download.html |
| Software, algorithm | Hisat2 | Kim et al., 2015 | RRID:SCR_015530 | version 2.0.2 |
| Software, algorithm | DESeq2 software | Love et al., 2014 | RRID:SCR_015687 | version 1.20.0 |
| Software, algorithm | ggplot2 | R | RRID:SCR_014601 | v3.0.0 |
| Software, algorithm | pheatmap | R | RRID:SCR_016418 | 1.0.12 |
| Other | Flow Cytometry Perm Buffer (10X) | Tonbo Biosciences | Cat #: TNB-1213-L150 | |
| Other | Fixable Viability Dye eFluor 780 | eBioscience | Cat #: 65-0865-14 | Flow cytometry: 1:1000 dilution |
| Other | APC-conjugated streptavidin | eBioscience | Cat #: 17-4317-82 | Flow cytometry: 1:100 dilution |
| Other | ProLong Gold Antifade Mountant (DAPI) | Thermo- Fisher Scientific | Cat# P36931 | |
| Other | Trichrome stain kit | Abcam | Cat# ab150686 | |
| Other | Antigen Retrieval Buffer (100X EDTA Buffer, pH 8.0) | Abcam | Cat# ab93680 | 1x |
| Other | Antigen unmasking solution, PH 6.0 | Thermo- Fisher Scientific | Cat# NC9401067 | 1x |
Additional files
-
Supplementary file 1
List of 155 differentially expressed genes in CD45+CD11b+F4/80+Lyve-1– and CD45+CD11b+F4/80+Lyve-1+ bulk RNA-seq analysis.
- https://cdn.elifesciences.org/articles/57438/elife-57438-supp1-v3.xlsx
-
Supplementary file 2
List of the top 100 differentially regulated genes in each cluster from the scRNA-seq analysis.
- https://cdn.elifesciences.org/articles/57438/elife-57438-supp2-v3.xlsx
-
Supplementary file 3
GSEA analysis using gene sets created from a differentially expressed ranked list from the bulk RNA-seq data (adjusted p-value <0.1 and a fold-change >0.25) to determine enrichment of cluster 4.
- https://cdn.elifesciences.org/articles/57438/elife-57438-supp3-v3.xlsx
-
Supplementary file 4
List of top gene sets identified by GSEA analysis including core enriched genes.
- https://cdn.elifesciences.org/articles/57438/elife-57438-supp4-v3.xlsx
-
Transparent reporting form
- https://cdn.elifesciences.org/articles/57438/elife-57438-transrepform-v3.docx
Download links
A two-part list of links to download the article, or parts of the article, in various formats.
Downloads (link to download the article as PDF)
Open citations (links to open the citations from this article in various online reference manager services)
Cite this article (links to download the citations from this article in formats compatible with various reference manager tools)
Tissue-resident macrophages promote extracellular matrix homeostasis in the mammary gland stroma of nulliparous mice
eLife 9:e57438.
https://doi.org/10.7554/eLife.57438


