Molecular basis for the adaptive evolution of environment-sensing by H-NS proteins
- Department of Chemistry, The University of Vermont, United States
- King Abdullah University of Science and Technology (KAUST), Computational Bioscience Research Center (CBRC), Biological and Environmental Science and Engineering (BESE), Saudi Arabia
- King Abdullah University of Science and Technology (KAUST), Biological and Environmental Science and Engineering (BESE), Saudi Arabia
- Centre de Biochimie Structurale, CNRS, INSERM, Université de Montpellier, France
Figures
Figure 1
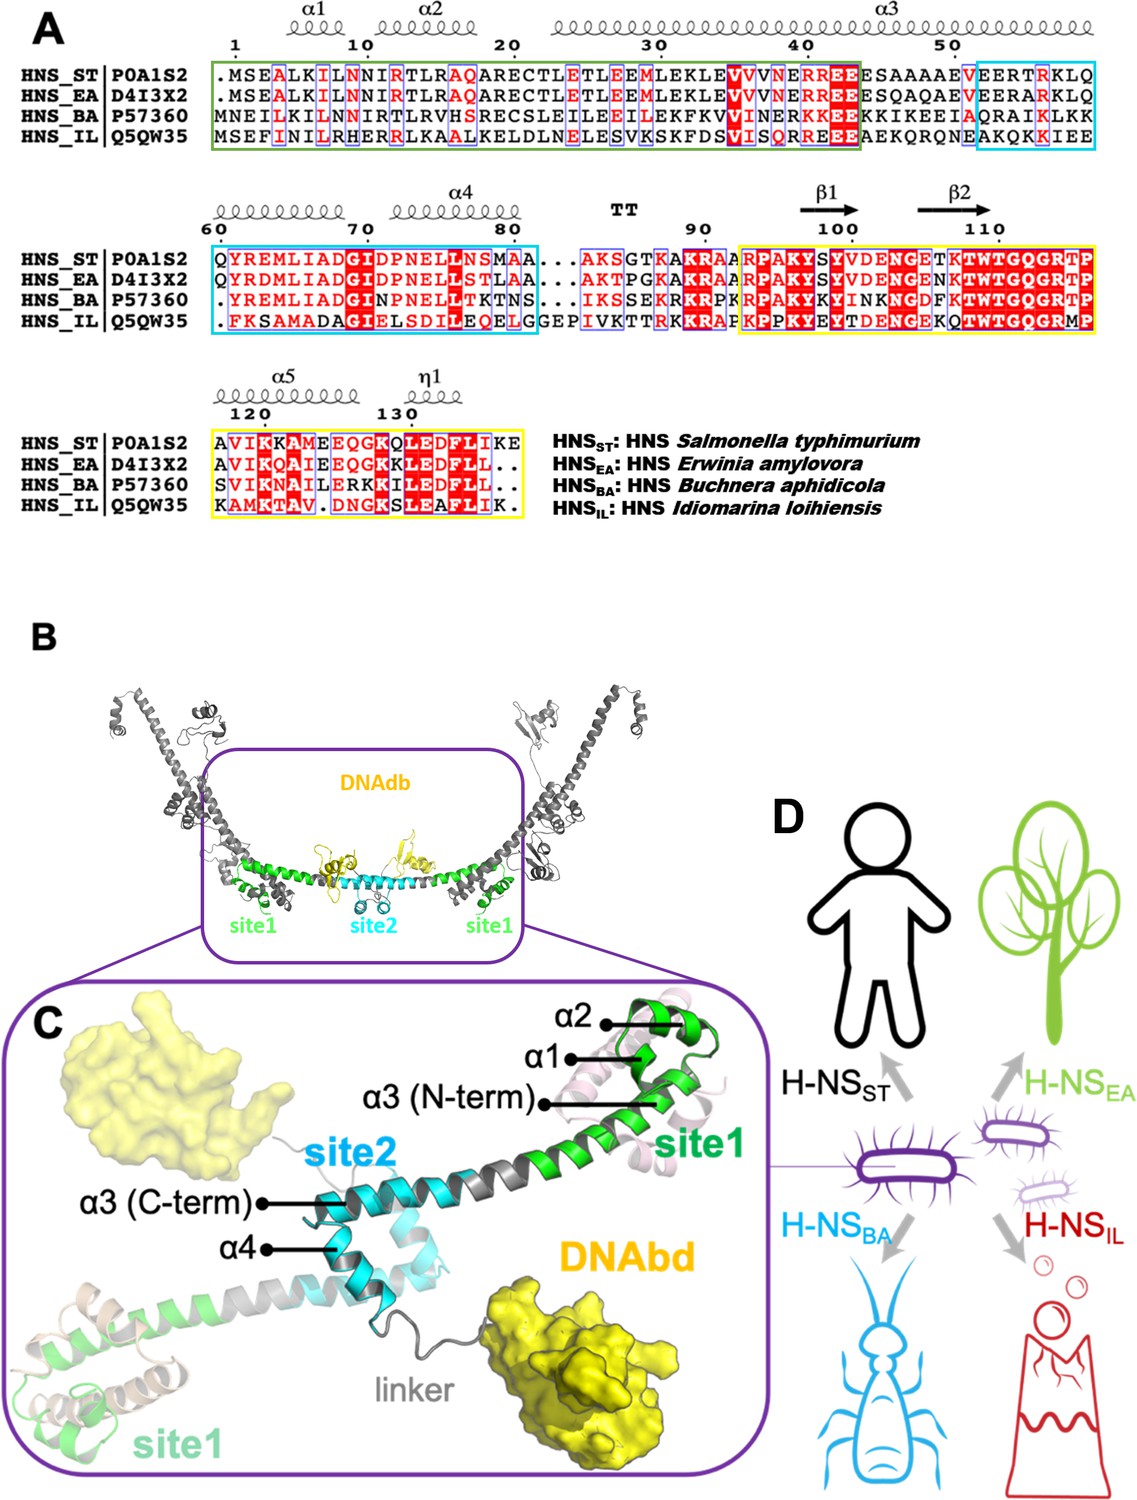
The sequence, structure, and habitat of selected histone-like nucleoid-structuring (H-NS) orthologs.
(A) Sequence alignment of H-NS orthologs (prepared with ESPript 3.0) (Robert and Gouet, 2014): H-NSST (Salmonella typhimurium; UniprotID: P0A1S2), H-NSEA (Erwinia amylovora; UniprotID: D4I3 × 2), H-NSBA (Buchnera aphidicola; UniprotID: P57360), and H-NSIL (Idiomarina loihiensis UniprotID: Q5QW35). The color scheme for sequence similarity is as follows: red background (identical in four orthologs) > red font (similar residues) > black font (totally different). Green, cyan, and yellow frames indicate the site1 (residues 1–44), site2 (resides 52–82), and DNAbd (residues 93–137). (B) Multimer formed by H-NSST. The model was built based on the available experimental structures (PDB accessions 3NR7 and 2L93). One H-NSST dimer shows site1, site2, and DNAbd colored as in (A) (green, cyan, and yellow, respectively). (C) The tetrameric H-NSST model we used for molecular dynamics (MD) is shown. The central dimer has each domain color-coded as in (A) and (B). (D) Illustration of the environment of the selected orthologs.
Figure 2 with 2 supplements
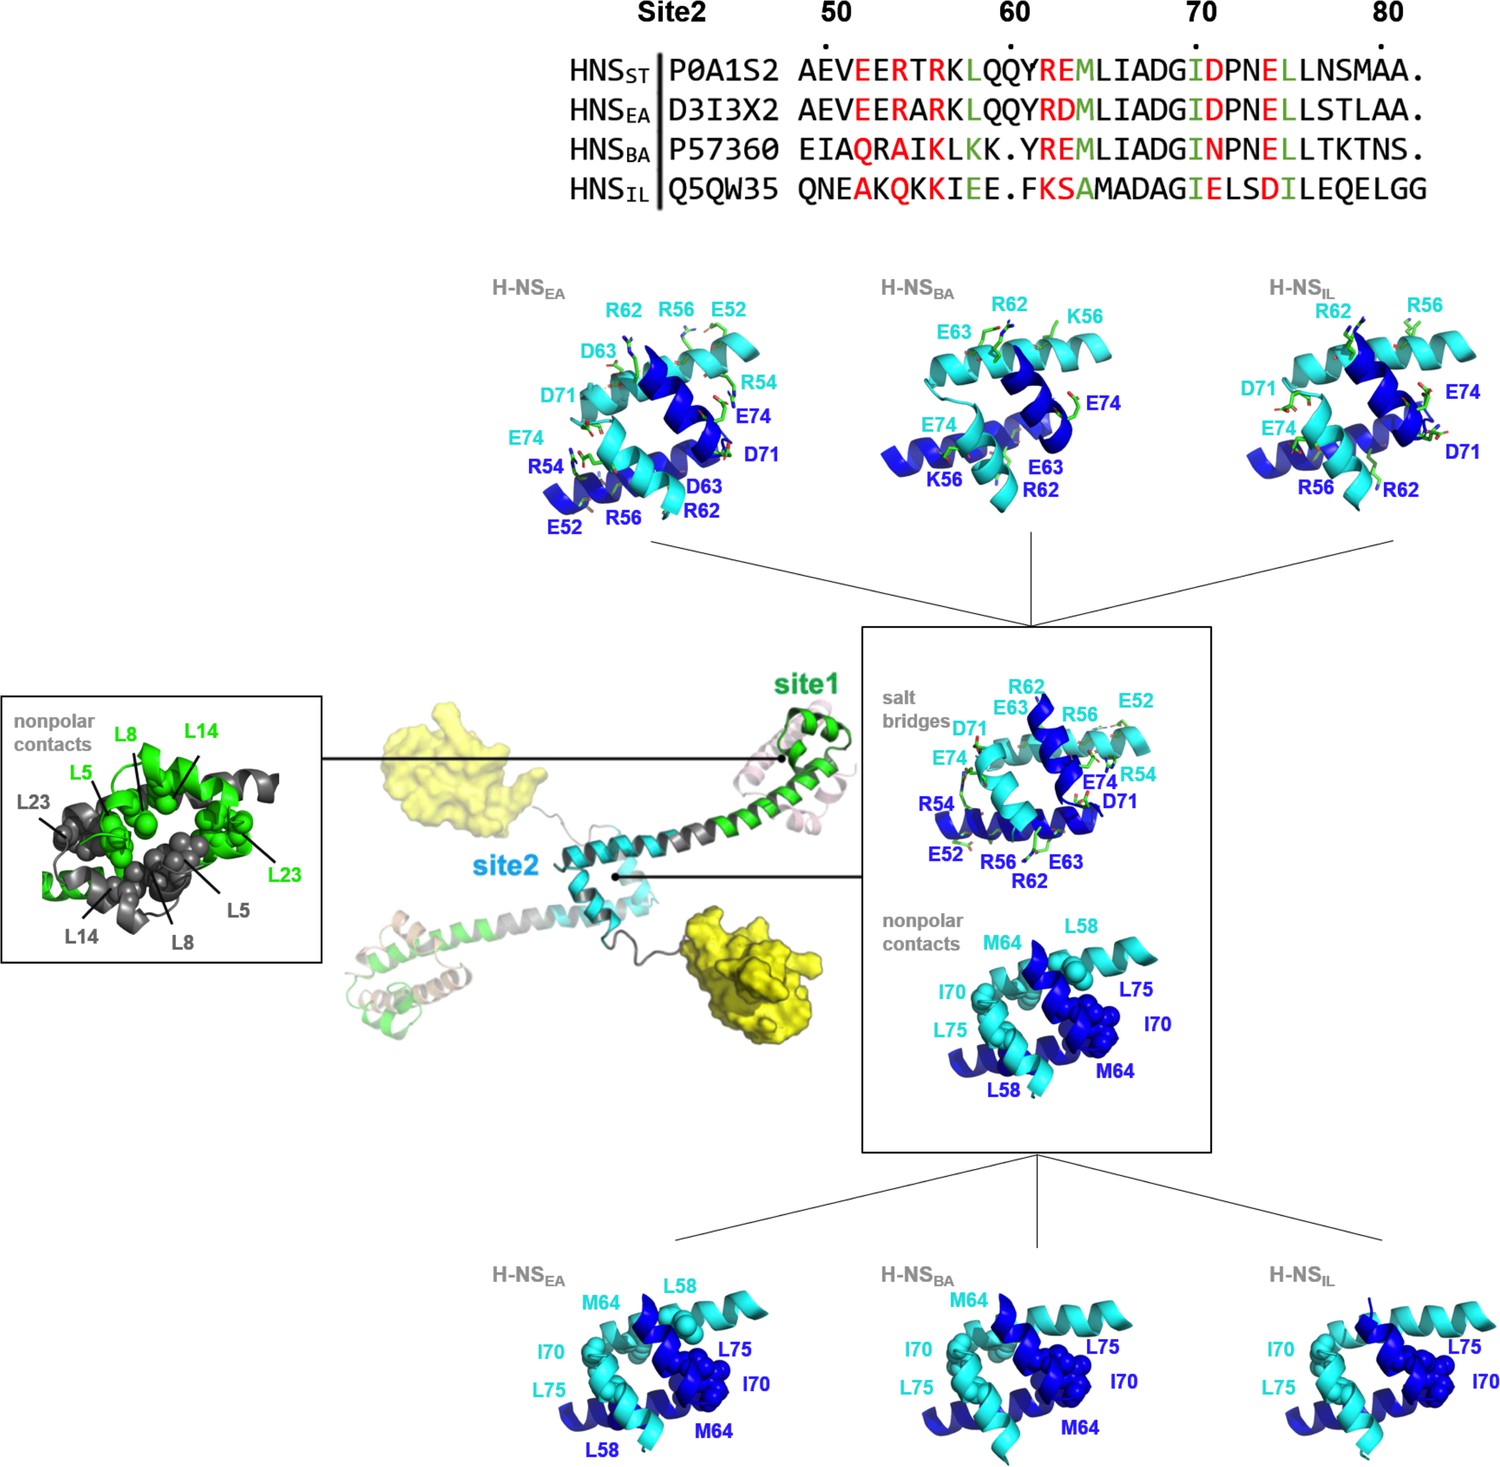
Nonpolar and ionic interactions in histone-like nucleoid-structuring (H-NS) site1 and site2 dimers.
Hydrophobic contact residues are shown as sphere models and polar contact residues as stick models. The two protein chains forming the dimer are color-coded. The site2 sequence alignment indicates in red the residue sites that potentially form salt bridges in H-NSST, and in green the residues that form nonpolar contacts in H-NSST. For additional details, see Figure S1.
Figure 2—figure supplement 1
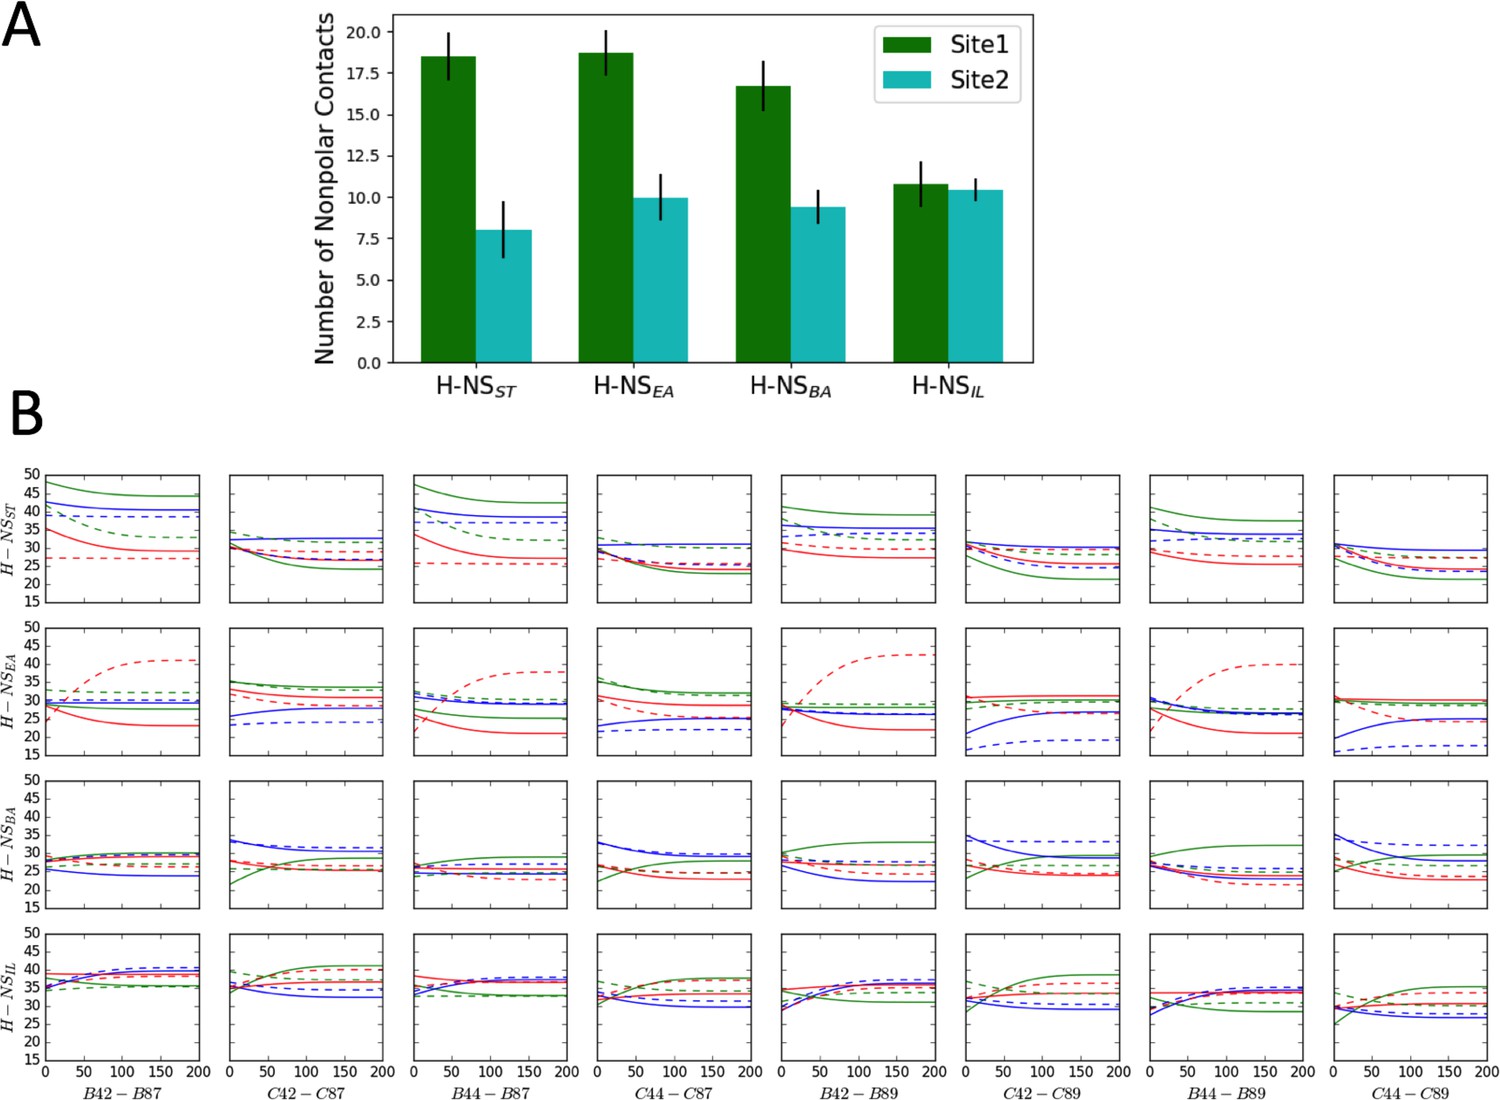
Computational analysis of H-NS nonpolar contacts and site2 dynamics.
(A) Comparison of nonpolar contacts of H-NS orthologs at 20°C and 0.15M NaCl, using the last 100 ns in the molecular dynamics (MD) simulations. (B) The separation distance between residue 42/44 and residue 87/89 (Y axis in Å) versus time (X axis in nanosecond). The separation distance was measured as the Cα−Cα distance in the tetramer model (within chains B/C, which were modeled as full-length molecules). The color scheme annotates different simulation conditions: 20°C, 0.15 M NaCl (green), 20°C, 0.50 M NaCl (blue), and 40°C, 0.15 M NaCl (red). For clarity, we show the smoothed data of two replicas for each system (solid and dash lines, respectively). Since complete unfolding of site2 was not observed in these simulations (presumably due to the short timescale and the difficulty of sampling), these plots indicate a minimum separation of 15–20 Å between the N- and C-termini, demonstrating that site2 has to unfold to allow closer contacts between the termini.
Figure 2—figure supplement 2
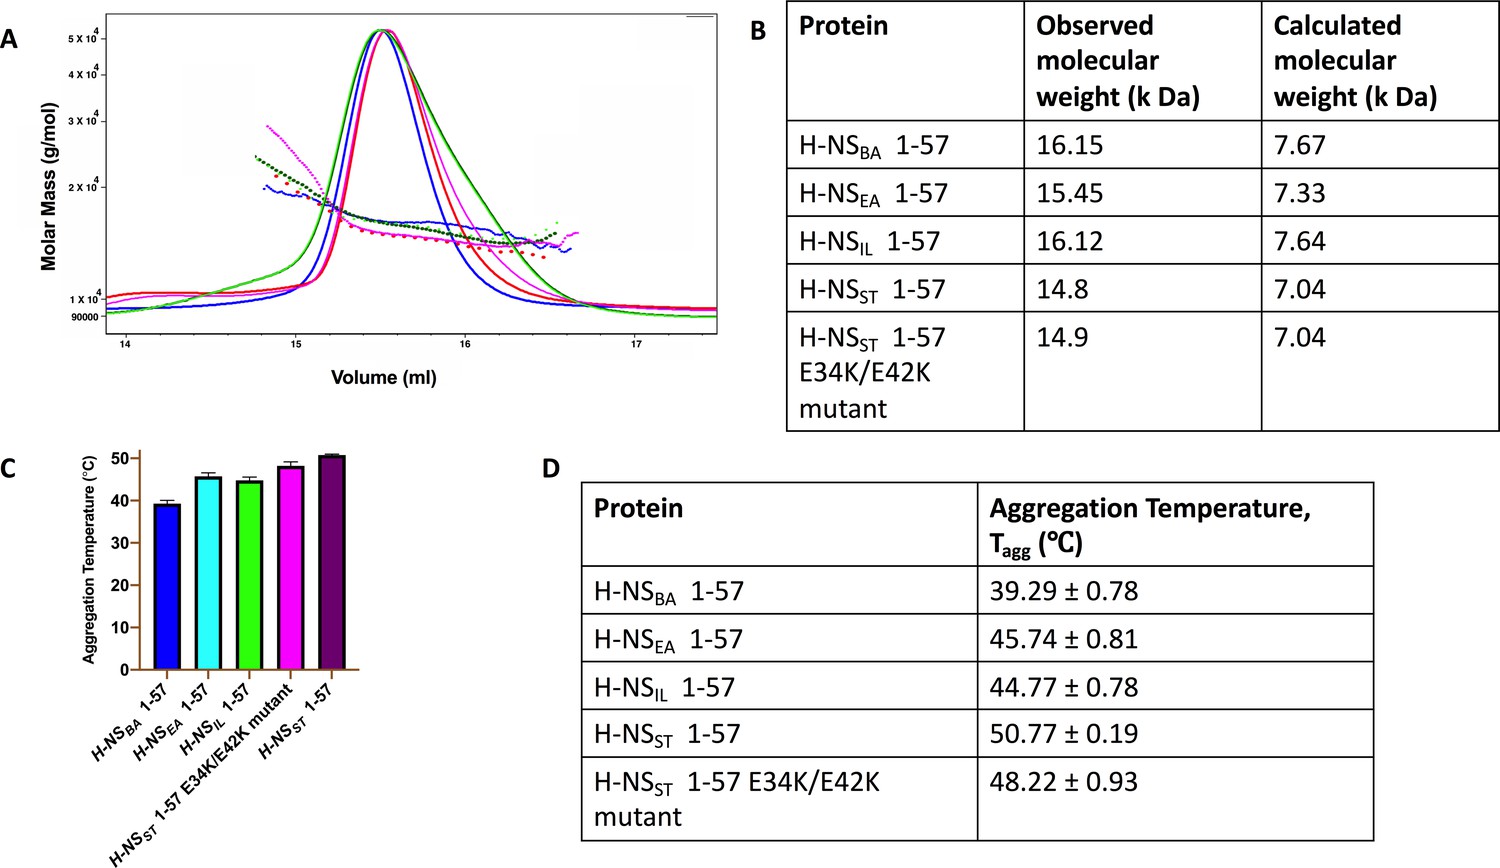
Dimerization and stability of H-NS 1-57.
(A) Size exclusion chromatography–multi-angle light scattering elution profile of H-NSBA (dark green), H-NSEA (fluorescent green), H-NSIL (violet), H-NSST (red), and H-NSST E34K/E42K (magenta) in buffer containing 20 mM HEPES pH 7.5 and 150 mM NaCl. (B) Table showing observed molecular weight and calculated molecular weight for monomeric protein of H-NS 1-57. (C) Aggregation temperature of H-NS 1-57 measured between 20 and 95°C in buffer containing 20 mM HEPES pH 7.5 and 150 mM NaCl. (D) Table showing the aggregation temperature of H-NS 1-57 proteins.
Figure 3 with 2 supplements
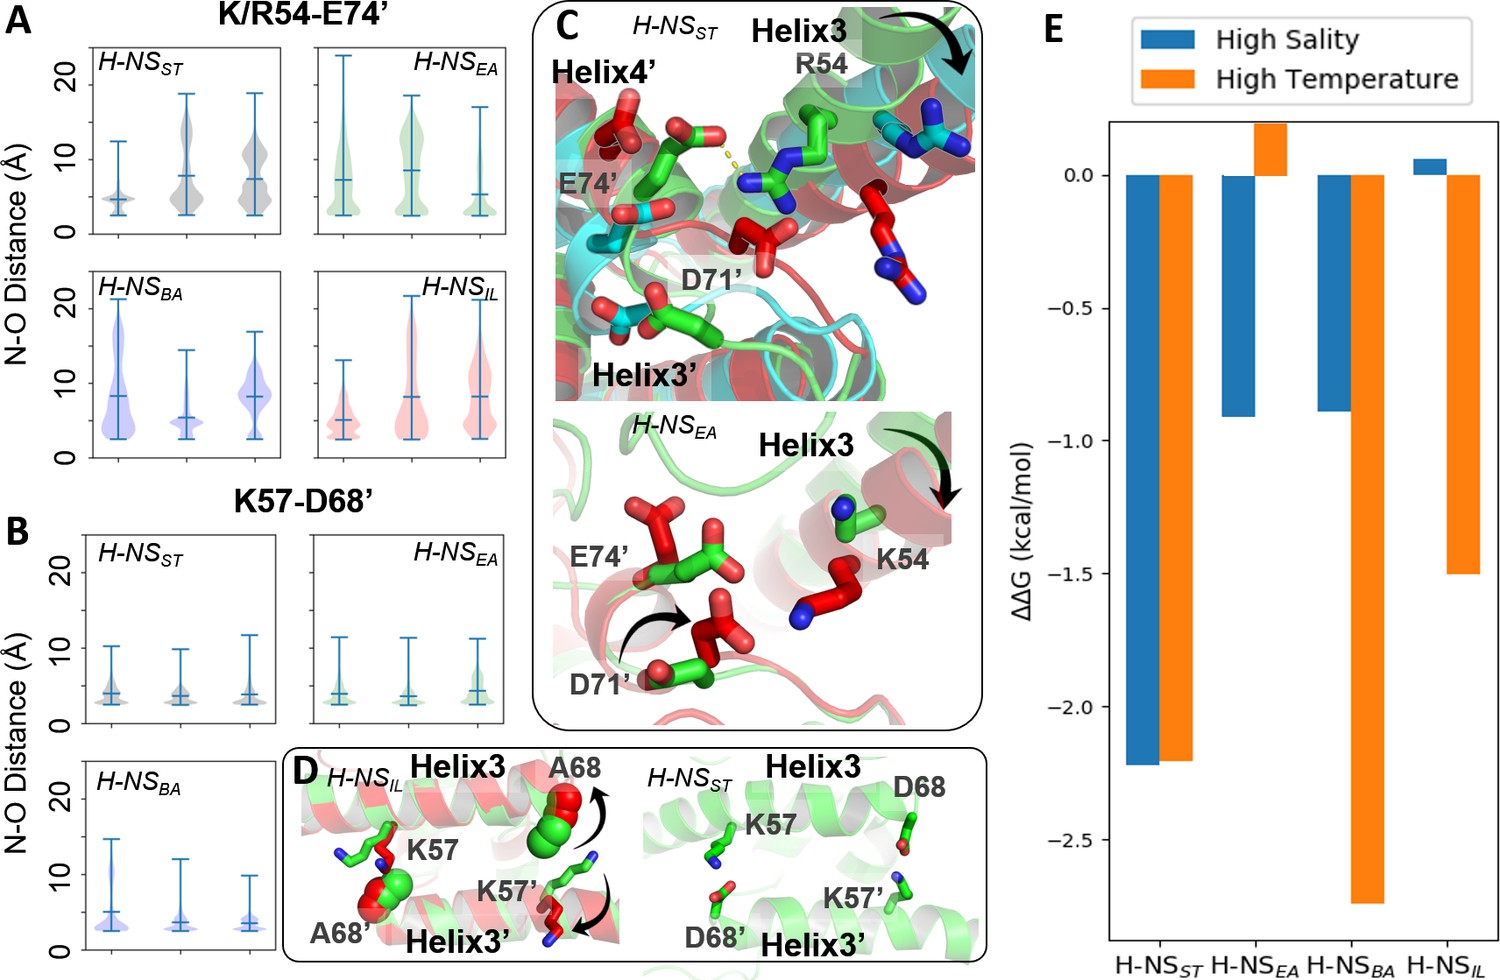
Conserved inter-dimer salt bridges observed in molecular dynamics (MD) simulations.
(A, B) Violin plots of the distance between the nearest side chain nitrogen atom of lysine/arginine and the side chain oxygen atom of aspartic/glutamic acid in the salt bridge. Each subplot shows the results obtained at 20°C, 0.15 M NaCl (left), 40°C, 0.15 M NaCl (middle), and 20°C, 0.50 M NaCl (right). Each ‘violin’ displays the mean value (the bar in the center of the violin), the range (the stretched line), and the distribution of the distance (kernel density on the side). As we use the numbering of H-NSST, there are position shifts in H-NSBA and H-NSIL: R54 to R53, K57 to K56, and D68 to D67 in H-NSBA; R54 to K53 in H-NSIL. (C) Final snapshots of the R54-E74’ salt bridge in H-NSST and K54-D71’ in H-NSEA. Color scheme of the cartoon: 20°C, 0.15 M NaCl (green), 40°C, 0.15 M NaCl (red), and 20°C, 0.50 M NaCl (cyan). (D) Final snapshots of the K57-D/A68 contact in H-NSST and H-NSIL. Same color scheme as (C). (E) Free energy changes as a result of increased salinity or temperature, according to the potential of mean force (PMF) calculated from umbrella sampling.
Figure 3—figure supplement 1
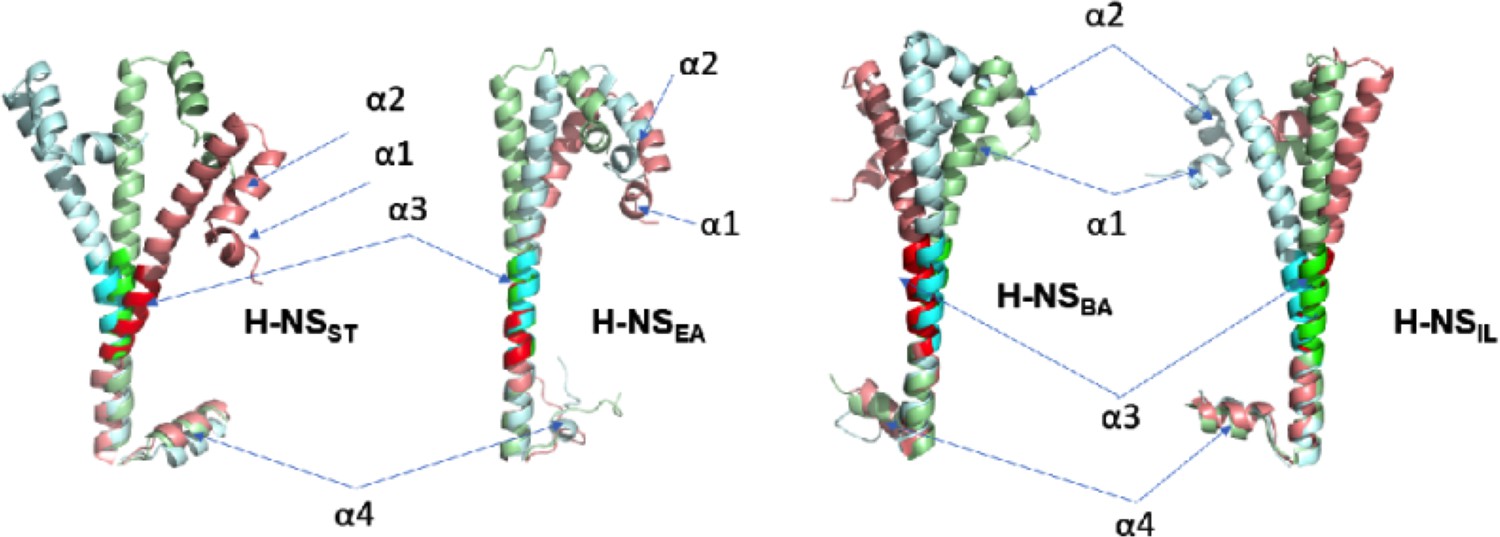
Representative H-NS monomers (with site2 alignment) from the final snapshots (at 200 ns) of the tetramer simulations under different conditions: 20°C, 0.15 M NaCl (green), 20°C, 0.50 M NaCl (cyan), and 40°C, 0.15 M NaCl (red).
To highlight the linker region in α3, we use a pale color for the rest of the backbone in each protein. This figure shows that while H-NS proteins are mostly ‘straight’ at 20°C, 0.15 M NaCl (green), bending of α3 is common through all H-NS orthologs under the high-temperature or high-salinity condition. The most significant bending is found in H-NSST.
Figure 3—figure supplement 2
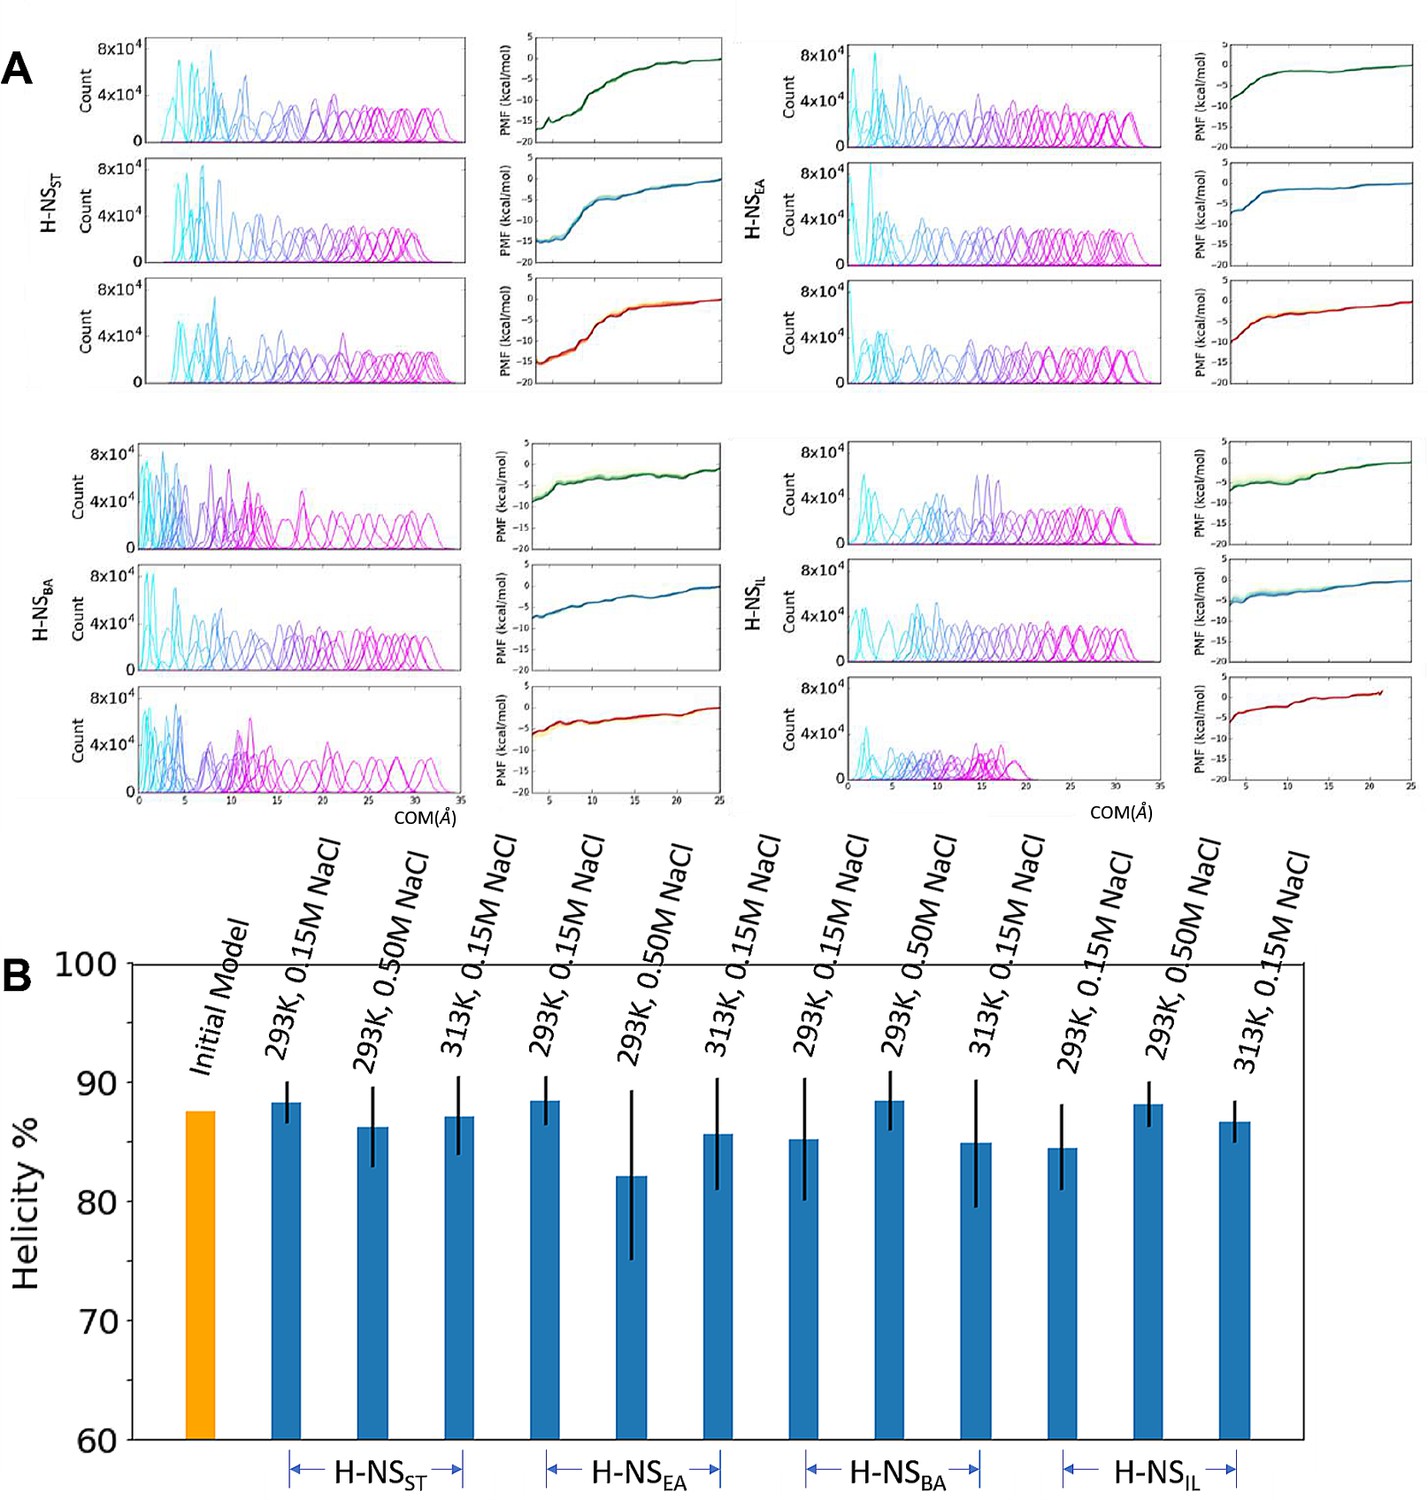
Umbrella sampling for H-NS site2 dimers.
(A) The umbrella histogram and convergency to simulate the H-NS orthologs site2 dimer at different simulation conditions: 20°C, 0.15 M NaCl (Green), 20°C, 0.50 M NaCl (Blue), and 40°C, 0.15 M NaCl (Red). Each PMF subplot contains a series of five curves from 38 to 54 ns/window (4 ns increment), demonstrating convergence. (B) Shown are the initial (yellow bar) and final (blue bars) average helicity percentage of all windows in umbrella sampling.
Figure 4 with 1 supplement
The atomistic details of histone-like nucleoid-structuring (H-NS) autoinhibition revealed by high-resolution proton-less low-γ detected NMR.
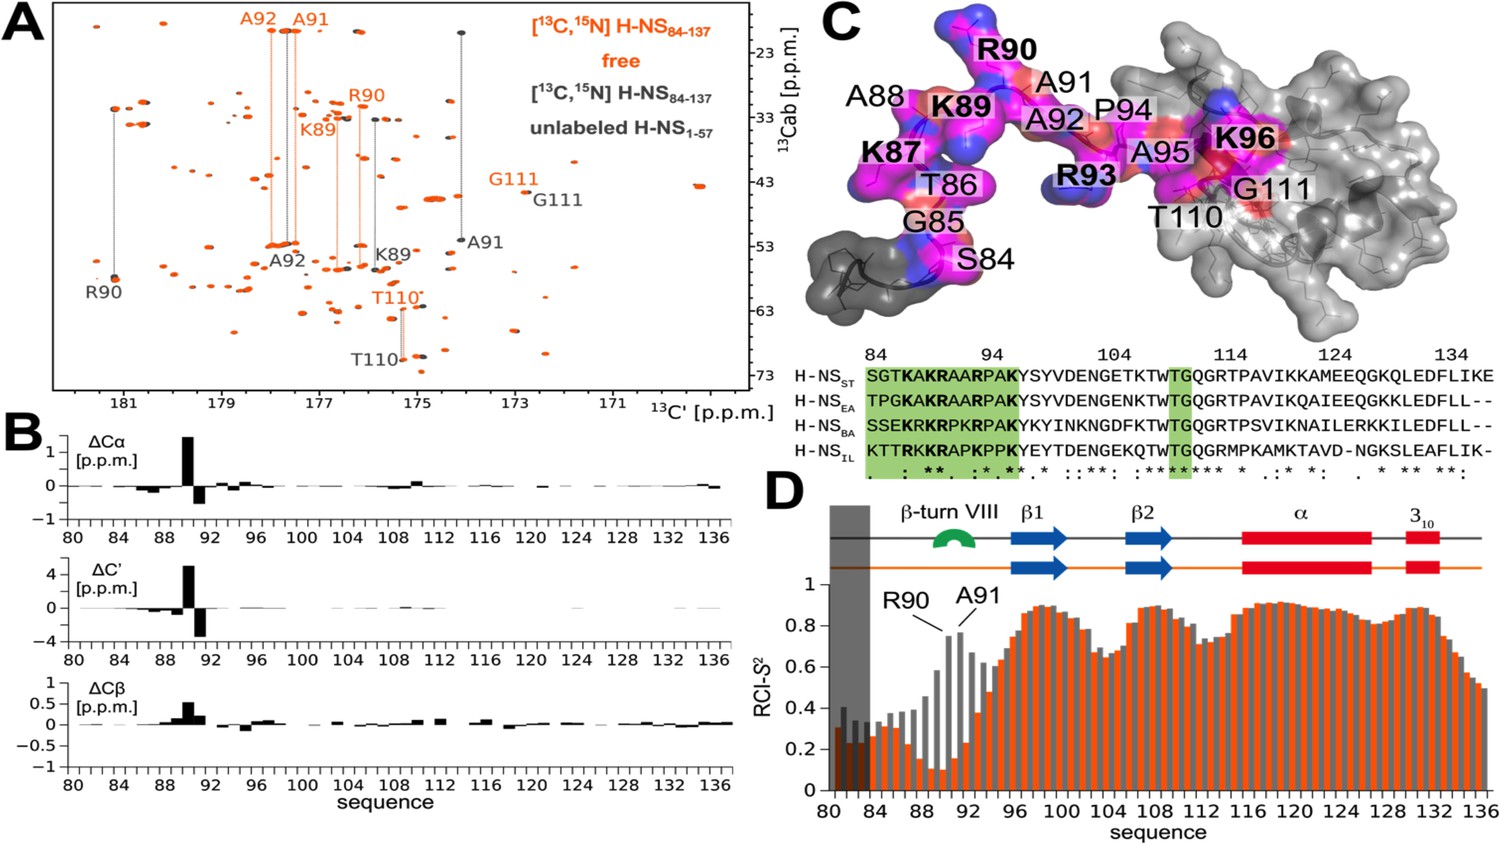
(A) The 2D CBCACO correlation 13C-detected spectra of 200 µM 13C,15N H-NSSTCt (orange) and 150 µM 13C,15N H-NSSTCt saturated 1:10 (molar) with unlabeled 1.5 mM H-NS1-57 (dark grey). Given a Kd of ~4 µM (Shahul Hameed et al., 2019) over 99% of H-NSSTCt are expected to be in the complexed form under these conditions. The OX axis holds all of the 13C,15N H-NSSTCt backbone C’ carbonyl chemical shifts correlated with OY (marked 13Cab) where each amino acid stripe crosses with its own Cα and Cβ (linked by thin dotted lines). (B) Top panel: The 13C chemical shift differences as a function of residue number of H-NS1-57 saturated 13C,15N H-NSSTCt and apo form. The most marked changes occur in residues K89, R90, A91, and A92 that predominantly form a β-turn type VIII. (C) Structural model of the H-NSSTCt in transparent surface representation revealing the backbone as ribbon. The structure is based on PDB ID 2L93, but extended N-terminally in random conformation to represent the full sequence of our construct in its apo form. All residues experiencing significant 13C chemical shift changes upon binding to H-NS1-57 are marked in magenta on the structure of the H-NSSTCt; positive residues (R+K) are labeled in bold. Bottom panel: The sequence alignment of the four selected HN-S orthologs highlighting conserved positively charged linker residues (bold) and residues implicated in binding to site1 (green). (D) Secondary structure motifs (red: helix; blue: β-sheet; green: β-turn, present only in the complex) and the RCI-S2 order parameter (describing the backbone dynamics) of ligand-free (orange) and saturated (gray) H-NSSTCt are shown.
Figure 4—figure supplement 1
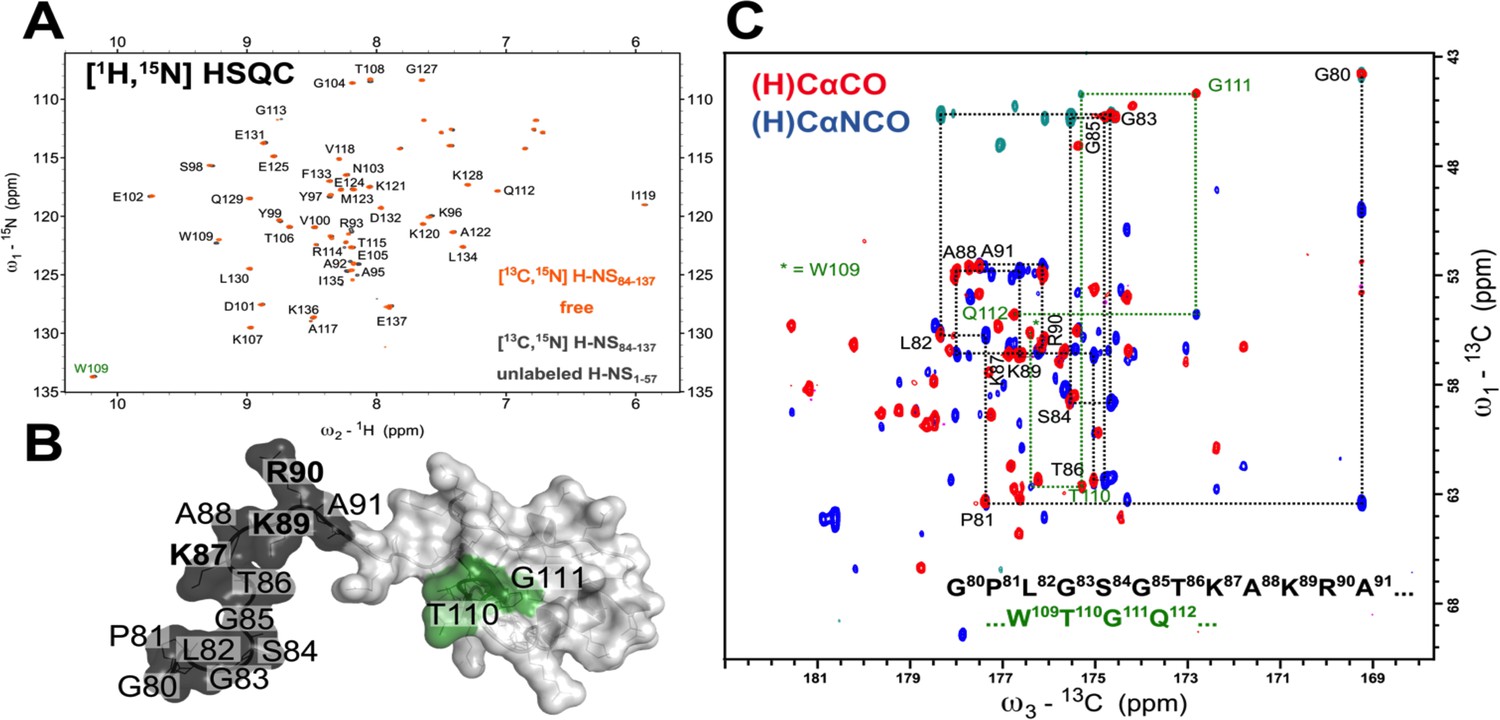
The low-γ 13C-detected experiments unveil the molecular details of highly dynamic and solvent-exposed residues elusive for classical 1H-detected approaches.
(A) The 1H-15N HSQC spectrum of 200 µM 13C,15N-labeled S. typhimurium H-NS84-137 protein in Apo (orange) and H-NS1-57 saturated (1.5 mM) form (dark gray). The residues that are missing from H/N correlation 1H-detected experiments are depicted in (B) with black and green mapped on the NMR solution structure of H-NS91-137 (PDB id 1HNR; the lowest energy structure). The flexible residues of S84-A91 were added together with GPLG artificial residues left after the tag cleavage. The only tryptophan side chain Hε/Nε imidazole correlation is marked W109 in green. (C) The overlay of 2D (H)CACO and (H)CANCO 13C-detected experiments and sequential walk for two regions, G80-A91 marked black and T110-G111 marked green, that are not detected on (A). A complete sequential carbon walk can be done for the entire protein H-NS84-137 sequence.
Figure 5 with 1 supplement
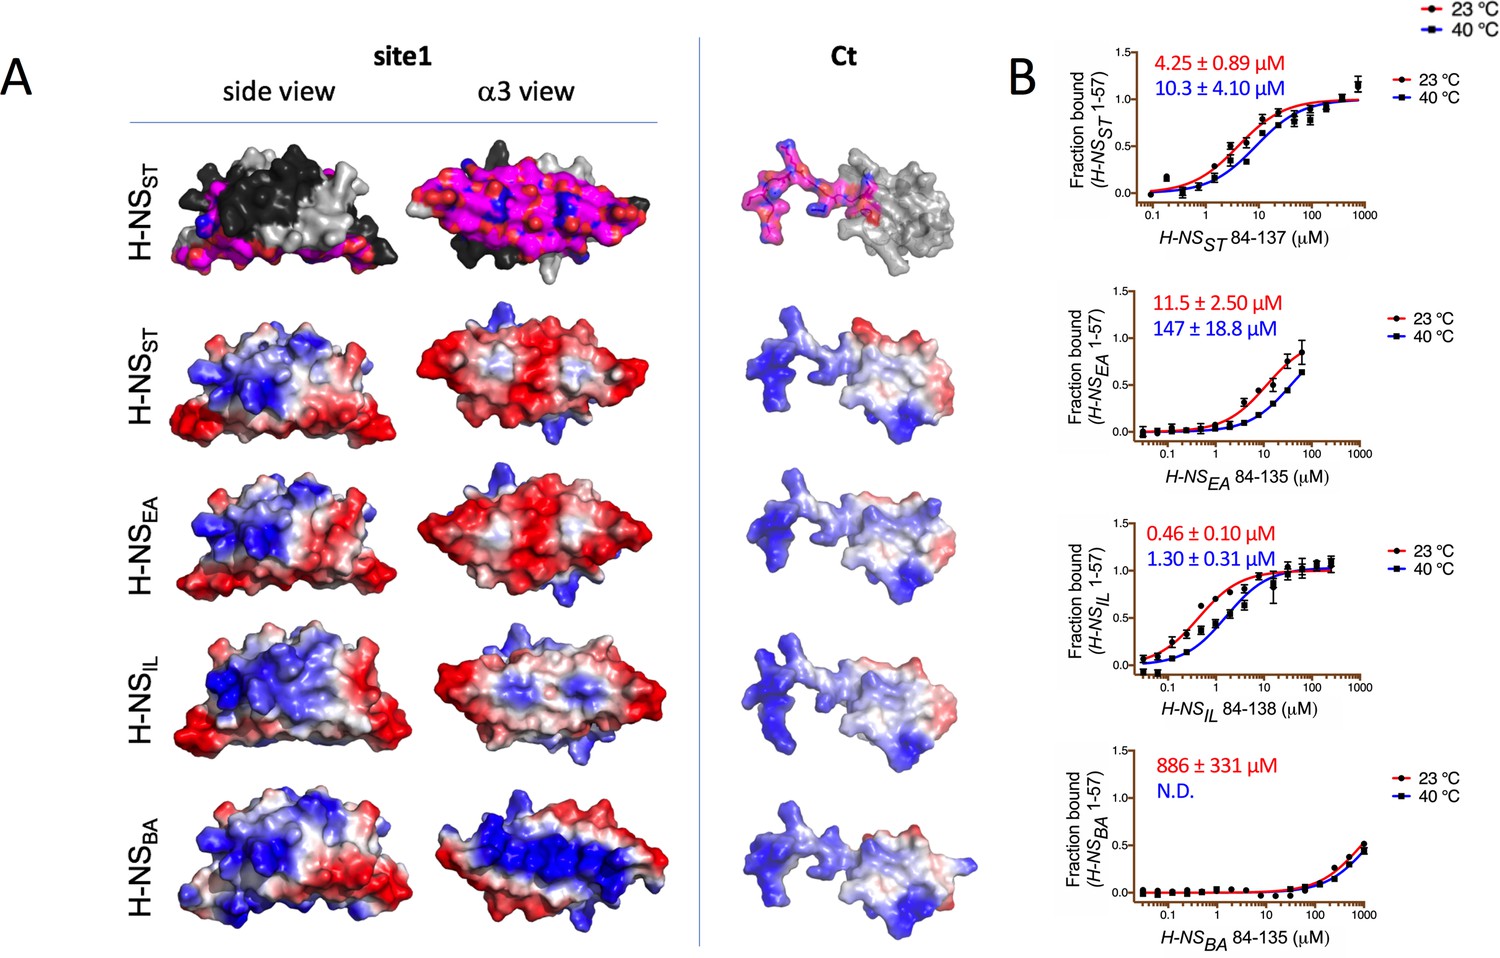
Modeling and in vitro analysis of autoinhibition and multimerization of histone-like nucleoid-structuring (H-NS) orthologs.
(A) Left and middle panels: Surface representation of site1 of H-NS orthologs (modeled on E. coli H-NS, PDB accession 1NI8) shown as side and α3 (bottom) view. Right panel: Ct, comprising the linker-DNAbd fragment, residues 84–137. The top row shows the residues mapped by NMR involved in forming the autoinhibitory closed conformation (Shahul Hameed et al., 2019 and this study). Other rows show the electrostatic surfaces, color-ramped from blue (positive) to red (negative) (calculated and visualized by Pymol). (B) Microscale thermophoresis (MST) titrations of unlabeled linker-DNAbd fragment onto 50 nM of Alexa-488-labeled H-NS 1-57 at 23°C (red) and 40°C (blue). The dissociation constant Kd is color-coded in red (23°C) and blue (40°C). N.D.: not determined.
Figure 5—figure supplement 1
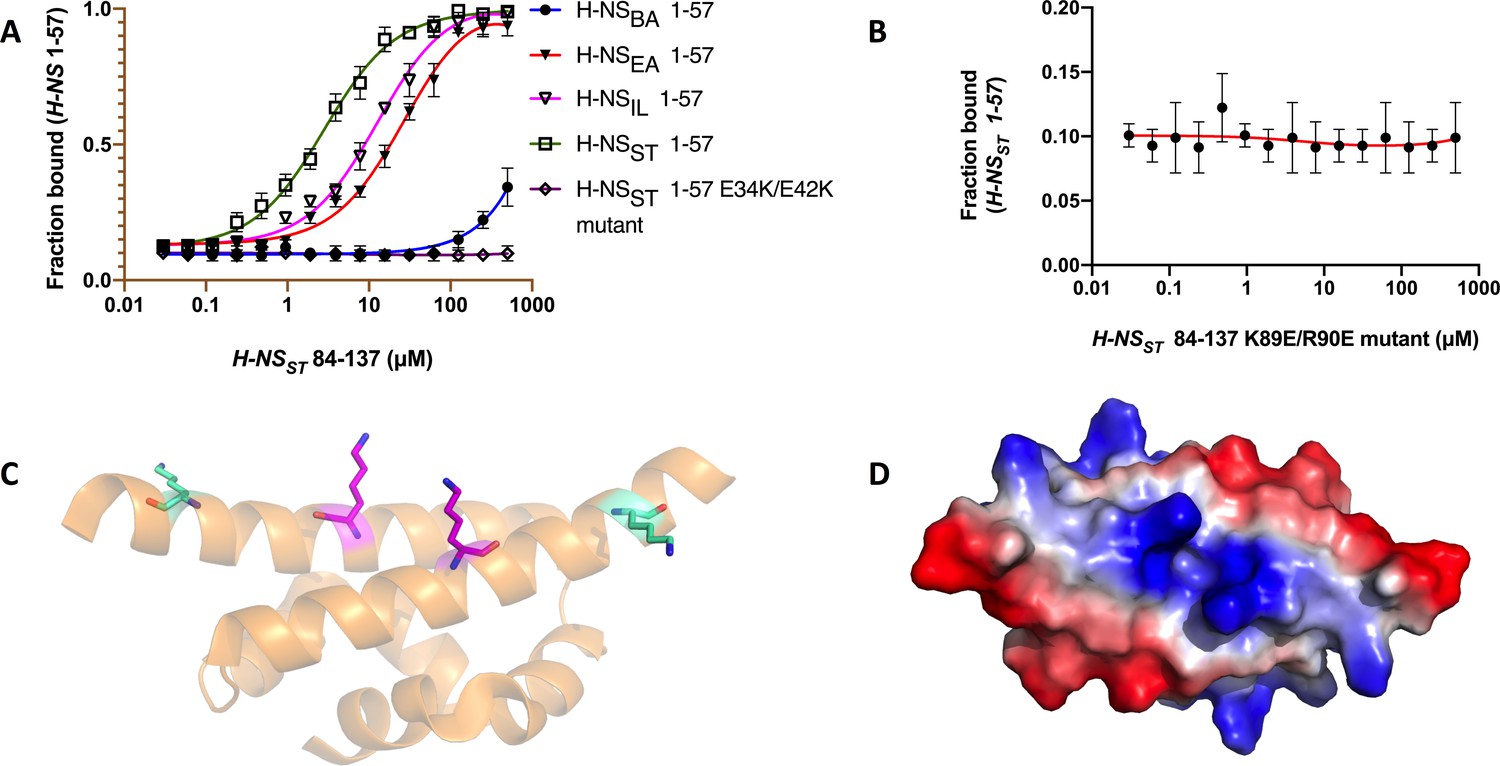
H-NSST C-term binding to H-NS N-term.
(A) Microscale thermophoresis (MST) curve for H-NSST84-137 binding to H-NS 1-57 of all four species and H-NSST1-57double mutant (E34K/E42K). (B) MST curve for H-NSST 84-137 (K89E/R90E) binding to H-NSST1-57. (C) Cartoon representation of dimeric H-NSSTsite1 E34K (magenta stick) E42K (cyan stick) mutant. (D) Electrostatic surface of dimeric H-NSST site1 E34K/E42K mutant (α3 view) showing the effect of the double mutation. Please compare with the α3 view in Figure 5A of H-NSST and H-NSBA.
Figure 6
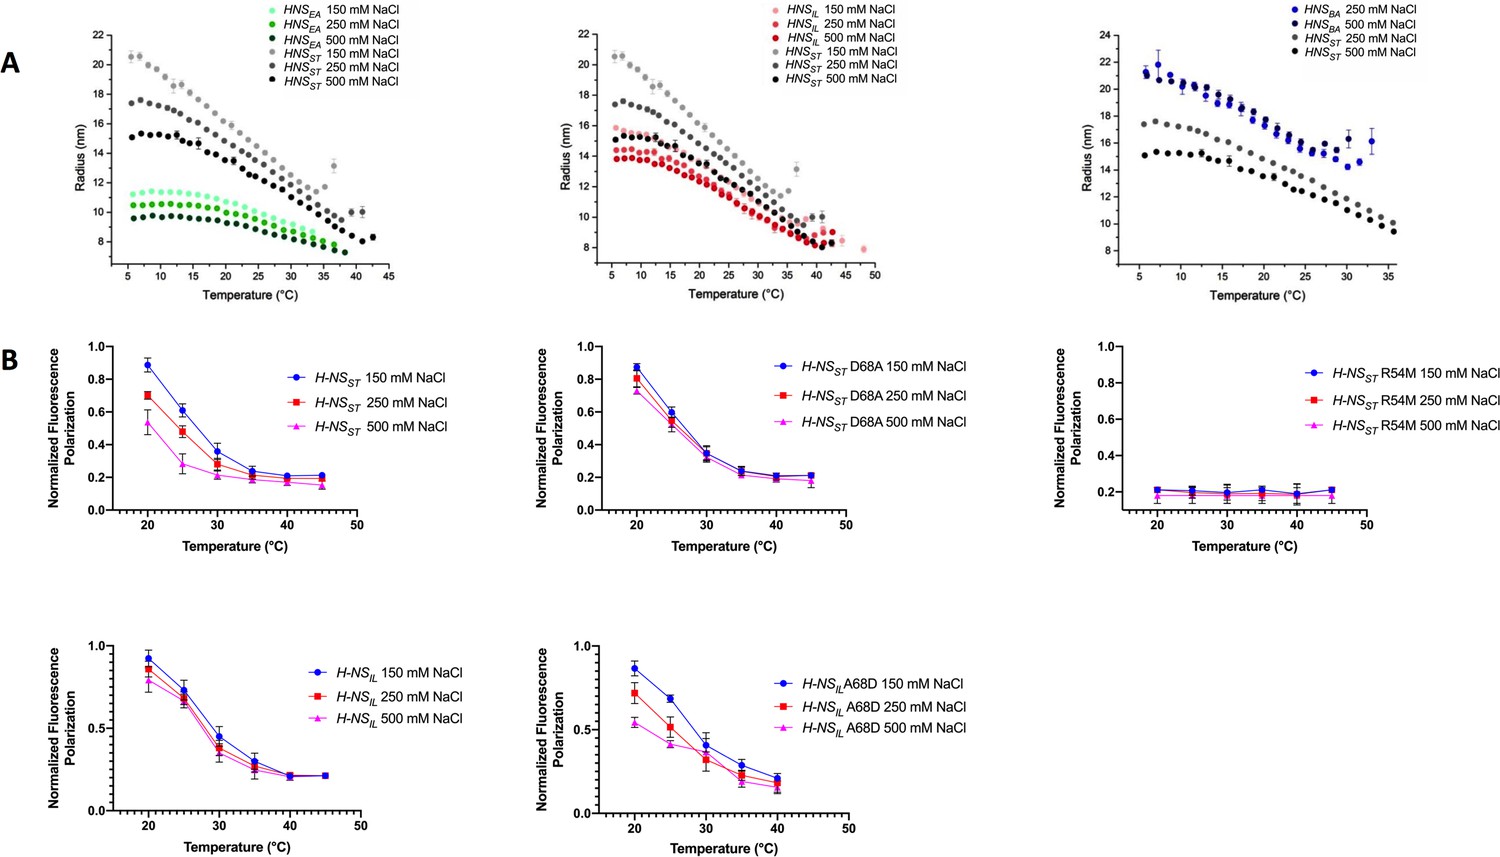
Temperature- and salt-dependent oligomerization of histone-like nucleoid-structuring (H-NS) proteins.
(A) Dynamic light scattering (DLS) experiments showing changes in hydrodynamic radius (as a proxy of apparent site2 stability) upon changes in salinity and temperature. Data in (B, D) are means ± S.D., n = 3. (B) Fluorescence anisotropy to determine oligomerization of H-NS site1–site2 (residues 1–83) and mutants at various salt concentrations. Unlabeled H-NSST (1–83) was titrated against Alexa-488-labeled H-NSST (1–83), D68A, and R54M mutants. Unlabeled H-NSIL (1–83) was titrated against Alexa-488-labeled H-NSIL (1–83) and A68D mutant.
Figure 7
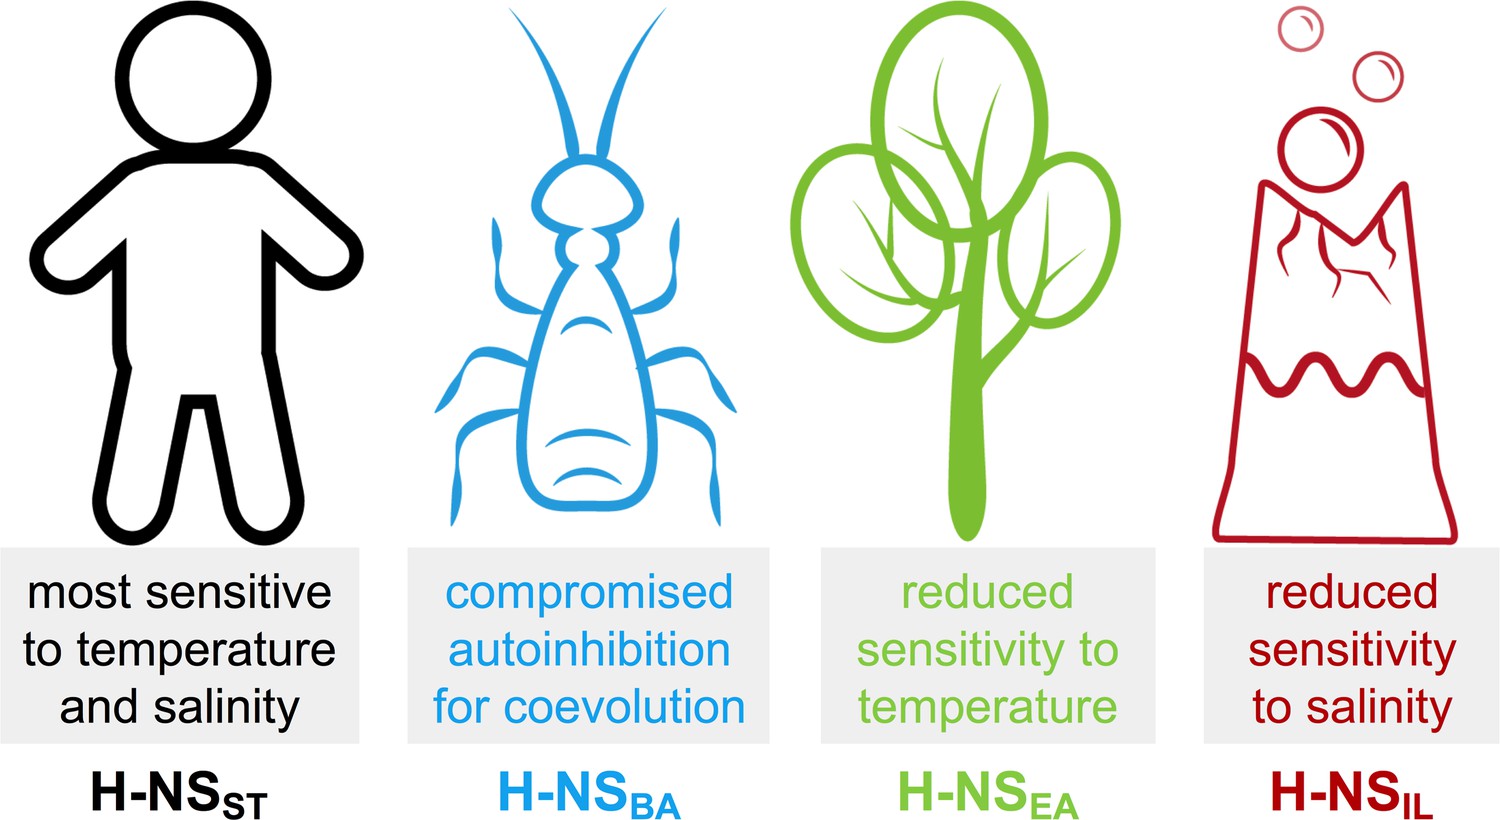
Summary of the most notable adaptations in environment-sensing observed for the histone-like nucleoid-structuring (H-NS) orthologs.
Author response image 1

Author response image 2
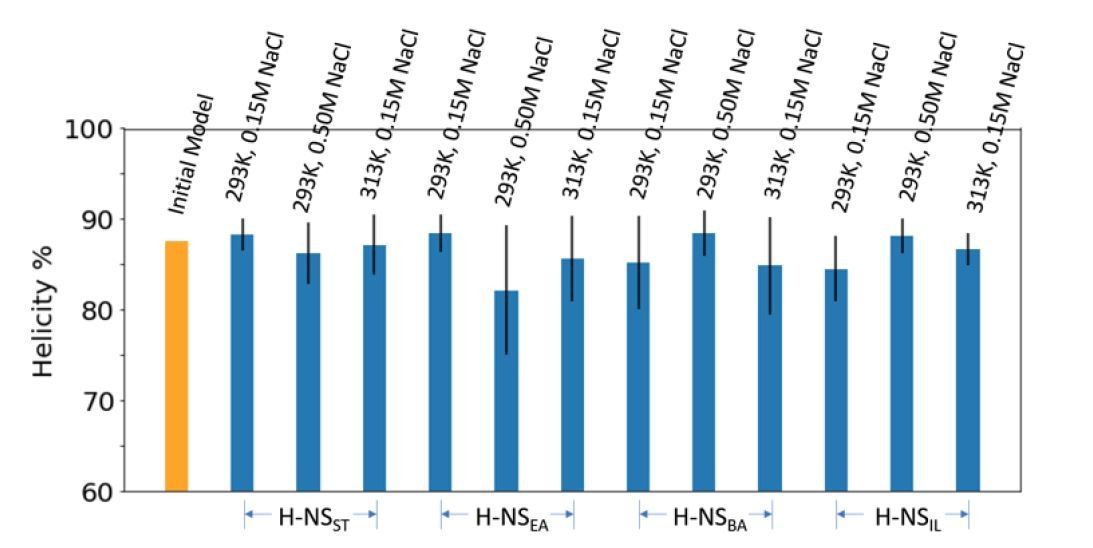
The initial and final average helicity percentage of all windows in Umbrella Sampling.
Additional files
-
Supplementary file 1
(A) The sequence similarity matrix of H-NSST, H-NSEA, H-NSBA, and H-NSIL. (B) Summary of reported H-NS simulations (MD = unbiased molecular dynamics simulation; US = umbrella sampling simulations). The CHARMM36 force field (Williams and Rimsky, 1997) with TIP3P water model was used. Total simulation length = 5.7 μs. (C) The average RMSF of each helical region in H-NS site1/site2 at different conditions. The average of the last 10 ns of a total of 200 ns of both replicas were used. (D) Free-energy prediction of mutations by prediction tools. (E) Comparison of prediction tools and free-energy calculations. (F) Statistics of conservative charged contacts in MD simulations (side chain N-O distances in Å, averaged over the last 50 ns of two simulation replicas).
- https://cdn.elifesciences.org/articles/57467/elife-57467-supp1-v2.docx
-
Transparent reporting form
- https://cdn.elifesciences.org/articles/57467/elife-57467-transrepform-v2.docx
Download links
A two-part list of links to download the article, or parts of the article, in various formats.
Downloads (link to download the article as PDF)
Open citations (links to open the citations from this article in various online reference manager services)
Cite this article (links to download the citations from this article in formats compatible with various reference manager tools)
Molecular basis for the adaptive evolution of environment-sensing by H-NS proteins
eLife 10:e57467.
https://doi.org/10.7554/eLife.57467


