Single-cell transcriptomics reveals functionally specialized vascular endothelium in brain
- Department of Tissue Morphogenesis, Max Planck Institute for Molecular Biomedicine, Germany
- Institute of Physiological Chemistry and Pathobiochemistry, University of Münster, Germany
- Cells-in-Motion Interfaculty Centre (CiMIC), University of Münster, Germany
Figures
Figure 1 with 2 supplements
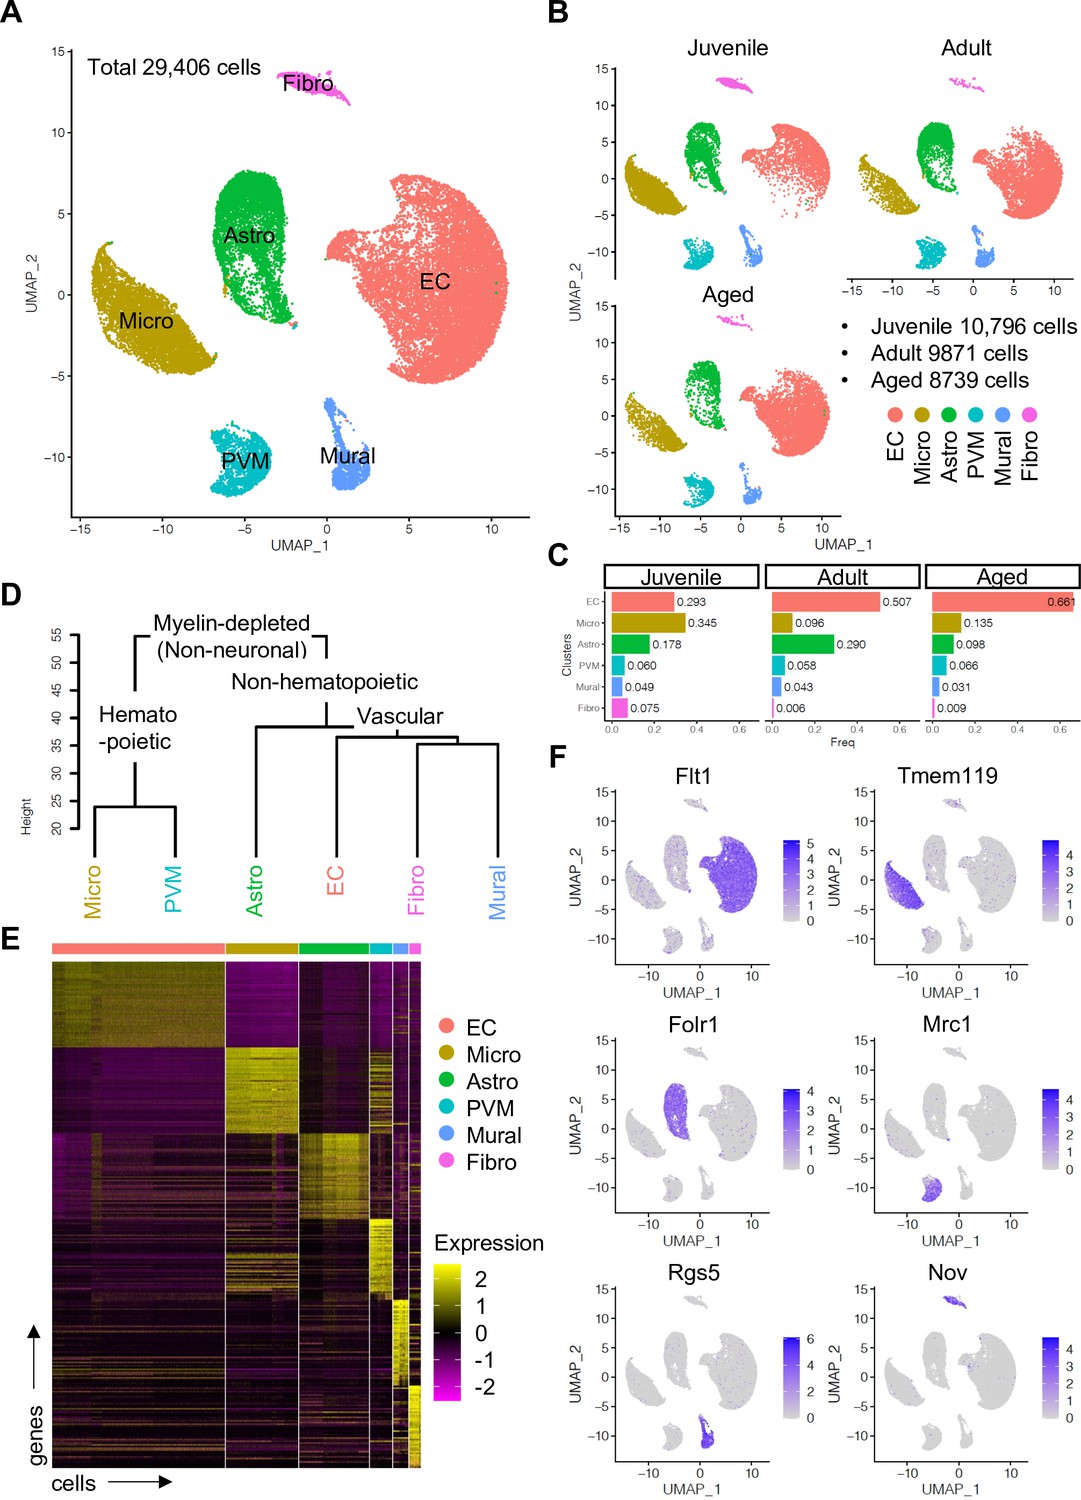
Single-cell RNA-seq analysis of non-neuronal cell types in mouse cerebral cortex.
(A) Uniform manifold approximation and projection (UMAP) plot of 29,406 myelin-depleted single cells from murine cerebral cortex. Colors represent endothelial cells (EC), microglia (Micro), astroependymal cells (Astro), perivascular macrophage (PVM), mural cell (Mural), and cerebral fibroblast (Fibro). (B) Split UMAP plots showing separated cells from juvenile, adult, and aged samples, respectively. (C) Bar plots show the relative frequency of cell types for each age. (D) Dendrogram describing the taxonomy of all identified non-neuronal cell types. (E) Heatmap indicates the top 50 marker genes for each cell type. (F) Expression distribution of the top marker genes for each cell type projected onto the UMAP plot. Color represents the scaled expression level.
-
Figure 1—source data 1
Source data for Figure 1C.
- https://cdn.elifesciences.org/articles/57520/elife-57520-fig1-data1-v2.xlsx
Figure 1—figure supplement 1
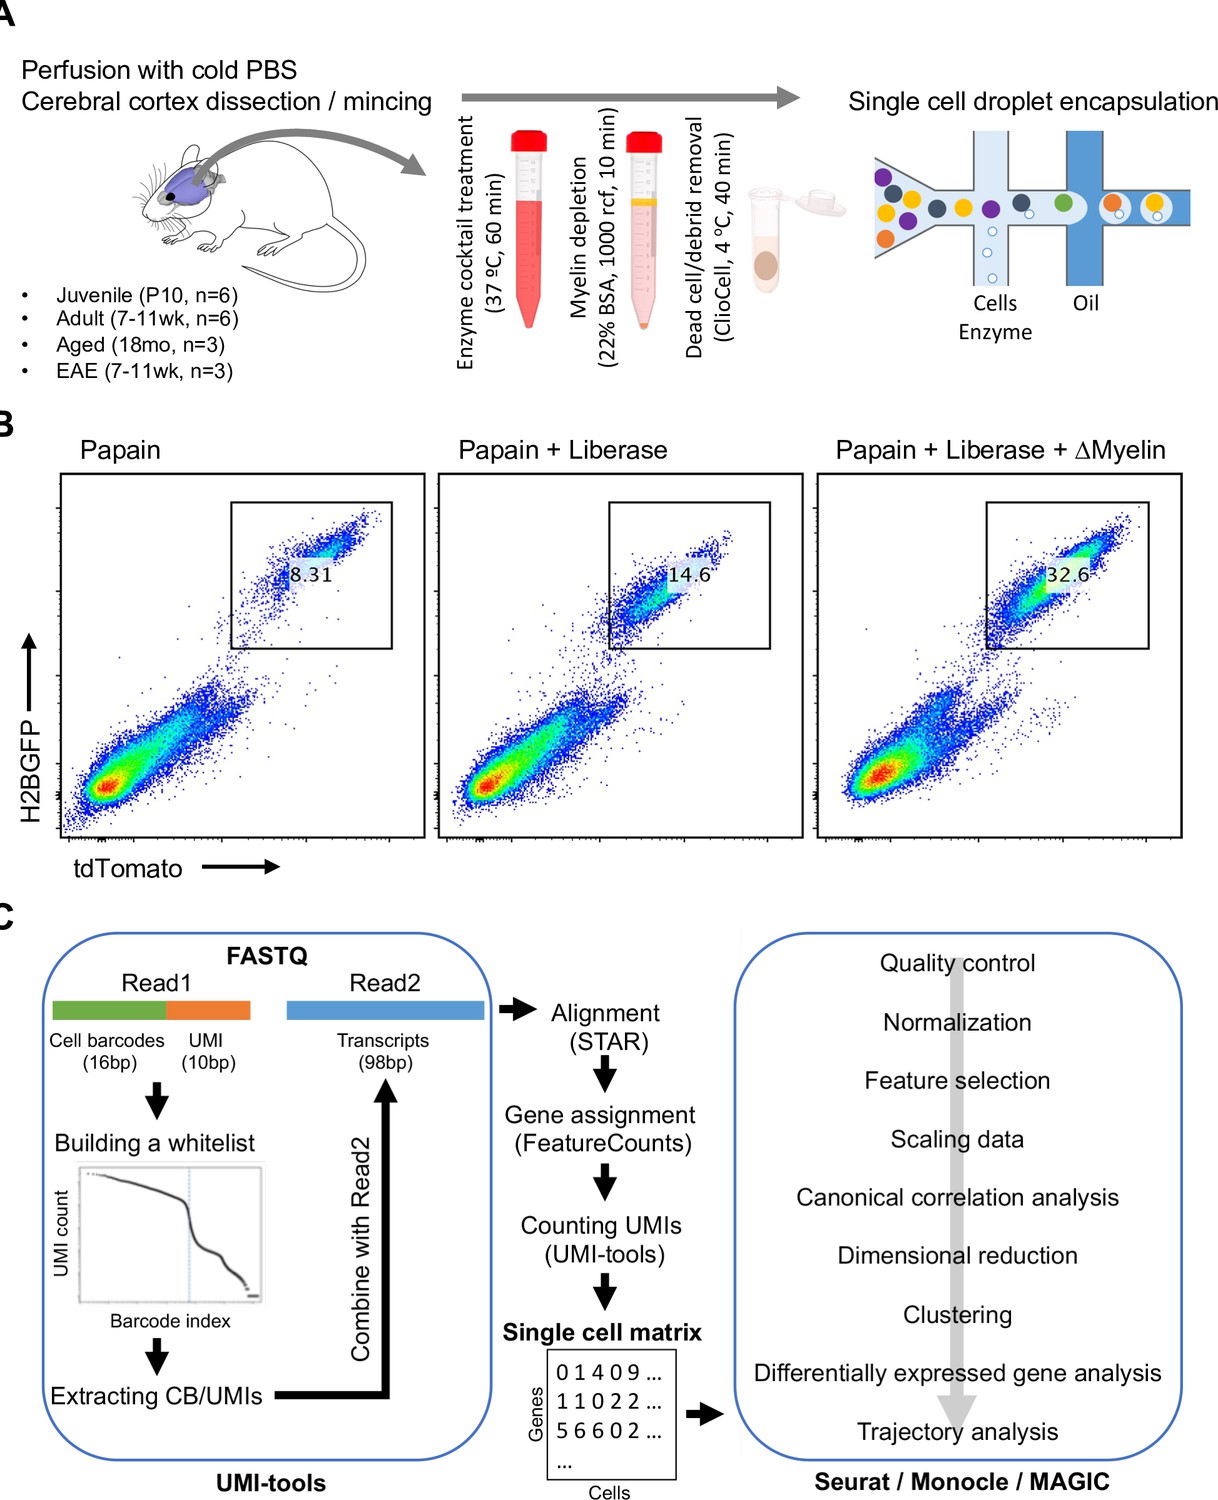
Analysis of vascular and perivascular cell types in mouse cerebral cortex using single-cell RNA-seq.
(A) Workflow for the enrichment of blood vessel-associated cell types from cerebral cortex of juvenile (P10), adult (7–11 weeks), aged (18 months), and experimental autoimmune encephalomyelitis (EAE; 7–11 weeks, peak of disease) mice. (B) Flow cytometry plots depicting enrichment of endothelial cells from cerebral cortex of P10 Cdh5-H2BGFP/tdTomato transgenic mice using different tissue dissociation methods. (C) Pipeline for the single-cell RNA-seq data analysis.
Figure 1—figure supplement 2
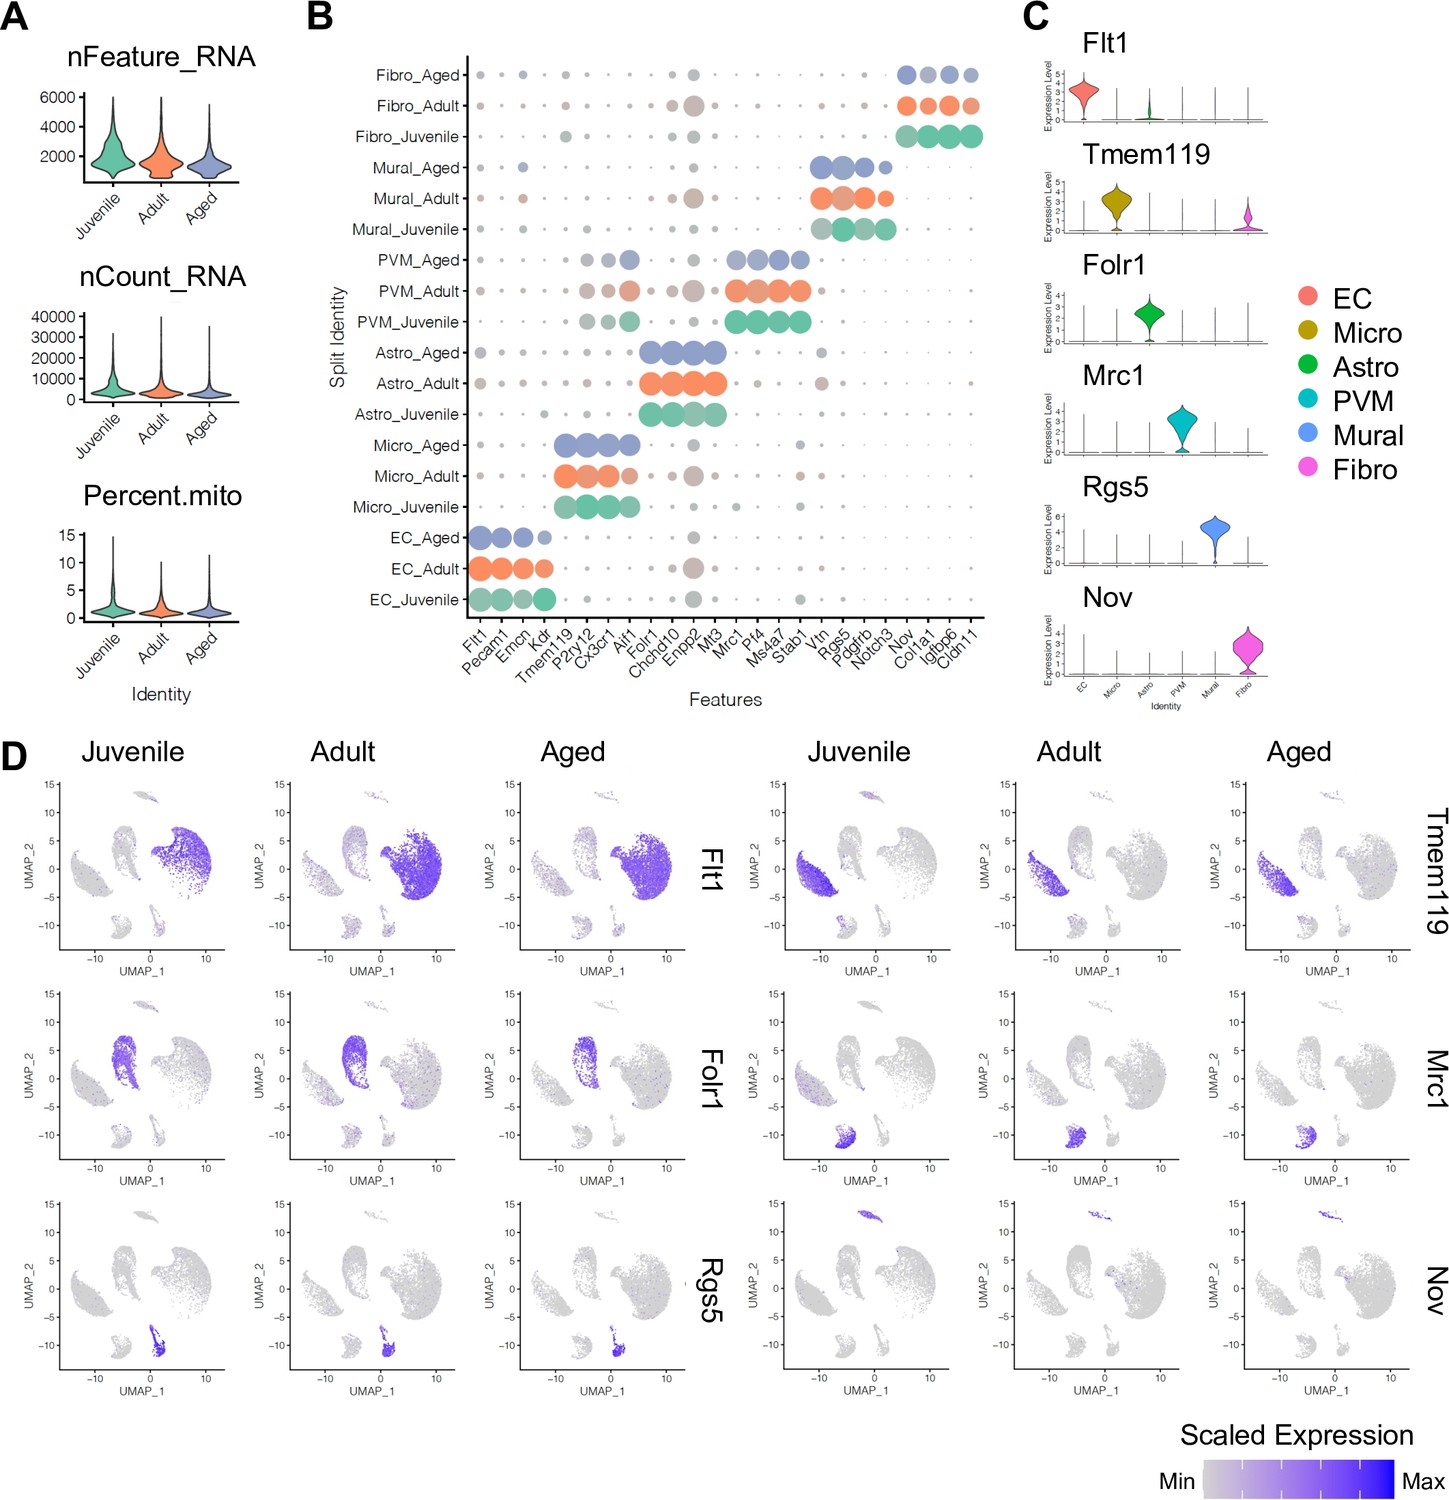
Expression of major cell type marker genes.
(A) Violin plots displaying number of genes (nFeature_Gene), number of unique molecular identifiers (UMI; nFeature_UMI), and percentage of mitochondrial genes (percent.mito) in juvenile, adult, and aged samples. (B) Dot plot showing the expression of top cell type-specific genes, with the dot size representing the percentage of cells expressing the gene, and colors representing the average expression of the gene within a cluster. (C–D) The top cell type-specific genes are shown in violin plots (C) and uniform manifold approximation and projection plots (D). Color represents the scaled expression level.
Figure 2 with 3 supplements
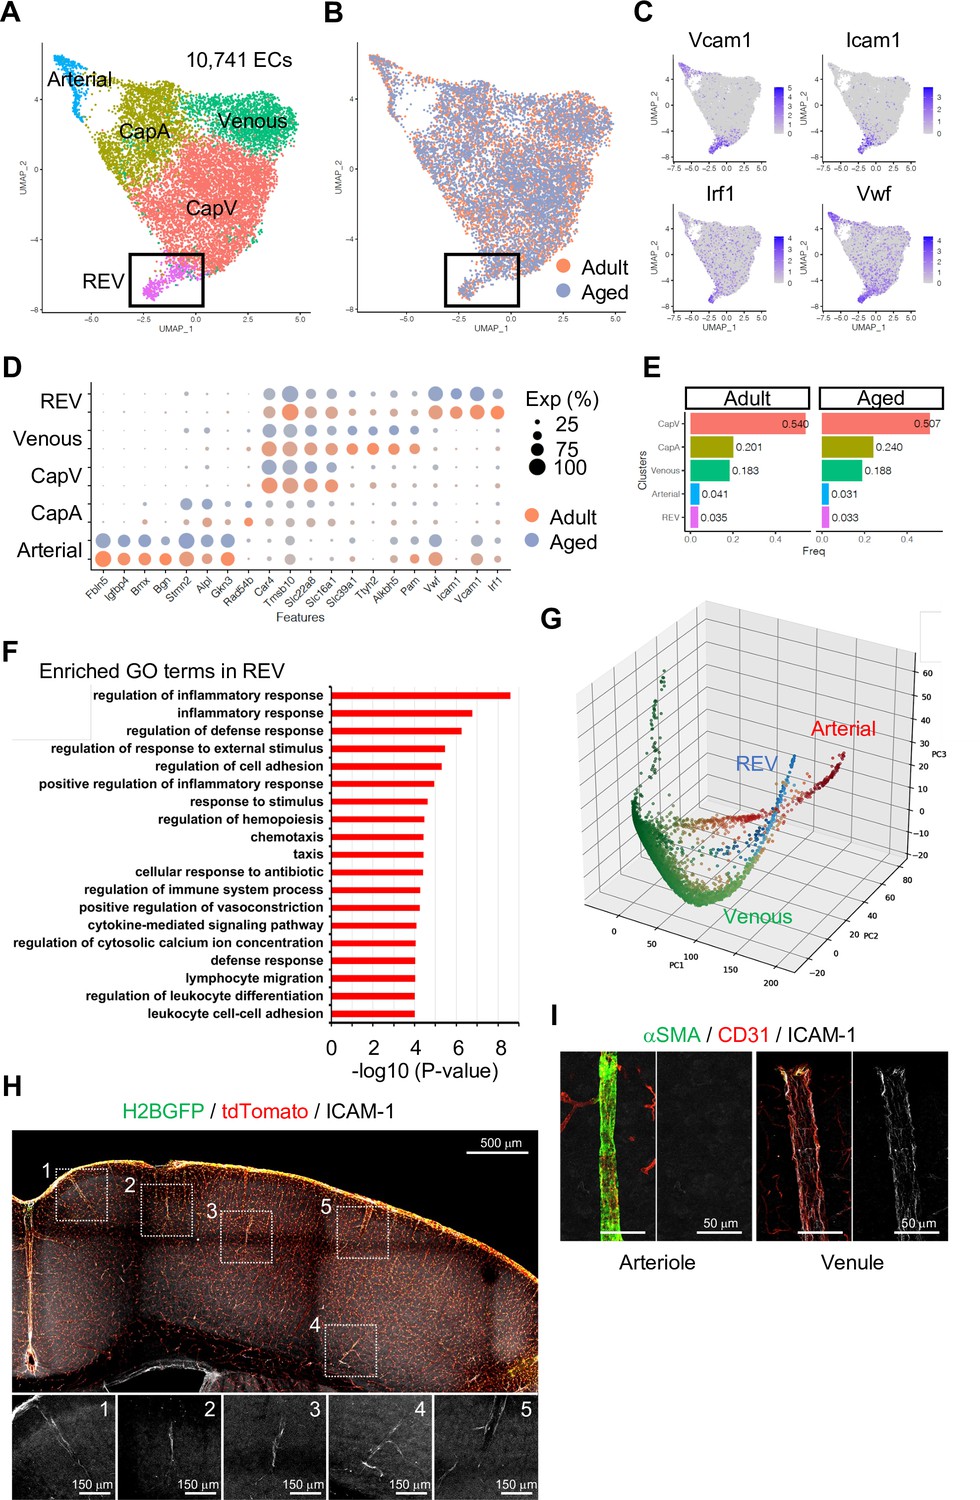
Endothelial cell (EC) subclustering and identification of intercellular adhesion molecule-1 (ICAM-1+) endothelial population.
(A–B) Uniform manifold approximation and projection (UMAP) plots of 10,741 adult and aged mouse ECs. Colors represent cell subclusters (A) or age groups (B), respectively. Box indicates ICAM-1+ reactive endothelial venule (REV) ECs. (C) UMAP plots depicting the expression of ICAM-1+ EC-enriched genes Vcam1, Icam1, Irf1, and Vwf. Color represents scaled expression level. (D) Dot plot showing the expression of top subcluster-specific genes, with the dot size representing the percentage of cells expressing the gene and colors representing the average expression of the gene within a cluster. (E) Bar plot showing frequency of subclusters for adult and aged ECs. (F) Top gene ontology GO0 biological process terms enriched in REV-specific genes. (G) Three-dimensional Principal component analysis (PCA) plots generated by Markov affinity-based graph imputation of cells. Cells are colored representing the expression of selected subtype marker genes (green: Alkbh5 and Tmsb10 for venous ECs; red: Alpl and Fbln5 for arterial ECs; blue: Icam1 and Vcam1 for REVs). (H) Representative immunofluorescence image for ICAM-1 in adult Cdh5-H2BGFP/tdTomato murine brain cortex. Scale bar, 500 μm. Panels at the bottom show isolated ICAM-1 signal for each area marked in the overview image, representing different cortical areas. Scale bars, 150 μm. (I) Immunostaining showing alpha-smooth muscle actin (αSMA), CD31, and ICAM-1 expression. Panels on the right show ICAM-1 signal for arteriole and venule, respectively. Scale bars, 50 μm.
-
Figure 2—source data 1
Source data for Figure 2E.
- https://cdn.elifesciences.org/articles/57520/elife-57520-fig2-data1-v2.xlsx
Figure 2—figure supplement 1
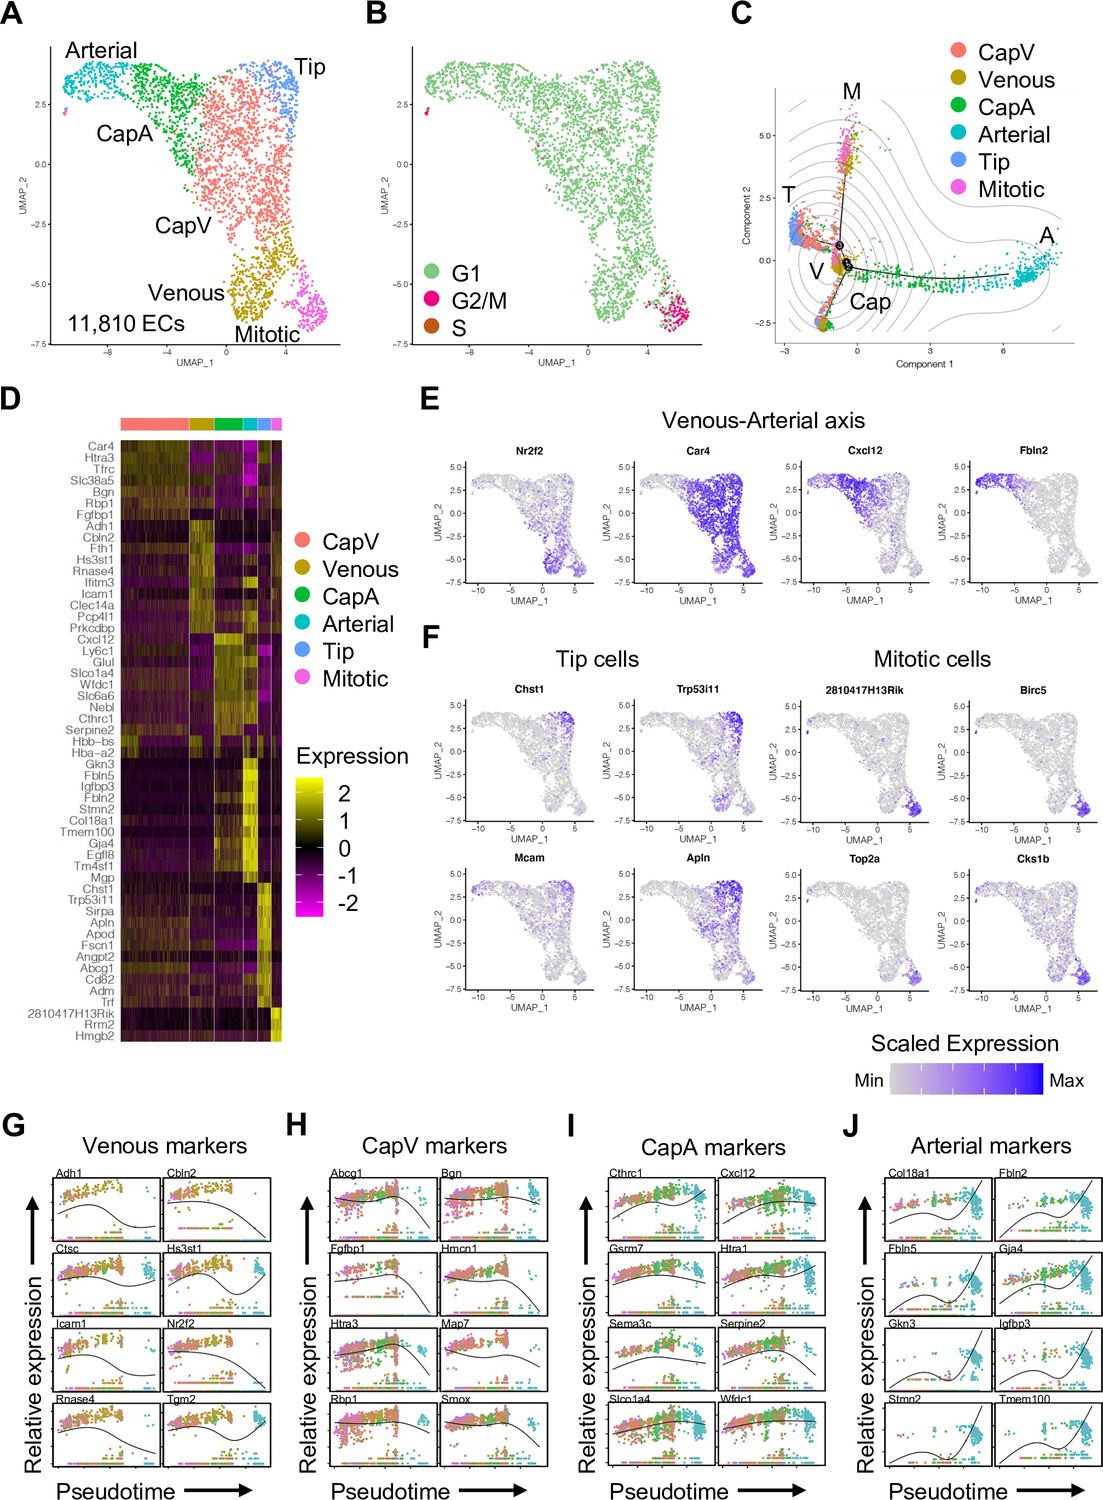
Subclustering analysis of endothelial cells (ECs) during postnatal development.
(A–B) Uniform manifold approximation and projection (UMAP) plots of juvenile ECs. Colors represent EC subclusters (A) or cell cycle phases (B). (C) Trajectory analysis of juvenile ECs depicting centrally located venous ECs (V) and polarized differentiation paths of mitotic (M), tip (T), capillary (Cap), and arterial (A) ECs. Contour plots indicate two-dimensional Gaussian kernel density estimates, and colors represent each subcluster. (D) Heatmap of the top 12 marker genes for each subcluster of juvenile ECs. (E–F) UMAP plots of marker genes for each subcluster in juvenile ECs. (G–J) Kinetic plots showing relative expression of venous to arterial marker genes across pseudotime. Colors represent subclusters shown in (A).
Figure 2—figure supplement 2
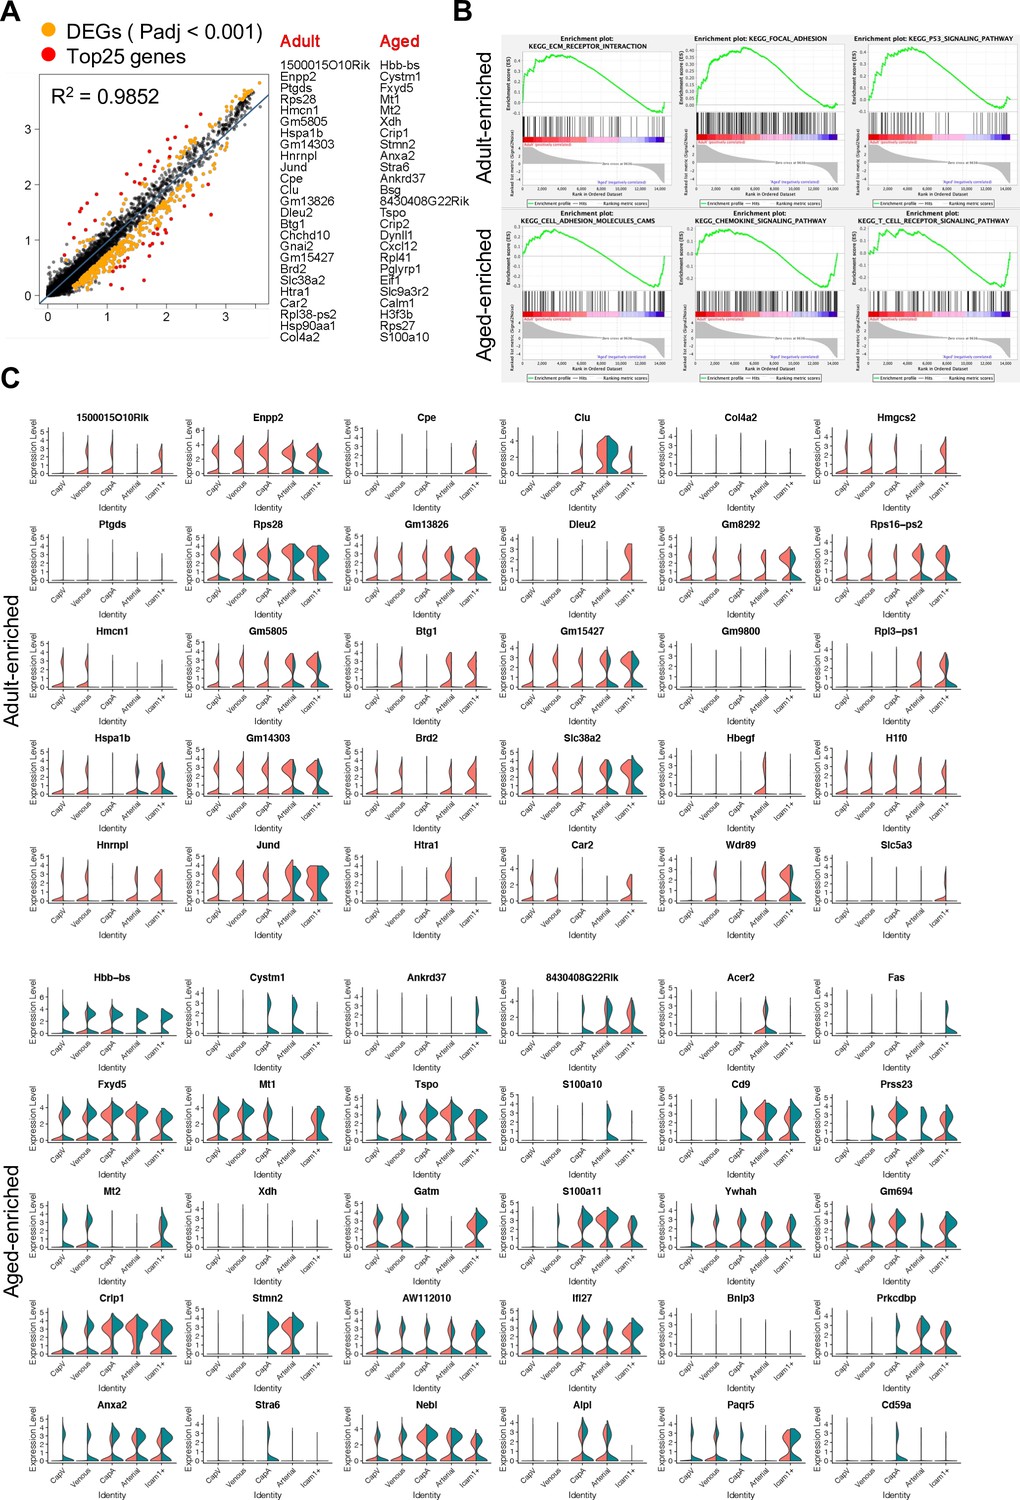
Differential gene expression analysis of adult and aged endothelial cells (ECs).
(A) Scatter dot plot of differentially expressed genes (yellow dots, Padj <0.001) between ECs from adult and aged samples (407 genes). The 25 most significant genes for each sample (red dots) are listed. (B) Representative gene set enrichment analysis plots for overrepresented Kyoto Encyclopedia of Genes and Genomes (KEGG) pathway gene sets in adult or aged ECs. (C) Violin plots of the top 30 differentially expressed genes in adult (red) and aged ECs (green).
Figure 2—figure supplement 3
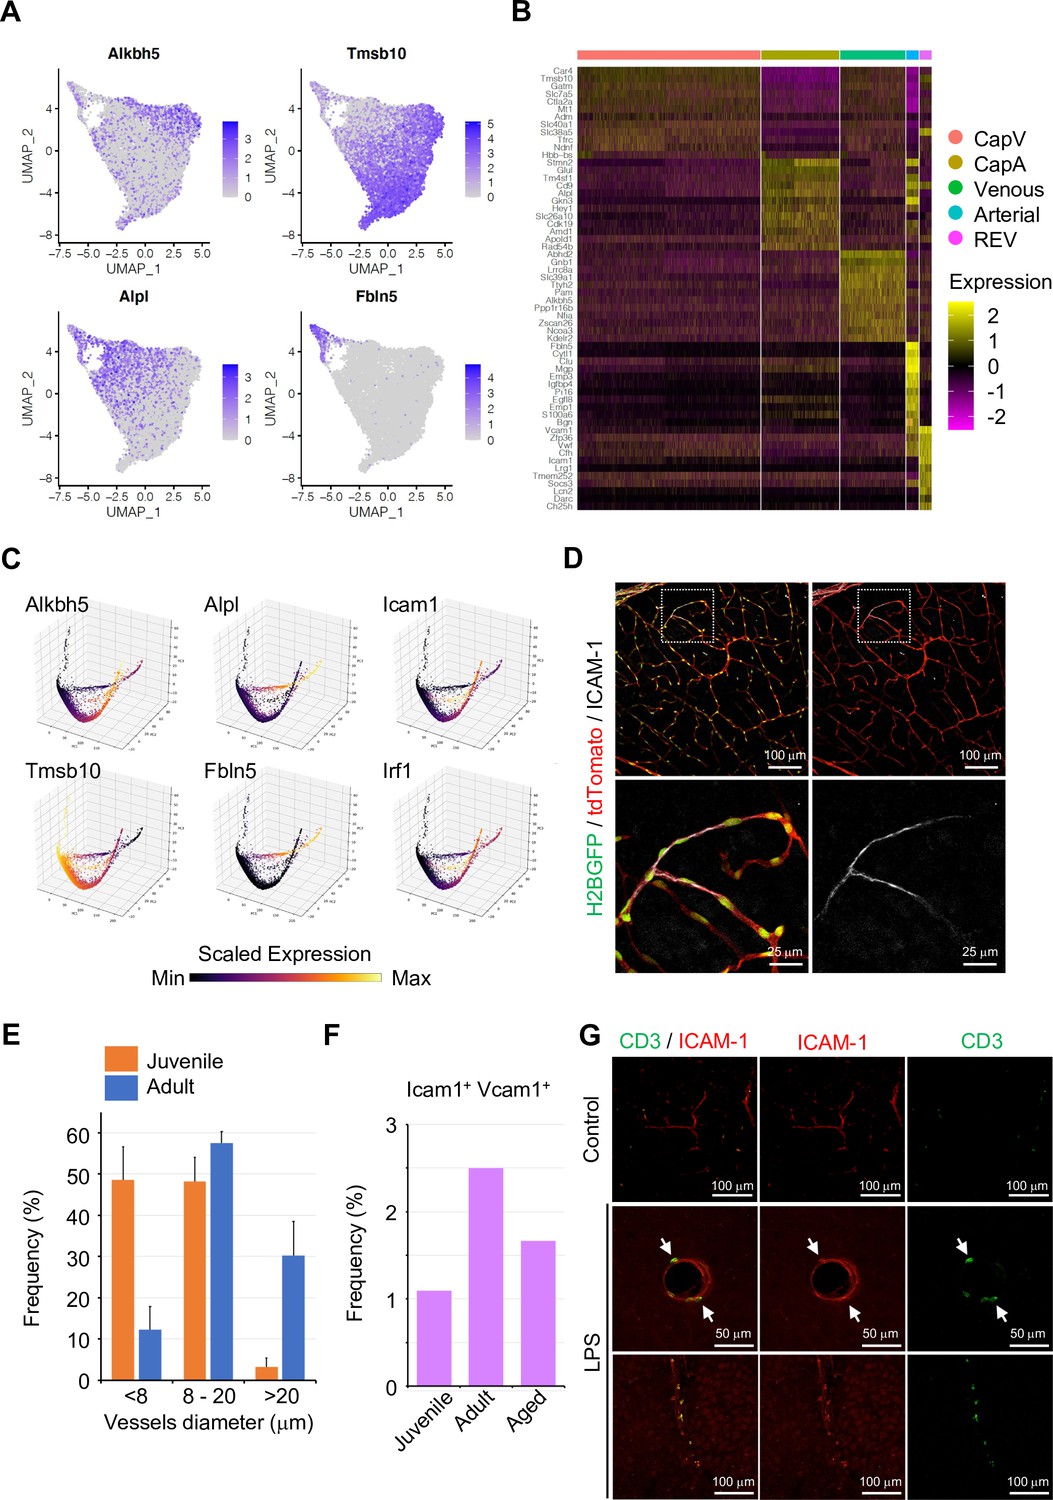
Subclustering analysis of endothelial cells (ECs) during homeostasis.
(A) Uniform manifold approximation and projection (UMAP) plots depicting the expression of representative marker genes for each subcluster: Alkbh5 (Venous), Tmsb10 (CapV), Alpl (CapA), and Fbln5 (Arterial). Color key indicates scaled expression. (B) Heatmap of the top 12 marker genes for each subcluster of homeostatic ECs. (C) Three-dimensional PCA plots generated by Markov affinity-based graph imputation of cells depicting the expression of selected subtype marker genes. Color represents the scaled expression. (D) Intercellular adhesion molecule-1 (ICAM-1) immunostaining in P10 juvenile Cdh5-H2BGFP/tdTomato brain cortex. Scale bars, 100 μm (top), 25 μm (bottom). (E) Quantification of ICAM-1+ vessel diameter in brain cortical parenchyma. Error bars represent mean ± s.e.m. from three animals. (F) Frequency of Icam1/Vcam1 double-positive ECs among all ECs at different ages, according to the single-cell RNA-seq data. (G) Immunofluorescence image showing CD3+ lymphocytes and ICAM-1+ vessels in the cerebral cortex 2 hr after PBS (Control) or lipopolysaccharides (LPS) injection. Scale bar, 50 μm (middle), 100 μm (top and bottom).
-
Figure 2—figure supplement 3—source data 1
Source data for panel E.
- https://cdn.elifesciences.org/articles/57520/elife-57520-fig2-figsupp3-data1-v2.xlsx
Figure 3 with 1 supplement
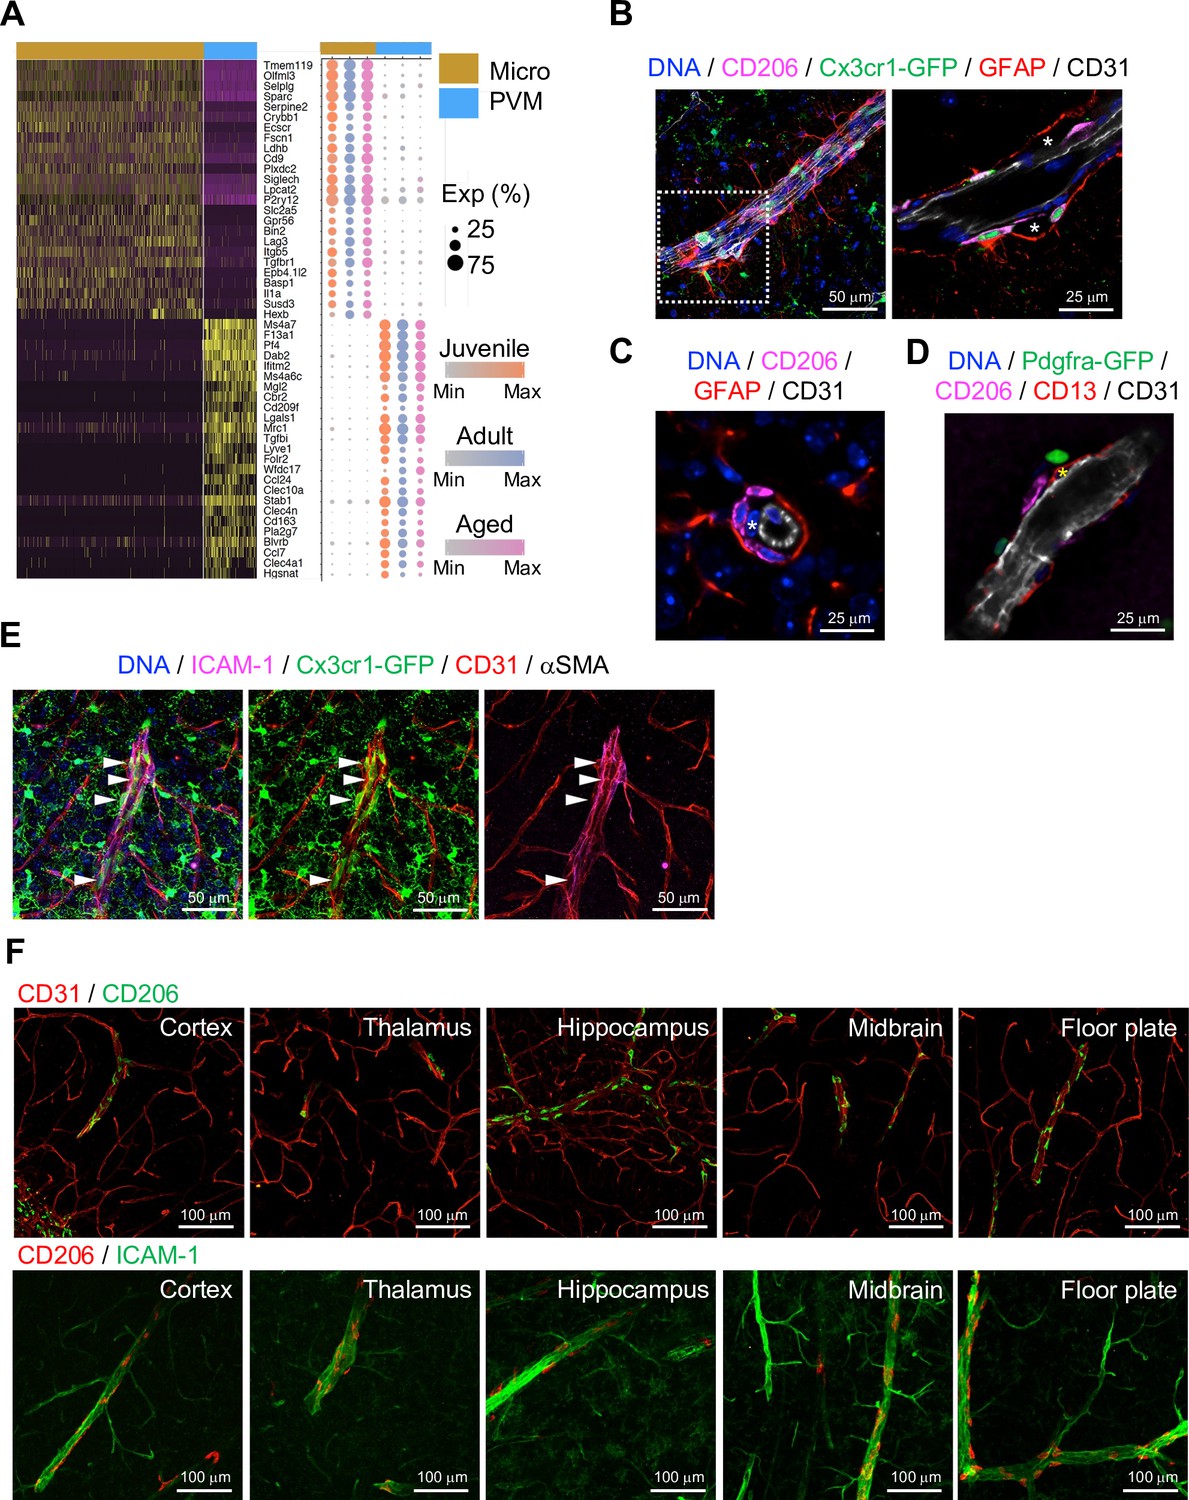
Localization of perivascular macrophages (PVMs).
(A) Heatmap and expression dot plot for top differentially expressed genes between microglia and PVMs. Dot size represents the percentage of cells expressing each gene, and color keys indicate scaled expression in each age group. (B) Immunostaining showing CD206+ Cx3cr1-GFP+ PVMs in perivascular space (asterisk) between ECs (CD31) and astrocyte limitans (GFAP). Scale bars, 50 μm (left), 25 μm (right). (C–D) Spatial arrangement of PVMs (CD206), astrocyte limitans (GFAP), pericytes (CD13, asterisks), perivascular fibroblasts (Pdfgra- GFP+), and endothelial cells (ECs; CD31). Scale bars, 25 μm. (E) Confocal image showing Cx3cr1-GFP + microglia and vessel-associated PVMs (arrowheads) next to ICAM1+αSMA- CD31+ REV ECs. Scale bar, 50 μm. (F) CD206+ PVMs are associated with ICAM-1+ REVs in the indicated brain regions. Scale bars, 100 μm.
Figure 3—figure supplement 1
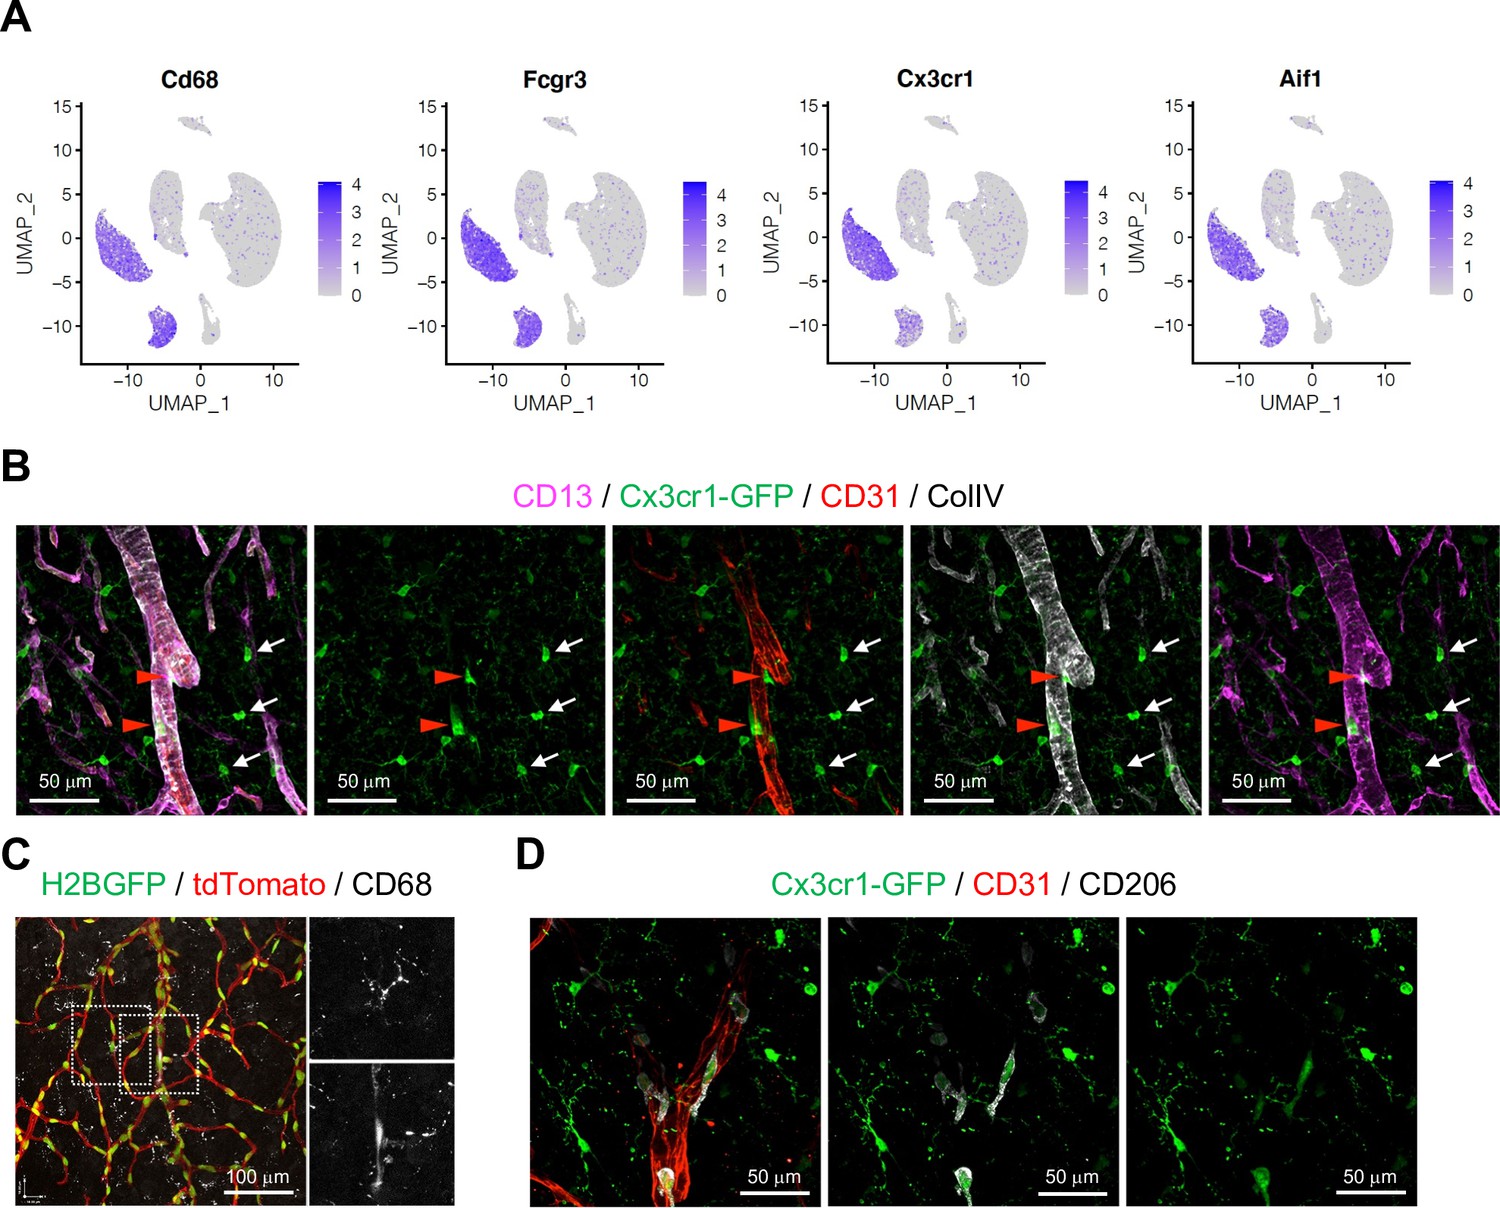
Distinct populations of microglia and perivascular macrophages (PVMs).
(A) Uniform manifold approximation and projection (UMAP) plots depicting the expression of the known myeloid cell markers Cd68, Fcgr3, Cx3cr1, and Aif1. Color key represents the scaled expression. (B) Immunostaining showing CD13, GFP (Cx3cr1-GFP), CD31, and collagen type IV (ColIV) in adult cortex. Scale bars, 50 μm. (C) CD68 immunostaining in Cdh5-H2BGFP/tdTomato mouse brain cortex. Scale bar, 100 μm. (D) Cx3cr1-GFP expression, CD31, and CD206 in sections of adult cortex. Scale bars, 50 μm.
Figure 4 with 1 supplement
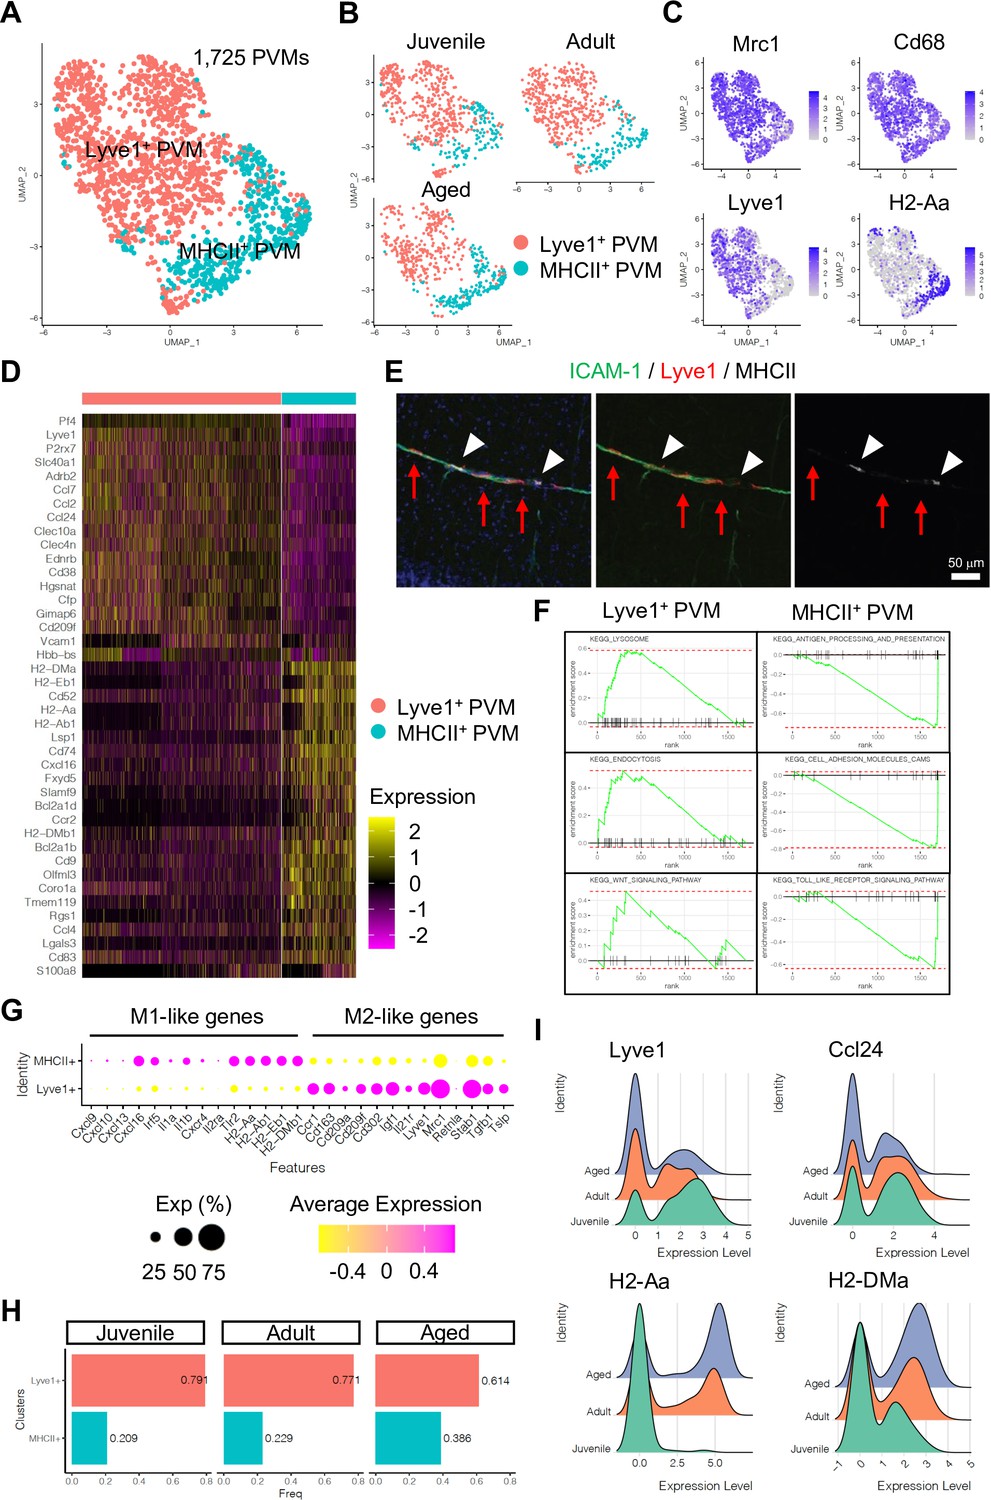
Perivascular macrophage (PVM) heterogeneity.
(A) Uniform manifold approximation and projection (UMAP) plot of 1725 PVMs from juvenile, adult, and aged mice distributed into Lyve1+ and MHCII+ subclusters. (B) Split UMAP plots of PVMs from juvenile, adult, and aged samples. (C) UMAP plots depicting the expression of Mrc1, Cd68, Lyve1, and H2-Aa. Color represents the scaled expression level. (D) Heatmap of top marker genes for Lyve1+ and MHCII+ PVMs. (E) Immunostaining showing Lyve1+ (red arrows) or MHCII+ PVMs (arrow heads) associated to ICAM-1+ REVs. Scale bar, 50 μm. (F) Representative gene set enrichment analysis plots for overrepresented KEGG pathways in Lyve1+ and MHCII+ PVMs. (G) Dot plot of genes related to M1- or M2-like phenotypes in PVM subtypes. Dot size represents percentage of cells expressing the gene, and colors represent the average expression of each gene. (H) Bar plot showing the frequency of PVM subtypes in different age groups. (I) Ridge plots of Lyve1, Ccl24, and MHCII genes in PVMs at different ages.
-
Figure 4—source data 1
Source data for Figure 4H.
- https://cdn.elifesciences.org/articles/57520/elife-57520-fig4-data1-v2.xlsx
Figure 4—figure supplement 1
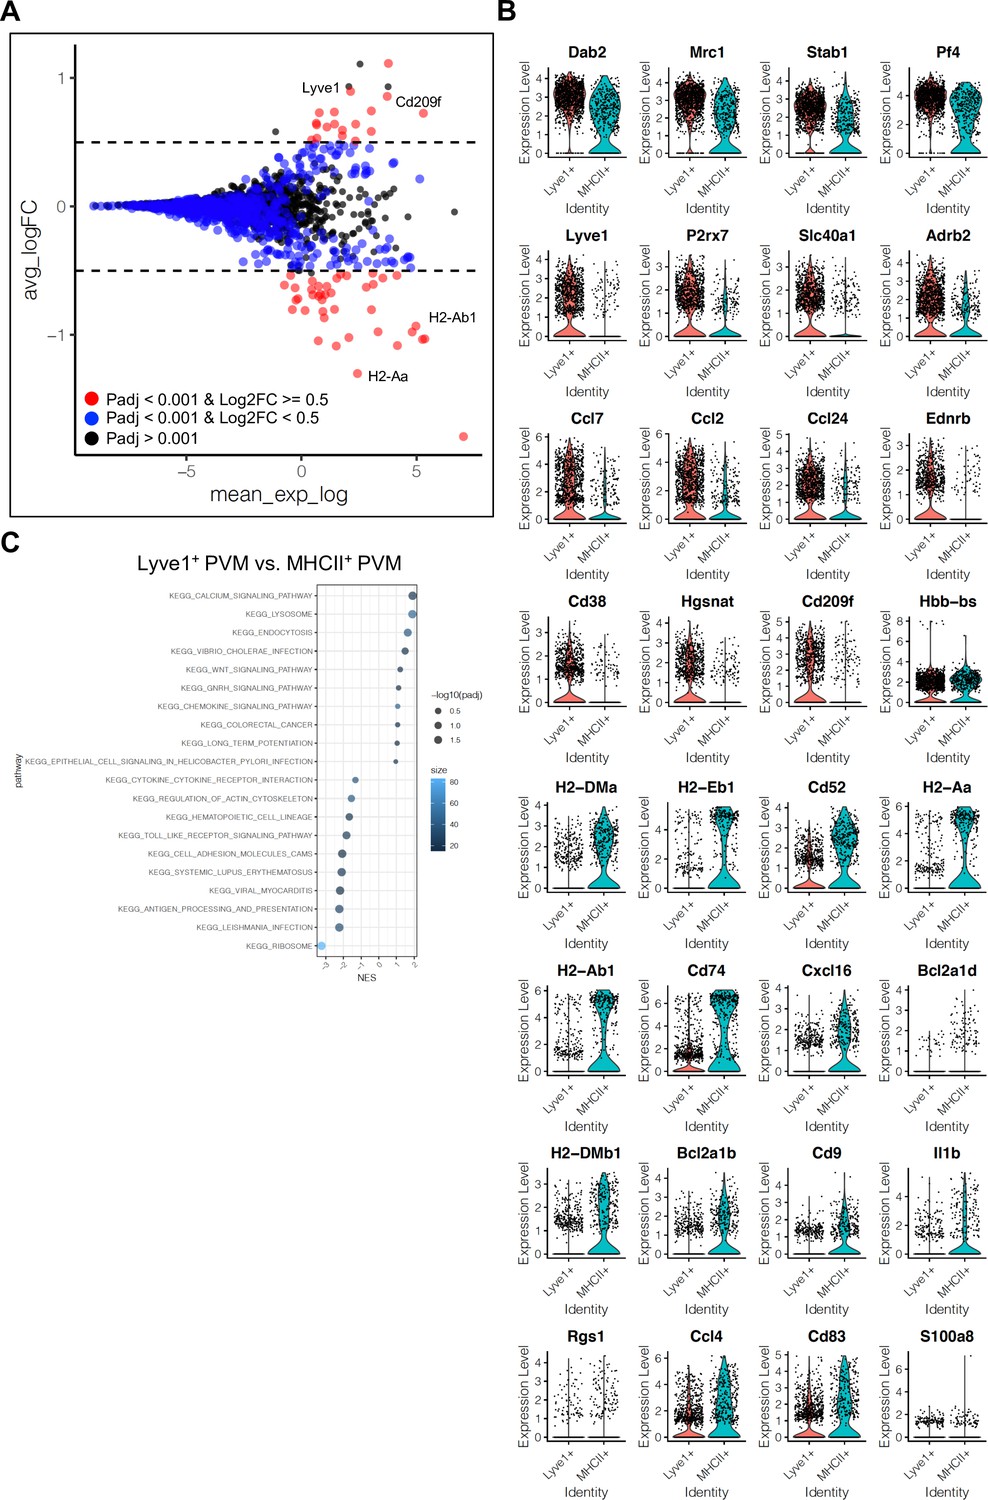
Differentially expressed genes in perivascular macrophage (PVM) subtypes.
(A) MA plot of differentially expressed genes between Lyve1+ and MHCII+ PVM subtypes. Blue dots, p-adjusted value <0.001; Red dots, p-adjusted value <0.001, and Log2 fold change >0.5. (B) Violin plots of the top differentially expressed genes between Lyve1+ and MHCII+ PVM subtypes. (C) Dot plot depicting top 10 enriched KEGG signalling pathways in gene set enrichment analysis for Lyve1+ and MHCII+ PVM subtypes. Dot size represents −log10 adjusted p-values, and colors indicate size of gene set.
Figure 5 with 4 supplements
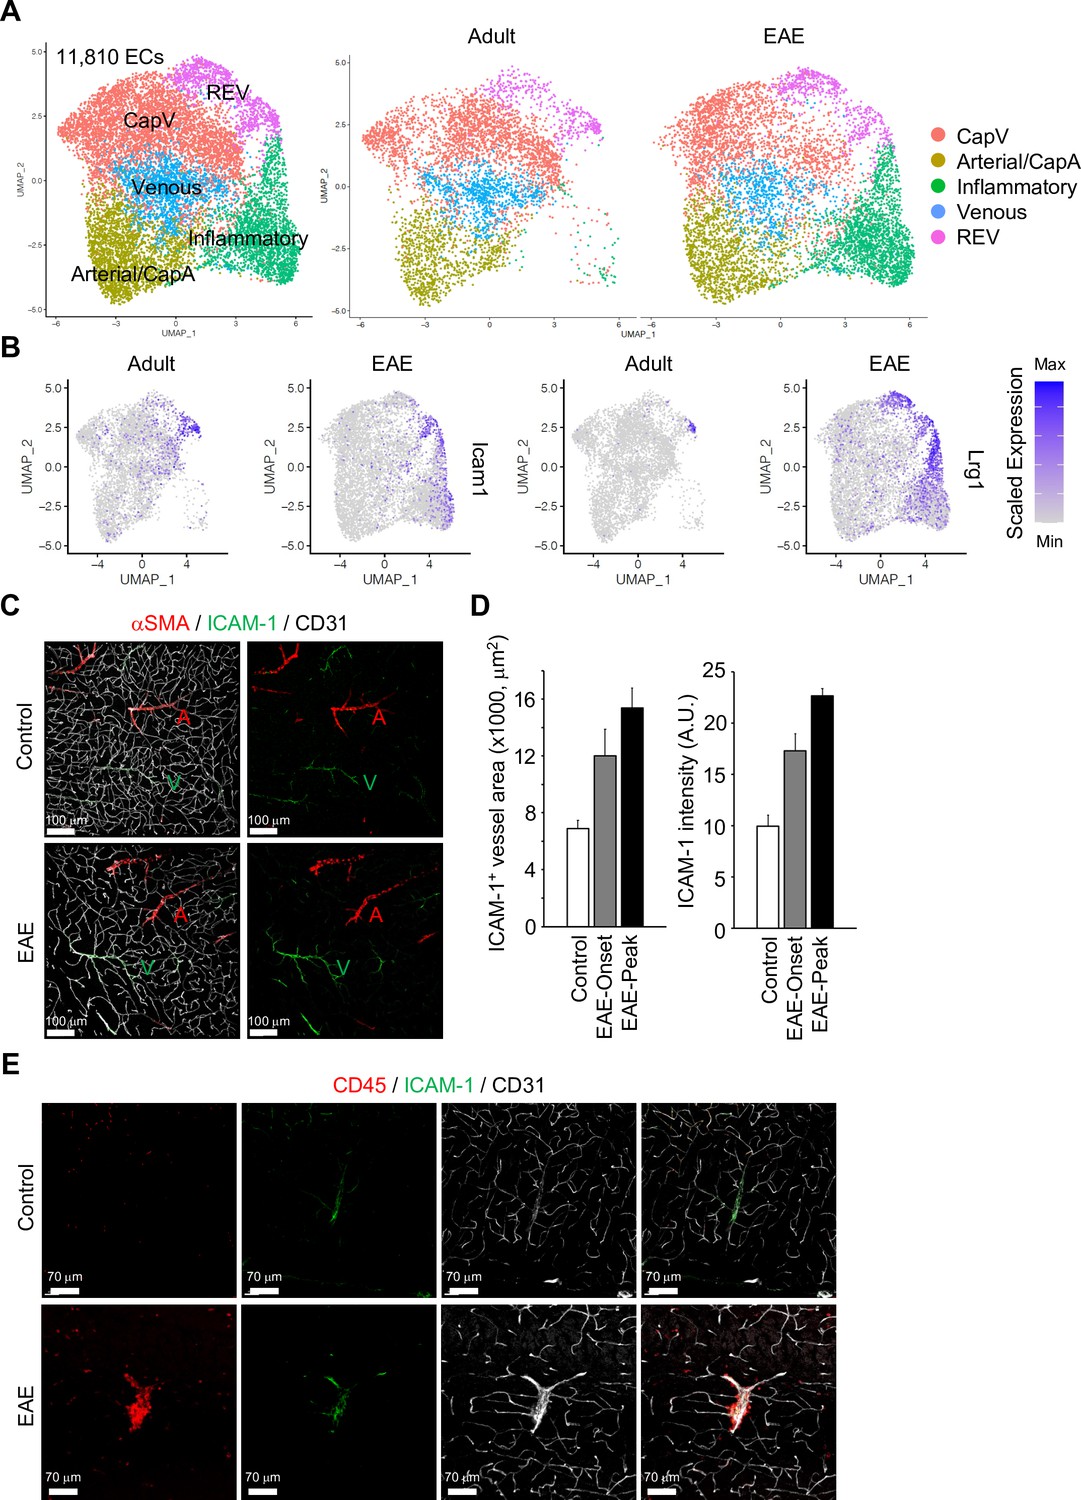
Gene expression changes in endothelial cells (ECs) by experimental autoimmune encephalomyelitis (EAE).
(A) Uniform manifold approximation and projection (UMAP) plots of 11,810 ECs from adult and EAE mice. Colors represent each EC subcluster (left) or condition (right). (B) UMAP plots depict Icam1 and Lrg1 expression in ECs from adult and EAE mice. Color represents the scaled expression level. (C) Immunostaining showingαSMA, CD31, and ICAM-1 expression in control and EAE mice. Arterial (A) and venous vessels (V) are indicated. Scale bars, 100 μm. (D) Quantification of ICAM-1+ vessel area and immunohistochemistry signal intensity in the brain cortex of control and EAE mice at disease onset (EAE onset) and peak (EAE peak). Error bars represent mean ± s.e.m. from three animals. (E) Immunofluorescence images showing CD45+ leukocytes near ICAM-1+ REVs in the cerebral cortex of control and EAE mouse. CD31 indicates all ECs. Scale bars, 70 μm.
-
Figure 5—source data 1
Source data for Figure 5D.
- https://cdn.elifesciences.org/articles/57520/elife-57520-fig5-data1-v2.xlsx
Figure 5—figure supplement 1
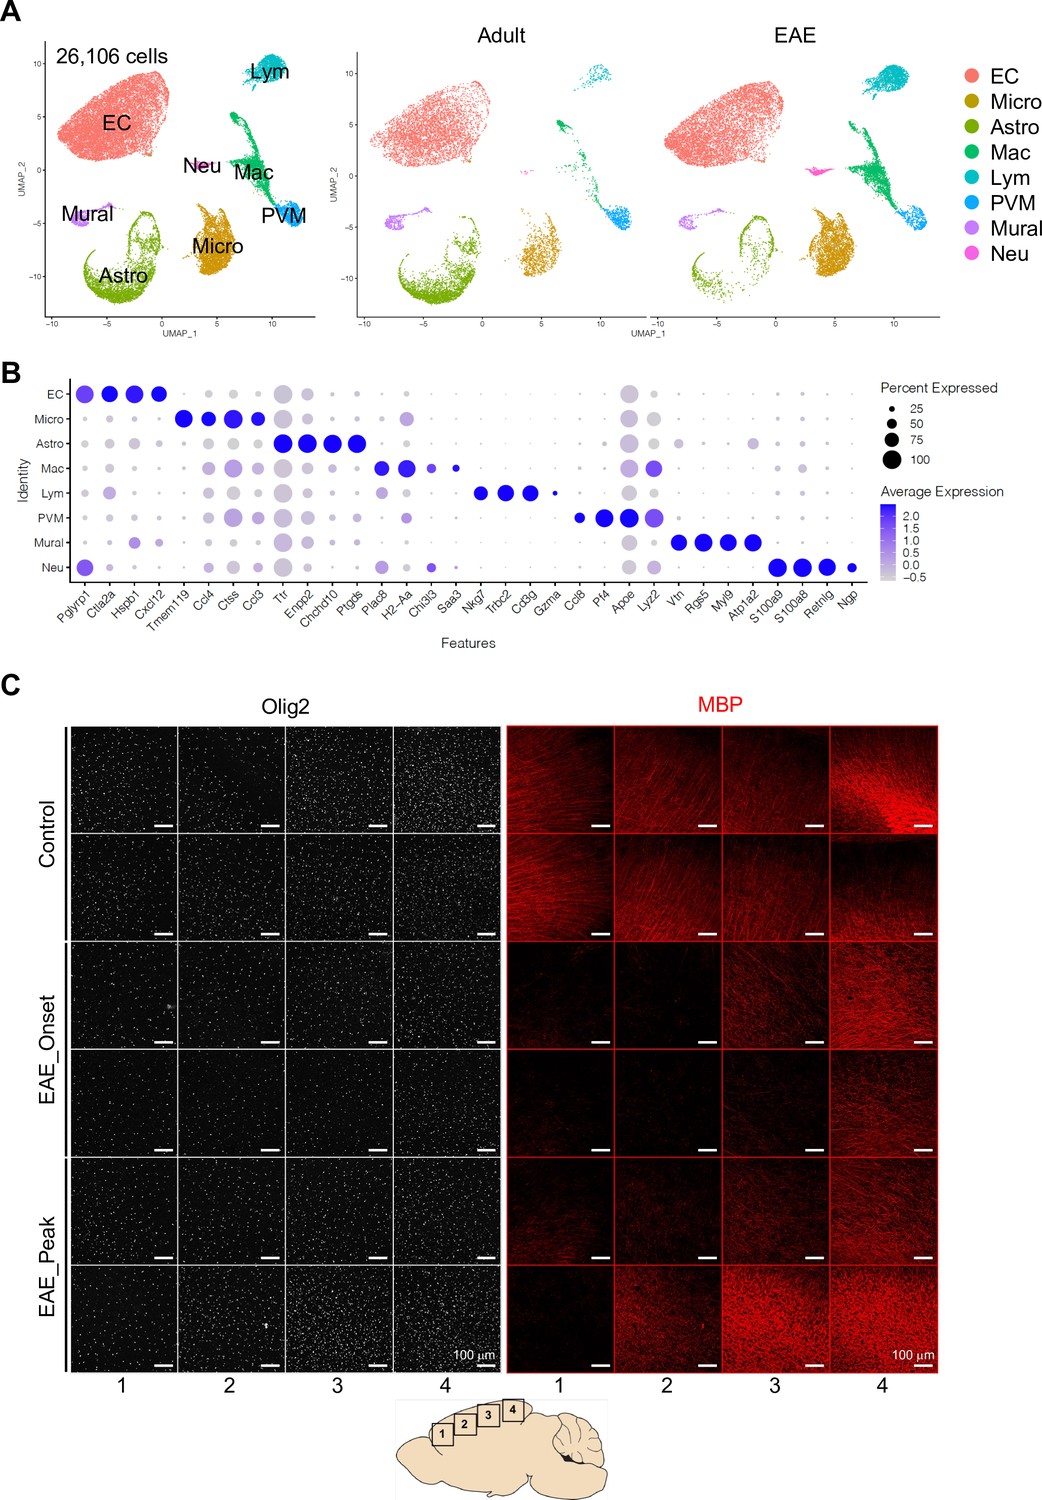
Single-cell RNA-seq analysis of experimental autoimmune encephalomyelitis (EAE) mice.
(A) Uniform manifold approximation and projection (UMAP) plots of 26,106 myelin-depleted cells from adult and EAE cerebral cortex. Colors represent each cell type. (B) Dot plot displaying the top cell type-specific genes. Dot size represents the percentage of cells expressing the gene, and colors reflect average expression of the gene. (C) Olig2 and myelin basic protein (MBP) immunostaining in different regions (1–4) of brain cortex from control, onset, and peak of EAE, as indicated. Each row shows an individual mouse. Scale bars, 100 μm.
Figure 5—figure supplement 2
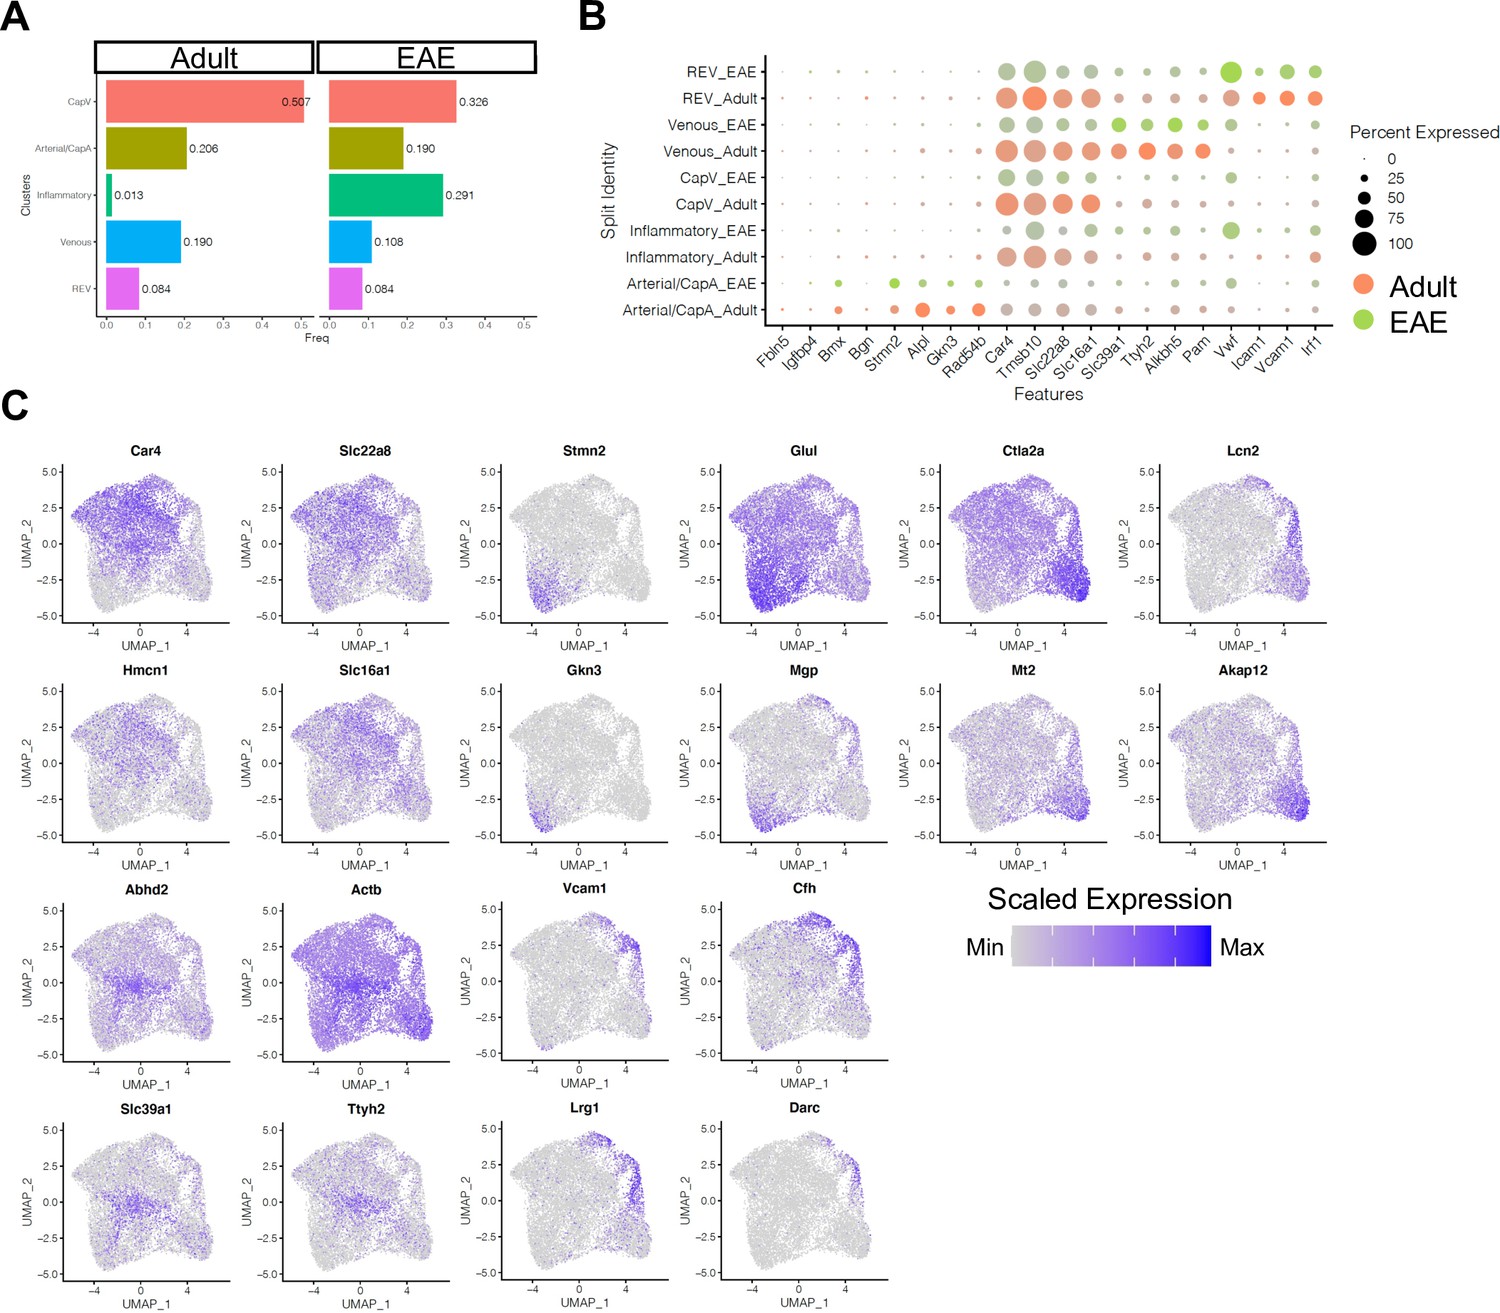
Subclustering of endothelial cells (ECs) from adult and experimental autoimmune encephalomyelitis (EAE) mice.
(A) Bar plots indicating the frequency of EC subtypes in healthy adult and EAE brain. (B) Dot plot showing the expression of top subcluster-specific genes, with the dot size representing the percentage of cells expressing the gene and colors representing the average expression of the gene within a cluster. (C) Uniform manifold approximation and projection (UMAP) plots depicting the expression of top marker genes for each EC subcluster. Color represents the scaled expression.
-
Figure 5—figure supplement 2—source data 1
Source data for panel A.
- https://cdn.elifesciences.org/articles/57520/elife-57520-fig5-figsupp2-data1-v2.xlsx
Figure 5—figure supplement 3
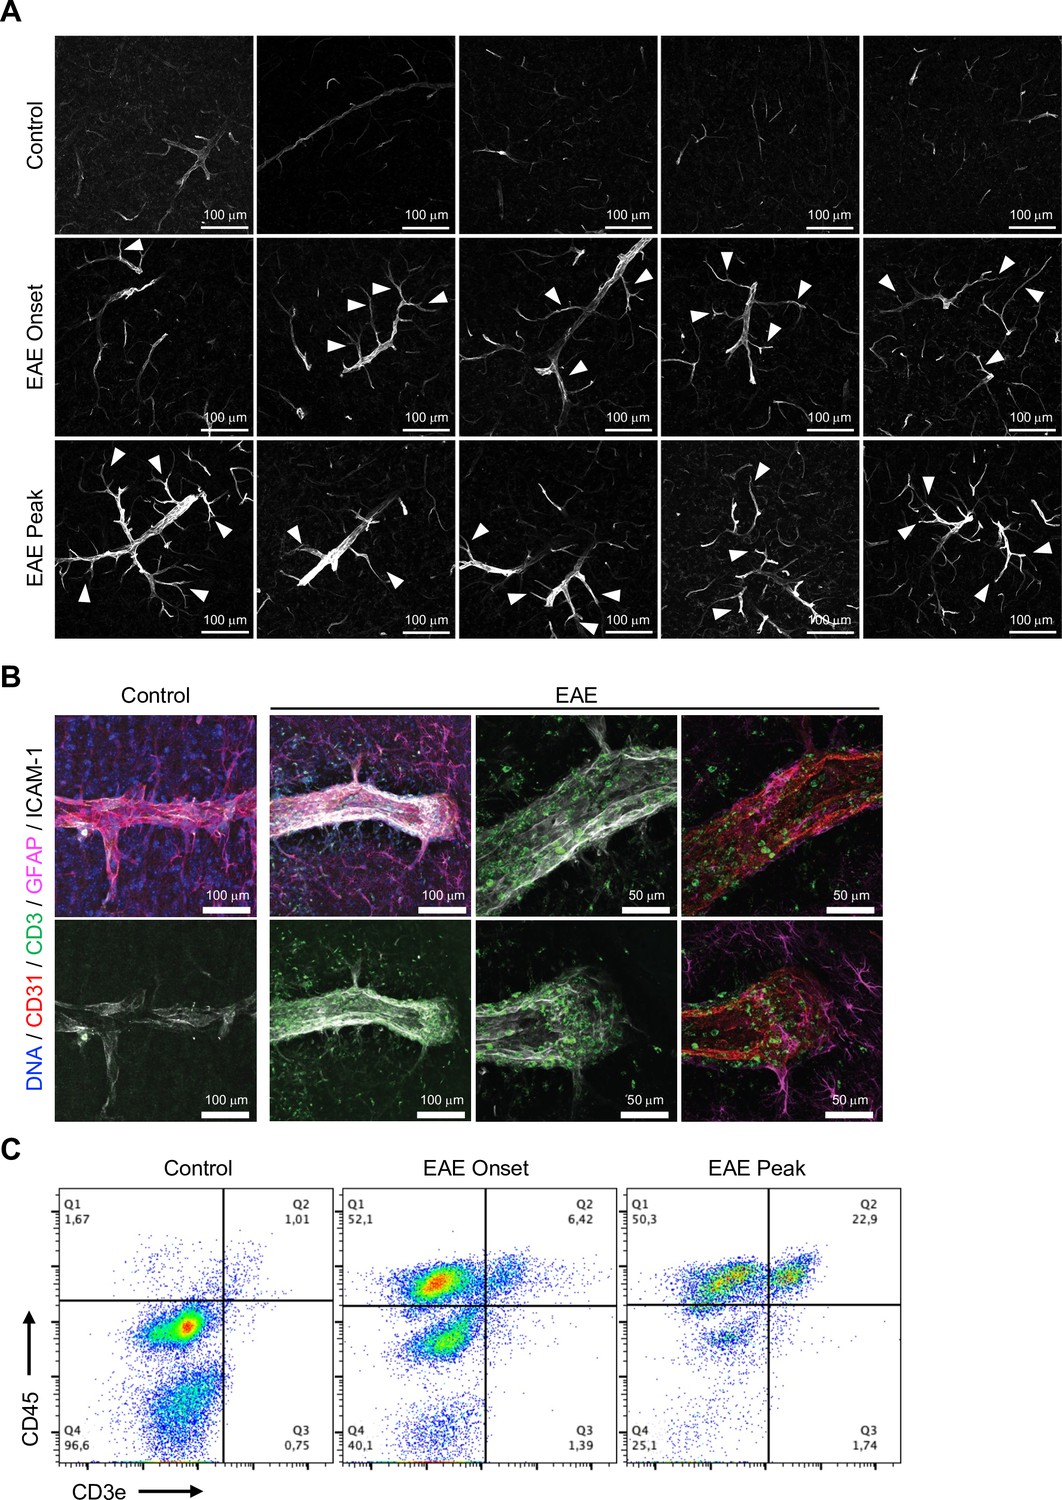
Intercellular adhesion molecule-1 (ICAM-1) expression in brain cortical parenchyma upon experimental autoimmune encephalomyelitis (EAE).
(A) Confocal images showing ICAM-1 immunofluorescence in cortex of control, EAE onset, and peak mice. Arrowheads indicate expansion of ICAM-1 staining from reactive endothelial venules (REVs) into adjacent venules and capillaries. Scale bars, 100 μm. (B) High-resolution immunofluorescence images for CD3+ lymphocytes, ICAM-1+ REVs, and GFAP+ astrocytes in the cerebral cortex of control and EAE mice. CD31 labels all ECs. Scale bar, 100 μm (left two columns), 50 μm (right two columns). (C) Flow cytometry plots depicting brain-infiltrated leukocytes stained with anti-CD45 and anti-CD3e antibodies in control, EAE onset, and peak mice.
Figure 5—figure supplement 4
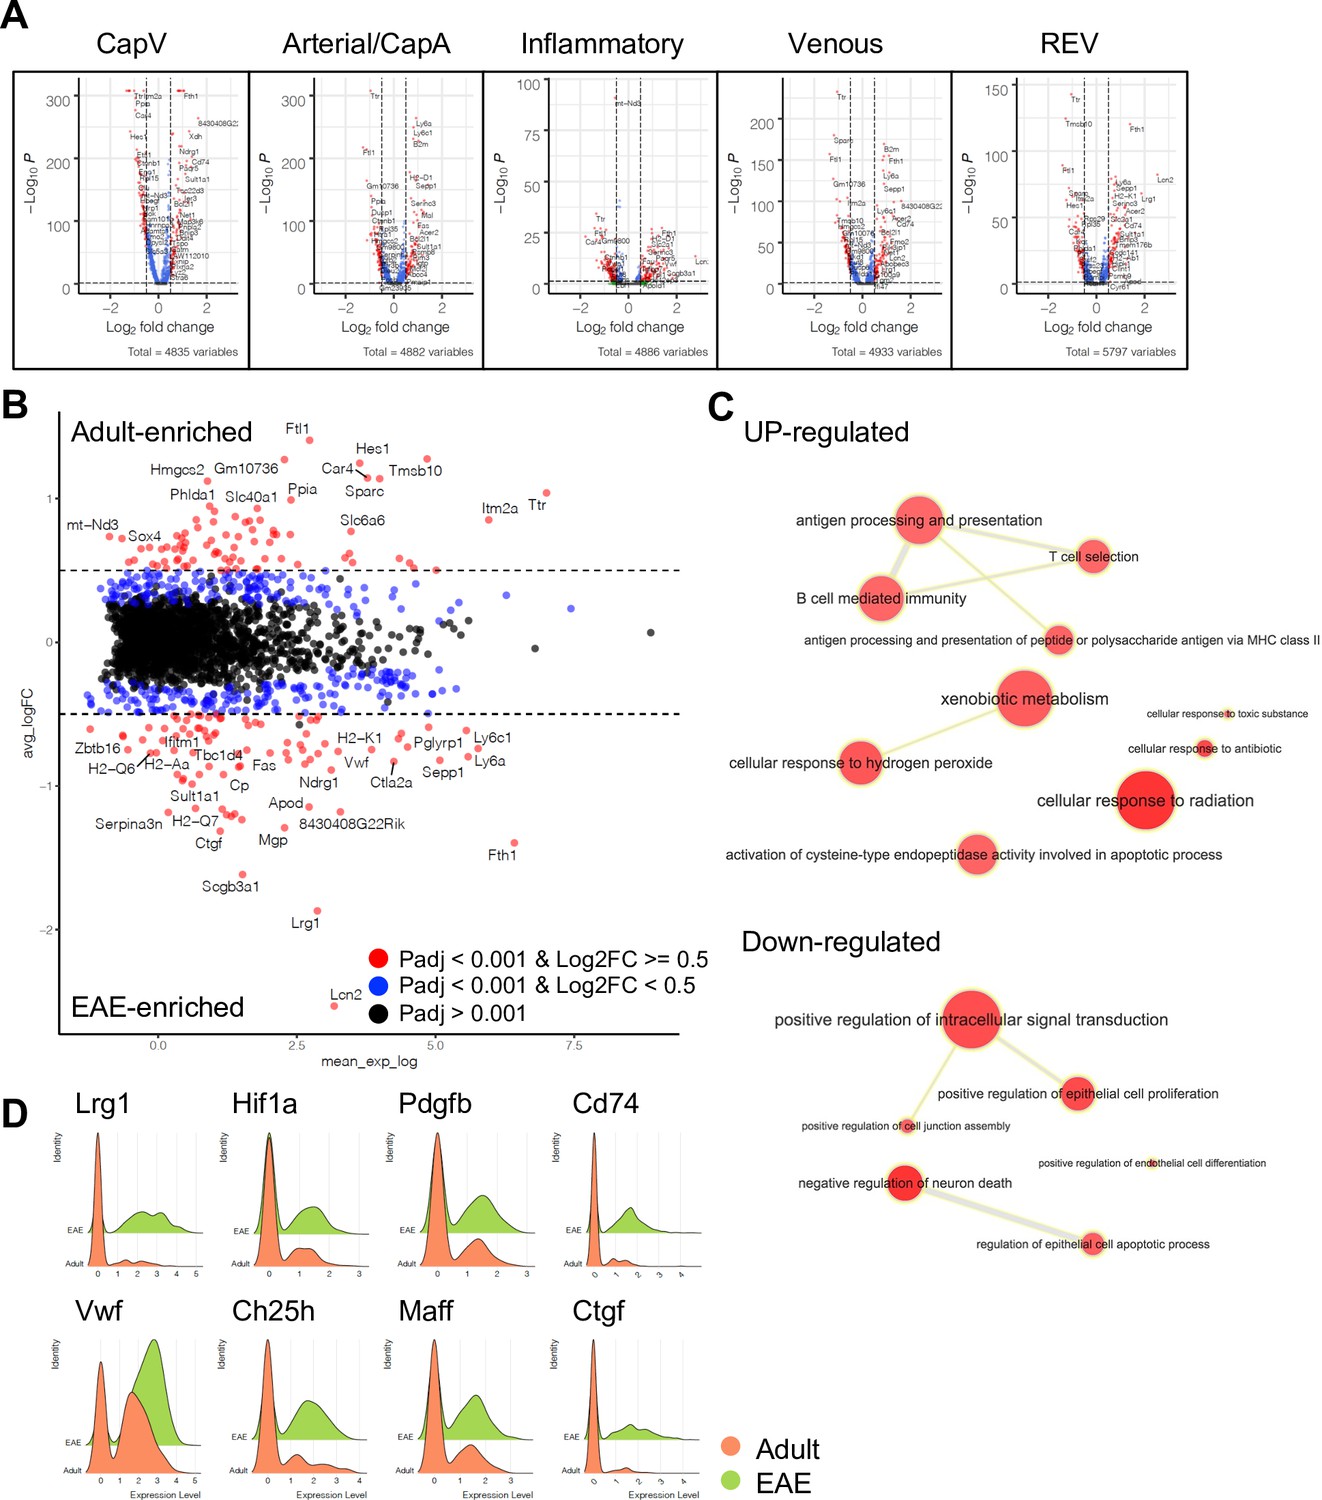
Differentially expressed genes between adult and experimental autoimmune encephalomyelitis (EAE) endothelial cells (ECs).
(A) Volcano plots depicting differentially expressed genes between adult and EAE EC subtypes. Blue dots, p-adjusted value <0.001; red dots, p-adjusted value <0.001, and Log2 fold change >0.5. (B) MA plot of differentially expressed genes between adult and EAE reactive endothelial venules (REVs). Blue dots, p-adjusted value <0.001; red dots, p-adjusted value <0.001, and Log2 fold change >0.5. (C) Significantly enriched gene ontology terms for upregulated or downregulated genes in REV by EAE. Graph visualized by REVIGO. (D) Ridge plots of EAE-induced genes Lrg1, Hif1a, Pdgfb, Cd74, Vwf, Ch25h, Maff, and Ctgf in REVs.
Figure 6 with 1 supplement
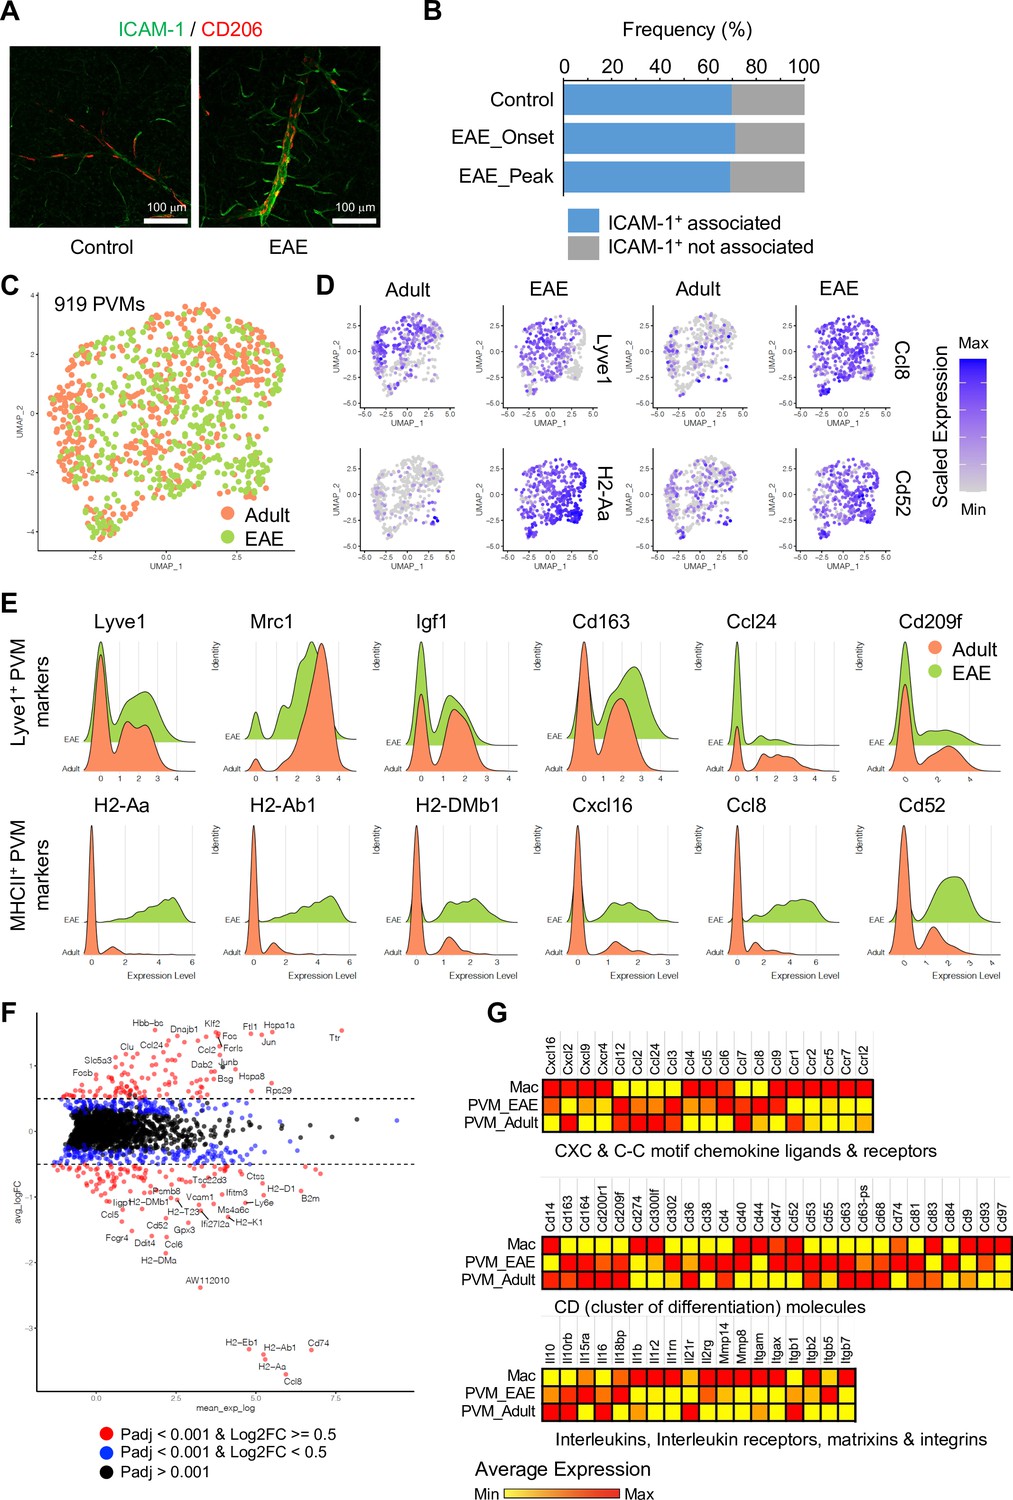
Experimental autoimmune encephalomyelitis (EAE)-induced changes in perivascular macrophages (PVMs).
(A) Representative immunohistochemistry images for CD206+ PVMs and ICAM-1+ vessels in control and EAE brain cortical parenchyma. Scale bars, 100 μm. (B) Frequency of CD206+ PVMs associated to ICAM-1+ vessels in brain cortical parenchyma of control and EAE mice at disease onset (EAE onset) and peak (EAE peak). (C) Uniform manifold approximation and projection (UMAP) plots of 919 PVMs from adult and EAE mice. (D) UMAP plots depicting the expression of Lyve1, H2-Aa, Ccl8, and Cd52 in PVMs of adult control and EAE mice. Color indicates the scaled expression. (E) Ridge plots of Lyve1+ and MHCII+ PVM marker genes in adult and EAE PVMs. (F) MA plot of differentially expressed genes between PVMs from healthy adult and EAE brain. Blue dots, p-adjusted value <0.001; red dots, p-adjusted value <0.001, and Log2 fold change >0.5. (G) Heatmap of selected differentially expressed genes (Padj <0.001) across adult and EAE PVMs and activated macrophages (Mac). Color indicates the scaled average expression.
-
Figure 6—source data 1
Source data for Figure 6B.
- https://cdn.elifesciences.org/articles/57520/elife-57520-fig6-data1-v2.xlsx
Figure 6—figure supplement 1
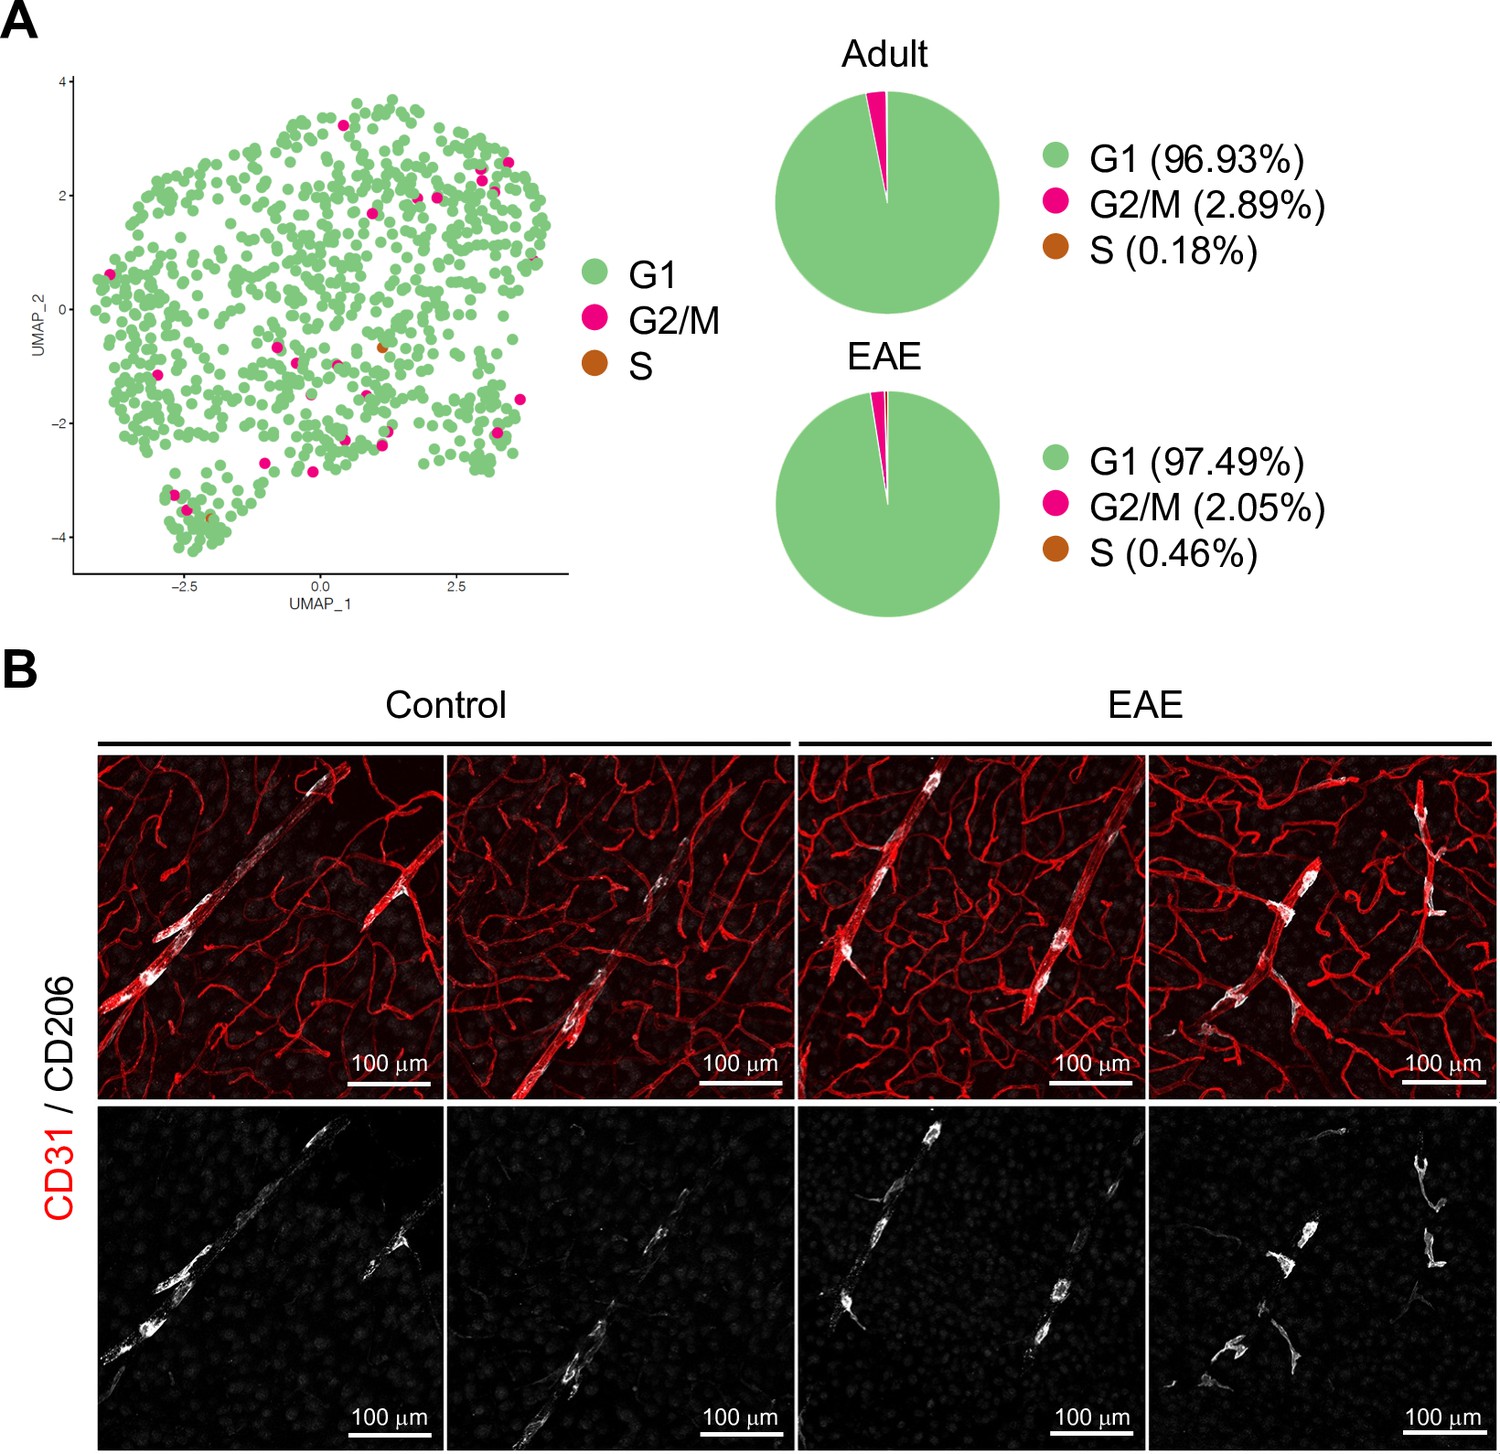
Cell cycle phases and localization of perivascular macrophages (PVMs) in experimental autoimmune encephalomyelitis (EAE).
(A) Uniform manifold approximation and projection (UMAP) plot and pie chart of PVMs in adult and EAE brain cortex in the indicated cell cycle phases. (B) CD31 and CD206 immunostaining of brain cortex from control and EAE mice. Scale bars, 100 μm.
Figure 7 with 2 supplements
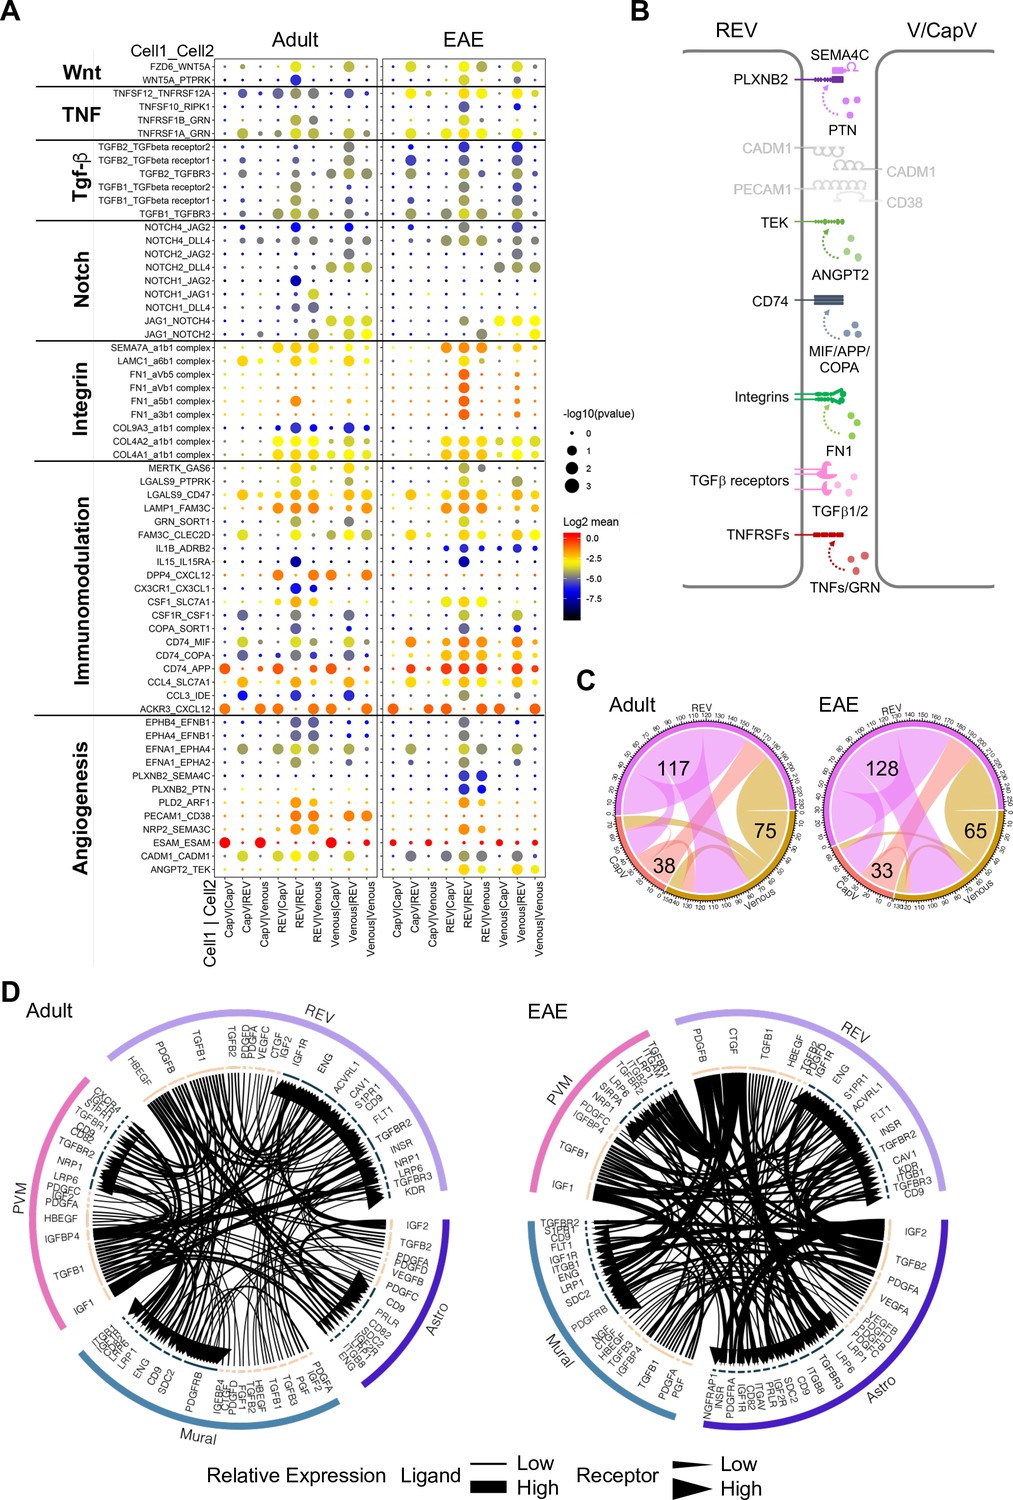
Interactions between different endothelial cell (EC) subpopulations and blood-brain barrier (BBB) cell types.
(A) Overview of potential ligand-receptor interactions for CapV, reactive endothelial venule (REV), and venous EC populations in adult and experimental autoimmune encephalomyelitis (EAE) based on gene expression. Circle size indicates p-values. Color key indicates the means of the average expression levels of interacting molecules. (B) Diagram of the main ligand-receptor interactions regulated by EAE. (C) Diagram of the numbers of ligand-receptor interactions on CapV, REV, and venous EC populations in healthy adult and EAE brain. (D) Circos plots for ligand-receptor interactions between REV ECs, mural cells (Mural), perivascular macrophages (PVMs), and astroependymal cells (Astro) in adult and EAE. Each plot shows top 100 highly expressed interactions. The lines and arrow heads are scaled to indicate the relative expression level of the ligand and receptor, respectively.
Figure 7—figure supplement 1
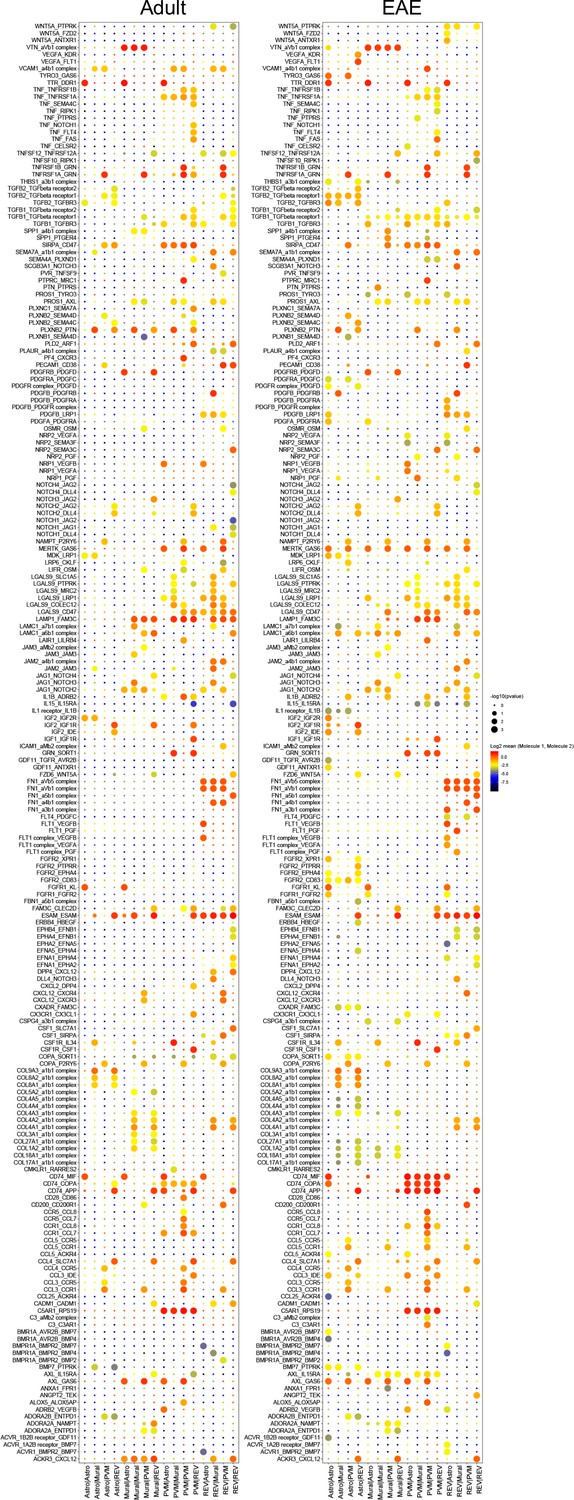
Interactome of blood-brain barrier (BBB) cell types in postcapillary venules.
Overview of differential ligand-receptor interactions between reactive endothelial venule (REV) endothelial cell (EC), perivascular macrophage (PVM), mural cell (Mural), and astroependymal cells (Astro) populations in adult control and experimental autoimmune encephalomyelitis (EAE) brain. Circle size indicates p-values. Color indicates mean average expression levels of interacting molecules.
Figure 7—figure supplement 2
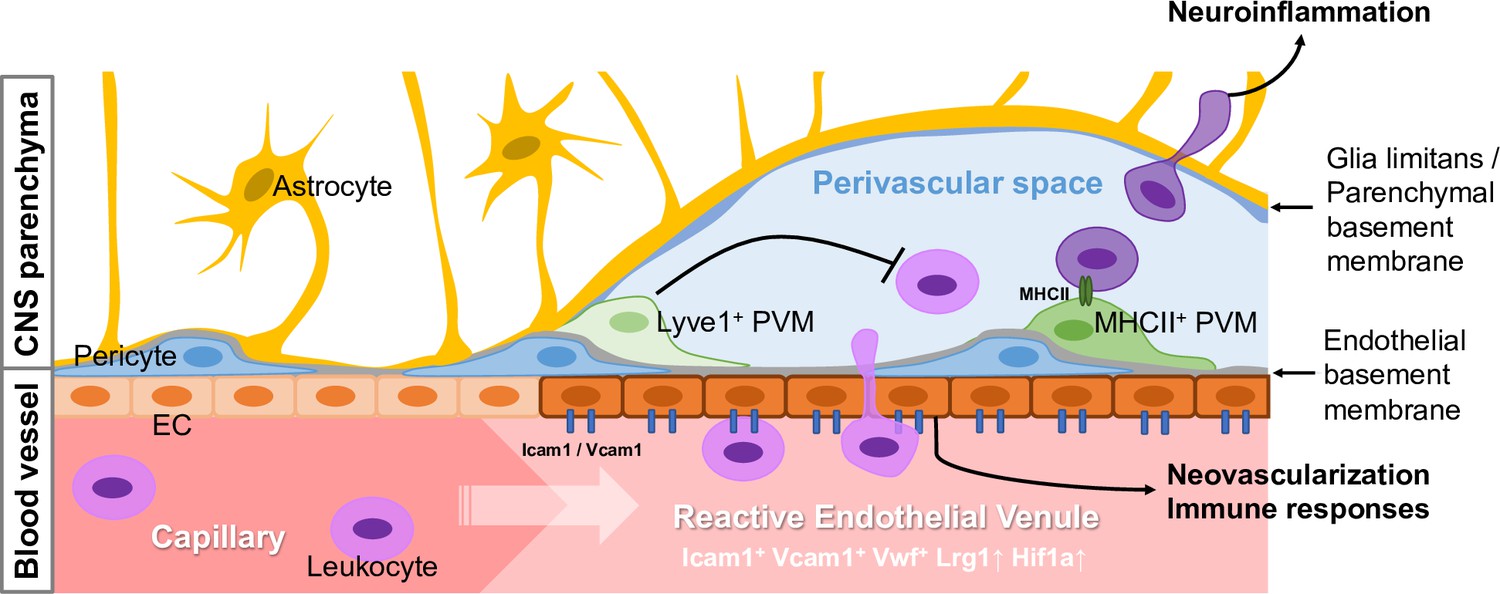
Schematic summary of experimental findings.
Schematic summary of proposed findings. Reactive endothelial venules (REVs) are specialized cellular gateways in the CNS vasculature with associated perivascular macrophages (PVMs) as gatekeepers in the perivascular space, regulating the infiltration of circulating leukocytes into the brain parenchyma and vascular integrity during homeostasis and neuroinflammation.
Author response image 1
Author response image 2
Download links
A two-part list of links to download the article, or parts of the article, in various formats.
Downloads (link to download the article as PDF)
Open citations (links to open the citations from this article in various online reference manager services)
Cite this article (links to download the citations from this article in formats compatible with various reference manager tools)
Single-cell transcriptomics reveals functionally specialized vascular endothelium in brain
eLife 11:e57520.
https://doi.org/10.7554/eLife.57520


