Plasmodium falciparum translational machinery condones polyadenosine repeats
- Department of Cell Biology and Physiology, Washington University School of Medicine, United States
- Roy J. Carver Department of Biochemistry, Biophysics, and Molecular Biology, Iowa State University, United States
- Washington University Center for Cellular Imaging, Washington University School of Medicine, United States
- Department of Biology, Washington University, United States
- Department of Neuroscience, Washington University School of Medicine, United States
- Department of Biomedical Engineering, Washington University, United States
- Institute of Biochemistry and Biophysics Polish Academy of Sciences, Department of Bioinformatics, Poland
Figures
Figure 1 with 1 supplement
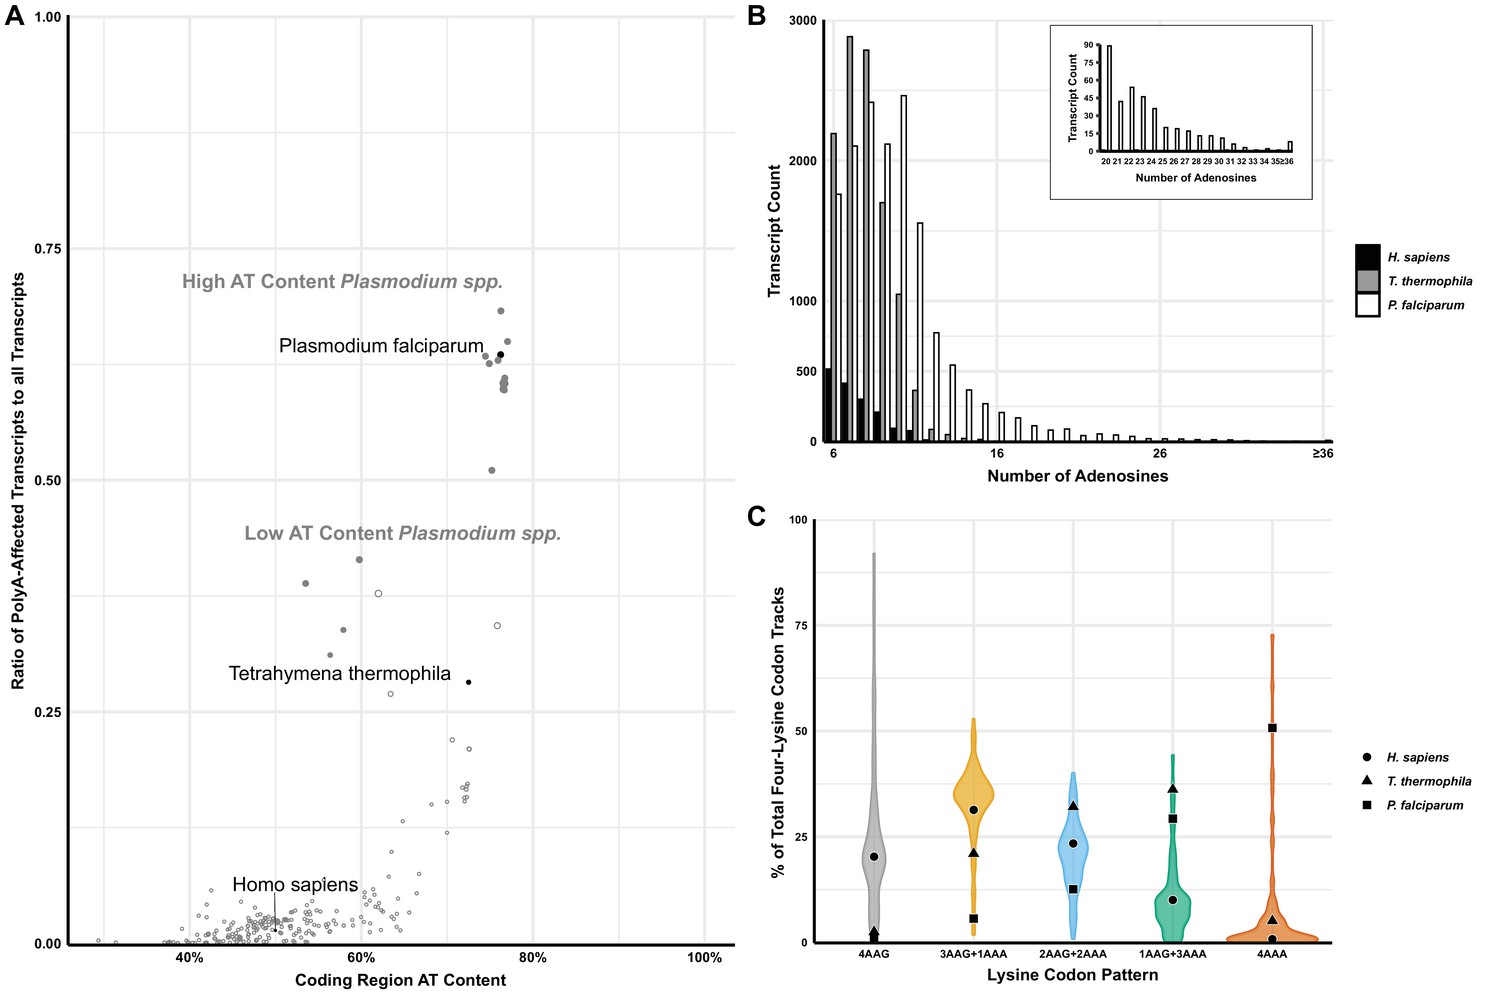
Analyses of polyA tracts in eukaryotic genomes.
(A) The plot of 152 species representing a comparison of the ratio of polyA-affected transcripts (over a total number of transcripts) to the AT content of the coding region for each organism. H. sapiens, T. thermophila, and P. falciparum, as organisms pertinent to this paper are in black. For reference, other model organisms of interest are displayed in gray, including a position of high (65% average) and low (35%) AT-content Plasmodium spp. (B) Transcript counts for genes with 6 to 36 consecutive adenosines for H. sapiens, T. thermophila, and P. falciparum. H. sapiens and T. thermophila are limited to a single transcript at length of ≤17 As. The longest P. falciparum 3D7 transcript reaches maximal 65As, with multiple transcripts of ≤36 As. (C) Violin plot of lysine codon usage distribution in tracts of four lysine residues for 152 organisms. 3AAG+1AAA, 2AAG+2AAA and 1AAG+3AAA indicate different ratios of AAG and AAA codons in runs of four consecutive lysine codons. 4AAG and 4AAA indicate poly-lysine runs with only AAG or AAA codons, respectively. H. sapiens (circle), T. thermophila (triangle), and P. falciparum (square) are specifically noted.
-
Figure 1—source data 1
Lysine codons distibution in 4xLys runs in eukaryotic genomes.
- https://cdn.elifesciences.org/articles/57799/elife-57799-fig1-data1-v2.xlsx
Figure 1—figure supplement 1

Percentage of genes with ≥12A (white) and ≥12A-1 (gray) consecutive adenosine nucleotides for each organism.
Number of genes was calculated as percentage of total number of genes with ≥12 or≥12A-1 consecutive adenosine nucleotides over total number of genes for each organism.
Figure 2 with 3 supplements

P. falciparum cells express reporters with long polyA tracts.
(A) mRNA abundance of reporter constructs (+polyA36) by qRT-PCR relative to their counterpart lacking polyA stretches (-polyA36) in H. sapiens, T. thermophila, and P. falciparum cells. Data represent three biological replicates with a standard deviation. (B) Expression of reporter constructs in H. sapiens, T. thermophila, and P. falciparum followed by western blot analysis with αHA or αGFP antisera. Samples from two integrated clones for the -polyA36 control (-A) and the +polyA36 reporter (+A) are shown for T. thermophila. αβ-actin, α-Histone H3 trimethyl-lysine (H3kM) and αhDHFR are used as loading controls for western blot analysis from H. sapiens, T. thermophila and P. falciparum cells, respectively. (C) Images from live fluorescence microscopy of P. falciparum expression of reporter constructs with (+polyA36) and without (-polyA36) polyA tracts as well as parent (non-transfected) line, 2.5 µm scale bar. (D) Quantification of protein amounts for Thioredoxin-2HA-NanoLuciferase (Trx-2HA-NLuc) reporter without (-polyA36) and with 36 adenosine stretch (+polyA36) expressed in P. falciparum cells. Western blot analysis of Trx-2HA-NLuc reporter (Figure 2—figure supplement 2) and luminescence measurements were normalized to hDHFR or cell number, respectively. Luminescence data represent the mean value of three biological replicates with standard deviation.
-
Figure 2—source data 1
Luminescence and western blot quantification data.
- https://cdn.elifesciences.org/articles/57799/elife-57799-fig2-data1-v2.xlsx
Figure 2—figure supplement 1
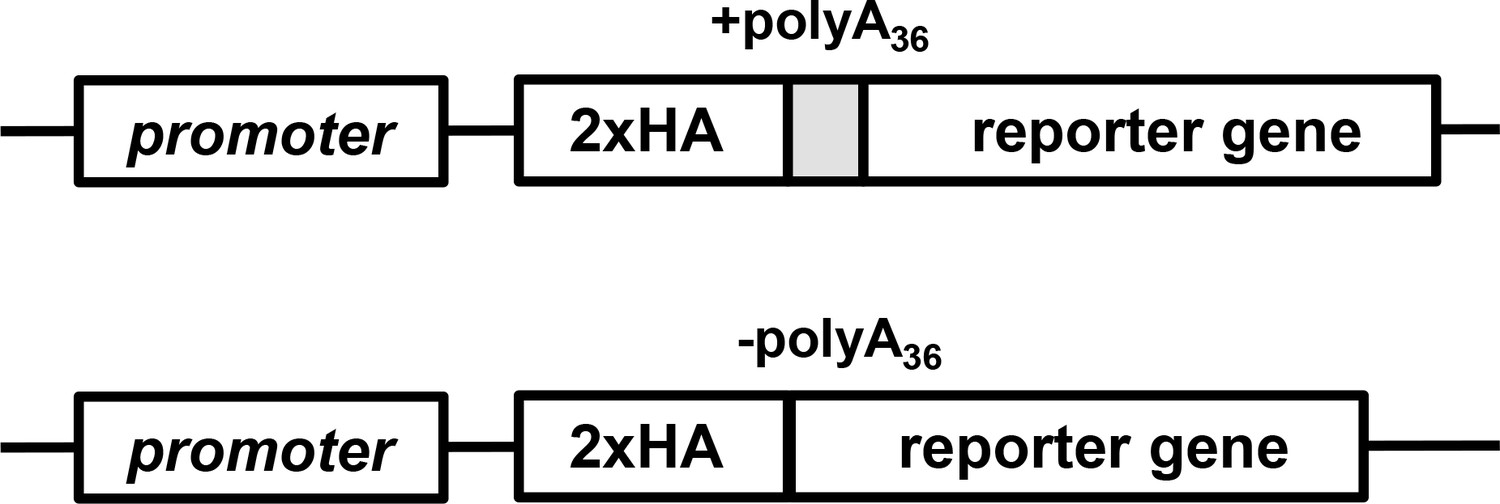
Generalized scheme of reporter constructs used for expression in H. sapiens, T. thermophila, and P. falciparum.
Figure 2—figure supplement 2
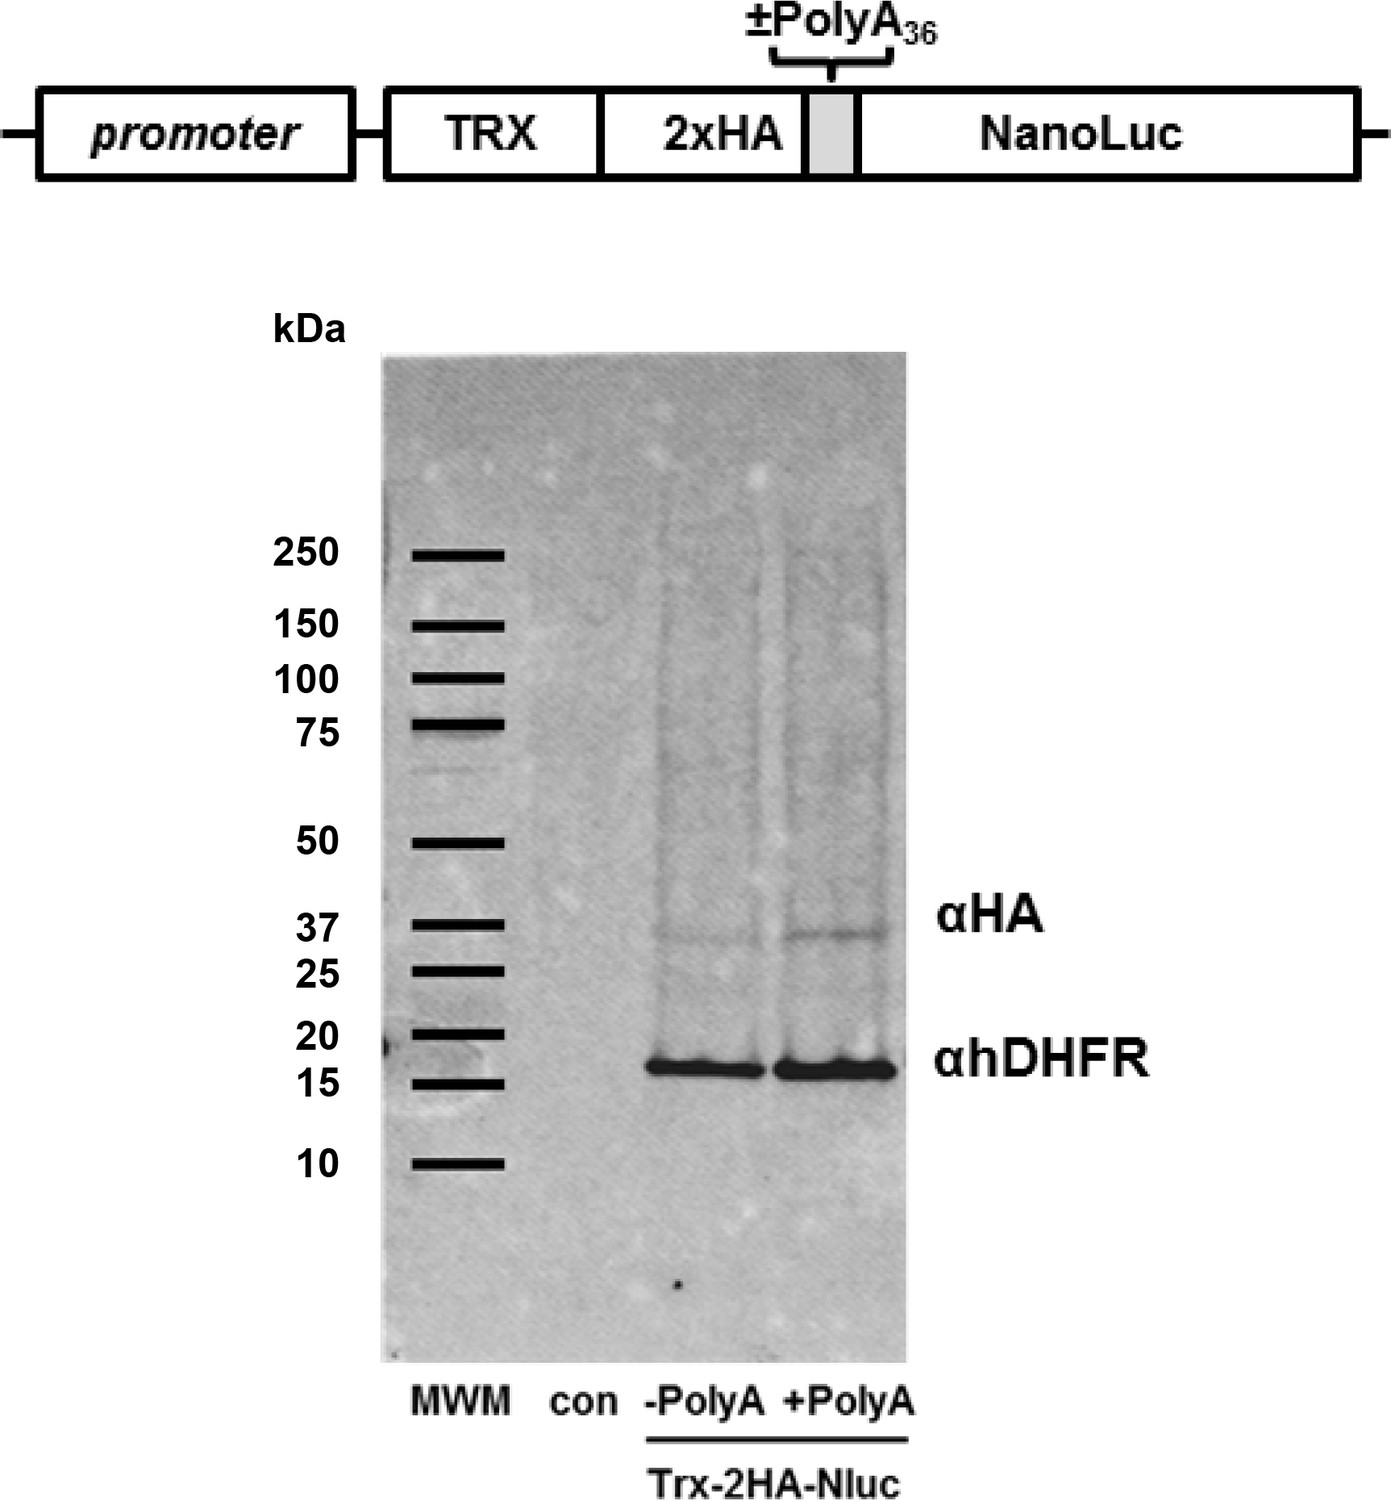
Generalized schematic of Thioredoxin fusion NanoLuc reporter construct used for episomal expression in P. falciparum cells (Trx-2HA-Nluc).
Lower: Western blot analysis of Trx-2HA-Nluc reporter expression in P. falciparum without (-polyA36) and with 36 adenosine stretch (+polyA36). Human DHFR (hDHFR) expressed from the same plasmid is used as loading and transfection control. Untransfected P. falciparum control cells (con) and Biorad Precision Plus Protein molecular weight markers (MWM) are indicated.
Figure 2—figure supplement 3
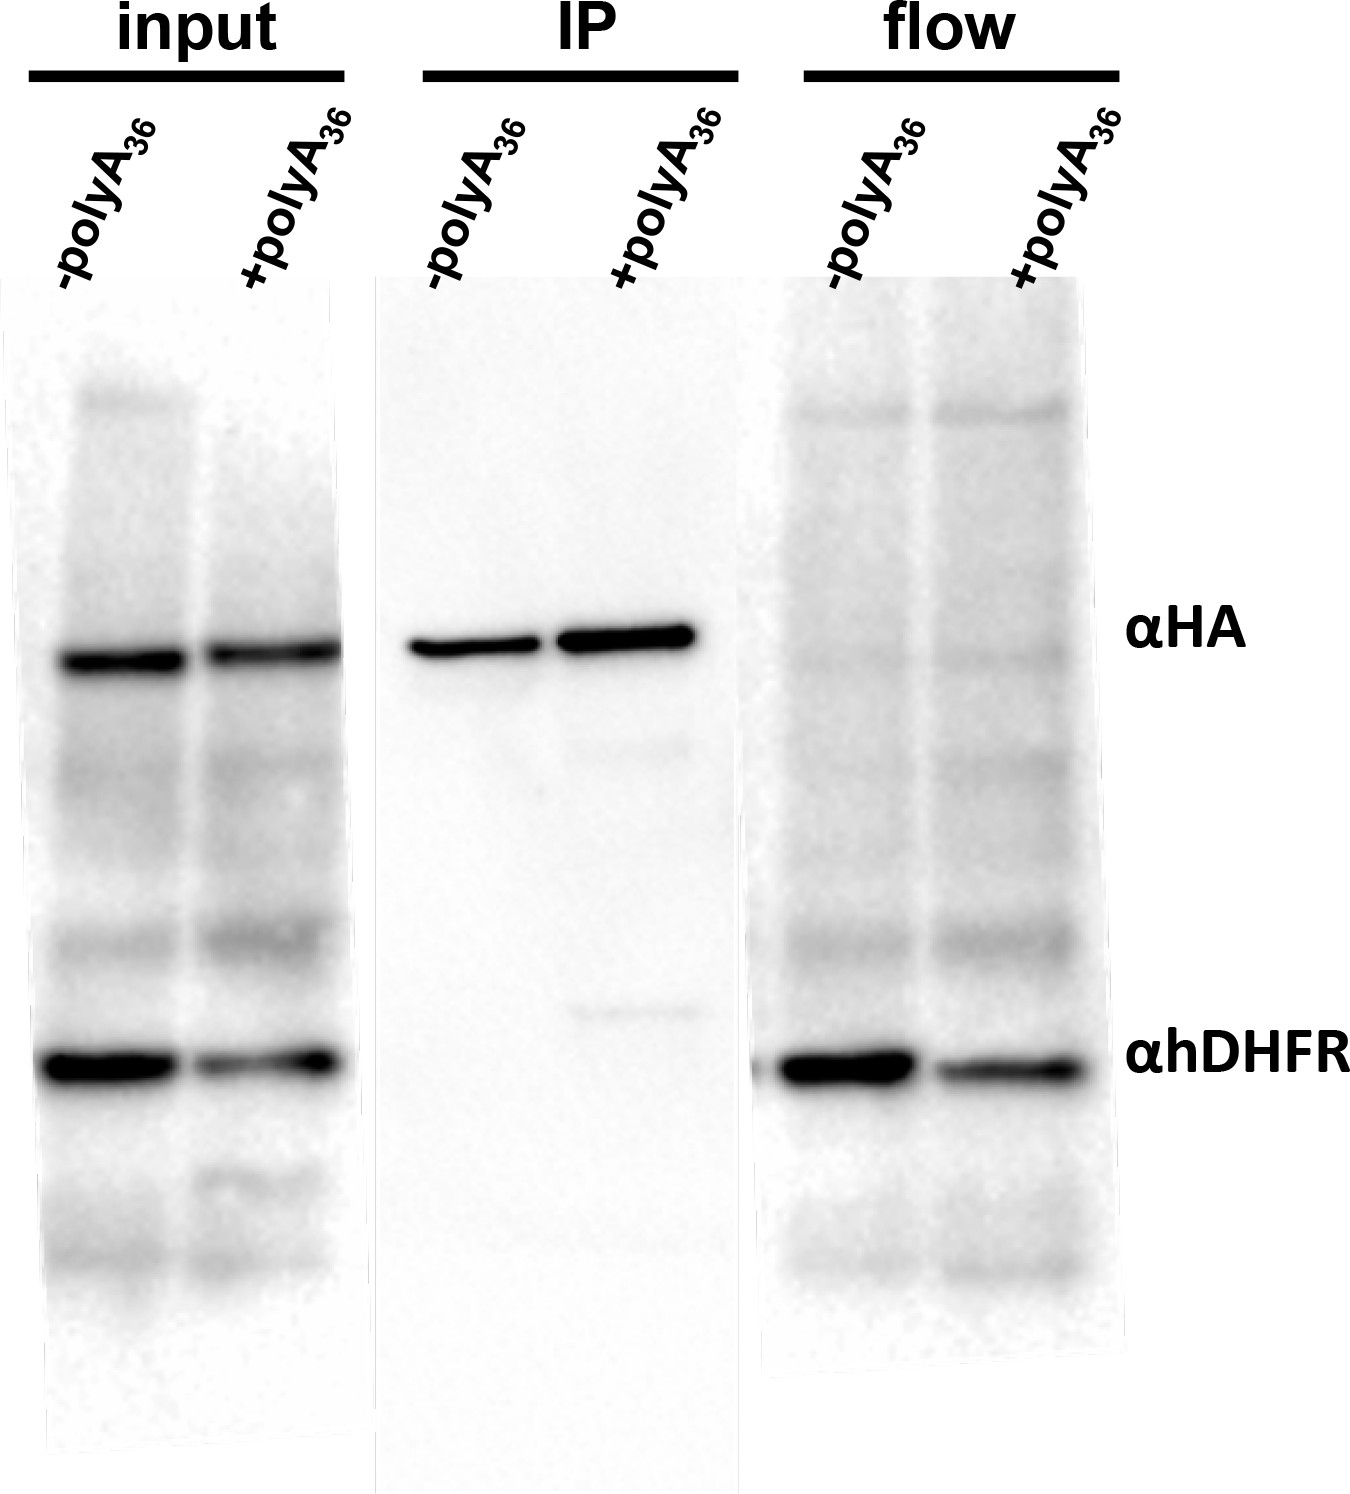
HA-pull-down assay of –polyA36, +polyA36 reporters.
The input samples and the elution fractions were examined by western blot using anti-HA antibody HRP labeled (sc-7392HRP) anti-hDHFR (sc-377091). The HA-pull down was done using HA-magnetic beads (ThermoScientific, 88836) at 4°C over night. Bound proteins were eluted with sample buffer (BioRad).There is an equal amount of –polyA36, +polyA36 tagged reporter gene. The HA-tagged proteins were episomally expressed in HA-tagged pelota P. falciparum Dd2 strain.
Figure 3
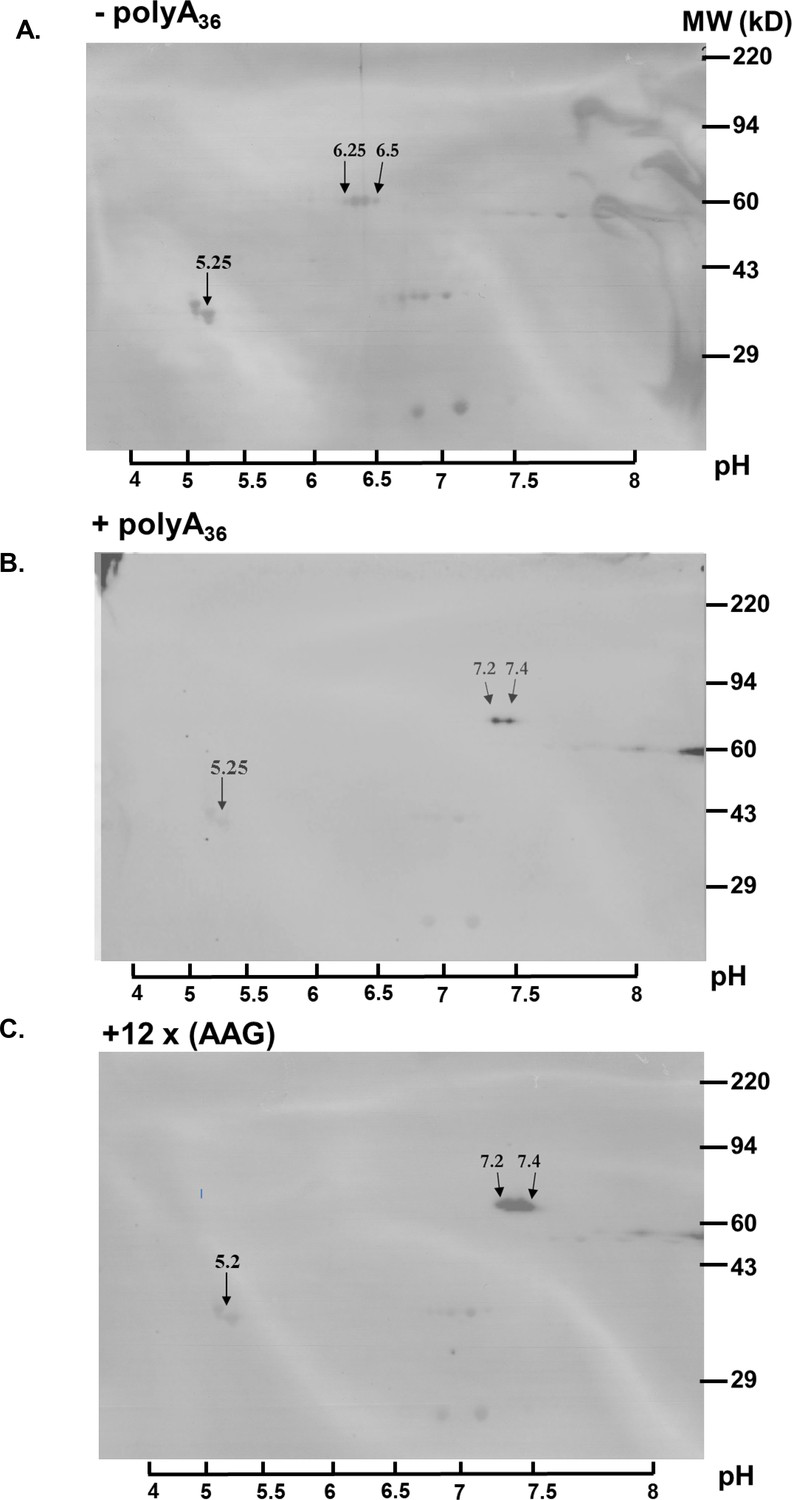
Poly-A tracts are correctly translated in P. falciparum cells.
(A) 2D gel analysis of HA-IP samples of wild type reporter (-polyA36). The western blots show isoelectric point (pI) at 6.25 and 6.5 (arrows). (B) 2D gel of reporter with polyA tract (+polyA36) sample indicates pI 7.25 and 7.4 (arrows).( C) 2D gel analyses of reporter with twelve lysines coded by AAG codons (12 x AAG) indicates the same effect on pI value, pI is 7.25 and 7.4 (arrows). Overlay of images of PVDF membranes stained with Coomassie Brilliant Blue, and images of western blots probed with HA-antibody. The scale with pH is on the bottom. Coomassie-stained membranes show markers (right side) and tropomyosin (33 kDa) and pI at 5.2 (arrow) as an internal standard for Isoelectric focusing (IEF).
Figure 4 with 5 supplements
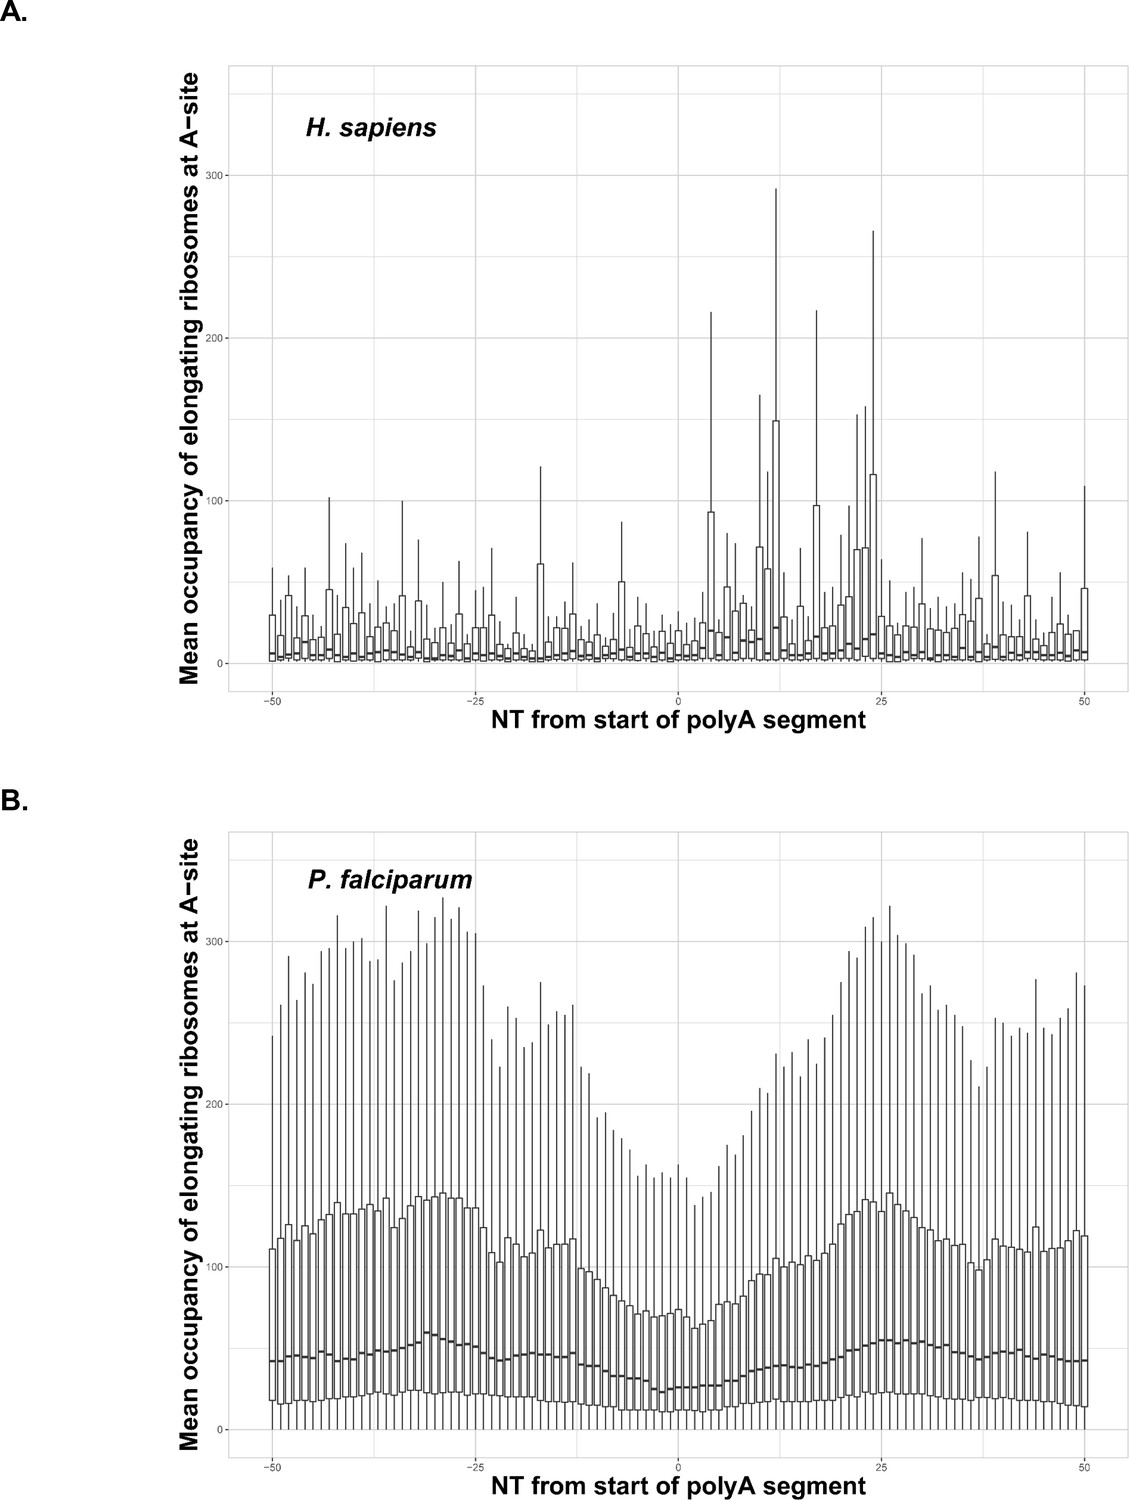
Occupancy of elongating ribosomes (mapped to A-site) around the start of polyA segments in human (A) and P. falciparum (B).
Occupancy is shown on the same scale. In both cases, to avoid the inclusion of sparsely mapped segments, regions with average occupancy below the mean for the whole dataset were excluded. In the case of P. falciparum gene segments with polyA tracts shorter than 22 adenosine nucleotides were taken into account. Centerlines show the medians; box limits indicate the 25th and 75th percentiles; whiskers extend 1.5 times the interquartile range from the 25th and 75th percentiles. Dip in around position 0 in the P. falciparum plot is an artifact of the reads mapping procedure shown in Figure 4—figure supplement 1. It is not observed in human data, because of shorter polyA segments and lower occupancy overall around these segments.
Figure 4—figure supplement 1
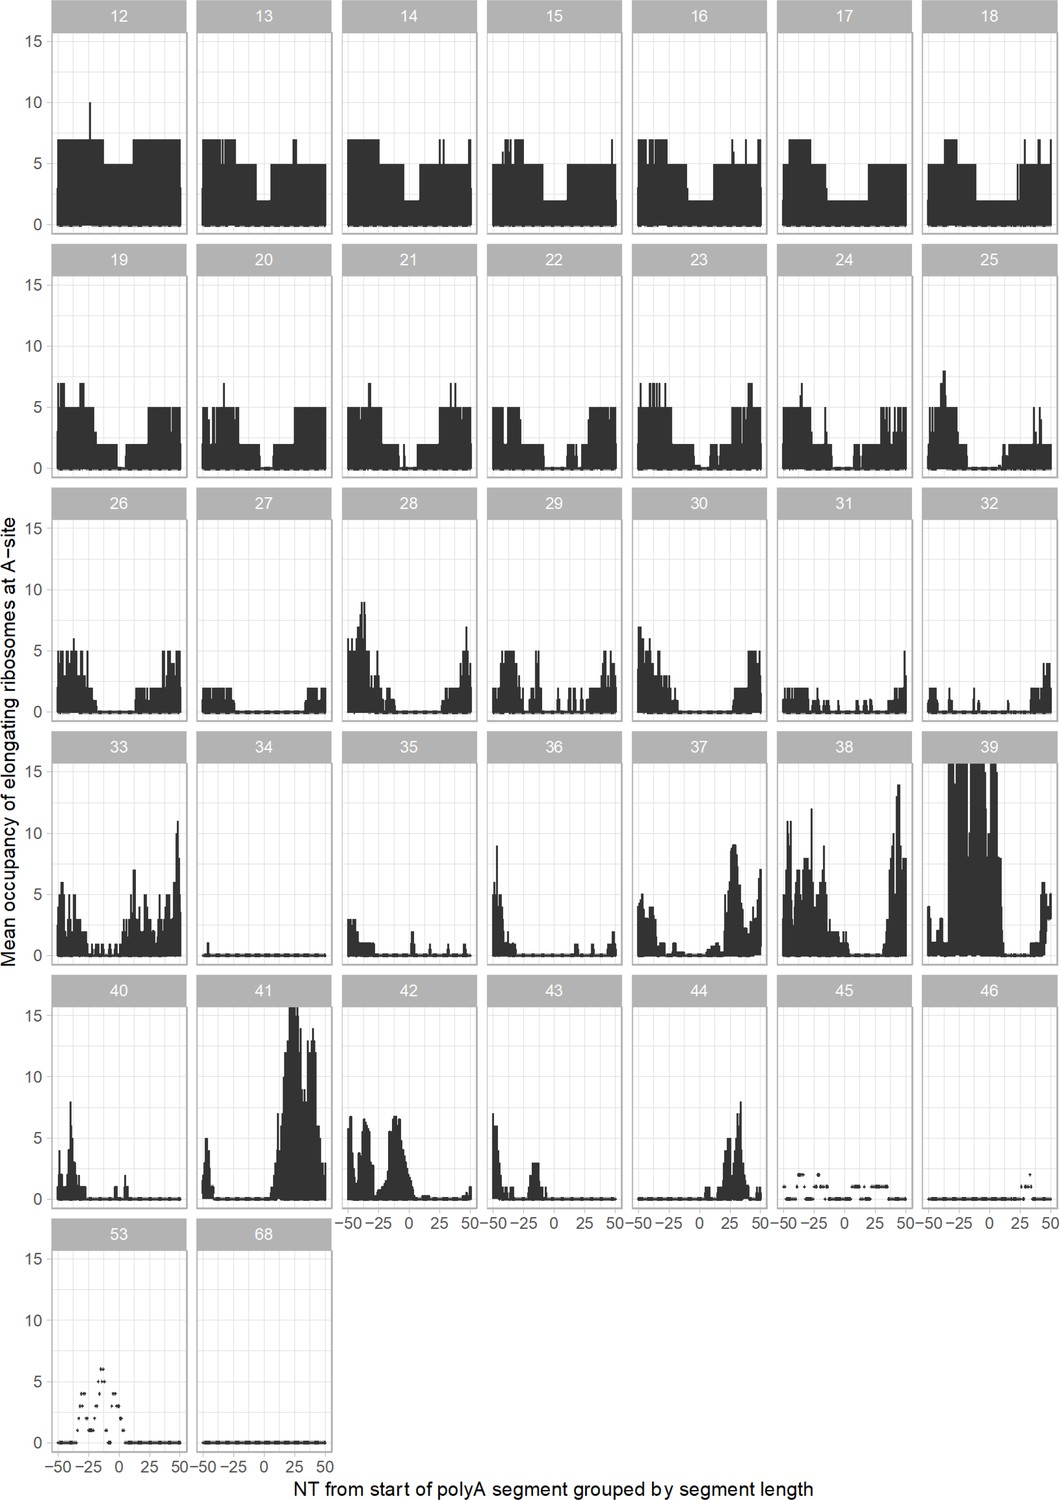
Ribosome occupancy around polyA segment of P. falciparum transcripts (summarized across all life stages) and grouped by polyA segment length (12–68 adenosine nucleotides in a row transcripts are shown).
Figure 4—figure supplement 2
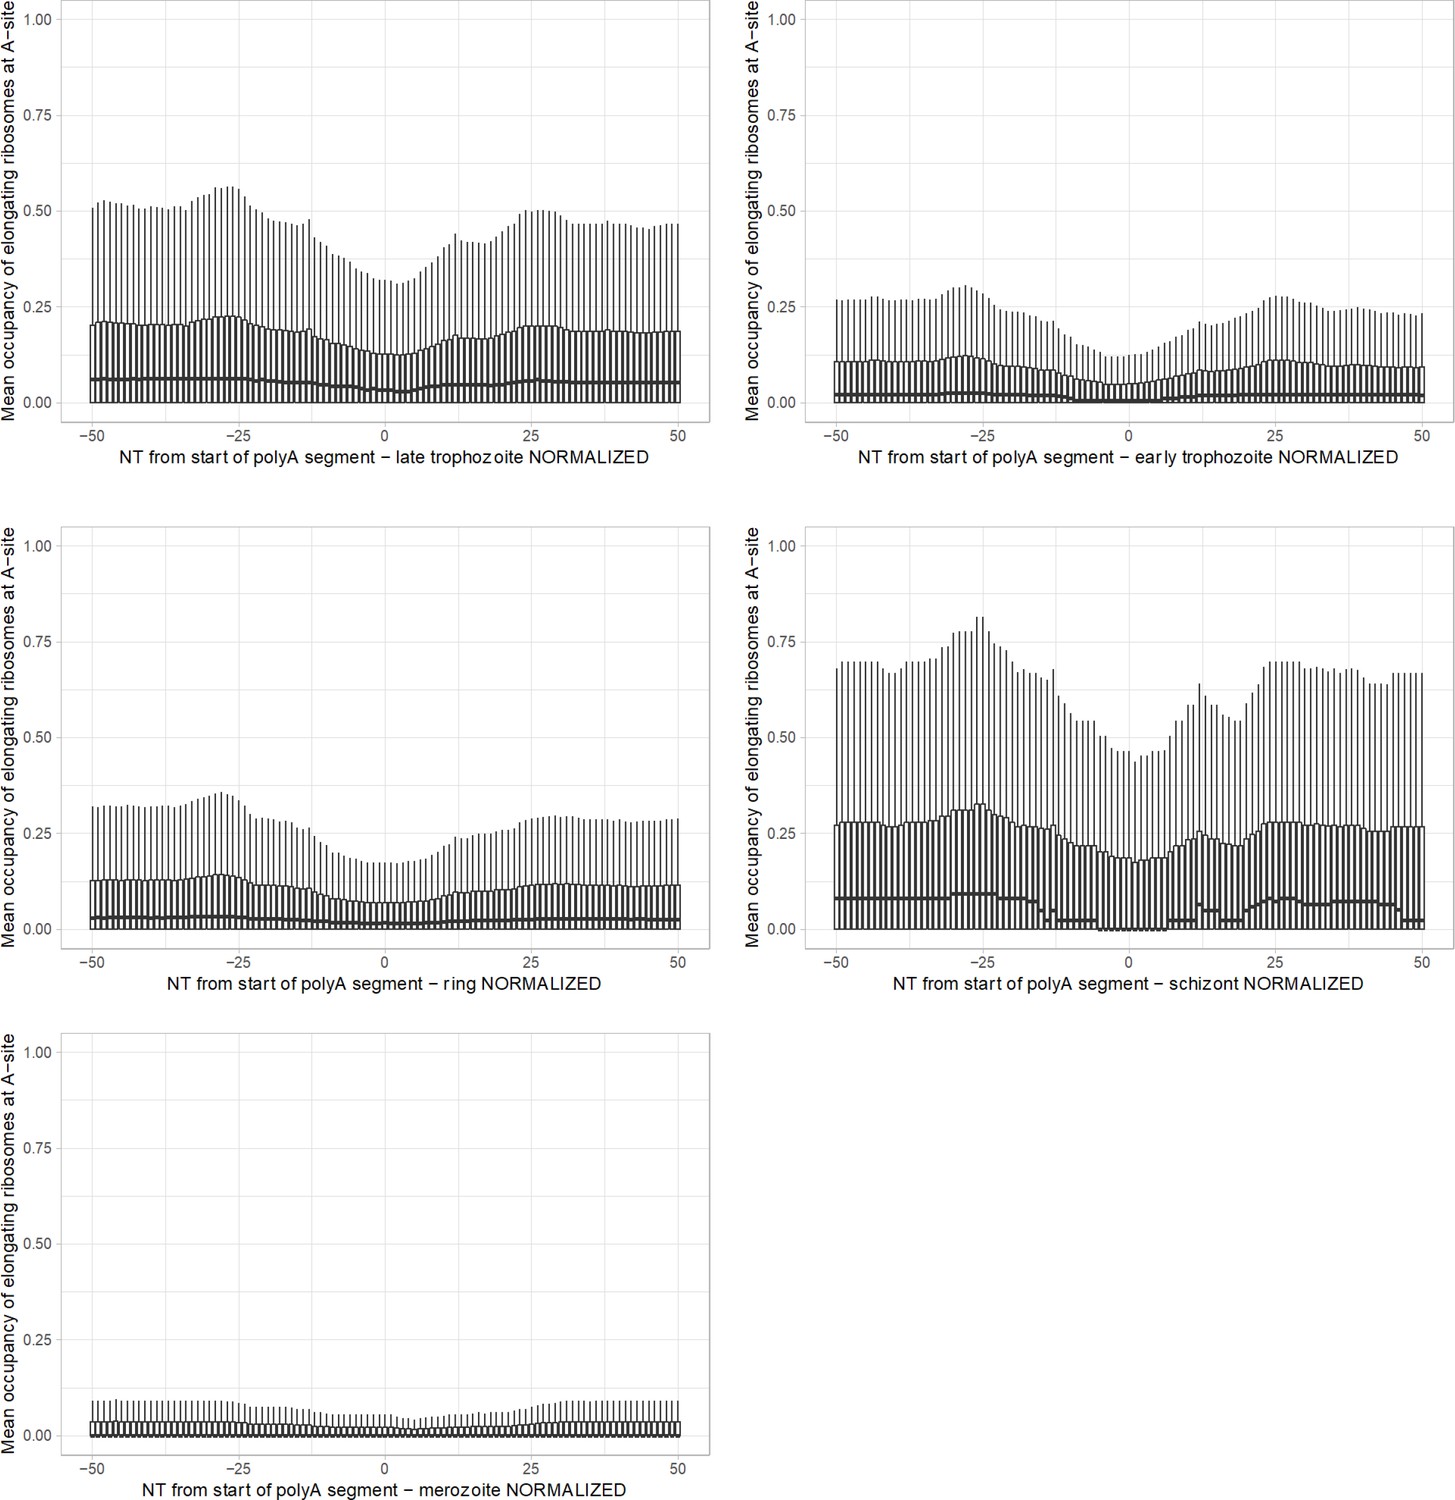
Occupancy of elongating ribosomes (mapped to A-site) around start of polyA segment in Plasmodium at different life stages.
Scale preserved from the main figures. In all cases, to avoid inclusion of sparsely mapped segments, regions with average occupancy below the mean for the particular dataset were excluded. Genes with segments shorter than 22 adenosine nucleotides were taken into account. In all cases data were normalized by dividing by a mean occupancy of a randomly selected gene segments equally numbered as polyA set from the same dataset. Centerlines show the medians; box limits indicate the 25th and 75th percentiles; whiskers extend 1.5 times the interquartile range from the 25th and 75th percentiles.
Figure 4—figure supplement 3
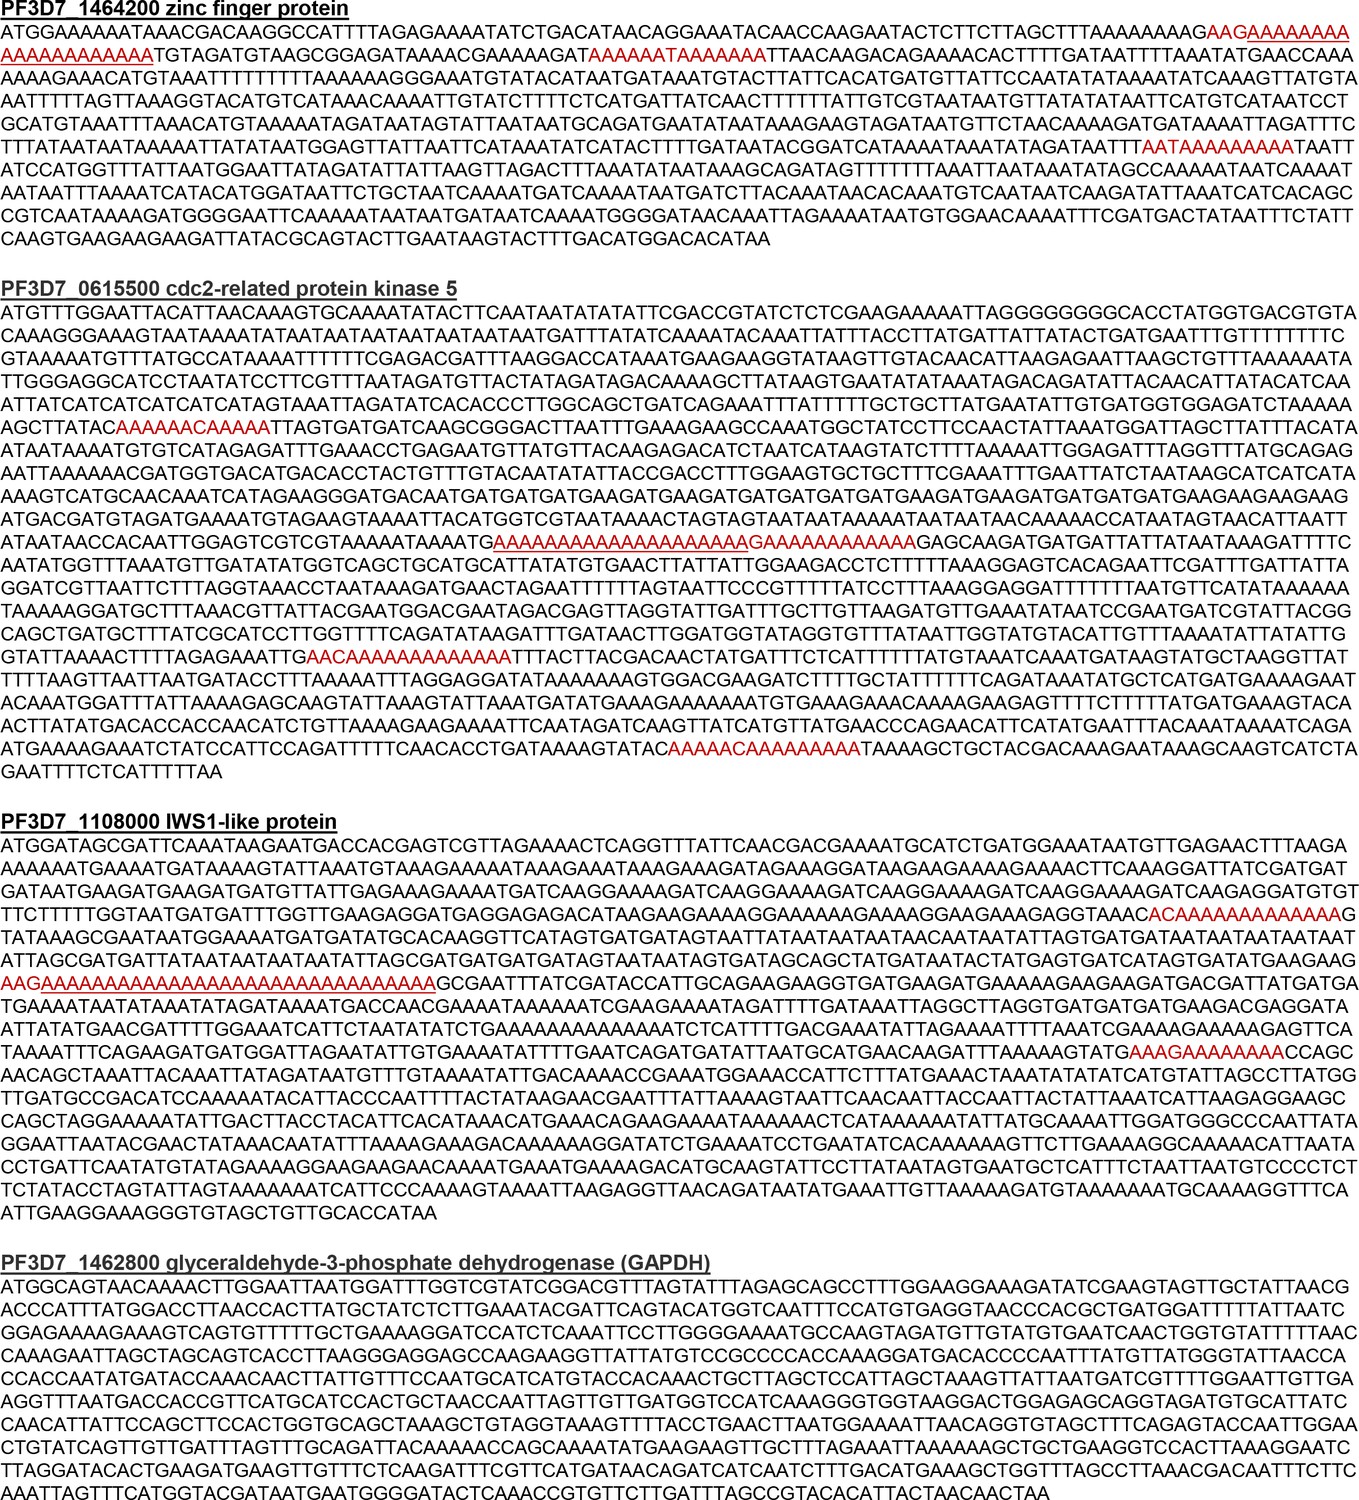
Sequences of three P. falciparum polyA tract genes (PF3D7_1464200, PF3D7_0615500, PF3D7_1108000).
PolyA tracts are indicated in red color and the longest continues stretch of adenosine nucleotides is underlined. Sequence of P. falciparum GAPDH gene (PF3D7_1462800), that was used for normalization of gene expression is also indicated.
Figure 4—figure supplement 4

Time course mRNA expression analysis of three genes (PF3D7_1464200, PF3D7_0615500, PF3D7_1108000) containing polyA stretches of varying lengths (largest: 20, 20, and 31 adenosines respectively) normalized to GAPDH (PF3D7_1462800) starting with highly synchronized rings at time zero.
2-ΔΔCt values represent mRNA abundance enrichment of genes with polyA stretches over PfGAPDH mRNA levels.
Figure 4—figure supplement 5
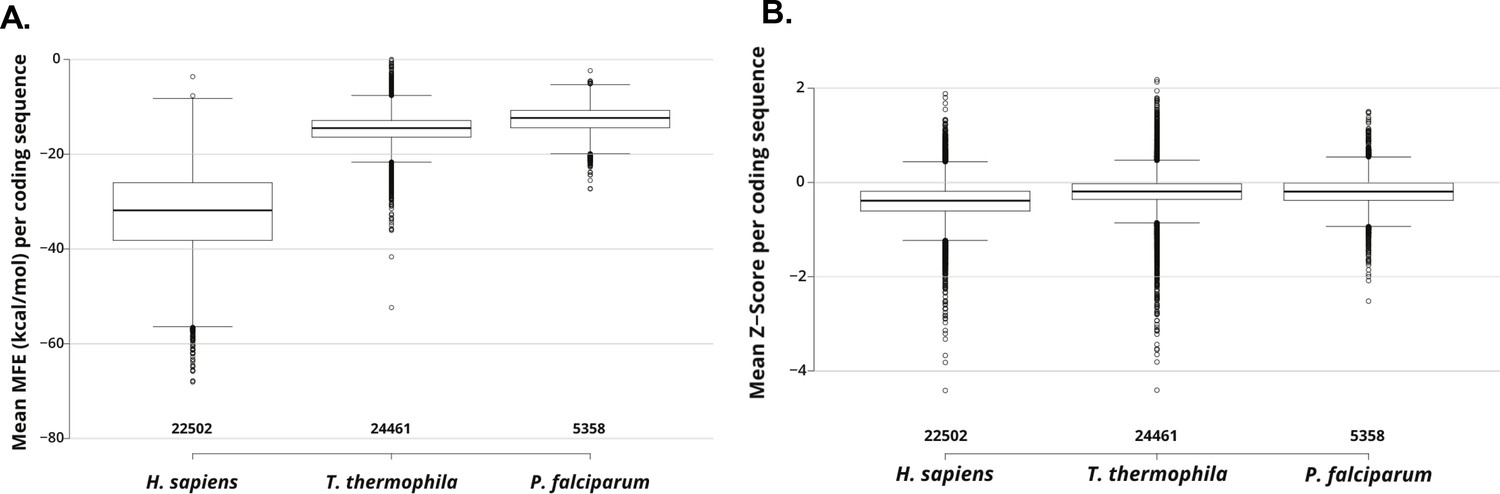
Box and whisker plots are showing the distribution of mean folding energy values (kcal/mol; measures the stability of RNA structure) calculated for each coding sequence from H. sapiens, T. thermophila, and P. falciparum, resulting from a scanning window analysis (see Materials and methods).
Centerlines show the medians; box limits indicate the 25th and 75th percentiles; whiskers extend 1.5 times the interquartile range from the 25th and 75th percentiles; outliers are represented by dots; numbers below plots are the number of coding sequences for each species. (B) Box and whisker plots showing the distribution of mean z-score values (measures standard deviations more stable native sequence RNA structure is vs. random) calculated for each coding sequence from H. sapiens, T. thermophila, and P. falciparum, resulting from a scanning window analysis (see Materials and methods). Plots are structured as in A.
Figure 5 with 2 supplements
mRNA stem-loop pauses P. falciparum ribosome without mRNA degradation.
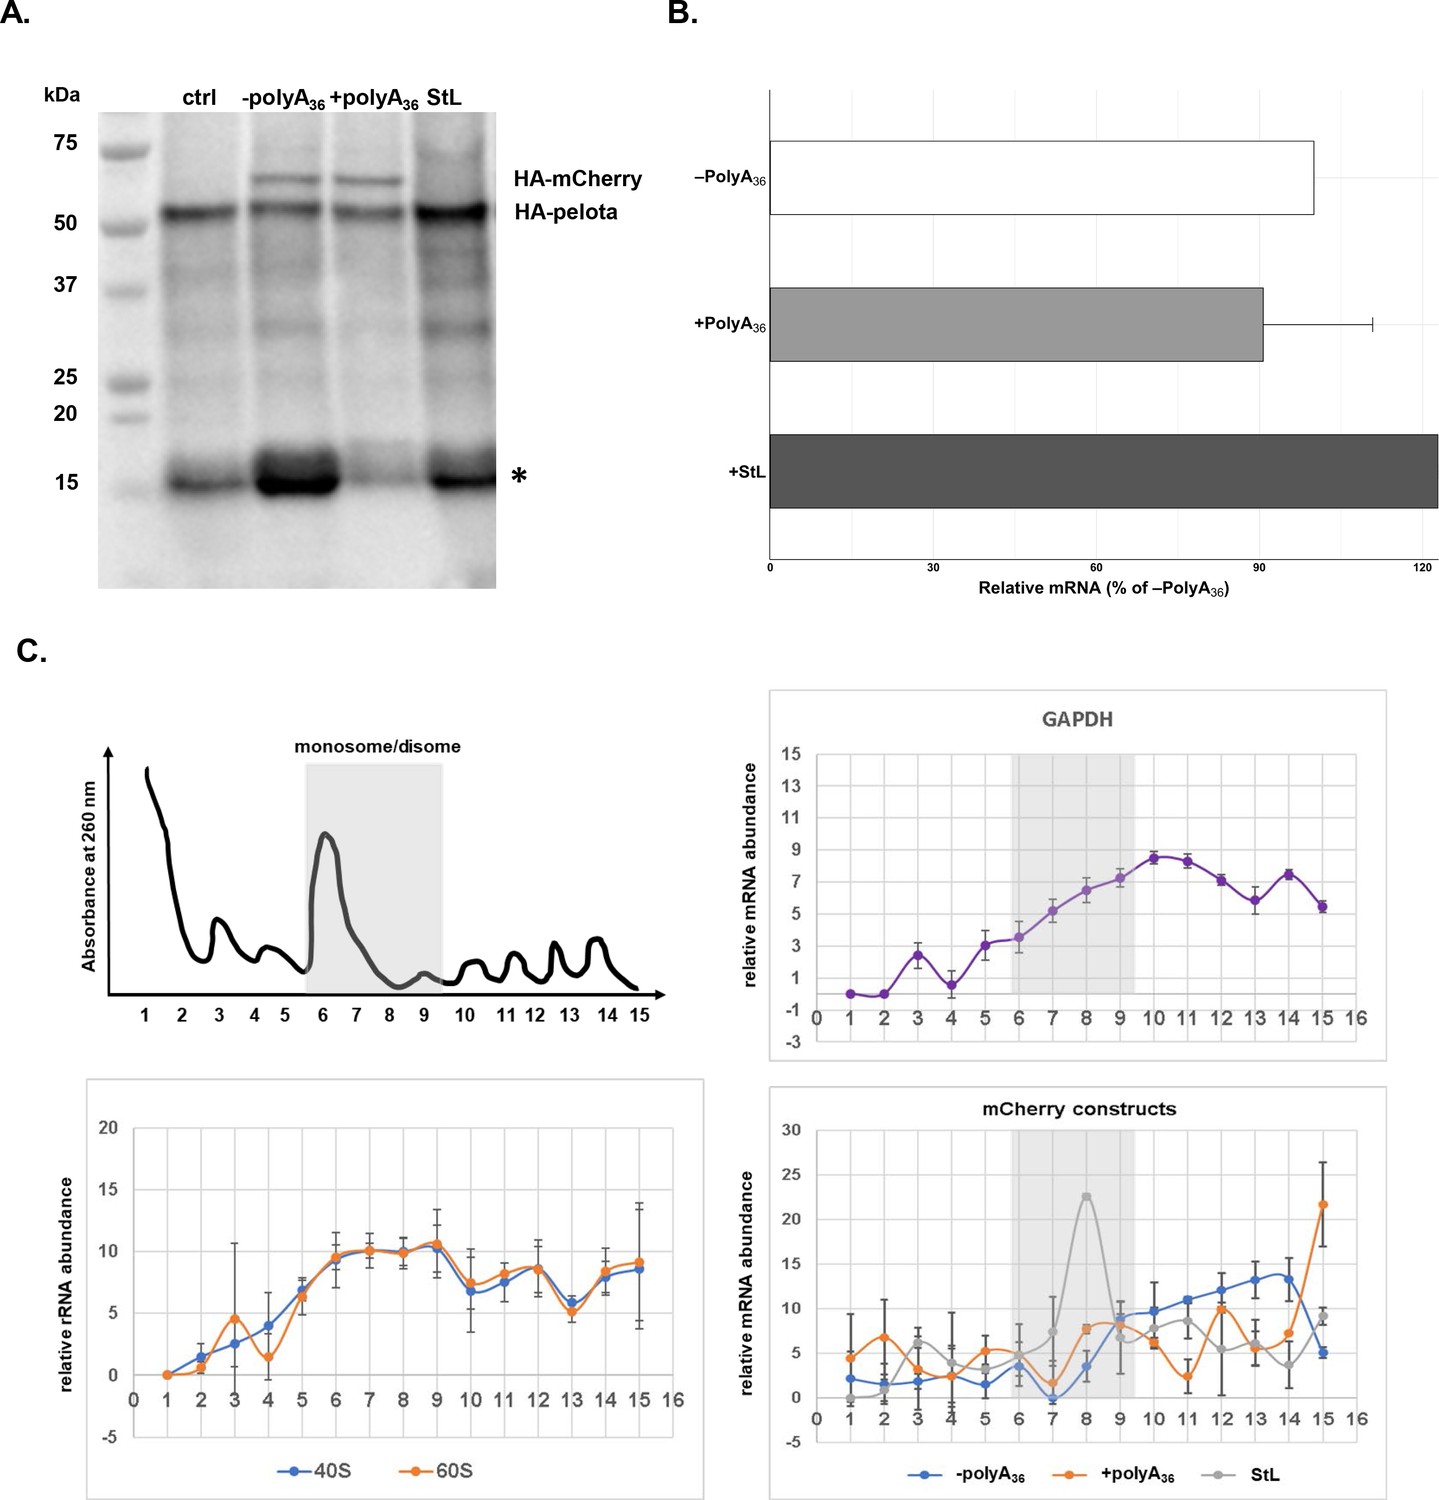
(A) The western blot of –polyA36, +polyA36, and stem-loop (StL) tagged reporter gene. The blot was probed with anti-HA antibody HRP labeled (sc-7392HRP). The HA-tagged proteins were episomally expressed in HA-tagged pelota P. falciparum Dd2 strain. HA-tagged Pelota protein serves as normalization control. (*) denotes human hemoglobin as 15kD contaminant band appearing and causing cross-reactivity in western blot analyses. (B) qRT-PCR measured mRNA levels of of reporter constructs with polyA tract and stem-loop insertions (polyA36, +polyA36, Stl). In each case, data represent the mean value of three biological replicates with standard deviation. (C) Distributions of mRNA (GAPDH, -polyA36, +polyA36, Stl) and rRNA, in polysome gradients as determined by RT-qPCR. Error bars represent measurement variability as determined by two qPCR replicates. The position of monosome and disome peaks is indicated in each analyzed sample (gray shade).
-
Figure 5—source data 1
Polysome profile analyses data.
- https://cdn.elifesciences.org/articles/57799/elife-57799-fig5-data1-v2.xlsx
Figure 5—figure supplement 1
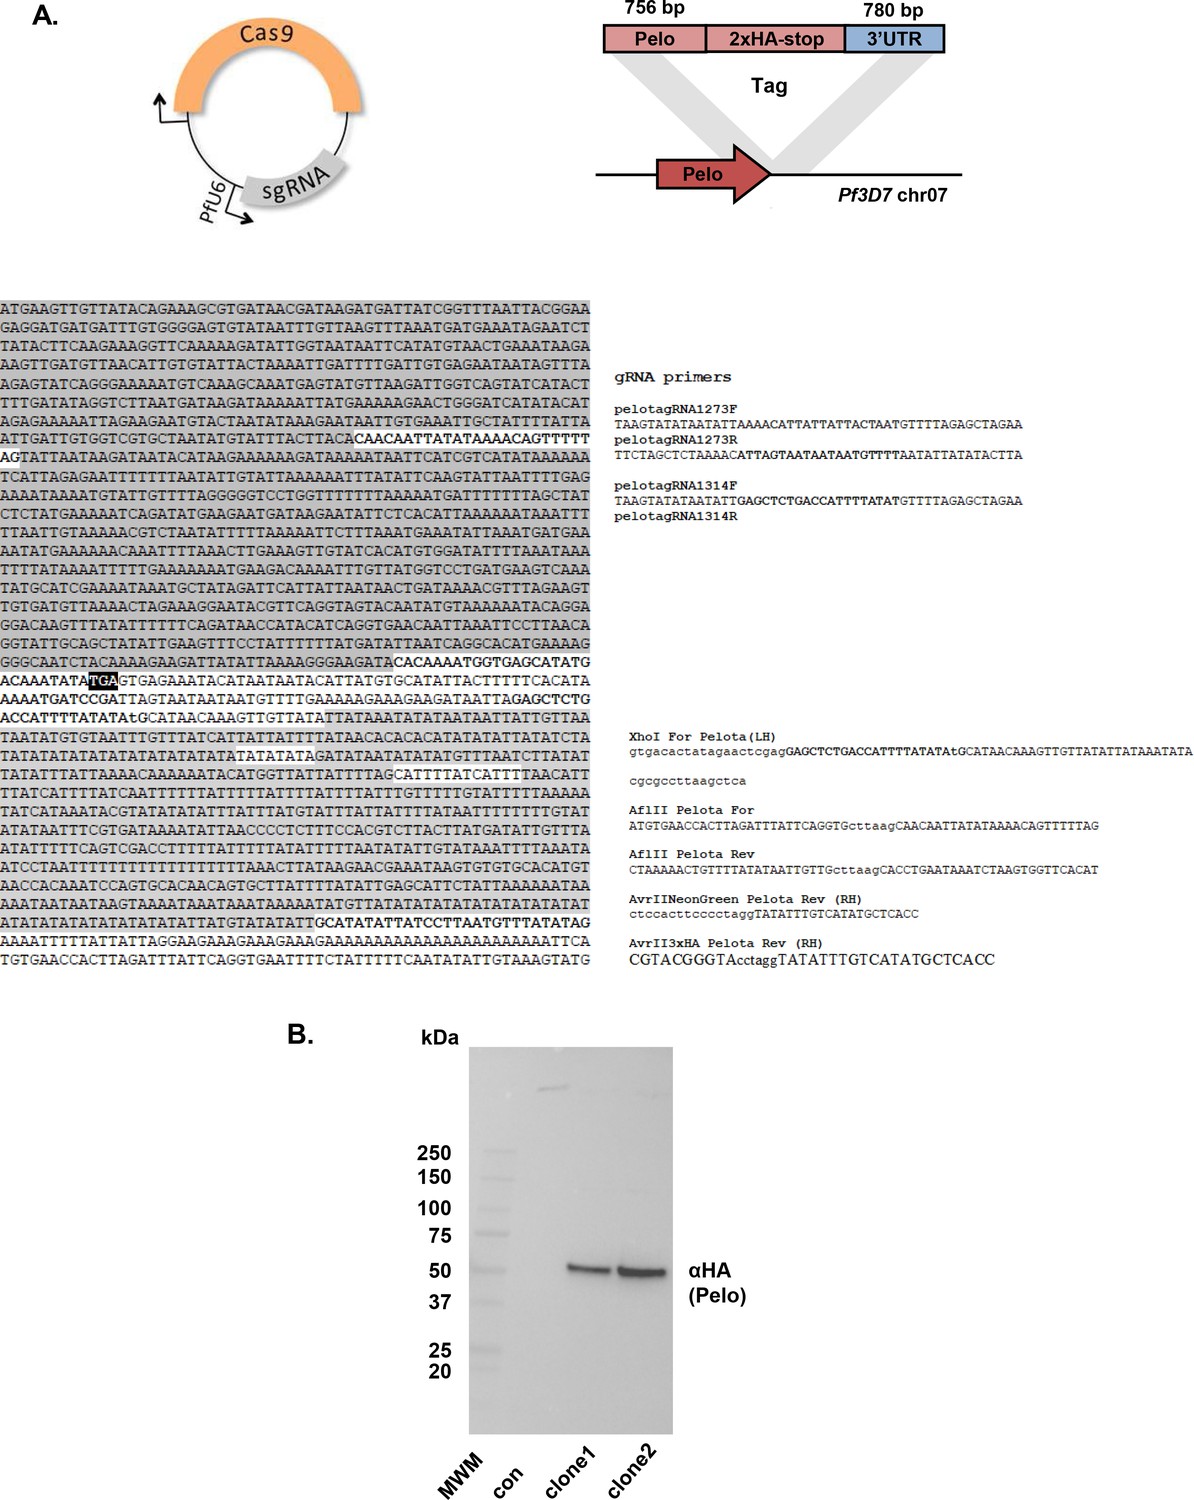
CRISPR/Cas9 HA-tagging of P. falciparum Pelo gene.
(A) Schematic of CRISPR/Cas9 engineering of P. falciparum Pelo (PF3D7_0722100 gene; human Pelo homolog). Two sets of gRNAs creating clone 1 and clone 2(red) were used to create independent clones 1 and 2. Recombined sections of PfPelo gene are indicated in purple and gray, respectively. Primers used for creation of recombinant DNA and target sequences of gRNAs are indicated in teal, yellow and red, respectively. (B) Western blot analysis of endogenous HA-tagged PfPelo protein from two Cas9 engineered clonal lines (Clone one and Clone 2) of P. falciparum Dd2 cells. Control (con) represents non-engineered P. falciparum Dd2 parent line. Biorad Precision Plus Protein molecular weight markers (MWM) are indicated.
Figure 5—figure supplement 2
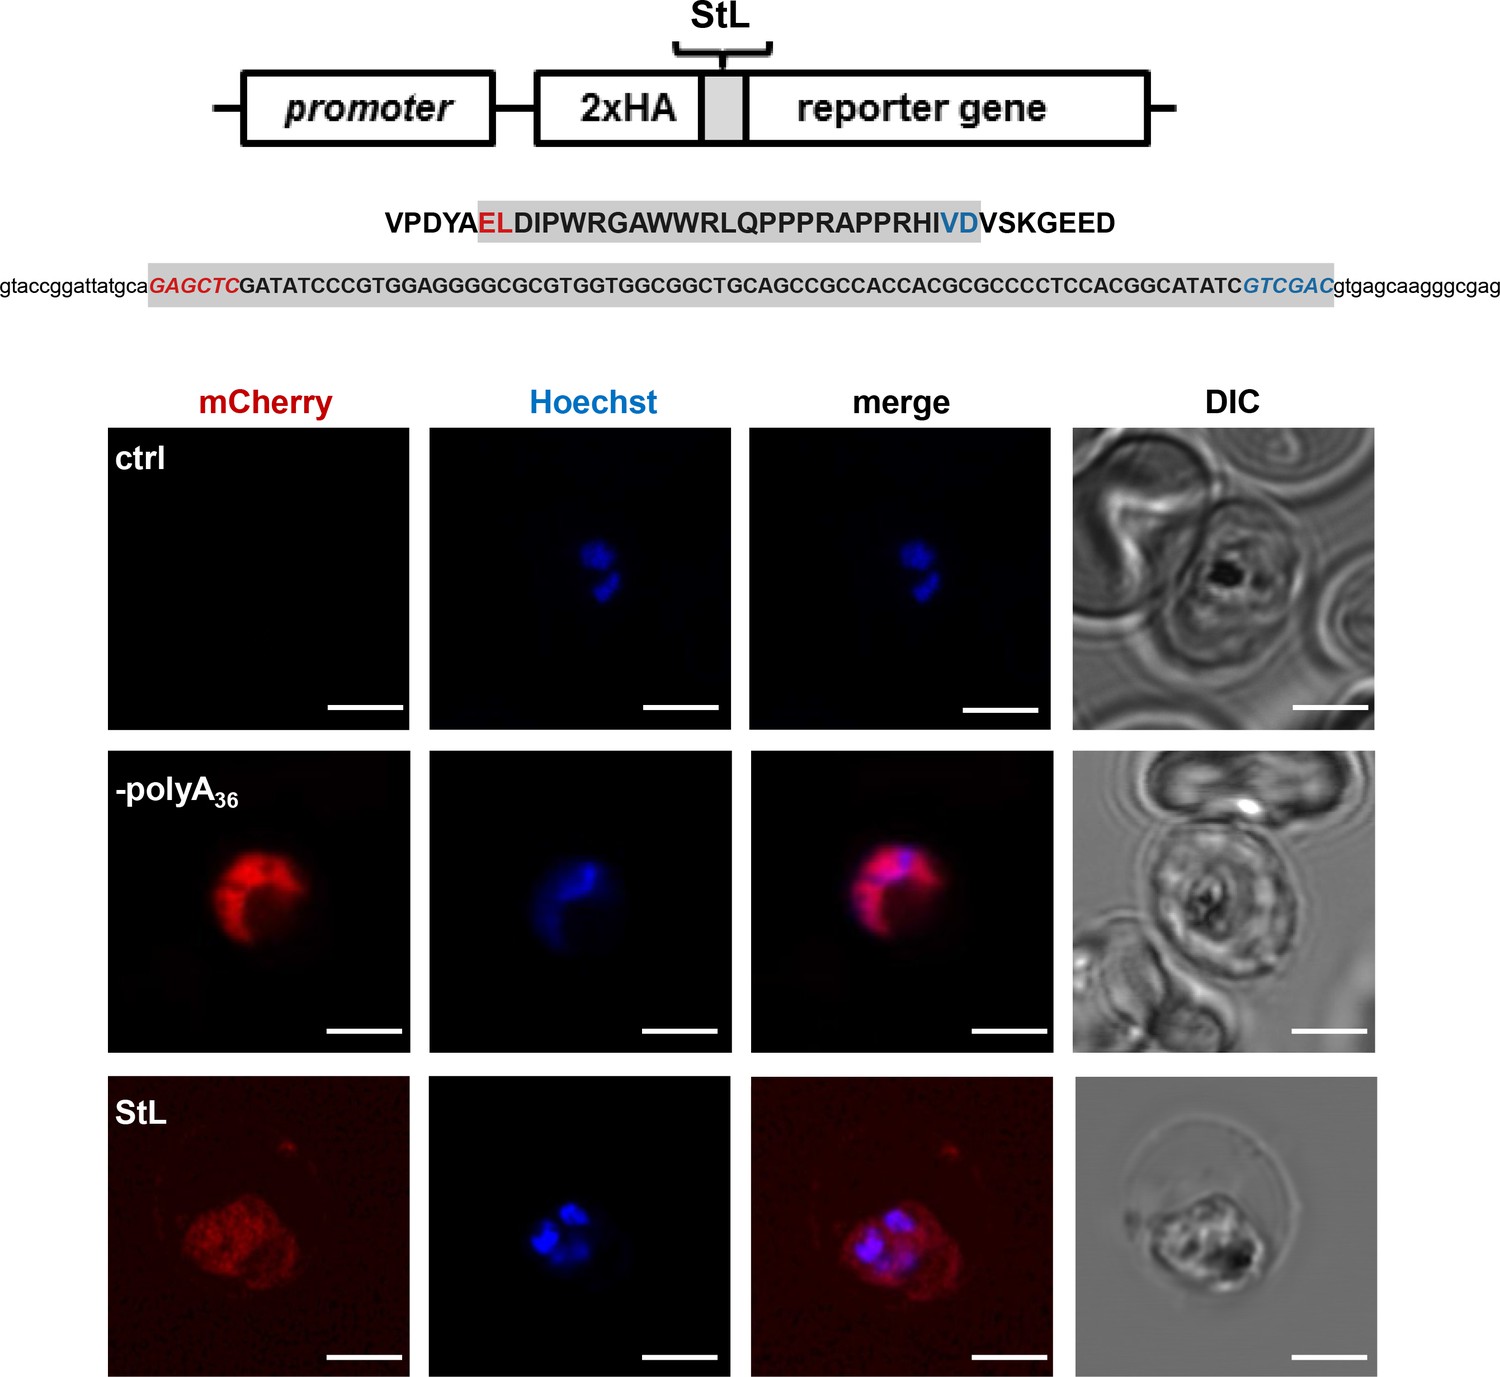
Schematic of stem-loop reporter construct (StL) used for expression in P. falciparum.
Sequence of the inserted stem-loop is indicated. Below – live fluorescence microscopy of P. falciparum Dd2 parent (non-transfected) line as well as cells transfected with wild type (ctrl) or –polyA36 StL reporter constructs, 2.5 µm scale bar is shown.
Figure 6 with 1 supplement

Isoluecine starvation in Plasmodium cells induces HSP70 and Pelo genes.
(A) The schematic presentation of the starvation experiment design. The cells were incubated for 48 hr in medium with and without Ile (+ / - Ile). After 48 hr samples were collected and protein and total RNA was isolated. (B) Relative mRNA of P. falciparum GAPDH (PF3D7_1462800), HSP70 (PF3D7_0818900), Pelo (PF3D7_0722100) transcripts after 48 hr isoleucine (Ile) starvation of the P. falciparum cells. Levels of each transcript are normalized to total GAPDH levels and represented as a ratio of transcript levels under Ile starvation (-Ile) over the control conditions (+Ile). In each case, data represent the mean value of three biological replicates with standard deviation. (C) Levels of P. falciparum HSP70 and Pelo proteins after 48 hr of Ile starvation. Western blot analysis of Ile starved (-Ile), and control (+Ile) sample are normalized to PfHAD1 (PF3D7_1033400) levels. HA-tagged P. falciparum Pelo protein was CRISPR/Cas9 engineered and detected using mouse HA-antibody. The molecular weight of each protein is indicated. (D) qRT-PCR measured mRNA levels of genes containing 3–7 Ile. PF3D7_0322300, PF3D7_0512700, PF3D7_0110600, PF3D7_0903400, PF3D7_1450600, PF3D7_1364700, PF3D7_1121000, PF3D7_1341600, PF3D7_1321400, PF3D7_1138600. Levels of each transcript are normalized to total GAPDH level and represented as a ratio of transcript levels under Ile starvation (-Ile) over the control conditions (+Ile). In each case, data represent the mean value of three biological replicates with standard deviation.
-
Figure 6—source data 1
qRT-PCR data for Ile-rich transcripts.
- https://cdn.elifesciences.org/articles/57799/elife-57799-fig6-data1-v2.xlsx
Figure 6—figure supplement 1
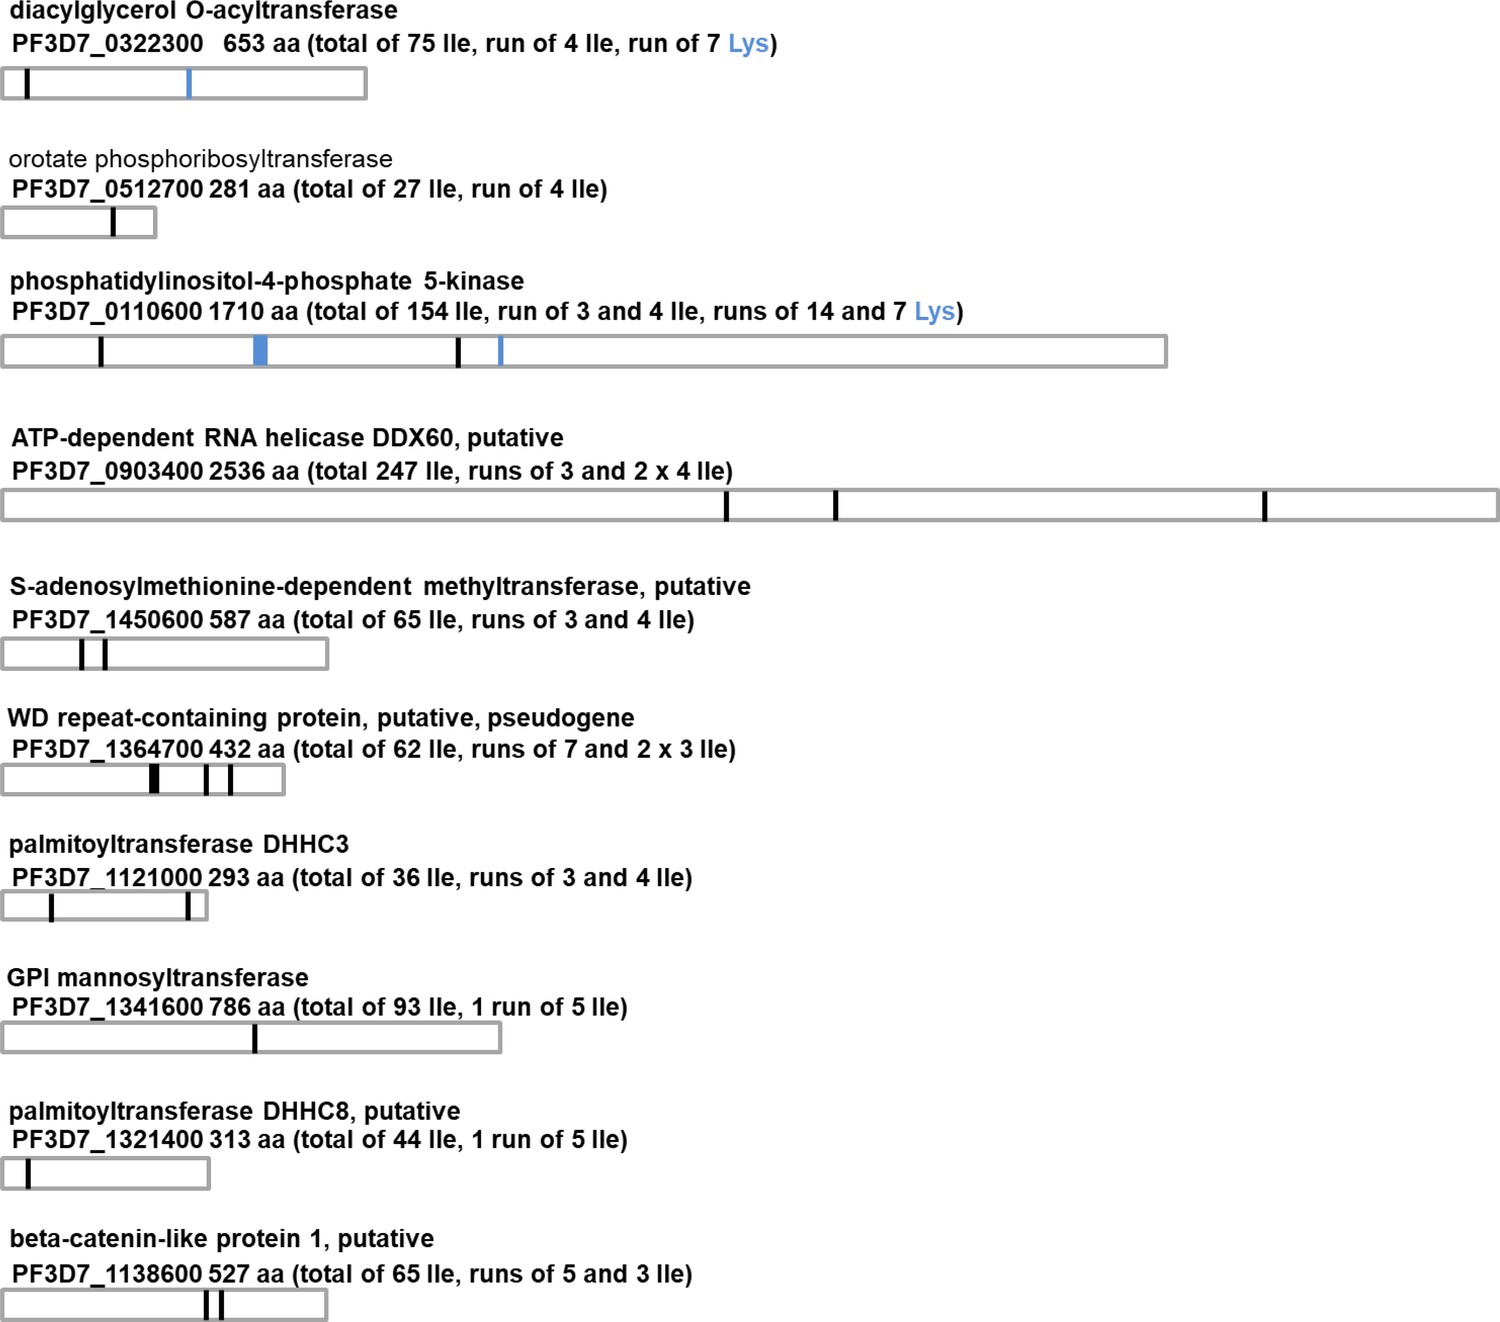
Schematics of nine P. falciparum genes with runs of 3 and more consecutive isoleucine (Ile) residues used in analyses shown in Figure 6D.
Positions of Ile and lysine (Lys) runs are illustrated for each gene. Total number of Ile residues, as well as number of Ile in each run are indicated next to P. falciparum genes.
Figure 7 with 3 supplements
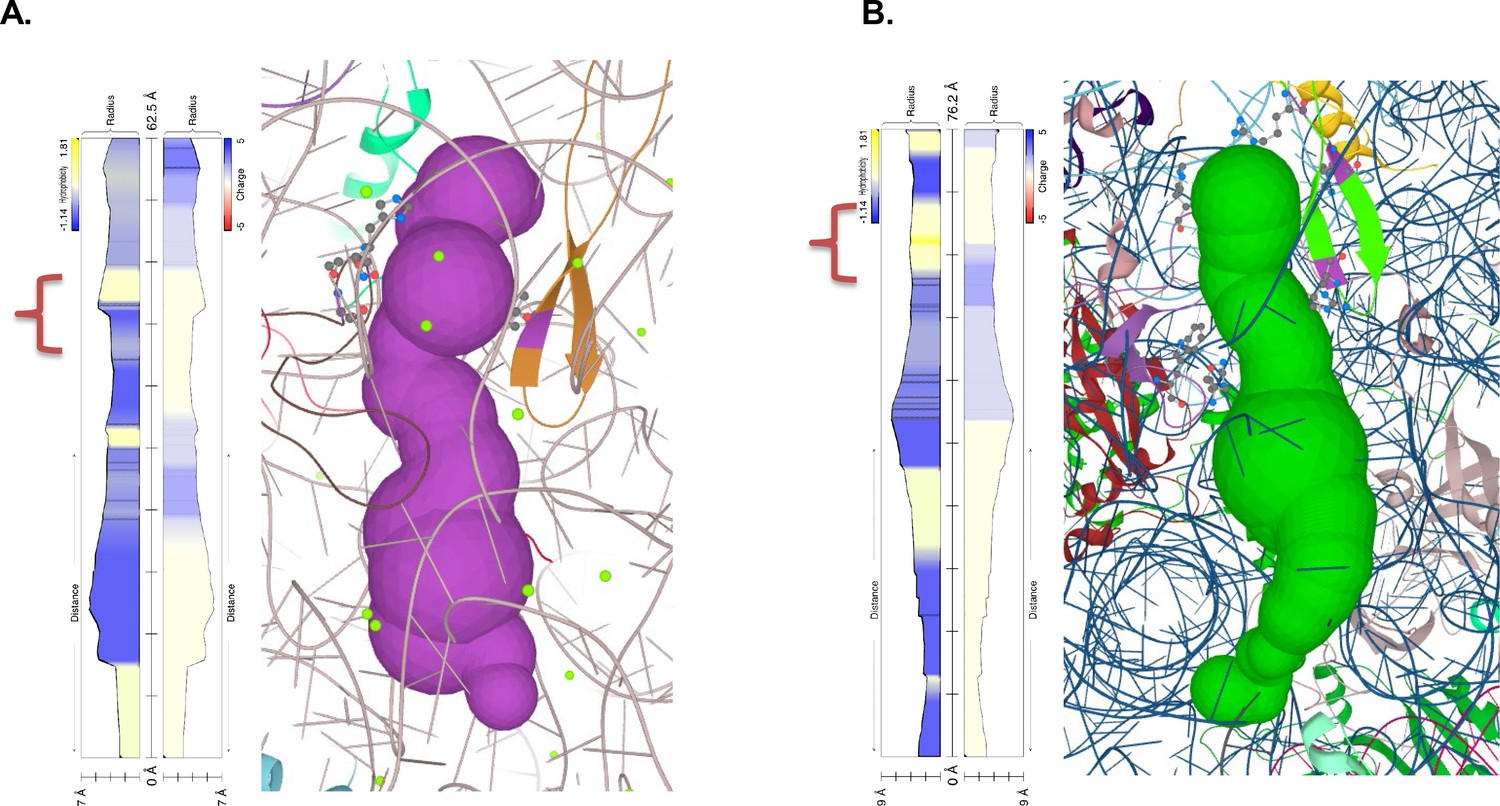
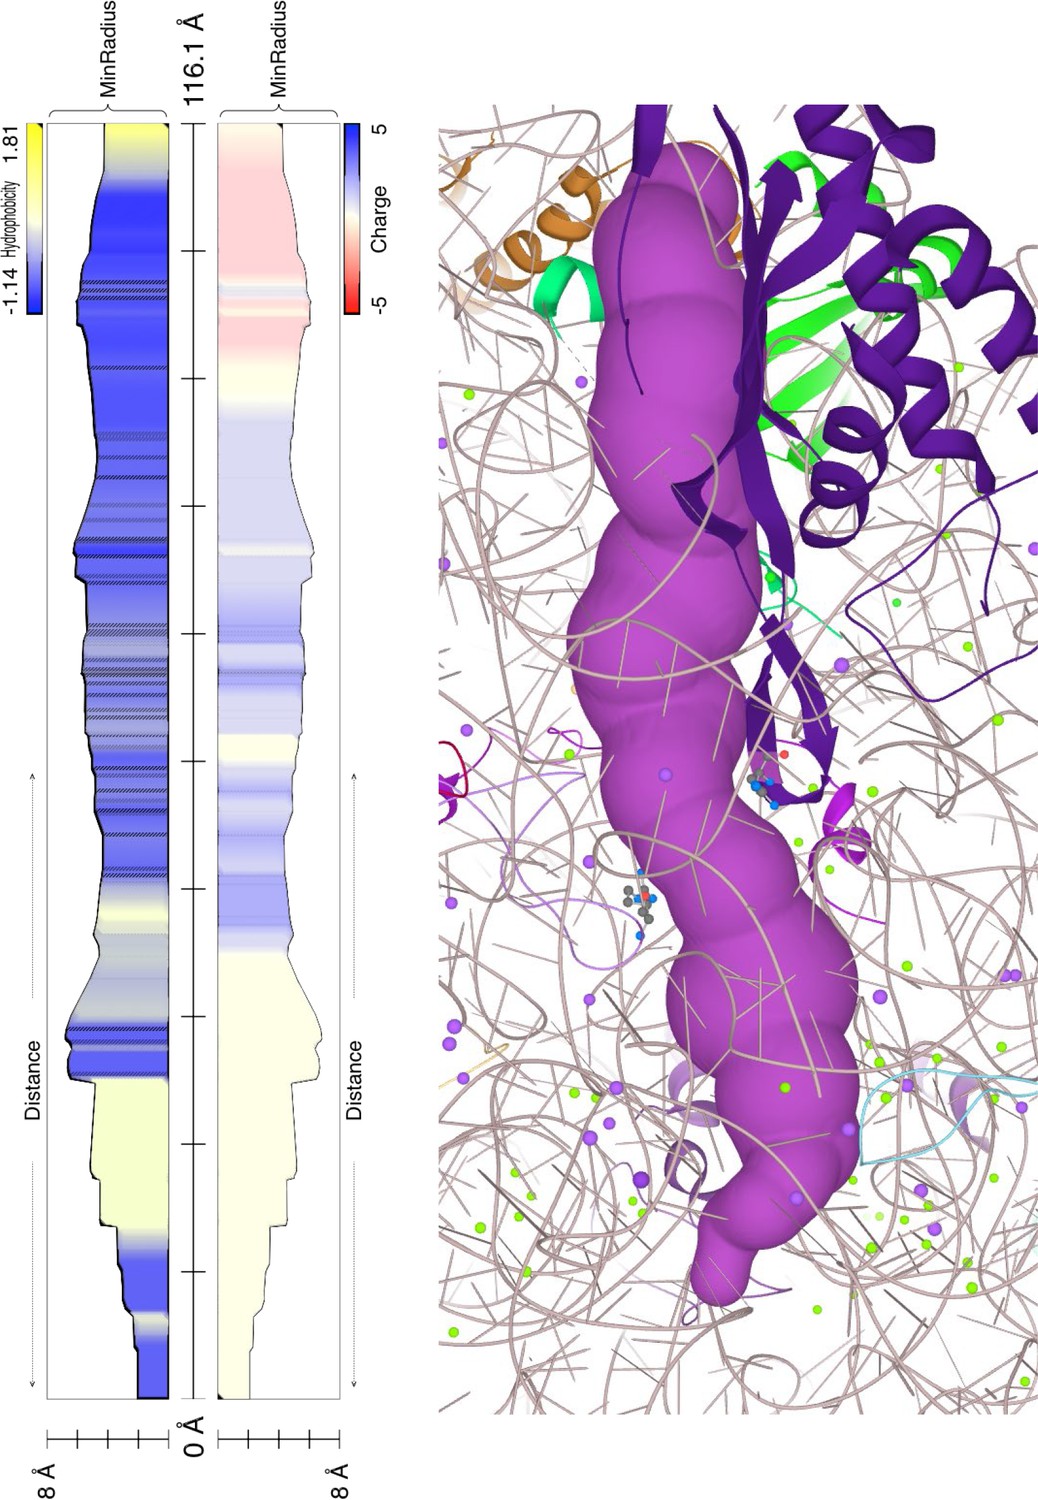
Polypeptide exit tunnel as predicted by MOLE service from Plasmodium ribosome (PDB:3j79) (A) and human ribosome (PDB: 6d90) (B).
The constriction site flanked by L22 and L4 is marked in the orange clamp, and lining residues in both cases are marked with ball-and-stick visualization. Vertical plot outline hydrophobicity (left) and charge (right) profiles across the tunnel (Pravda et al., 2018). The width of the tunnel is indicated on the scale at the bottom of the plot. The total lengths of the tunnel are indicated at the top of the plots.
Figure 7—figure supplement 1

Structure of P. falciparum (PDB code: 3JBO) and H. sapiens (PDB code: 3JAG) ribosomes with receptor for activated kinase C (RACK1) in magenta, previously shown to be absent from Plasmodium ribosomes (60S in green, 40S in cyan).
Lower: Model of P. falciparum ribosome displaying small subunit ribosomal RNA sequence extensions (28S and 5S rRNAs in gray, 18S rRNA in cyan, tRNAs in yellow and orange, mRNA in red, extended sequences ES7S and ES9S in magenta). The ES7S and ES9S regions distinguish P. falciparum from other organisms. ES7S is located next to the binding pocket for ribosome GTPases and is adjacent to ribosome GTPase center.
Figure 7—figure supplement 2
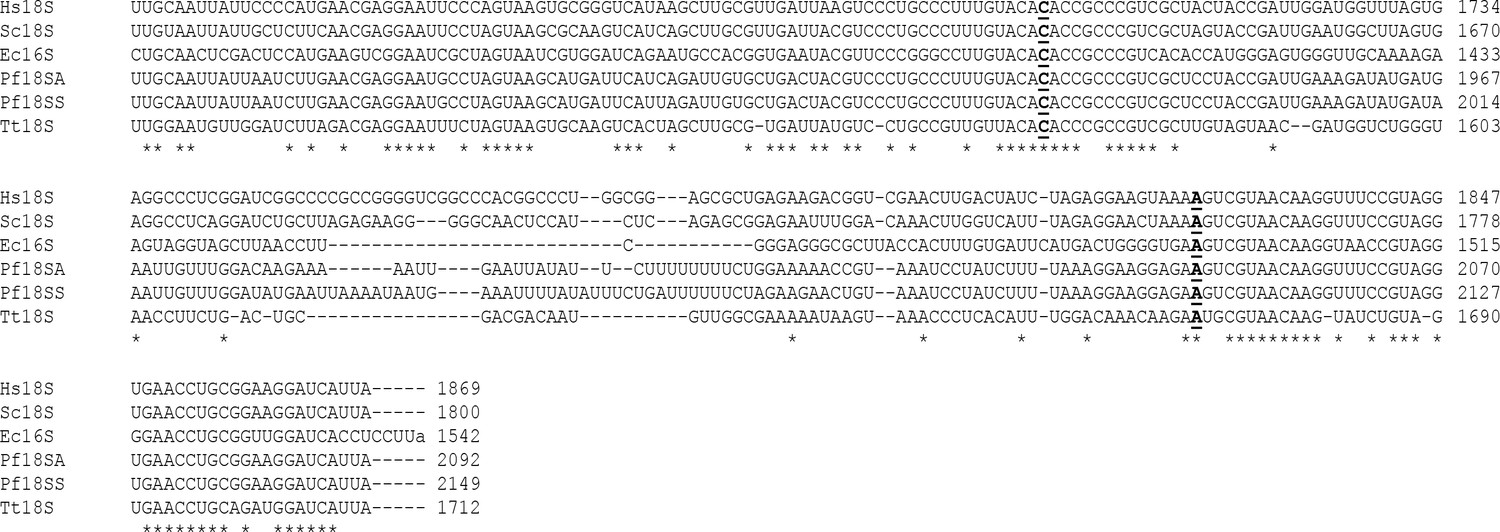
Segment of sequence alignment of 18S rRNA from P. falciparum (Pf18SA and Pf18SS, A- and S-type of ribosomes), H. sapiens (Hs18S), S. cerevisiae (Sc18S), T. thermophila (Tt18S) andE. coli16S (Ec16S).
(*) indicate invariant positions in alignment. Nucleotides A1756 and C1634 involved in π-stacking with polyA sequences are underlined and represented by bold letters.
Figure 7—figure supplement 3
Polypeptide exit channel from Haloarcula marismortui ribosome (PDB: 1jj2) has one long fragment of relatively hydrophobic lining of the tunnel at the entrance (between PTC and constriction site).
Lining residues in both cases are marked with ball-and-stick visualization. Vertical plot outline hydrophobicity (left) and charge (right) profiles across the tunnel. The width of the tunnel is indicated on the scale at the bottom of the plot. The total lengths of the tunnel are indicated at the top of the plots.
Tables
Key resources table
| Reagent type (species) or resource | Designation | Source or reference | Identifiers | Additional information |
|---|---|---|---|---|
| Gene (Plasmodium falciparum) | Pelota gene | This paper | PF3D7_0722100 | CRISPR/Cas9 engineered with C-terminal 3xHA tag |
| Cell line (Plasmodium falciparum) | Dd2 strain | Goldberg lab | http://neurolex.com/wiki/NCBITaxon:57267 | P. falciparum strain used for all experiments |
| Cell line (Homo sapiens) | Dermal fibroblast (normal, Adult) | ATCC | PCS-201–012 | |
| Cell line (Homo sapiens) | Adult erythrocytes (primary cell line) | Goldberg lab and BJCIH Children Hospital | Deidentified human blood. 50% haematocrit, washed in complete medium (MCM) | |
| Cell line (Tetrahymena thermophila) | strain B2086 (II) | Chalker Lab | http://neurolex.com/wiki/NCBITaxon:5911 | |
| Recombinant DNA reagent | pBSICY-gtw (plasmid) | Chalker Lab | • PMCID:PMC3232721 • T. thermophila transfection plasmid | |
| Recombinant DNA reagent | pc-DNA-DEST40 (plasmid) | Thermo Fisher Scientific | RRID:Addgene_45597 | HDF transfection plasmid |
| Recombinant DNA reagent | pHHT-TK (plasmid) | Goldberg Lab | Plasmid for standard CRISPR/Cas9 knock out approach in P. falciparum cells. | |
| Recombinant DNA reagent | pyDHOD-2A-Cas9 (plasmid) | Goldberg lab | All-in-one Cas9+gRNA cassette vector DSM-1 resistance | |
| Antibody | anti-HA antibody (mouse monoclonal antibody) | Santa Cruz Biotechnology | Cat# sc-7392, RRID:AB_627809 | WB (1:5000), used also as HRP conjugated |
| Antibody | anti-mouse (horse unknown clonality) | Cell Signalling Technology | Cat# 7076, RRID:AB_330924) | WB (1:5000) |
| Antibody | anti-rabbit (goat polyclonal antibody) | Cell Signalling Technology | Cat# 7074, RRID:AB_2099233 | WB (1:5000) |
| Antibody | Anti-HSP70 (rabbit polyclonal antibody) | AgriSera | Cat# AS08 371, RRID:AB_2248616 | WB (1:1000) |
| Antibody | anti-PfHAD1 rabbit | Odom lab | WB (1:10000) PMID:25058848 | |
| Chemical compound, drug | Cycloheximide | Sigma Aldrich | Cat# C1988 | 200 uM |
| Chemical compound, drug | WR99210 | Sigma Aldrich | Cat# W1770 | 10 nM |
| Chemical compound, drug | DSM1 | Sigma Aldrich | Cat#533304 | DHODH Inhibitor 1.5 uM |
| Commercial assay or kit | llustra triplePrep Kit | GE Healthcare | Cat# 28942544 | DNA, RNA and protein isolation kit |
Additional files
-
Supplementary file 1
Table indicating highly significant gene ontology terms (GO) from biological process category for polyA tract carrying genes in Plasmodium falciparum.
Background counts (Bgd count) represent all genes in defined GO group, result count are all genes with polyA tract found in identified GO group, percent of background (Pct of bgd) represents percent of polyA track genes in GO group. Fold enrichment is calculated over all polyA track genes as well as odd ratio. P-value as well as Benjamini and Bonferroni test values indicate statistical significance of GO analyses.
- https://cdn.elifesciences.org/articles/57799/elife-57799-supp1-v2.rtf
-
Supplementary file 2
Comparison of factors associated with human NGD/NSD and RQC pathways and bioinformatics in Plasmodium spp-associated PlasmoDB database.
P. falciparum genes related to human counterparts are given in brackets.
- https://cdn.elifesciences.org/articles/57799/elife-57799-supp2-v2.rtf
-
Transparent reporting form
- https://cdn.elifesciences.org/articles/57799/elife-57799-transrepform-v2.pdf
Download links
A two-part list of links to download the article, or parts of the article, in various formats.
Downloads (link to download the article as PDF)
Open citations (links to open the citations from this article in various online reference manager services)
Cite this article (links to download the citations from this article in formats compatible with various reference manager tools)
Plasmodium falciparum translational machinery condones polyadenosine repeats
eLife 9:e57799.
https://doi.org/10.7554/eLife.57799


