Self-organized patterning of cell morphology via mechanosensitive feedback
- Max Planck Institute for Molecular Cell Biology and Genetics, Germany
- Cluster of Excellence Physics of Life, Technische Universität Dresden, Germany
- Mildred Scheel Nachwuchszentrum (MSNZ) P2, Medical Faculty, Technische Universität Dresden, Germany
- Institute of Physics, École Polytechnique Fédérale de Lausanne, Switzerland
- Max Planck Institute for the Physics of Complex Systems, Germany
- Center for Systems Biology Dresden, Germany
Figures
Figure 1 with 3 supplements
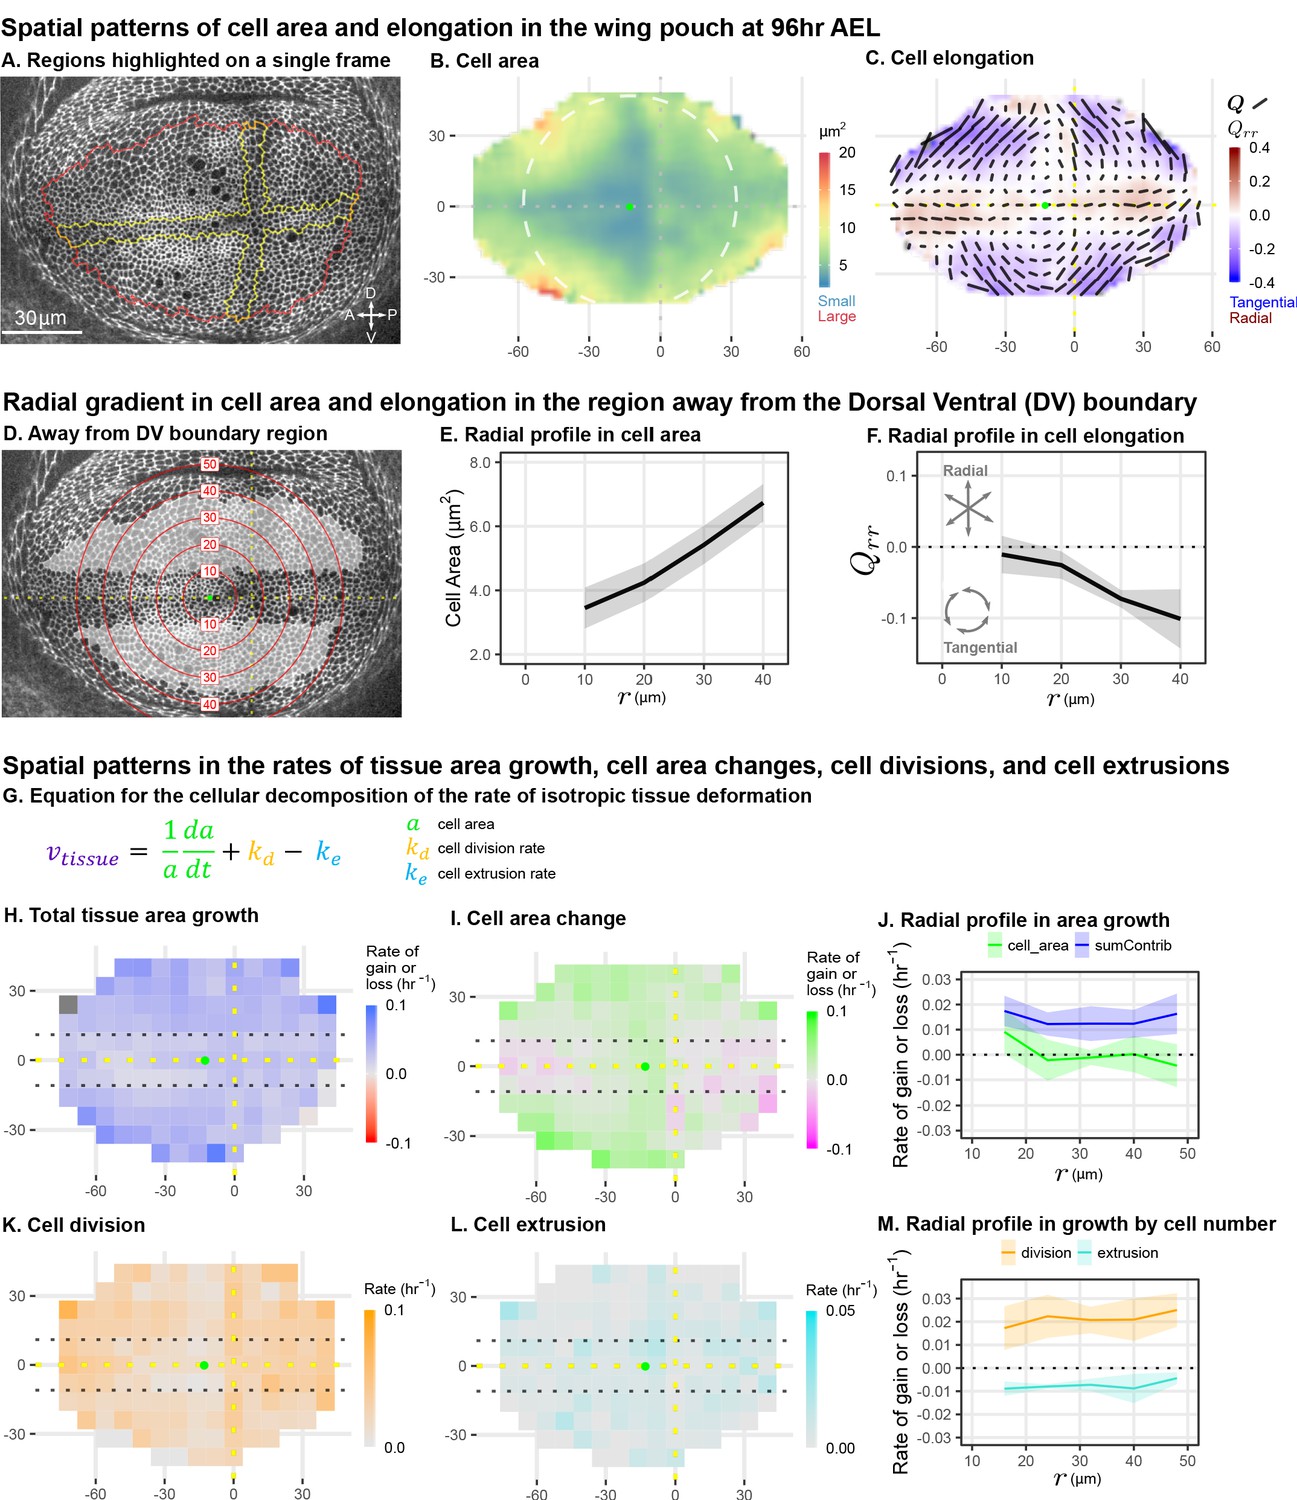
Cell morphology patterns can persist and strengthen in the absence of differential growth.
(A) Ecadherin-GFP-expressing wing disc growing in ex vivo culture (explanted at AEL). We analyze apical cell morphology in the proliferating disc proper layer in a 2D projection, after correcting for local tissue curvature (see Materials and methods and Figure 1—figure supplement 1A). Red outline indicates the presumptive 'blade' region; yellow outline indicates cells of the compartment boundaries, which are used to align different movies. Dorsal is up, and anterior is left. (B–C) Spatial maps of cell area (B) or cell elongation (C) were generated by averaging across the middle timepoints of five movies. Axis labels indicate the distance in from the AP boundary (along X) or DV boundary (along Y). Dotted lines indicate the compartment boundaries. The calculated center of symmetry is represented by a green dot. In (B), the white dashed circle is added to highlight the near-circular symmetry. In (C), the bars represent the cell elongation tensor , where the length of the bar is proportional to the magnitude and the angle indicates its orientation. In addition, the radial component of cell elongation is presented in color. More information about this cell elongation pattern and how we define the center point is included in Figure 1—figure supplement 1. (D) The blade cells that are tangentially elongated and lying well outside the DV boundary region are shaded in gray on a single image of the timelapse. Red circles indicate the radial binning used in (E–F), where the numbers indicate the radius (in ). The region around the DV boundary was separately analyzed in Figure 1—figure supplement 2. For the region depicted in (D), the radial gradient in average cell area (E) and radial cell elongation (F) were calculated. Solid lines indicate the average over all five movies in the middle time window. The shaded region indicates the standard deviation. Data showing how these radial gradients change over time during imaging are shown in Figure 1—figure supplement 3. Source data for (B–F) are available on Dryad. (G) Decomposition of isotropic tissue deformation into cellular contributions. (H–I, K–L) Maps of the total tissue area growth (H) and its contributions from cell area change (I), cell divisions (K), and cell extrusions (L) do not show pronounced spatial patterns. (J, M) The radial profile of tissue growth and its cellular contributions, analyzed in radial bins. sumContrib in blue is the sum of all contributions, corresponding to total tissue deformation. Source data files for isotropic tissue deformation are provided as Figure 1—source data 1, 2.
-
Figure 1—source data 1
Isotropic contributions to tissue deformation calculated in a grid.
- https://cdn.elifesciences.org/articles/57964/elife-57964-fig1-data1-v3.zip
-
Figure 1—source data 2
Isotropic contributions to tissue deformation calculated radially.
- https://cdn.elifesciences.org/articles/57964/elife-57964-fig1-data2-v3.zip
Figure 1—figure supplement 1

Quantification of the radial elongation pattern.
(A) Cell area and elongation were adjusted to account for the distortion associated with projecting a curved surface in 2D. Left shows a 2D projected image from the timelapse movie of an Ecadherin-GFP-expressing wing explant overlaid with contours representing the depth of the apical surface in the acquired Z-stack. Numbers indicate distance (in ) from the most apical plane in the Z-stack. The right diagrams depict how we adjust the size and shape of the triange due to local tissue tilt. We determine the local tangential plane of the tissue surface at the triangle center. We then calculate the transformation matrix relating the shape tensor (in the tangential plane) and the observed shape tensor s (in the projected plane). (B) Cell elongation pattern presented in Figure 1, shown here without the color code. Cell elongation was averaged across all five movies in the middle time window within a grid centered on the AP and DV axes. The cell elongation nematic tensor is represented by bars, whose length is proportional to the magnitude and whose angle indicates the orientation. The green circle is added to show the almost circular symmetry of the pattern, and the green dot is the calculated center of symmetry of the cell elongation pattern. (C–D) The cell elongation pattern shown in A, colored by the XX (B) or XY (C) component. (E–F) Calculating the center of symmetry of the cell elongation pattern. At each point along the x axis (DV boundary), we calculate the area-weighted sum of in the four quadrants. The center point lies at the function minimum, which lies just anterior to the AP boundary (APB). (G) Illustrations of the orientation of cell elongation for positive and negative values of and . (H–I) The cell elongation pattern shown in A, colored by the (H) or (I) component.
Figure 1—figure supplement 2

Cell elongation and dynamics around the DV boundary.
The cell area and elongation are reported for the cells near the DV boundary, the region that was excluded from the analysis in Figure 1. (A) The radially elongated blade cells within the DV boundary region are shaded in gray on a single image of the timelapse of Ecadherin-GFP expressing wing discs ( AEL). Red lines indicate bins along the x axis (aligned with the DV boundary) emanating from the center of elongation symmetry; the numbers indicate the distance to the center (in ). Average cell area (B) and the XX component of cell elongation (C) were calculated by averaging over all five movies in the middle time window within the bins along the DV boundary (highlighted in A). The solid line indicates the mean, and the shaded region indicates the standard deviation. (D) The profile of tissue growth or that contributed by changes in cell area, analyzed in the bins along the DV boundary that are highlighted in A. The blue line labeled 'sumContrib' is the sum of all cellular contributions, corresponding to the total tissue growth. (E) The profile along the DV boundary in the contribution of cell divisions or cell extrusions to overall tissue deformation, analyzed in the bins shown in A.
Figure 1—figure supplement 3

Change in cell area and elongation during timelapse.
Analysis of cell area and elongation for the region of cells inside (A-B) or outside (C-D) the band around the DV boundary, analyzed over all times. This analysis complements the analysis of the middle time window shown in Figure 1. (A+C) Single timepoints from the timelapse of an Ecadherin-GFP-expressing wing disc growing in ex vivo culture (explanted at AEL), highlighting the cells that correspond to these two regions of interest. Red lines indicate the binning from the distance to the center, either along X (A) or radially (C). (B+D) Profiles in cell area (left) or cell elongation (right). For the band around the DV boundary, we present , whereas outside this band, we present . Data were averaged across five time windows for all five discs, at different distances away from the center of symmetry to show how the profile changes in time during the timelapse.
Figure 2
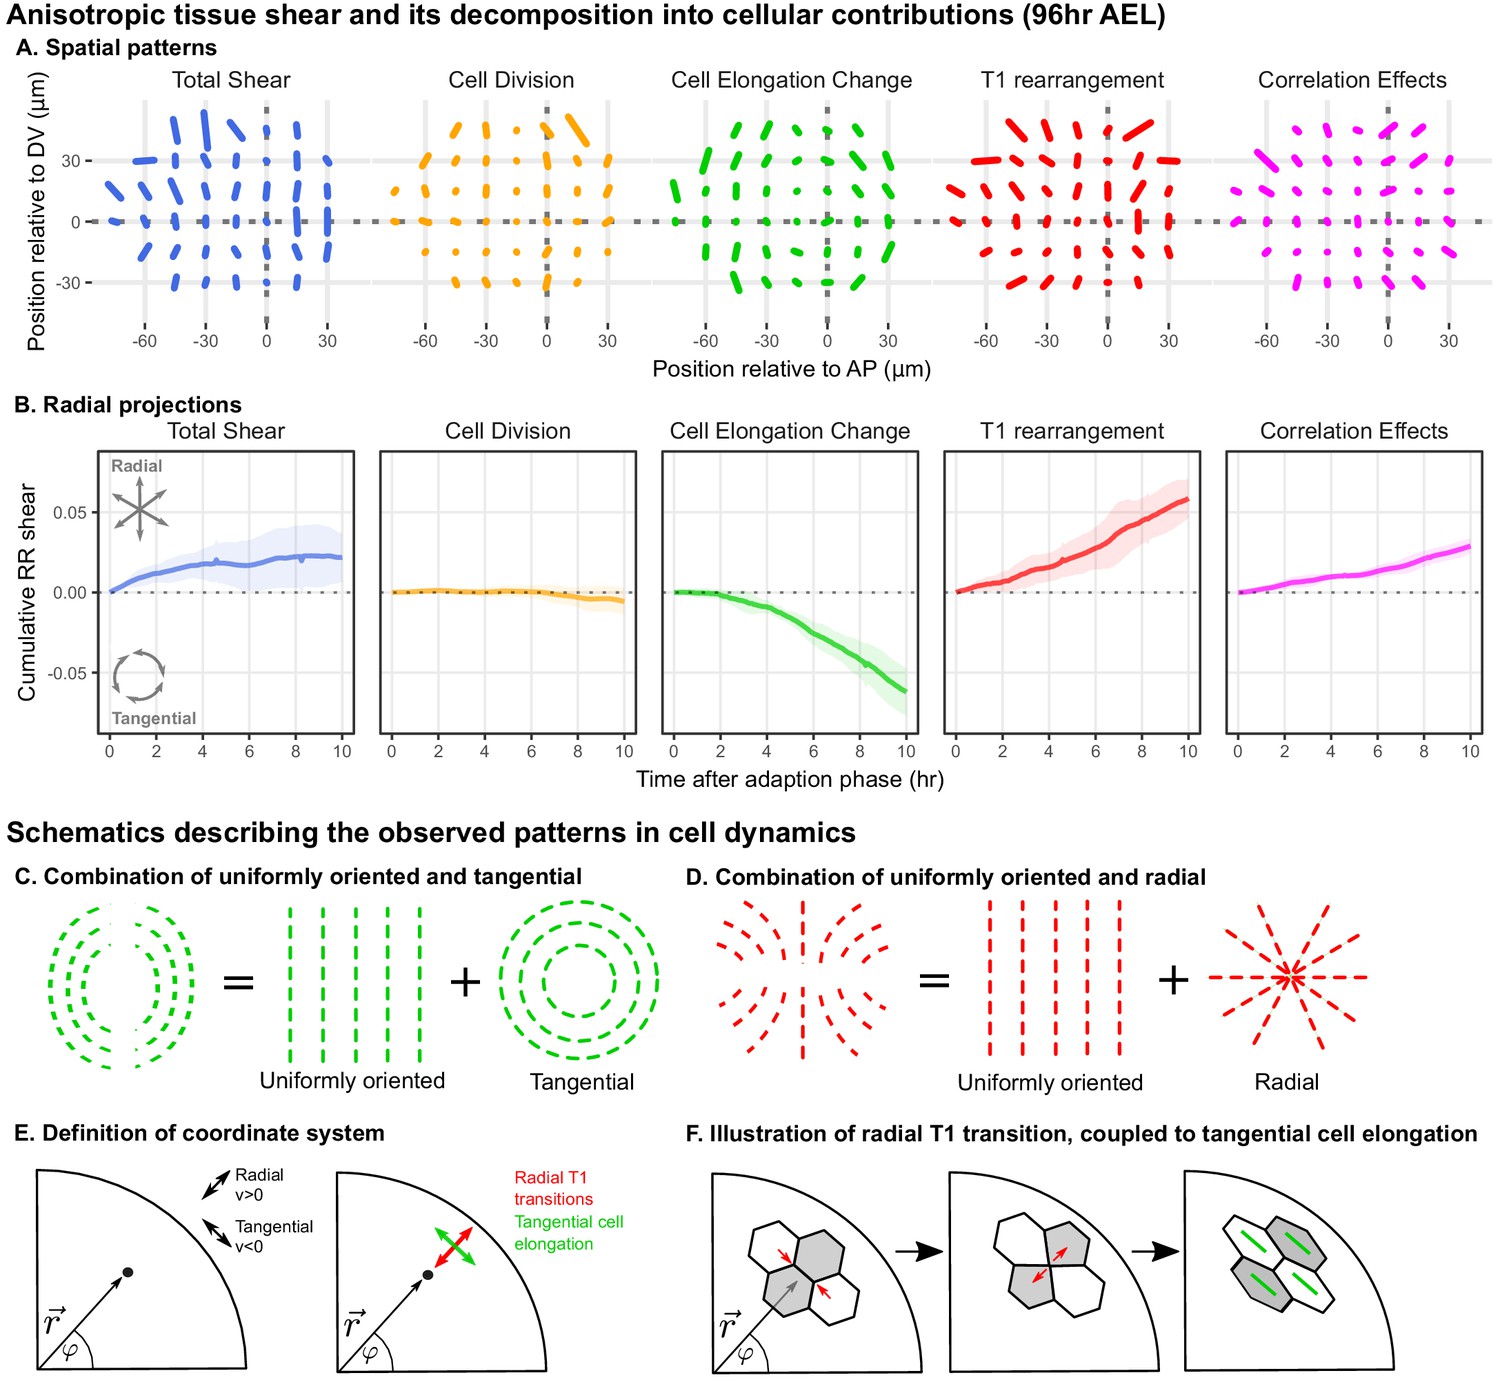
Radially oriented cell rearrangements balance tangential cell elongation.
(A) Cumulative tissue deformation and its cellular contributions, measured in a grid centered on the compartment boundaries (dotted gray lines) and averaged over all five movies. Bars represent nematic tensors, where the length is proportional to the magnitude of deformation and the angle indicates its orientation. The contribution from cell extrusion is small and thus not shown. Data used to present these plots are included in Figure 2—source data 1. (B) The radial projection of cumulative tissue deformation and its cellular contributions are plotted as a function of time after the first of adaption to culture (Dye et al., 2017). Solid lines indicate the average over all five movies; shading indicates the standard deviation. Data used to present these plots are included in Figure 2—source data 2. (C) Schematics indicating how a uniformly oriented pattern would combine with a tangential pattern to produce a pattern resembling that of the cell elongation change (left) or with a radial pattern to produce a pattern resembling that of the T1 transitions (right). (E–F) Illustrations demonstrating radially-oriented T1 transitions coupled to tangential cell elongation. For simplicity, we diagram only the posterior-dorsal quadrant, but the pattern is radially symmetric. In (E), we define the radial coordinate system, where velocity in the radial direction is positive and that in the tangential direction is negative. Patterns in A indicate that T1 transitions are biased to grow new bonds in the radial direction, and cell elongation is biased to increase tangentially. (F) In a radially oriented T1 transition, cells preferentially shrink tangentially oriented bonds and grow new bonds in the radial direction. When oriented in this direction, T1 transitions do not dissipate tangential elongation but increase it (green bars in each cell represent cell elongation).
-
Figure 2—source data 1
Anisotropic contributions to tissue deformation calculated in a grid.
- https://cdn.elifesciences.org/articles/57964/elife-57964-fig2-data1-v3.zip
-
Figure 2—source data 2
Cumulative radial shear plots over time.
- https://cdn.elifesciences.org/articles/57964/elife-57964-fig2-data2-v3.zip
Figure 3
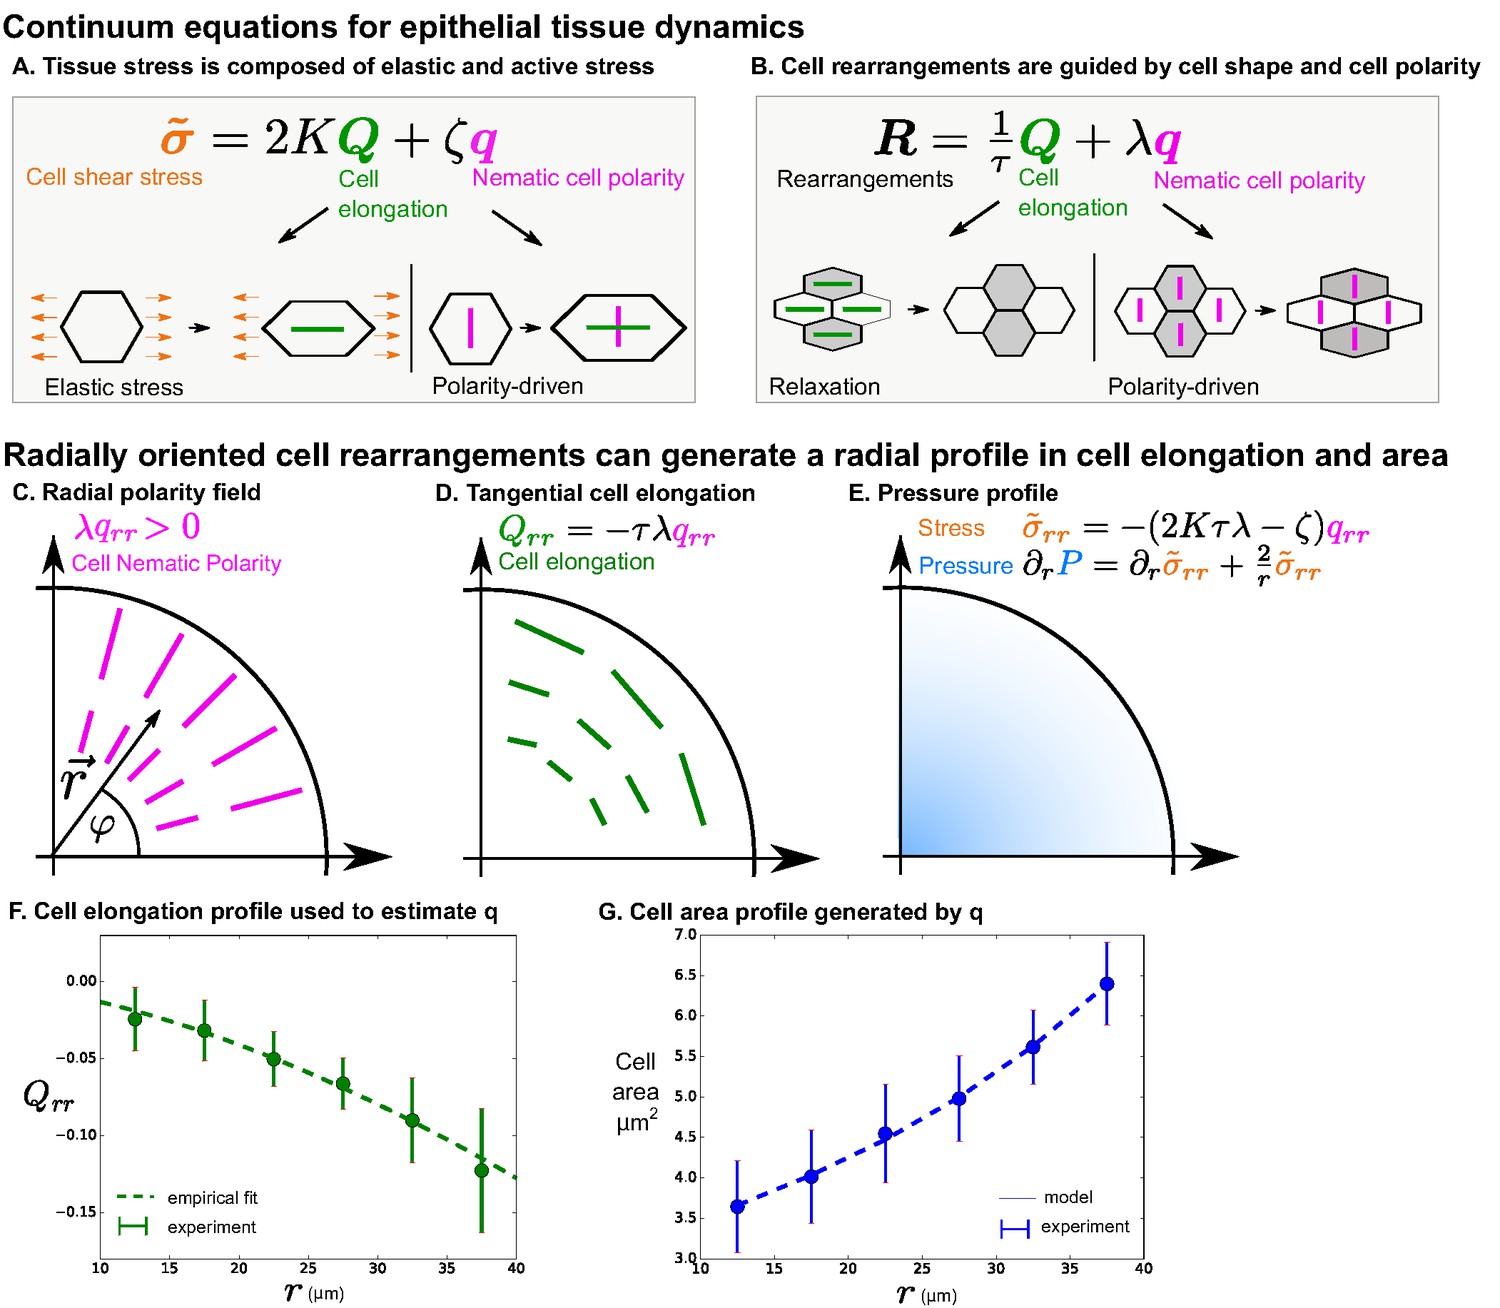
Polarity-driven cell rearrangements can create the observed cell morphology patterns.
(A) Stress is a combination of elastic and polarity-driven stresses. Similarly, in (B), cell rearrangements occur to relax a stretched cell shape or to respond to an internal nematic cell polarity cue. In the cartoons in (A)-(B), we chose to depict scenarios where and are . (C–G) We apply this model to a radially symmetric tissue at steady state to approximate the wing disc. If we impose a radial polarity field (C), cell elongation is oriented in the opposite direction, according to the equation in (D) when (steady state). (E) Considering force balance in the tissue, our model also predicts a pressure profile with higher pressure in the center. (F) To fit experimental data in the wing disc, we estimate the radial profile of from Equation 4 by measuring cell elongation as a function of in the last () of the timelapse. We solve for by making an empirical fit to this cell elongation data (see Appendix 1 part 2). (G) The cell area distribution we observe in the wing disc is consistent with the pressure profile predicted by our model (E and Appendix 1 part 2).
Figure 4 with 1 supplement
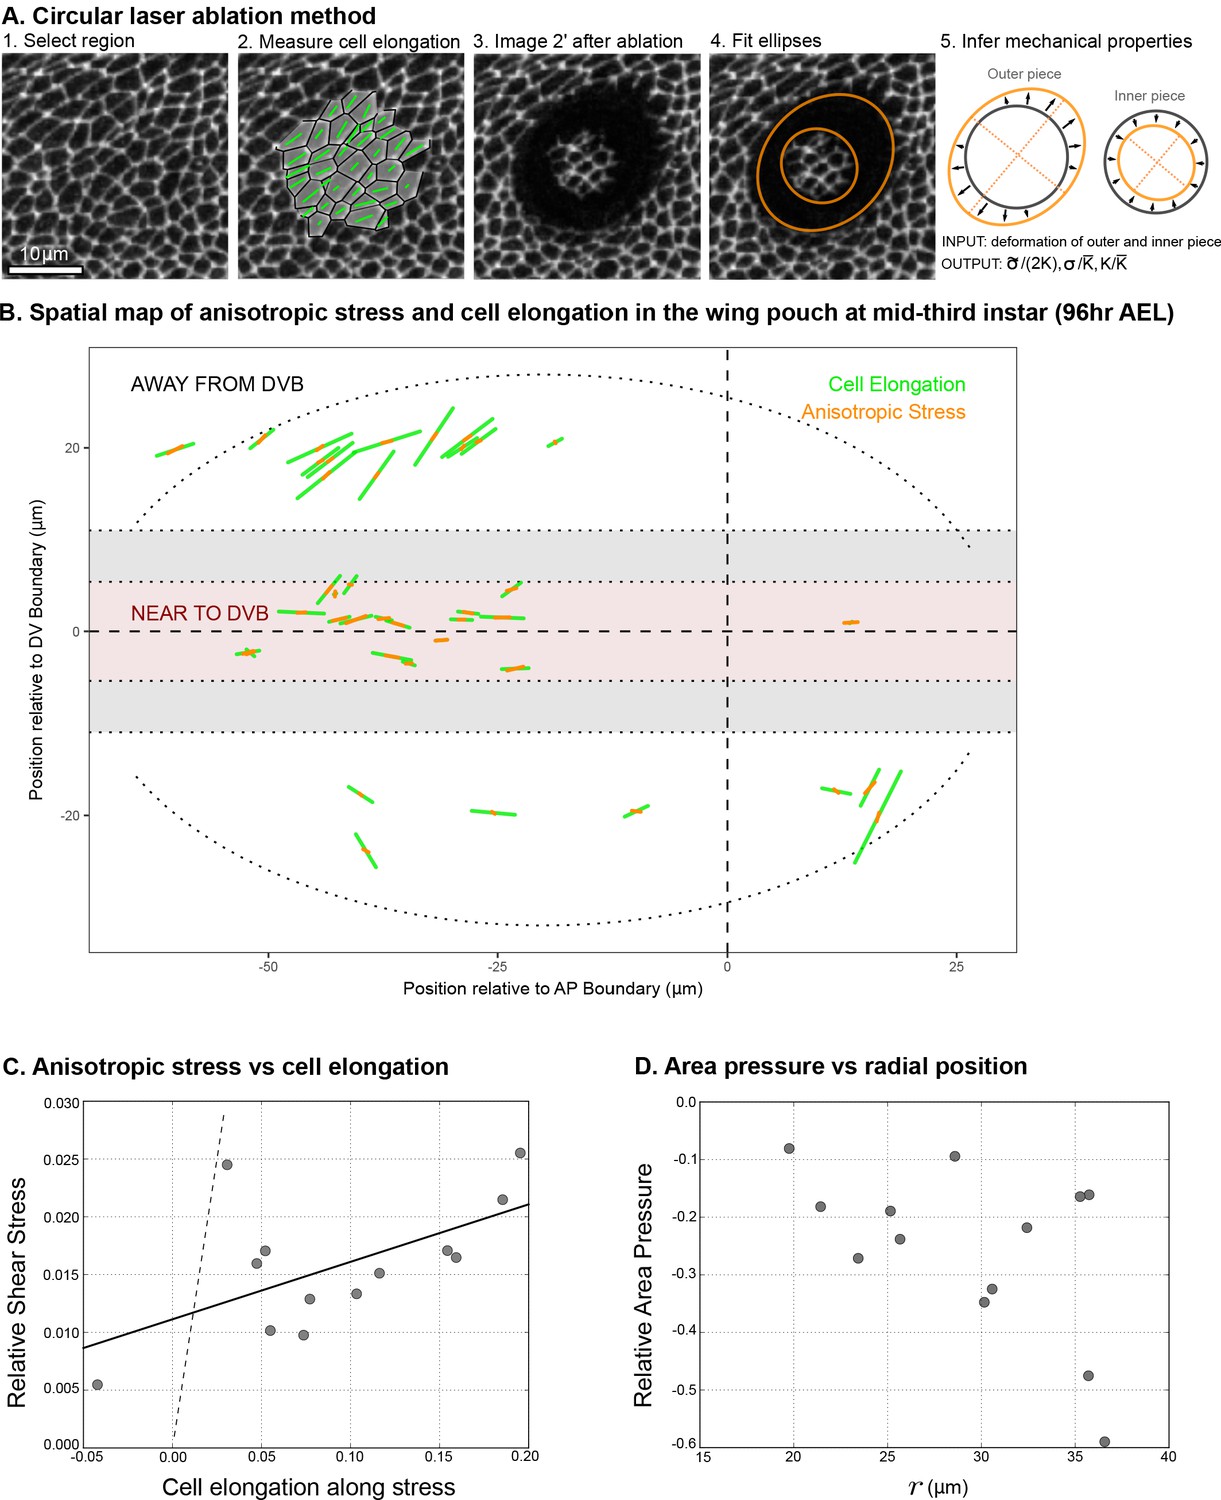
Circular laser ablation reveals patterns of tissue stress.
(A) Description of the circular laser ablation method ESCA. The tissue is cut in a circle (radius ), and cell elongation is averaged in this region before the cut. After the tissue relaxes (), we fit ellipses to the cut region. We then infer mechanical properties using our model, which inputs deformation and outputs stress as a function of elastic constant and the ratio of the isotropic and anisotropic elastic constants (see also Figure 4—figure supplement 1). (B) Map of stress and cell elongation in the wing disc ( AEL). Each line represents a nematic, where length indicates the magnitude, and angle indicates its orientation. Each data point comes from a different wing disc. The gray region indicates a border region, in which a cut would straddle the two regions. Cuts centered in this region were not included in the analysis. The dotted lines on either side of the DV boundary indicate our cut-offs for delineating the border and DV boundary regions (see Materials and methods). (C) Magnitude of anisotropic stress () is plotted against cell elongation (projected onto the stress axis) for all ablations outside the DV boundary. Dotted line indicates a line with slope , corresponding to a tissue lacking a nematic cell polarity cue. Fit line is solid black (See Appendix 2). Data for the DV boundary region is presented in Figure 4—figure supplement 1D-F. (D) Relative area pressure is plotted against for all ablations outside the DV boundary. The correlation coefficient . Data used in this figure are included in Figure 4—source data 1.
-
Figure 4—source data 1
Laser ablation data on cell elongation and stress.
- https://cdn.elifesciences.org/articles/57964/elife-57964-fig4-data1-v3.zip
Figure 4—figure supplement 1
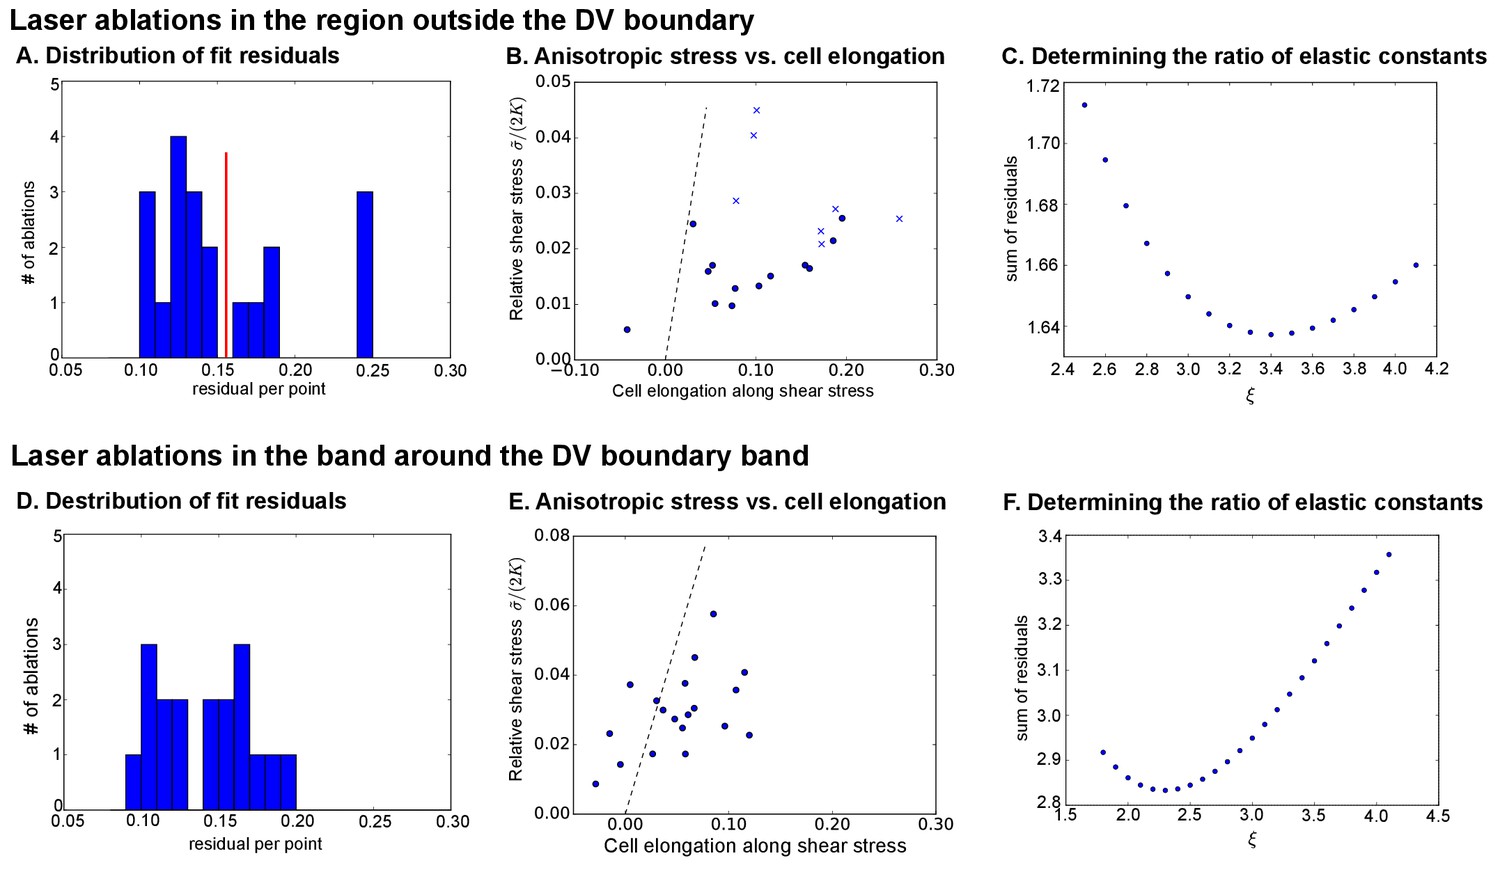
Analysis of circular laser ablations ( AEL).
(A) and (D): Histogram of fit residuals for the region outside the DV boundary (A) or within the band around the DV boundary (D). The red line in (A) denotes the cutoff we chose to discard cuts with non-elliptical outlines. (B) and (E) Plot of the anisotropic stress (relative to ) versus the cell elongation along the stress axis. Points marked with ‘x’ were discarded because their fit residuals were greater than our cutoff (red line in A). Dotted line indicates a slope , which would correspond to a tissue without polarity-driven stress. (C) and (F) show the sum of fit residuals for a range of values for the ratio of elastic constants. The optimal value was considered to be the one that minimizes this sum of residuals.
Figure 5 with 1 supplement
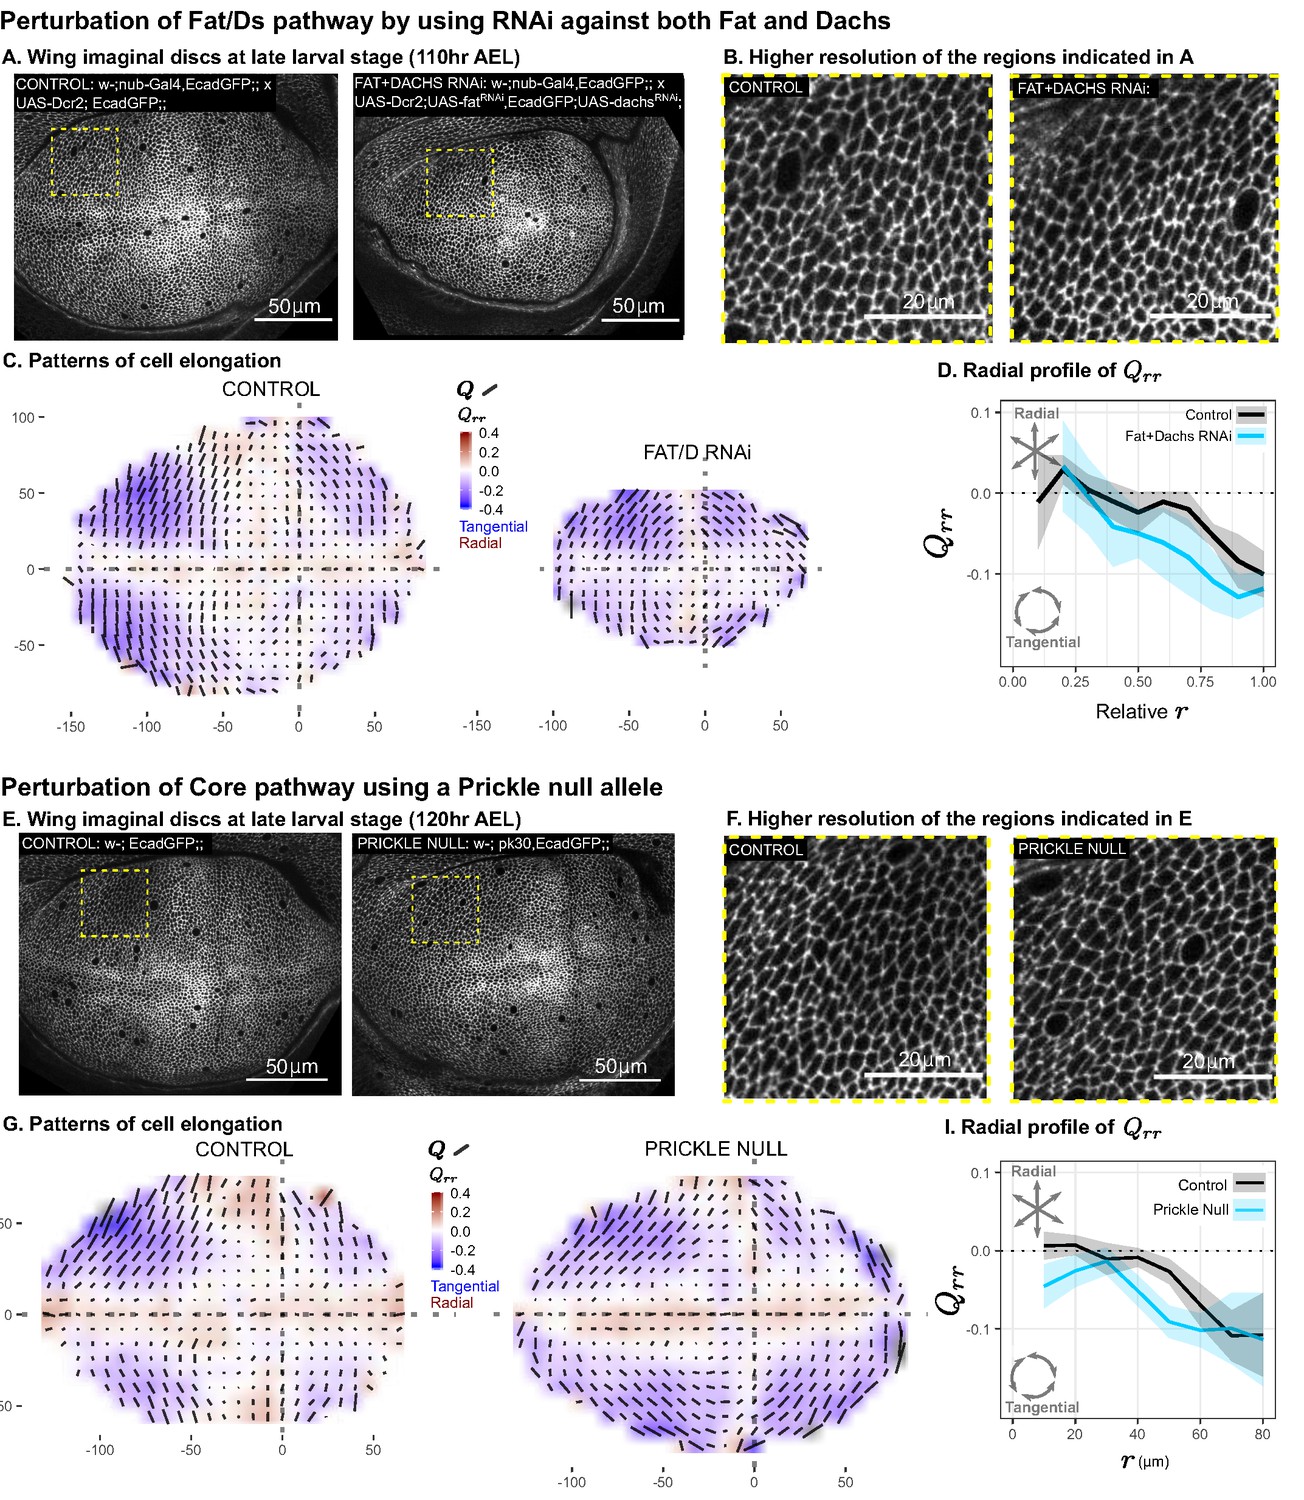
Disruption of two PCP pathways does not reduce tangential cell elongation.
(A–D) RNAi was induced against both fat and dachs in the pouch (nub-Gal4 > UAS-Dcr, UAS-fatRNAi, UAS-dachsRNAi), and cell elongation patterns at the end of larval development ( AEL) are presented along with control (nub-Gal4 > UAS-Dcr). Data are included in Figure 5—source data 1. (E–I) Cell elongation patterns at the end of larval development are presented for a null mutant in prickle (pk30) and the wild-type control. Data are included in Figure 5—source data 2. (A,E) Representative images of each genotype, with apical cell boundaries marked with Ecadherin-GFP. Yellow box indicates the inset that is presented in higher resolution in (B,F). (C,G) Cell elongation averaged across several discs for each genotype in a grid centered on the AP and DV boundaries. Bars represent the average cell elongation tensor , where the length of the bar is proportional to the magnitude of cell elongation, and the angle indicates its orientation. Color indicates the radial component of cell elongation . Axis labels indicate distance from the AP (X) or DV (Y) compartment boundaries (in ). (D,I) The radial profile of cell elongation for each genotype was quantified by averaging in radial bins and plotting as a function of . Since the ft+d RNAi wings are smaller, we present this profile as a relative distance to the center. The band of cells around the DV boundary was removed, and because the ft+d RNAi discs are smaller, this region of exclusion is a larger relative distance. Plots in (C–D) represent averages of wing discs per genotype; for plots in (G–I), per genotype.
-
Figure 5—source data 1
Triangle elongation for Fat+Dachs RNAi.
- https://cdn.elifesciences.org/articles/57964/elife-57964-fig5-data1-v3.zip
-
Figure 5—source data 2
Triangle elongation for Pk30.
- https://cdn.elifesciences.org/articles/57964/elife-57964-fig5-data2-v3.zip
-
Figure 5—source data 3
Calculated center of elongation symmetry for genetic perturbations.
- https://cdn.elifesciences.org/articles/57964/elife-57964-fig5-data3-v3.zip
Figure 5—figure supplement 1
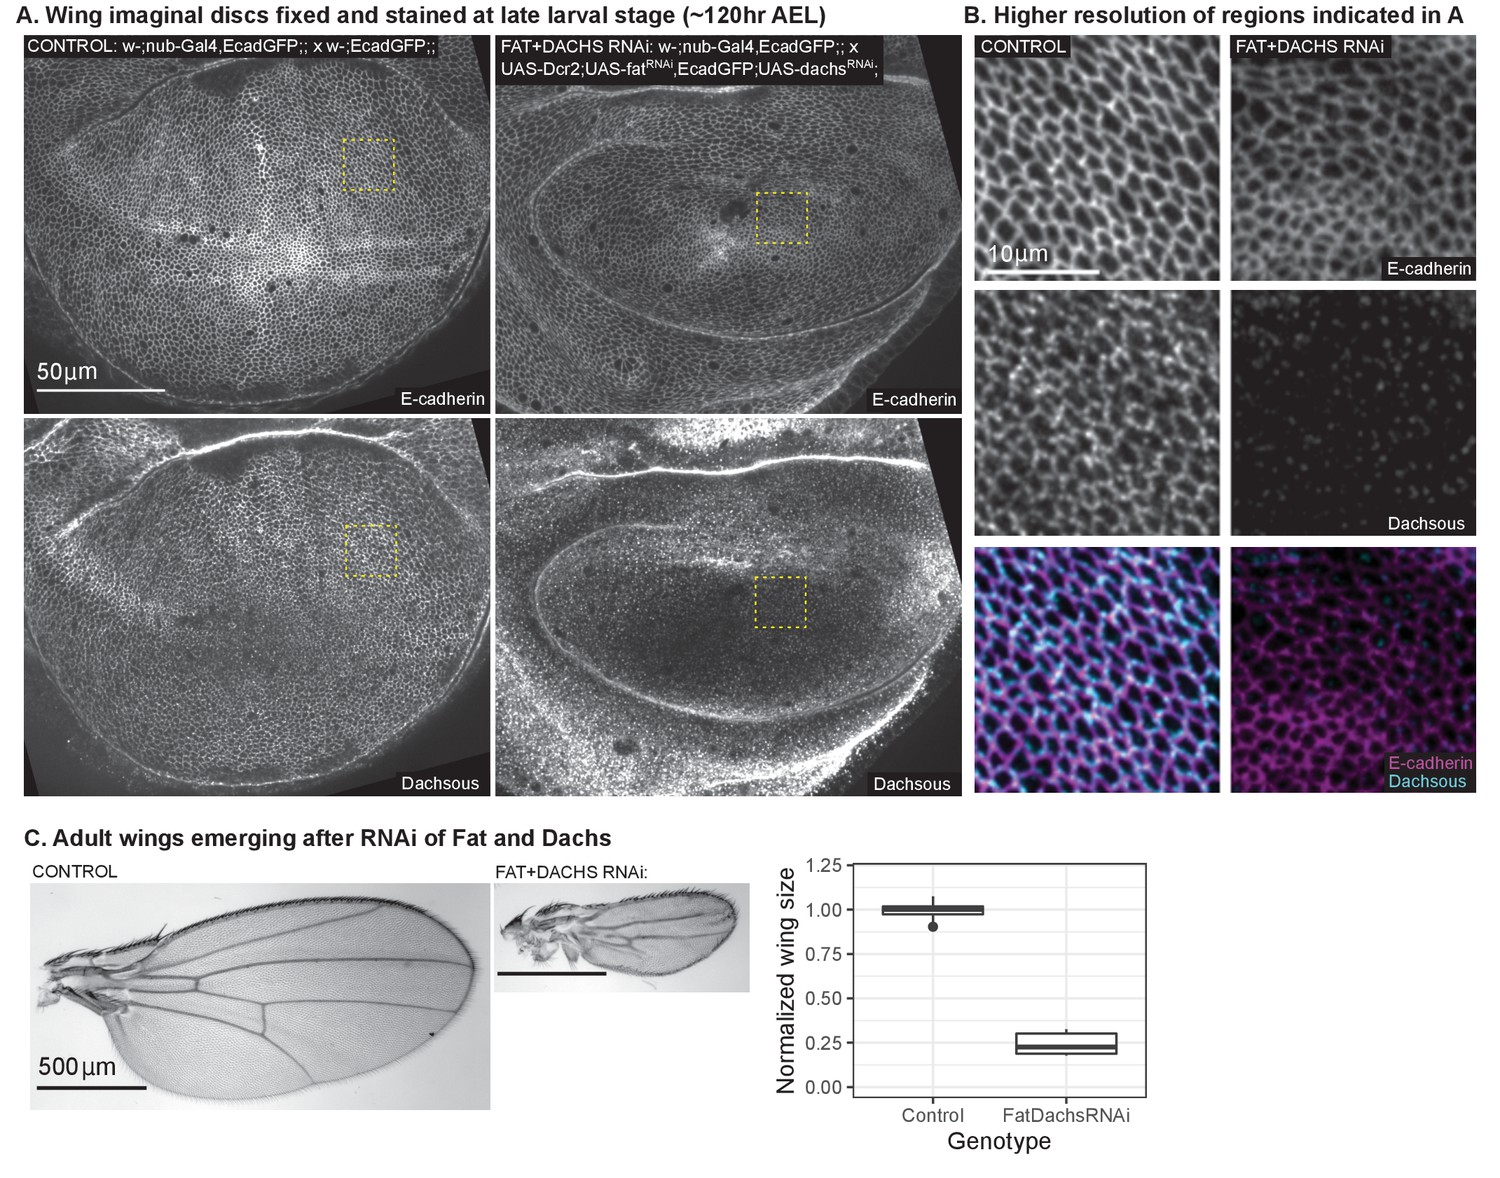
Confirmation of reduced PCP upon ft+d RNAi.
Double RNAi of ft and d was validated by looking at Dachsous localization in wing discs (A-B) and adult wing size (C). (A-B). Representative images of late 3rd instar wing discs ( AEL) immunostained for Dachsous and expressing Ecadherin-GFP in both control (left) and RNAi (right) wing discs. Ecadherin was used to project the apical plane in both channels. Part (B) shows a higher resolution of the region outlined by the yellow box in (A). In control wings, Dachsous is membrane-localized and planar polarized. Upon RNAi of ft and d, Dachsous levels are reduced, and residual signal is no longer membrane-localized or planar polarized. (C) Representative images of adult wings from control (left) and RNAi (middle) flies. Both scale bars are . On the right is a quantification of the reduction of wing size upon ft+d RNAi, normalized to the control (males only). The lower and upper hinges correspond to the first and third quartiles (the 25th and 75th percentiles). The middle line corresponds to the median; whiskers extend to the maximum and minimum value of the data within times the interquartile range; outliers are represented by individual dots. for control; for RNAi.
Figure 6
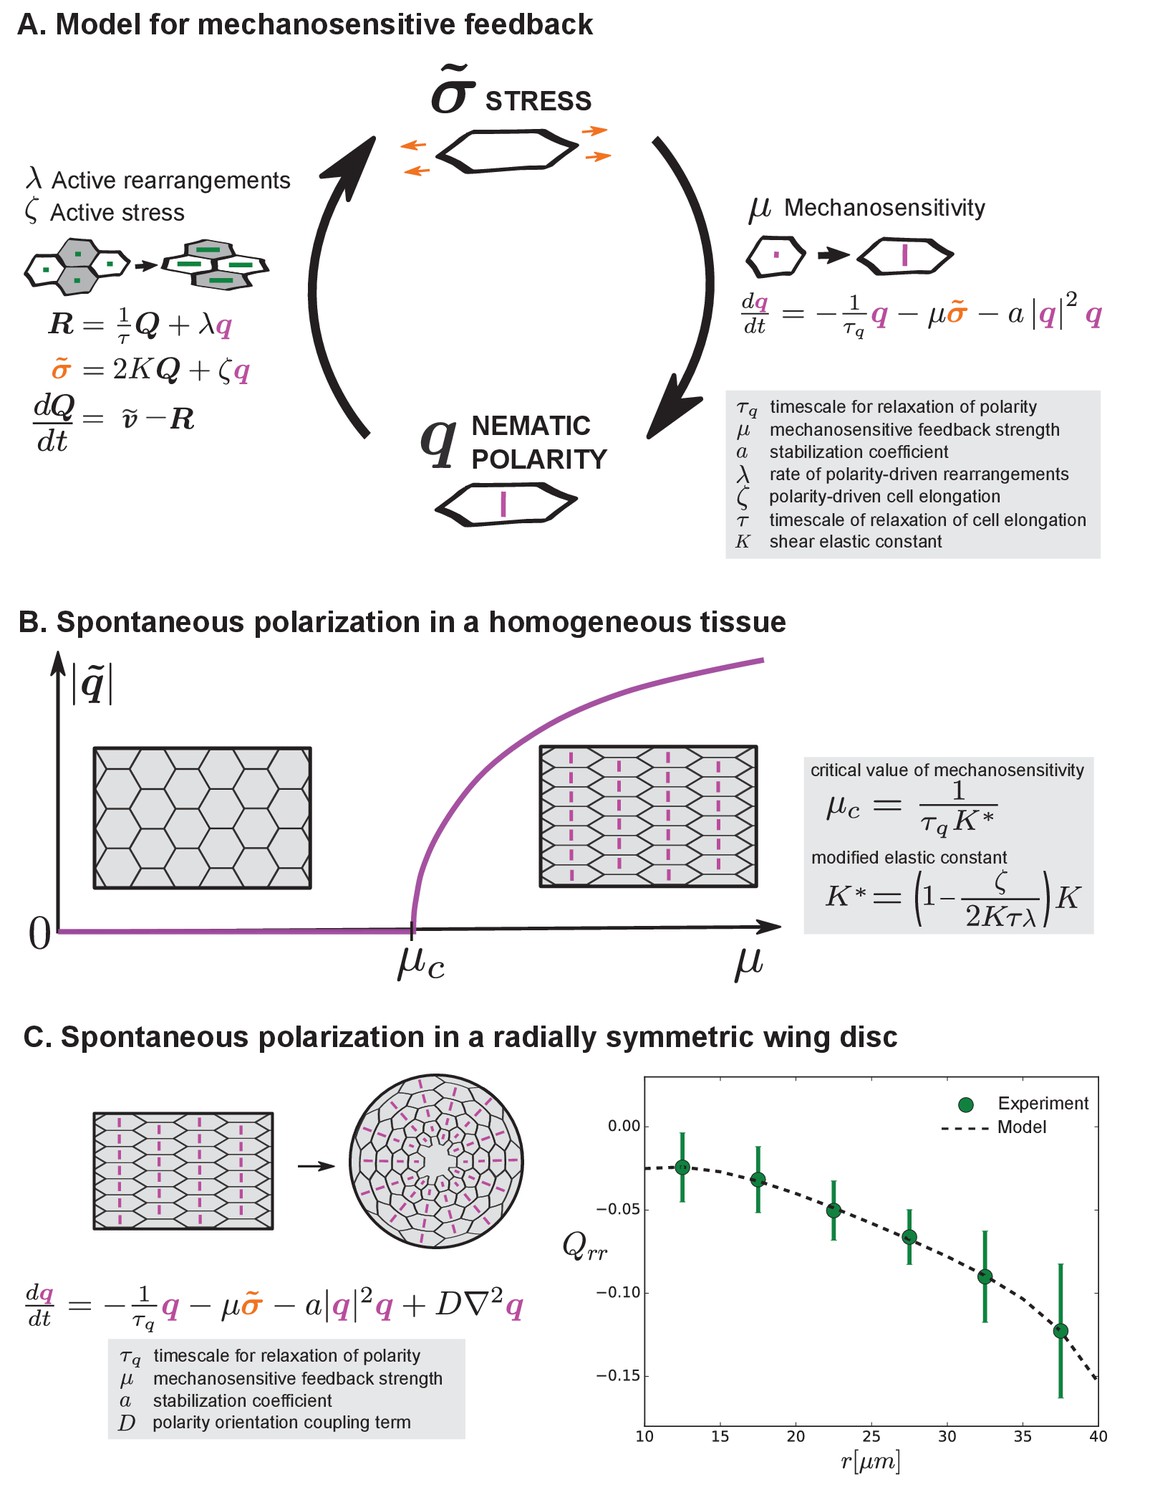
Mechanosensitive feedback generates self-organized patterns of cell morphology.
(A) We introduce mechanosensitive feedback into our model with a dynamic equation relating the orientational cue to tissue stress. With a change in , there can be a change in polarity-driven cell rearrangements and stress. (B) Above a critical value of , the isotropic state is unstable and the system spontaneously polarizes. (C) Application of the model to the radially symmetric wing disc. Generation of large-scale tissue polarity requires the orientation coupling term . We find a set of parameters that can account for the experimental data on cell elongation in the wing disc (see Appendix 1 part 4 and Table 1).
Figure 7 with 1 supplement
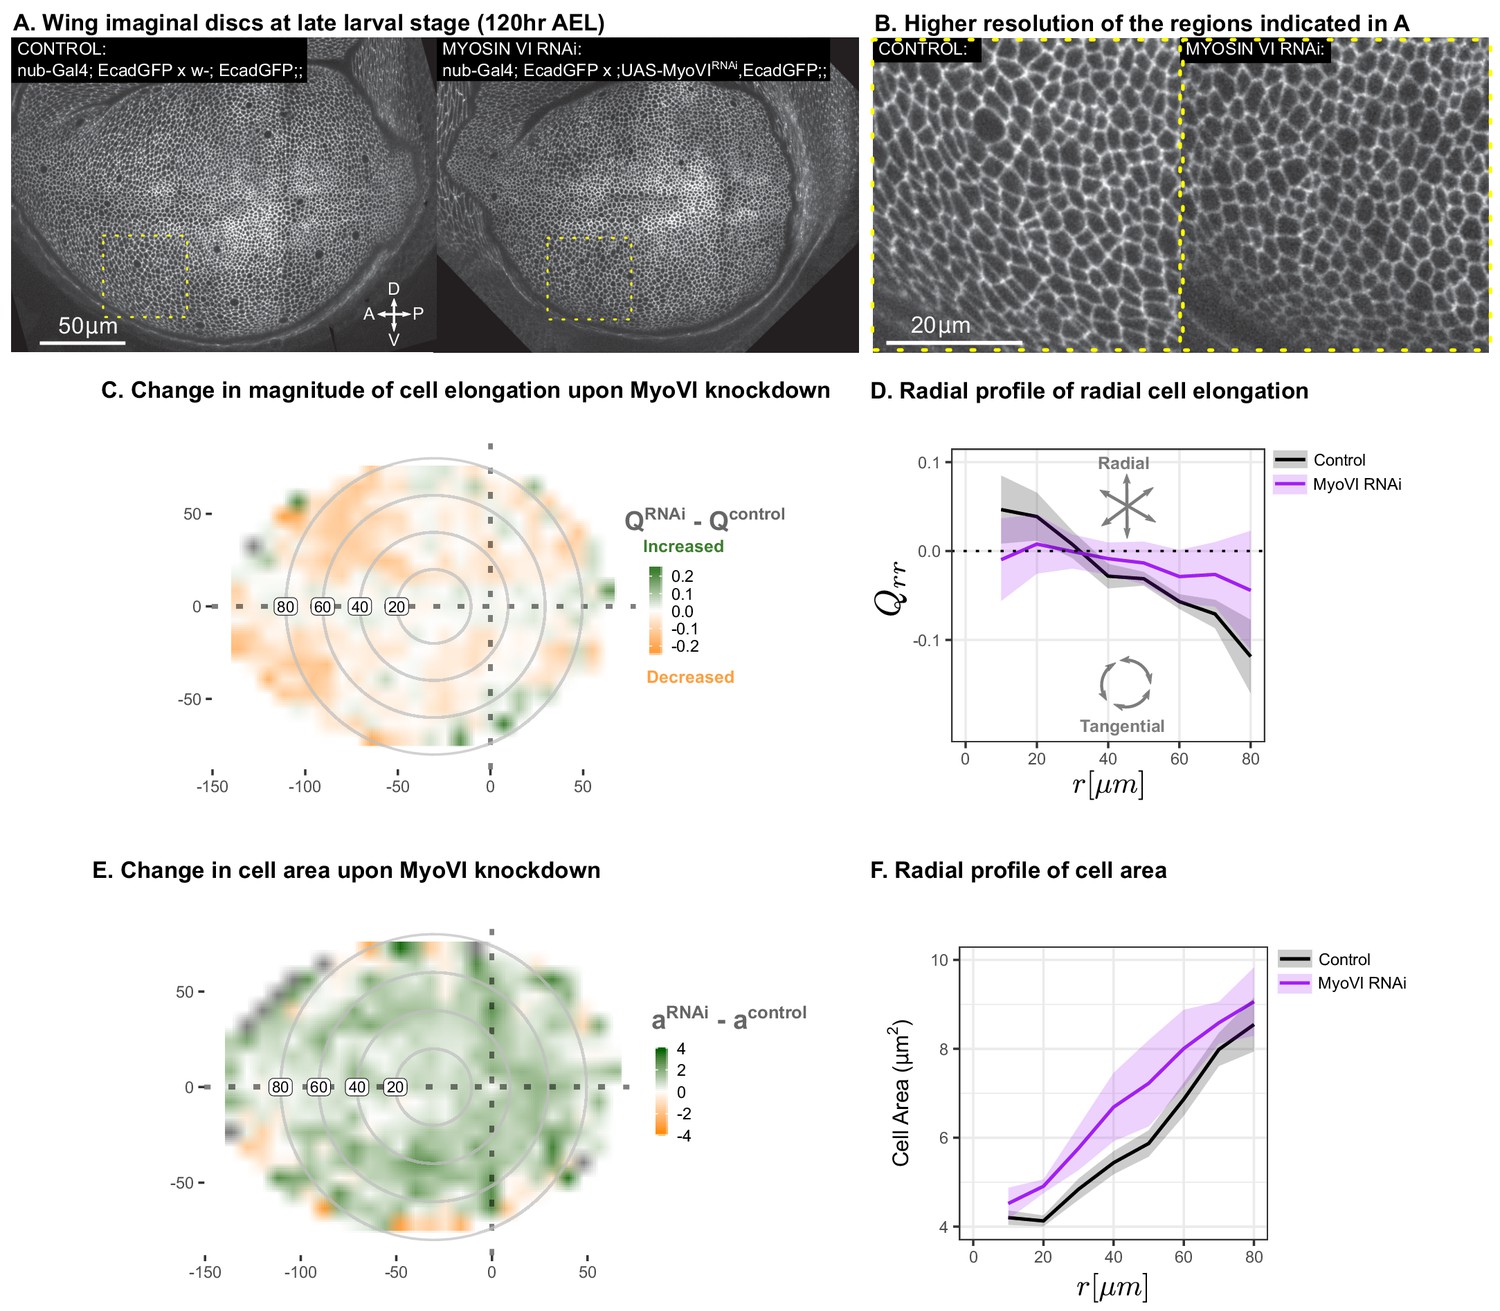
Suppression of mechanosensitivity weakens the gradients in cell elongation and cell size.
MyoVI levels were reduced with RNAi in the pouch (nub-Gal4 > UAS-MyoVIRNAi), and cell elongation and cell area were assessed at the end of larval development ( AEL). Data are included in Figure 7—source data 1 and 2. Shown in (A) are representative images, with apical cell boundaries marked by Ecadherin-GFP. Yellow box indicates the inset that is presented in higher resolution in (B). The spatial pattern of radial cell elongation is presented in Figure 7—figure supplement 1. The difference in magnitude of cell elongation (C) or cell area (E) between MyoVIRNAiand the corresponding control is presented. Axis labels indicate the distance to the AP boundary (X) or DV boundary (Y) in . Gray circles indicate radial bins, with numbers corresponding to distance (in ) from the center. (D,F) The radial profile in the radial component of cell elongation (D) or cell area (F) was quantified for each genotype. Plots in (C-F) represent averages of wing discs per genotype.
-
Figure 7—source data 1
Triangle elongation for MyoVI RNAi.
- https://cdn.elifesciences.org/articles/57964/elife-57964-fig7-data1-v3.zip
-
Figure 7—source data 2
Cell area for MyoVI RNAi.
- https://cdn.elifesciences.org/articles/57964/elife-57964-fig7-data2-v3.zip
Figure 7—figure supplement 1
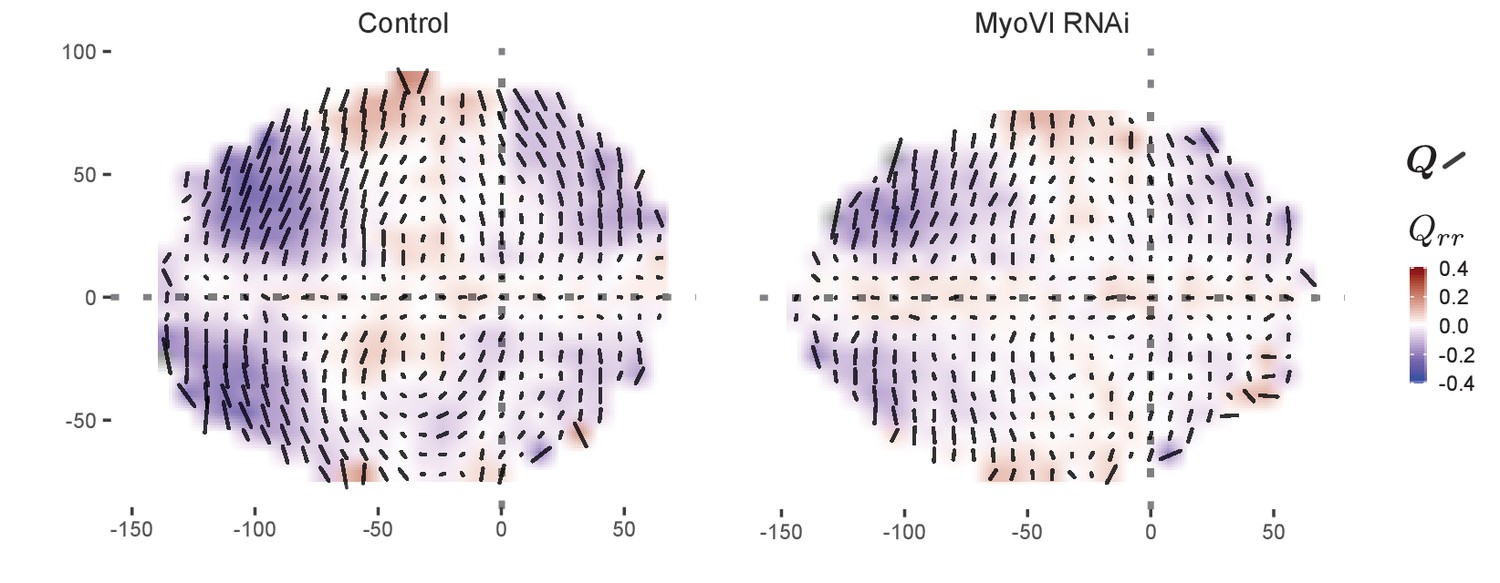
Spatial pattern of cell elongation upon MyoVI knockdown.
MyoVI levels were reduced with RNAi in the pouch (nub-Gal4 > UAS-MyoVIRNAi), and cell elongation was assessed at the end of larval development ( after egg laying), along with the corresponding control (nub-Gal44/+). The cell elongation pattern was quantified in a grid centered on the AP and DV boundaries and averaged across several discs for each genotype. The bars represent the cell elongation tensor , where the length of the bar is proportional to the magnitude and the angle indicates its orientation. In addition, the radial component of cell elongation is presented as a color code, with blue indicating tangential and red indicating radial. The dotted gra lines indicate the positions of the compartment boundaries, and the axes correspond to the distance (in µm) from these boundaries.
Appendix 1—figure 1
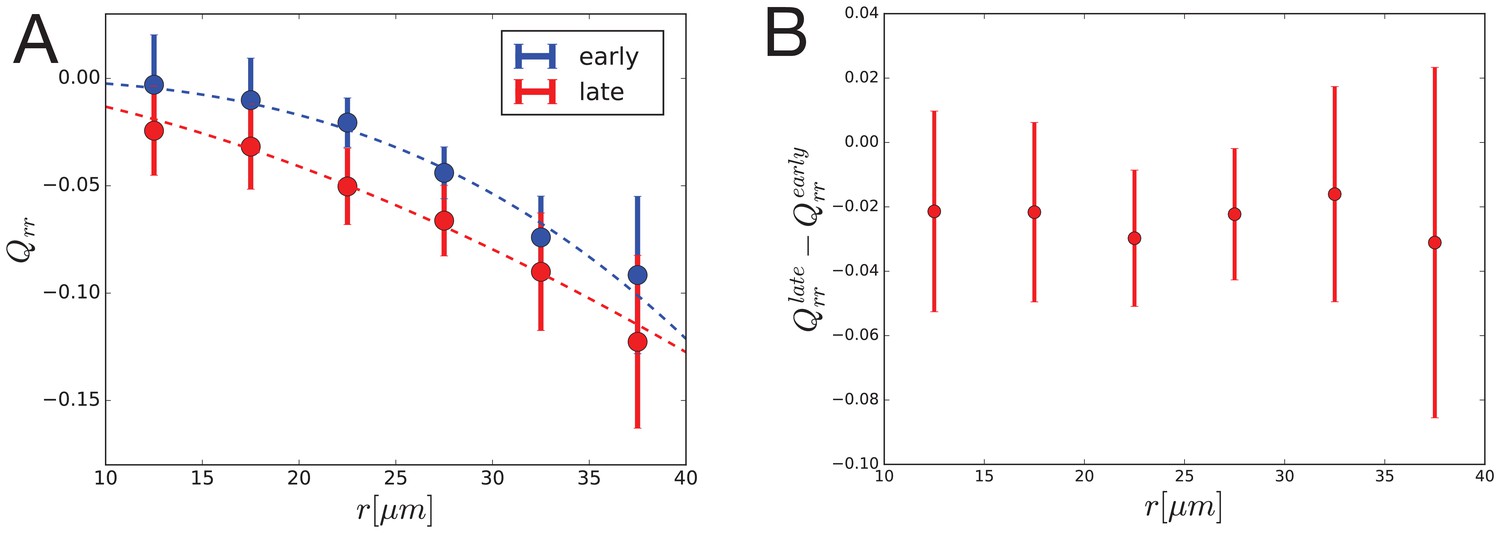
Dynamics of radial cell elongation profile.
Left: Radial cell elongation in the first half of the movies (’early’) are shown in blue and in the second half of the movies (’late’) are shown in red. Fits of power law are shown with dashed lines in corresponding colors, with fit parameters , and , for "early" and "late" profiles, respectively. Right: Radial cell elongation change suggests that there is no significant gradient of radial shear due to cell rearrangements during the experiment.
Appendix 2—figure 1
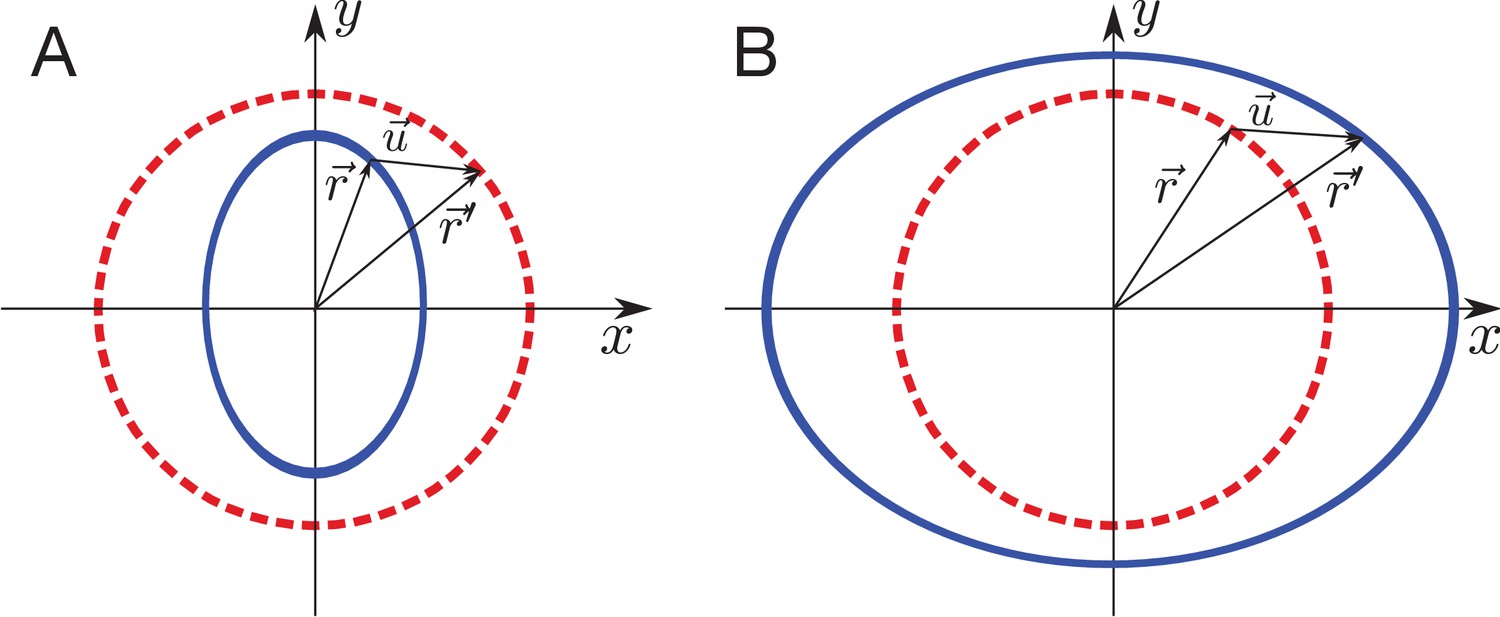
Schematic of elastic sheet boundary shape after a circular ablation.
(A) Inner piece problem: Blue ellipse shape of the boundary after the ablation is the reference shape deformed by uniform stress , to the red circle boundary shape before the ablation. (B) Outer piece problem: The red circle boundary shape before the ablation is the reference in this case. The final boundary shape after the ablation is blue ellipse.
Appendix 3—figure 1
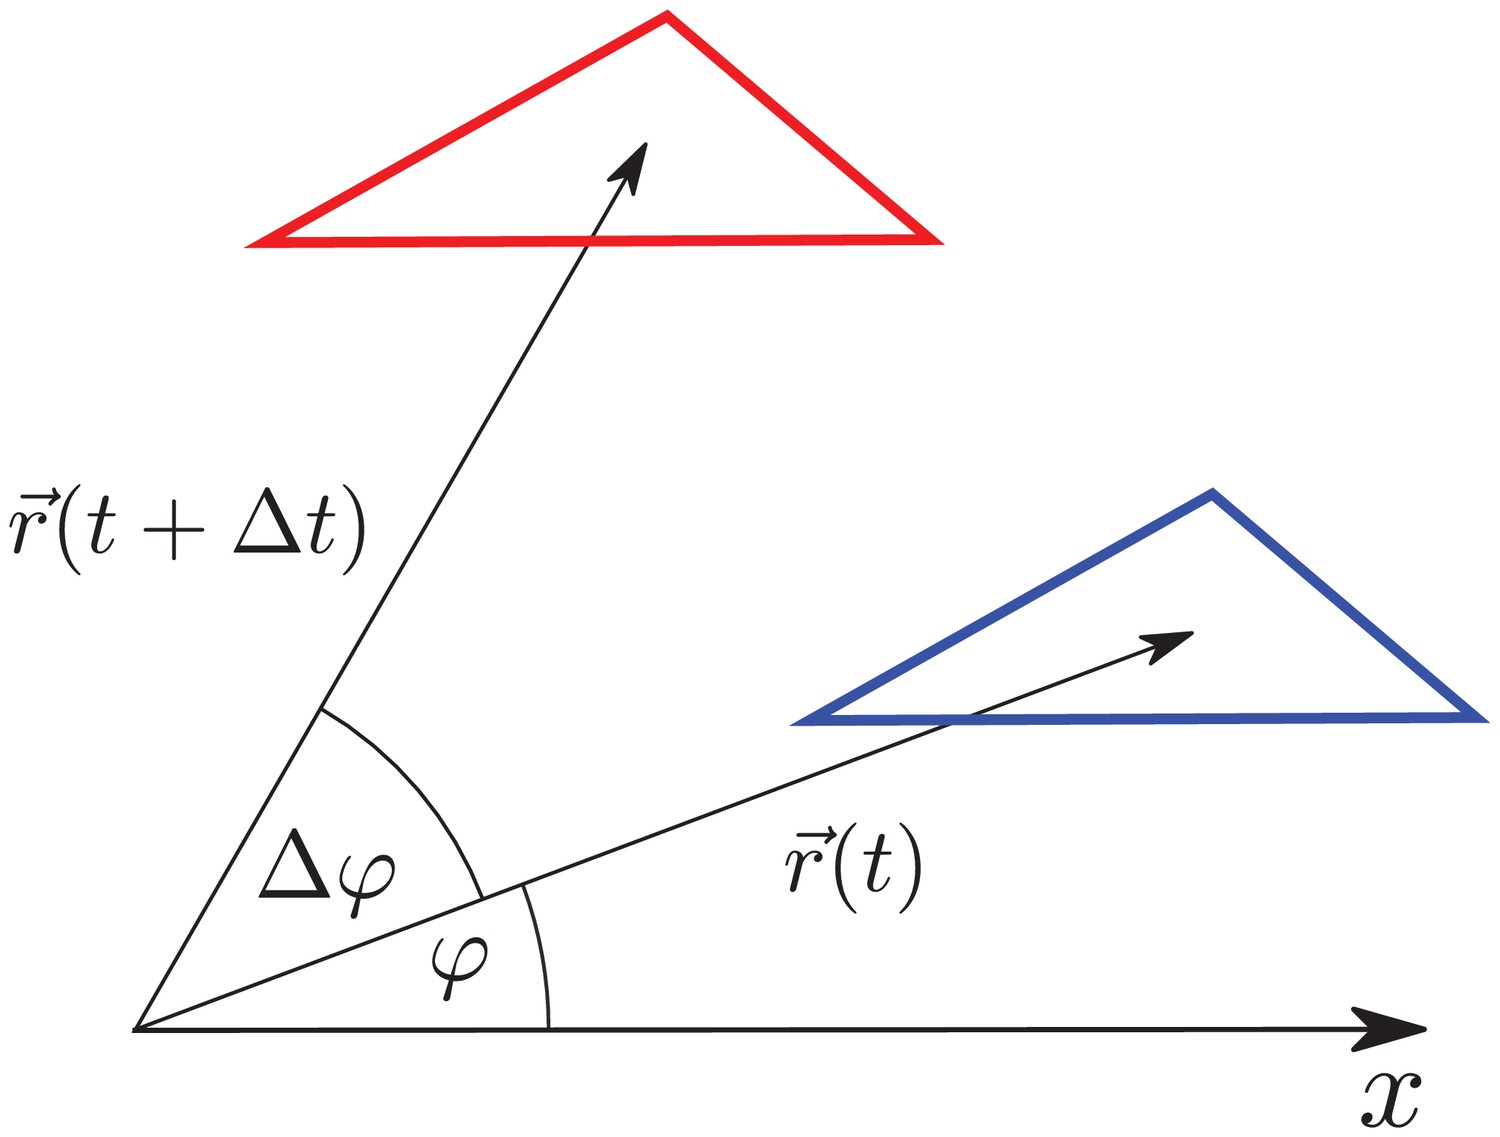
Triangle translation changes its radial elongation.
Triangle is translated by . Although the triangle elongation did not change during the translation, the radial component of the triangle elongation changes due to the change of radial direction by .
Appendix 3—figure 2
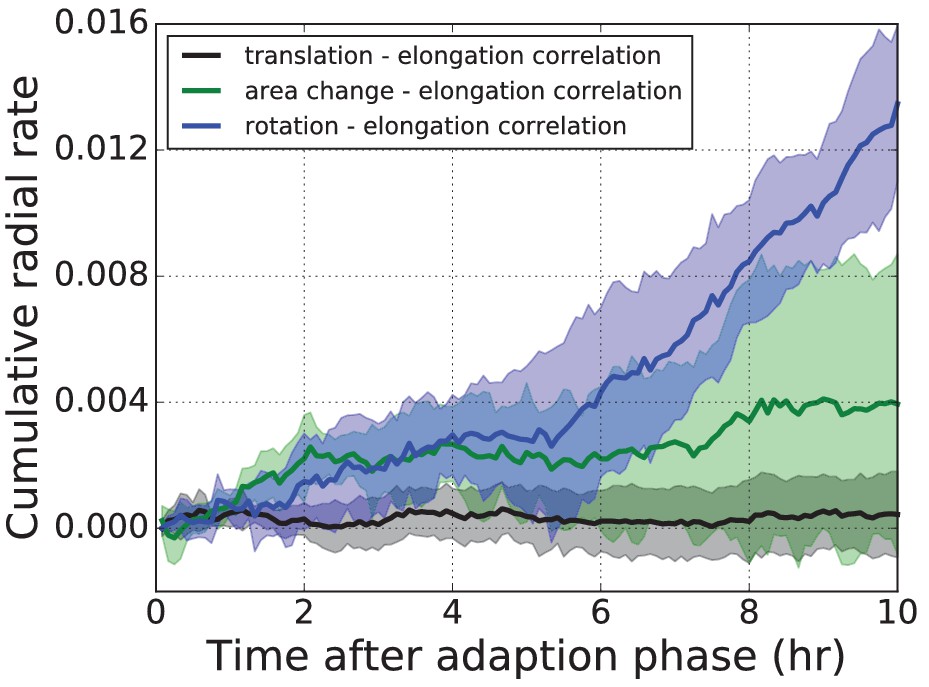
Three correlation terms contributing to the average radial tissue shear flow.
The three correlation terms contributing to radial tissue shear flow measured in the wing disc pouch, averaged over five time-lapse movies.
Shaded regions correspond to one standard deviation of that sample. Blue: Correlation term stemming from correlated fluctuations of rotation and elongation of triangles. Green: Correlation term stemming from correlated fluctuations of area and elongation of triangles. Black: The new correlation term stemming from translation and elongation of triangles. The new correlation term (black) is very small in comparison to the other two.
Author response image 1
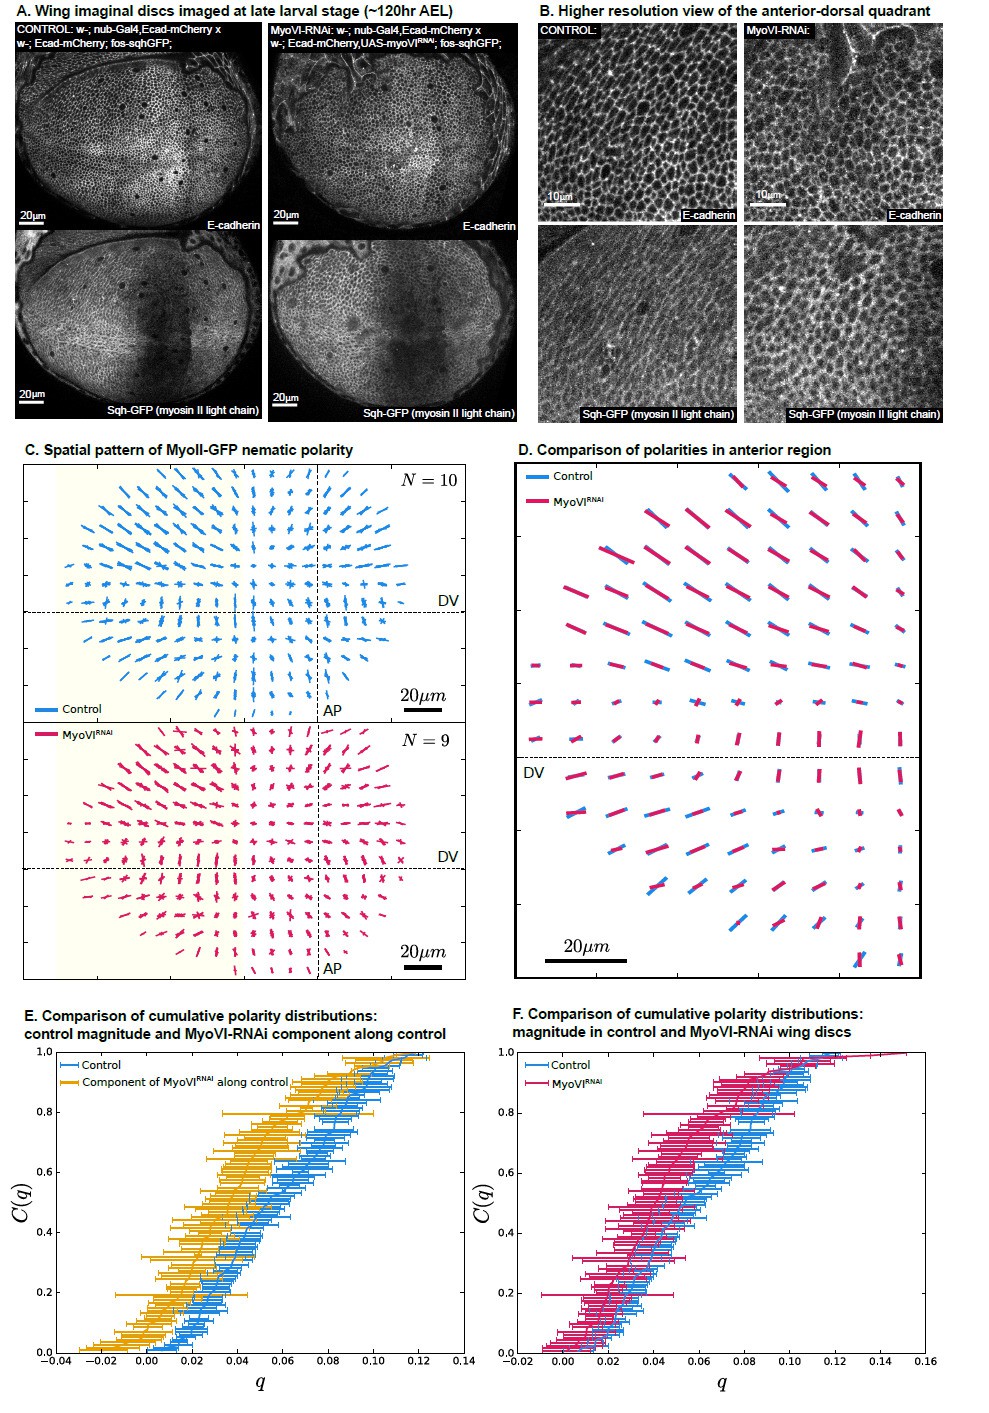
MyoVI-RNAi disrupts polarity of MyoII.
(A) Ecad-mCherry and fos-sqhGFP (MyoII regulatory light chain) expressing wings imaged under control and MyoVI-RNAi conditions. Note that the fosmid-based reporter of MyoII appears to be poorly expressed in a region just anterior to the anterior-posterior boundary in both conditions. (B) A closer view of the proximal anterior-dorsal region highlights the perturbation of anisotropy in the distribution of Ecad and MyoII. (C) We measure a full spatial pattern of MyoII-GFP nematic polarity in MyoVI-RNAi and control wings. We show an overlay of all measured patterns, revealing a less organized pattern in MyoVI-RNAi wings. (D) We further compare the average pattern of MyoII-GFP nematic cell polarity in the anterior region, marked by the yellow rectangle in (C), which is not affected by the poor expression of the MyoII reporter. We find that MyoVI-RNAi wings have an average pattern of MyoII polarity that appears to be reduced in magnitude and not entirely aligned to the control. To quantify these differences, we first compare in (E) the cumulative distribution of cell polarity magnitude C(q) in control wings with the component of polarity in MyoVI-RNAi wings along the axis defined locally by the average polarity in control wings. This quantification reveals a clear reduction of MyoII cell polarity in MyoVI-RNAi wings. Secondly, in (F) we show a comparison of the cumulative cell polarity magnitude in control and MyoVI-RNAi wings. The difference in magnitudes is smaller but significant, showing that the overall reduction of the MyoII pattern stems from both a reduction in magnitude and alignment relative to the control wings.
Tables
Table 1
Parameter values obtained by fitting the tangential cell elongation profile shown in Figure 6C to the self-organized model.
Values in the last two rows are boundary conditions that are required to calculate the tangential cell elongation profile. The reported parameter uncertainty intervals were obtained by fitting 101 uniformly sampled tangential cell elongation profiles from the range defined by the standard deviation in the experimental tangential cell elongation profile (error bars in Figure 6C). The interval limits are the 10th and 90th percentiles of the obtained values.
| Fit parameter | Parameter value | Uncertainty interval |
|---|---|---|
Key resources table
| Reagent type (species) or resource | Designation | Source or reference | Identifiers | Additional information |
|---|---|---|---|---|
| Antibody | Anti-Drosophila SRF (Mouse monoclonal) | Active Motif | Cat#:39093; RRID:AB_2793614 | lot# 03504001; IF(1:100) |
| Antibody | Anti-GFP (Rabbit polyclonal) | Invitrogen | Cat#:A11122; RRID:AB_221569 | IF(1:1000) |
| Antibody | Anti-Drosophila Patched; Apa 1, conc; (Mouse monoclonal) | Developmental Studies Hybridoma Bank | Cat#:Apa1; RRID:AB_528441 | IF(1:100) |
| Antibody | Anti Drosophila Wingless; 4D4, conc; (Mouse monoclonal) | Developmental Studies Hybridoma Bank | Cat#:4d4; RRID:AB_528512 | IF(1:100) |
| Antibody | Anti-Dachsous, 2828; (Mouse monoclonal) | Merkel et al., 2014 | IF(1:50) | |
| Chemical compound, drug | Grace’s insect medium | Sigma Aldrich | Cat#:G9771−10 × 1L | |
| Chemical compound, drug | Fetal Bovine Serum | Thermo-Fisher | Cat#:10270098 | |
| Chemical compound, drug | 20-Hydroxyecdysone | Sigma Aldrich | H5142 | |
| Chemical compound, drug | Penicillin-Streptomycin | Sigma Aldrich | P4333 | |
| Genetic reagent (D. melanogaster) | Ecadherin-GFP; Ecad-GFP | Huang et al., 2009 | yw-; EcadGFP;; | |
| Genetic reagent (D. melanogaster) | nub-Gal4 | Bloomington Drosophila Stock Center | Cat#:86108; RRID:BDSC_86108 | Combined with EcadGFP in this work |
| Genetic reagent (D. melanogaster) | fat+dachsRNAi | Vienna Drosophila Resource Center | Cat#:9396; Cat#:12555 | Combined with Dcr2 on 1st chromosome and EcadGFP on 2nd in this work |
| Genetic reagent (D. melanogaster) | pk30 | Bloomington Drosophila Stock Center | Cat#44229; RRID:BDSC_44229 | Combined with EcadGFP in this work |
| Genetic reagent (D. melanogaster) | MyoVIRNAi | Vienna Drosophila Resource Center | Cat#37534 | Combined with EcadGFP in this work |
| Software, algorithm | TissueMiner | Etournay et al., 2016 |
Additional files
-
Supplementary file 1
Description of data tables provided in Source Data.
- https://cdn.elifesciences.org/articles/57964/elife-57964-supp1-v3.tex
-
Transparent reporting form
- https://cdn.elifesciences.org/articles/57964/elife-57964-transrepform-v3.pdf
Download links
A two-part list of links to download the article, or parts of the article, in various formats.
Downloads (link to download the article as PDF)
Open citations (links to open the citations from this article in various online reference manager services)
Cite this article (links to download the citations from this article in formats compatible with various reference manager tools)
Self-organized patterning of cell morphology via mechanosensitive feedback
eLife 10:e57964.
https://doi.org/10.7554/eLife.57964


