Isolation and transcriptomic analysis of Anopheles gambiae oenocytes enables the delineation of hydrocarbon biosynthesis
- Liverpool School of Tropical Medicine, Vector Biology Department, United Kingdom
Figures
Figure 1 with 2 supplements

Isolation of fluorescently tagged oenocytes and transcriptomic analysis with RNAseq.
(A) Schematic image of total carcass cells extracted from transgenic An. gambiae mosquitoes (progeny of UAS-mCD8: mCherry line and Oeno-Gal4 driver line) expressing the m-cherry fluorescent marker in oenocytes (red cells). (B) FACS dot plots. Side-scatter intensity (vertical axis) is plotted against fluorescence intensity (horizontal axis). The sample on the left is from wild type G3 mosquitoes, the sample on the right is from transgenic mosquitoes with fluorescent oenocytes. The white line crossing the plots represents the threshold used for sorting mCherry positive cells. (C) Transcriptomic analysis for isolated oenocytes and total carcass cells. Venn diagram for genes over-expressed in both female and male oenocytes vs total carcass cells. Go term (biological process) and Pfam domain enrichment analysis is shown for the 472 genes commonly over-expressed in female and male oenocytes. (ELO: fatty acid elongation, GSHPx: Glutathione Peroxidase, SBP56: Selenium Binding Protein, KAsynt-C: Ketoacyl – synthetase C-terminal extension, KR: KR domain found in polyketide and fatty-acid synthases, PS-DH: Polyketide synthase dehydratase, RabGAP-TBC: RabGTPase-TBC domain).
Figure 1—figure supplement 1
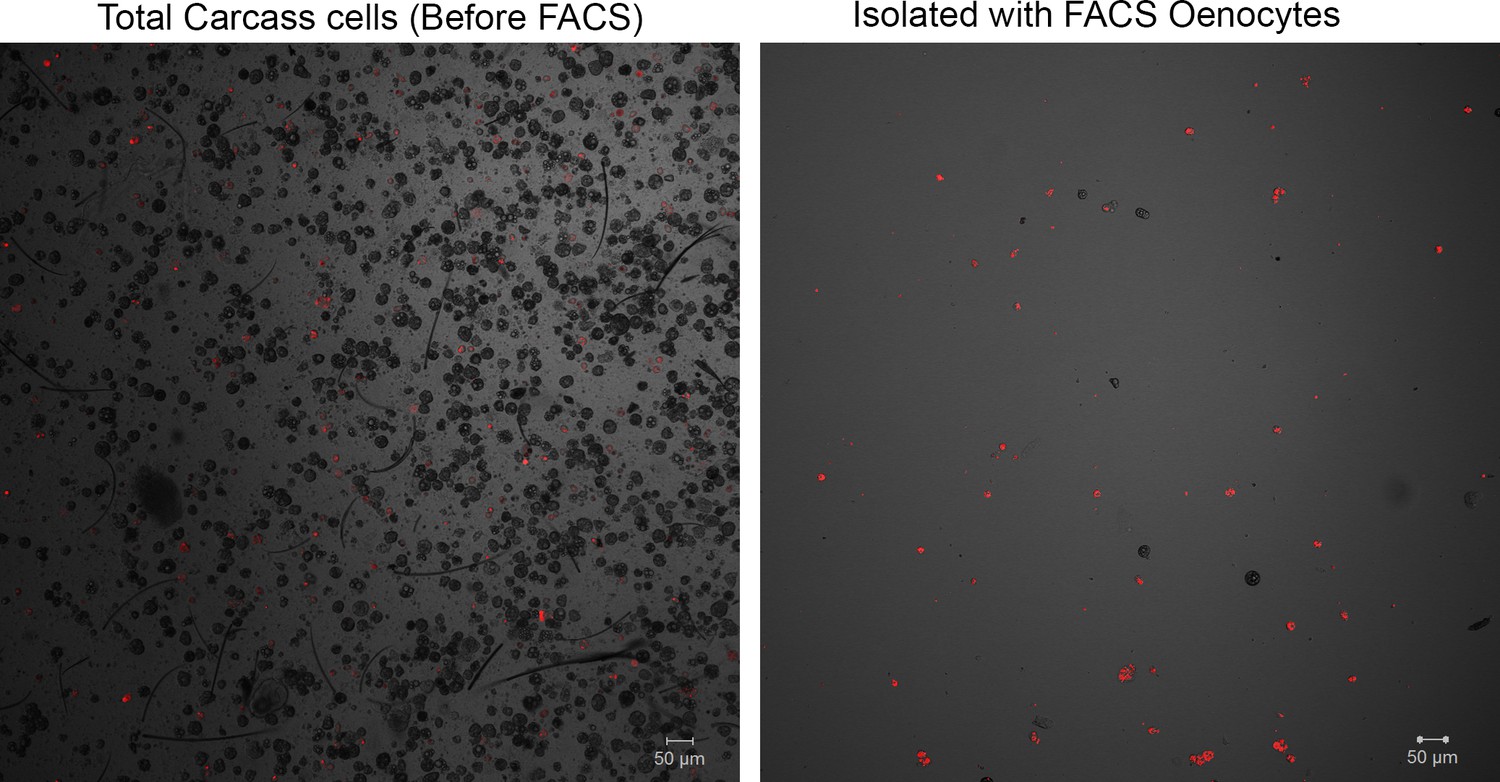
Representative confocal microscopy image for isolated oenocytes.
(A) Carcass cells dissociated from transgenic mosquitoes (progeny of UAS-mCD8: mCherry line and Oeno-Gal4 driver line) with fluorescent oenocytes (pre-sorted total carcass cells sample) (objective 10X) and (B) confocal microscopy image for cells isolated with FACS (sample of isolated oenocytes) (objective 10X).
Figure 1—figure supplement 2
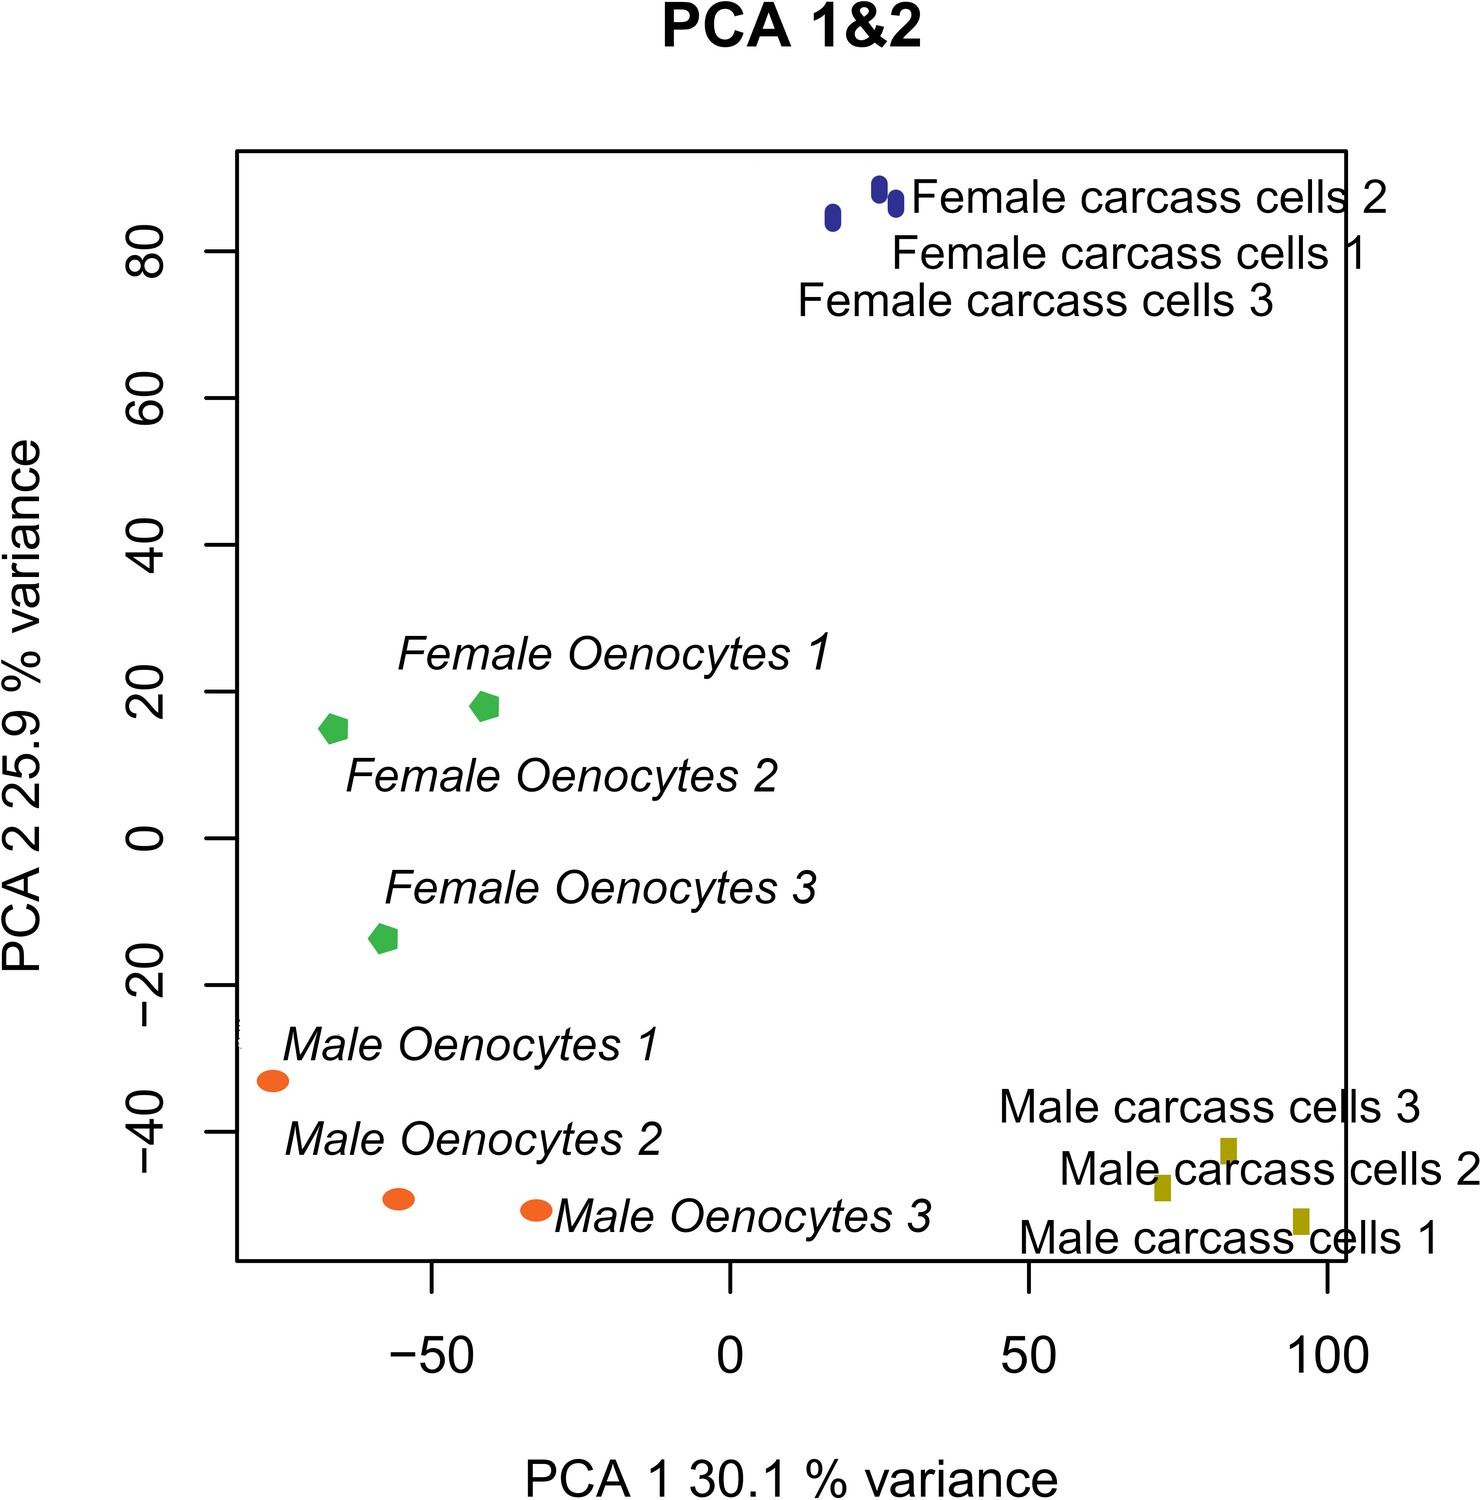
PCA analysis for the twelve samples used in RNAseq.
Figure 2
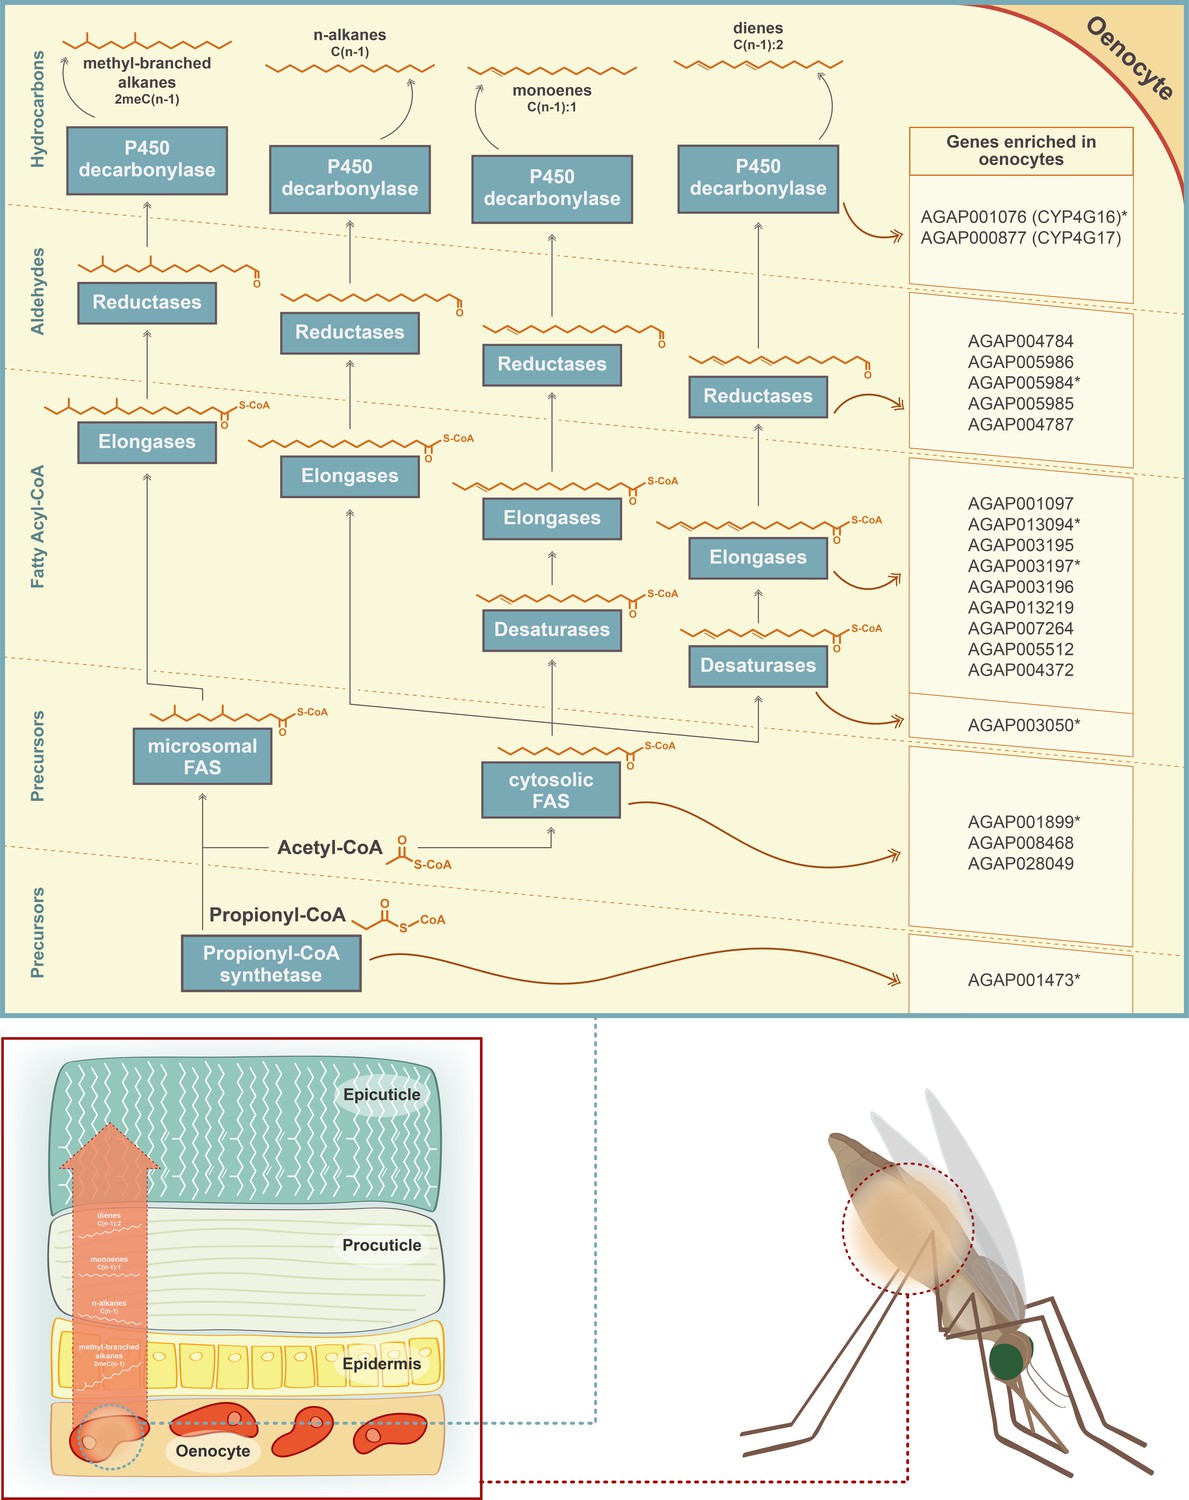
Schematic representation of the CHC biosynthetic pathway (adapted from Chung and Carroll, 2015).
Gene families implicated in the pathway (propionyl-synthetases, fatty acid synthases FAS, elongases, desaturases, fatty acid reductases and decarbonylases) are depicted in blue boxes. The chemical structure of the two precursor molecules of the pathway (Acetyl-CoA and Propionyl-CoA) is shown, as well as the chemical structure of the product of each step of the pathway. Candidate genes for each step of the pathway, with enriched expression in An. gambiae oenocytes, are listed on the left. Genes with an asterisk are members of the Cyp4G16 correlation network (Ingham et al., 2018). *Note that the epicuticle forms a much thinner layer compared to the procuticle and that its thickness has been enlarged in the image to show the presence of the CHCs.
Figure 3
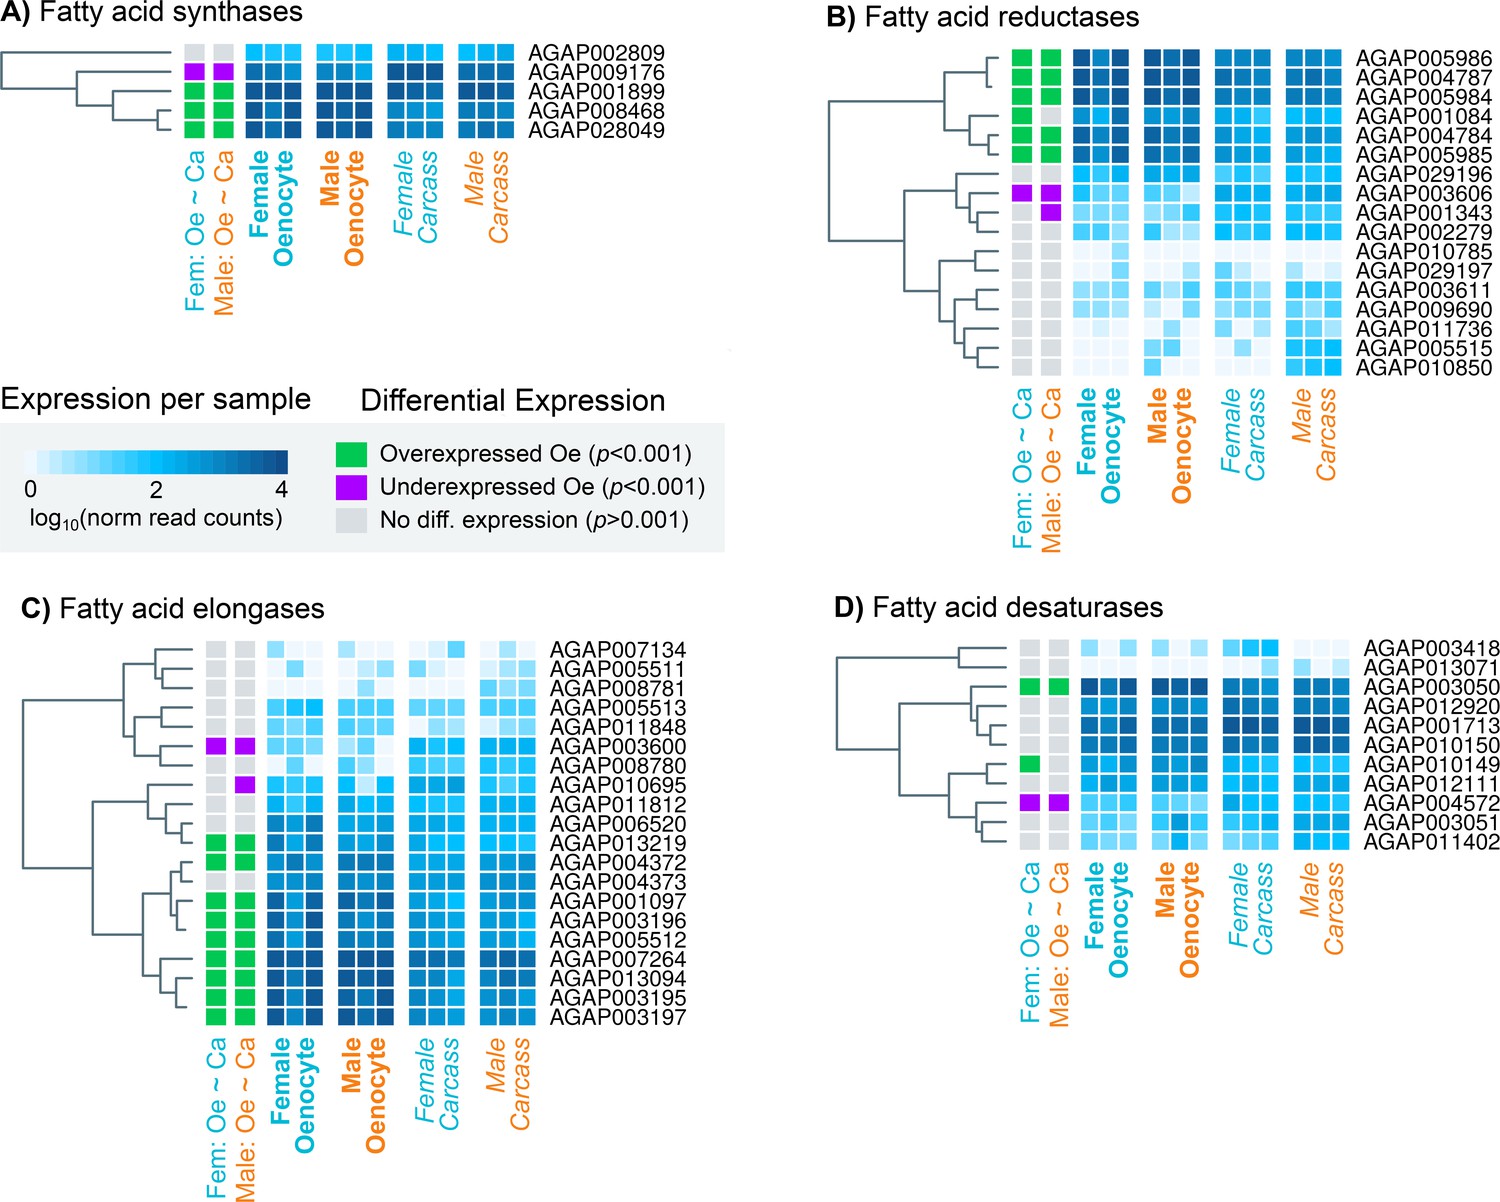
Heat maps showing the expression levels of all An. gambiae genes belonging to the four gene families (fatty acid synthetases, elongases, desaturases, reductases) implicated in CHC biosynthesis.
Expression levels (presented as different intensities of blue and using the log10 of the normalised read counts) are shown for all 12 samples used in the RNAseq experiment. The differential expression status in female and male oenocytes vs female and male total carcass cells is shown on the left of each panel. Trees on the left of each map are based on similarities in gene expression. Source data: Supplementary file 1.
Figure 4 with 4 supplements
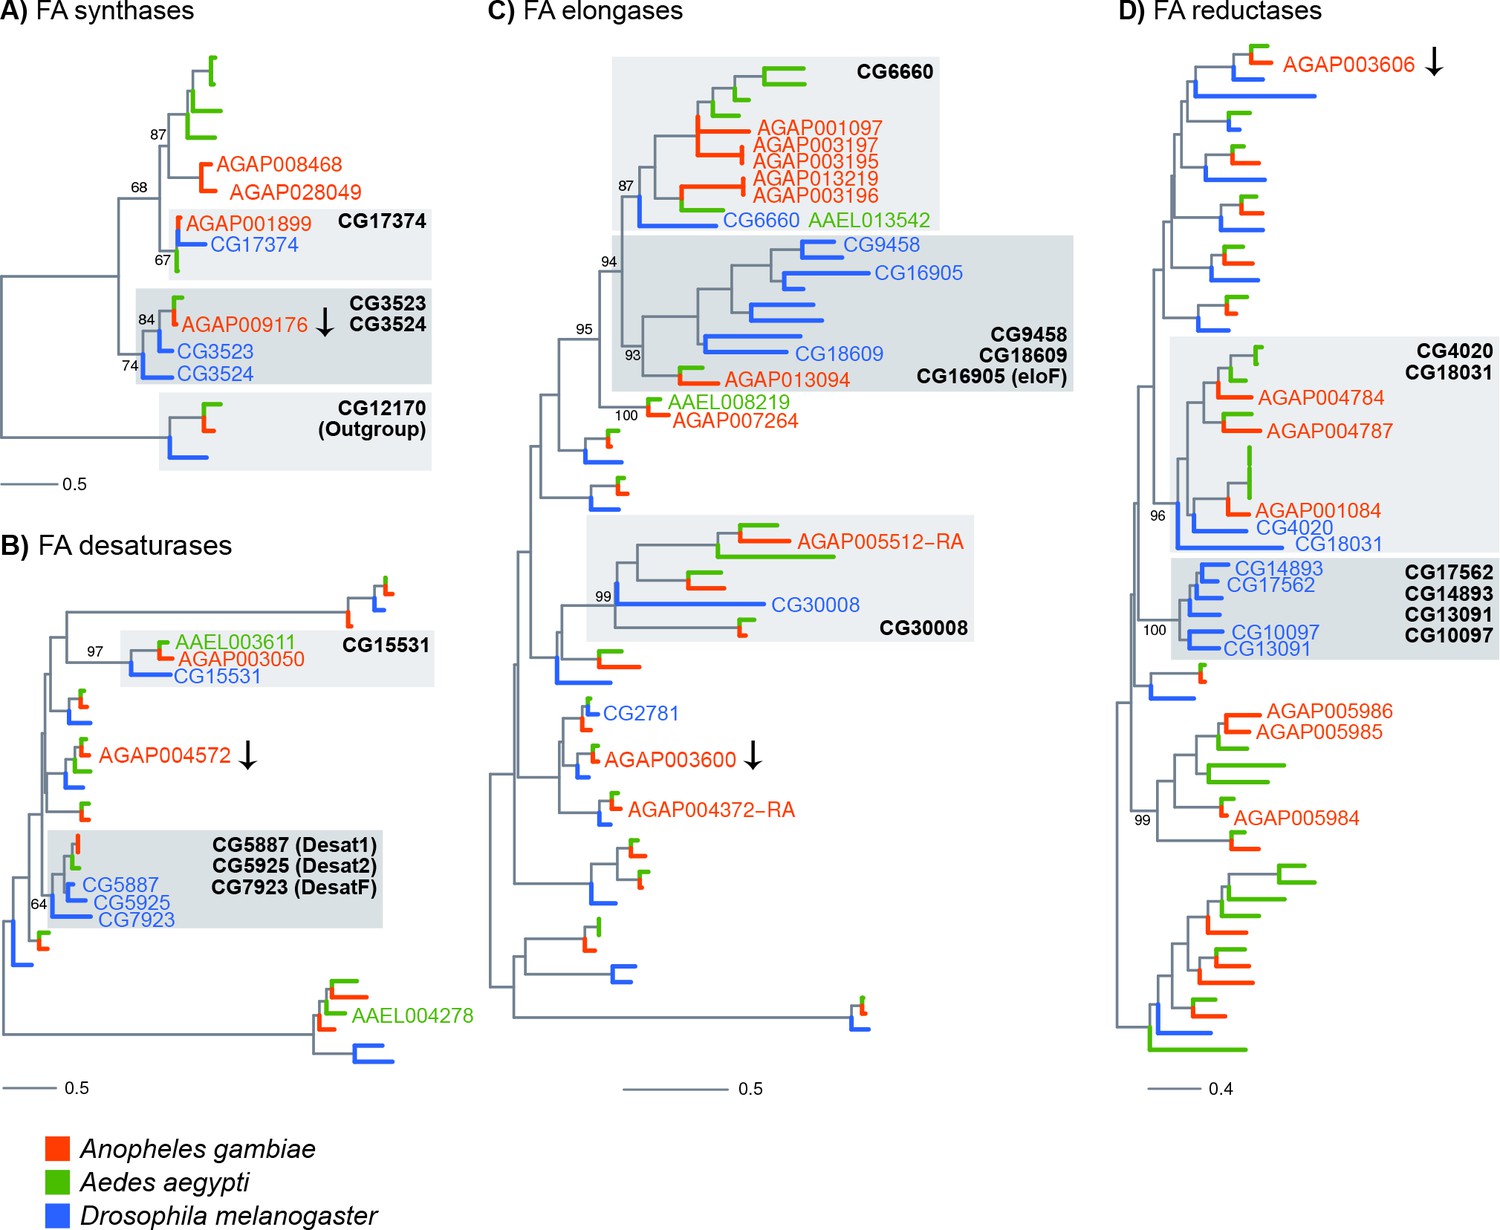
Phylogenetic trees constructed for Anopheles gambiae, Aedes aegypti and Drosophila melanogaster genes using the protein domains of Fatty acid synthases (PF00109), desaturases (PF00487), elongases (PF01151) and Fatty acyl-CoA reductases (PF07993).
Genes named on trees are: all An. gambiae genes found enriched in adult oenocytes (with the exception of genes followed by an arrow, which were significantly down-regulated), Ae. aegypti genes found expressed in pupae oenocytes and D. melanogaster genes expressed in oenocytes and/or functionally validated (based on provided references). Grey boxes have been added to clades that are discussed in the text and named based on the D. melanogaster members. Scale bars show the number of aminoacid substitutions per alignment position. Trees with all gene names are provided in Figure 4—figure supplements 1–4.
Figure 4—figure supplement 1
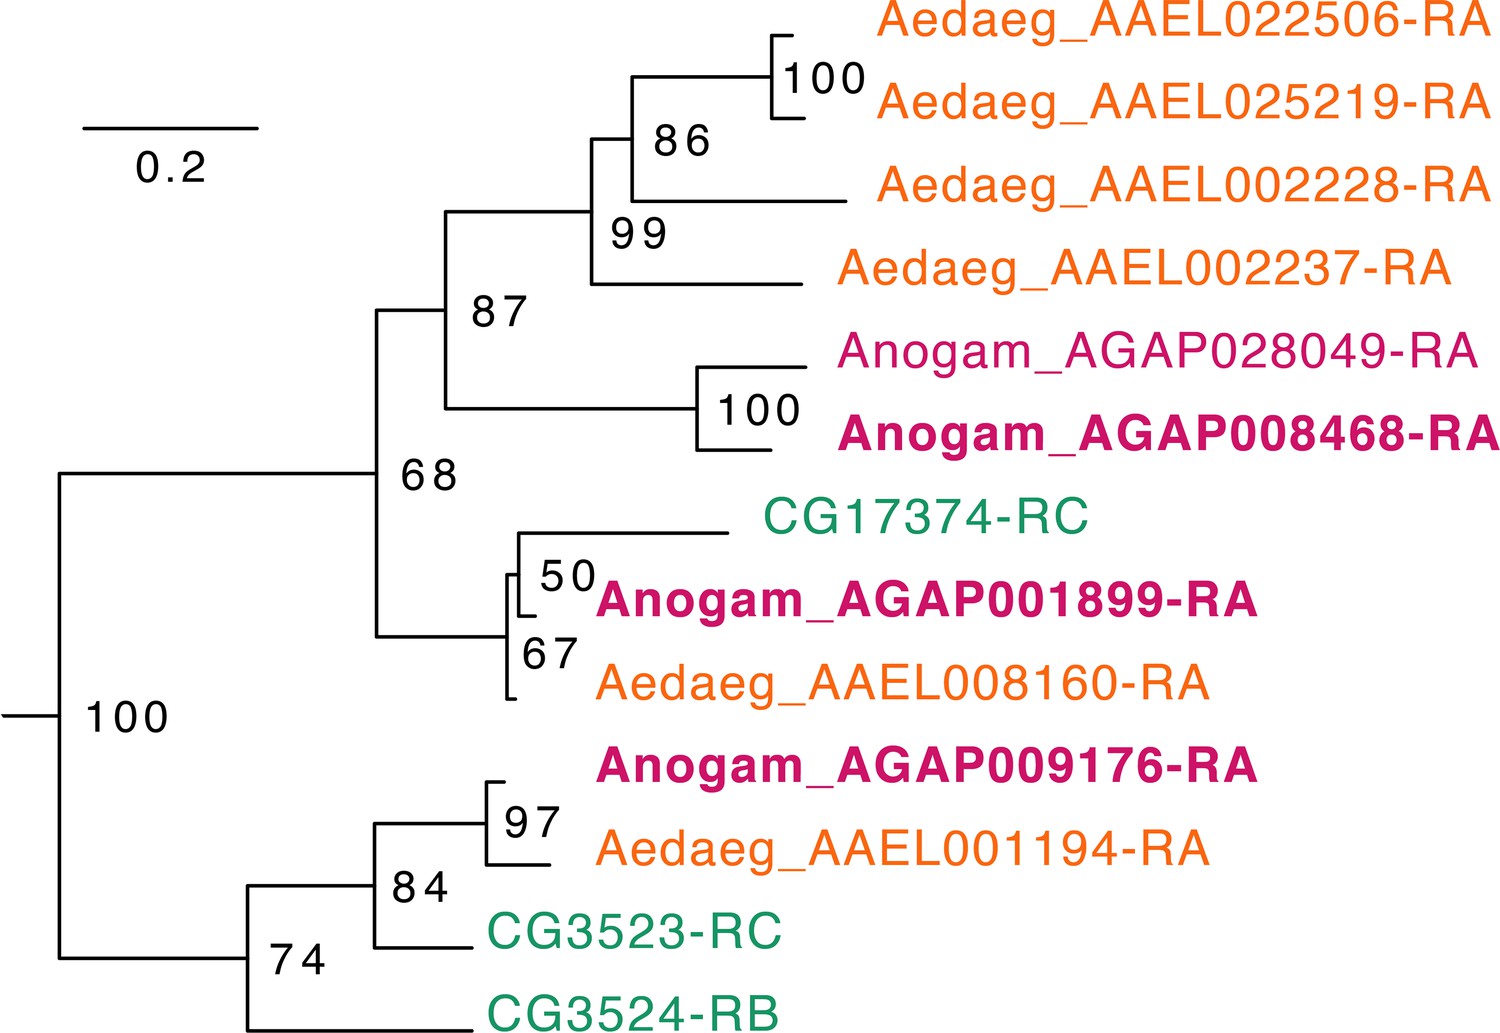
Phylogenetic tree for Anopheles gambiae, Aedes aegypti and Drosophila melanogaster Fatty acid synthases.
Scale bar shows the number of aminoacid substitutions per alignment position. Node supports are % of bootstrap supports on 1000 replications.
Figure 4—figure supplement 2

Phylogenetic tree for Anopheles gambiae, Aedes aegypti and Drosophila melanogaster Desaturases.
Scale bar shows the number of aminoacid substitutions per alignment position. Node supports are % of bootstrap supports on 1000 replications.
Figure 4—figure supplement 3
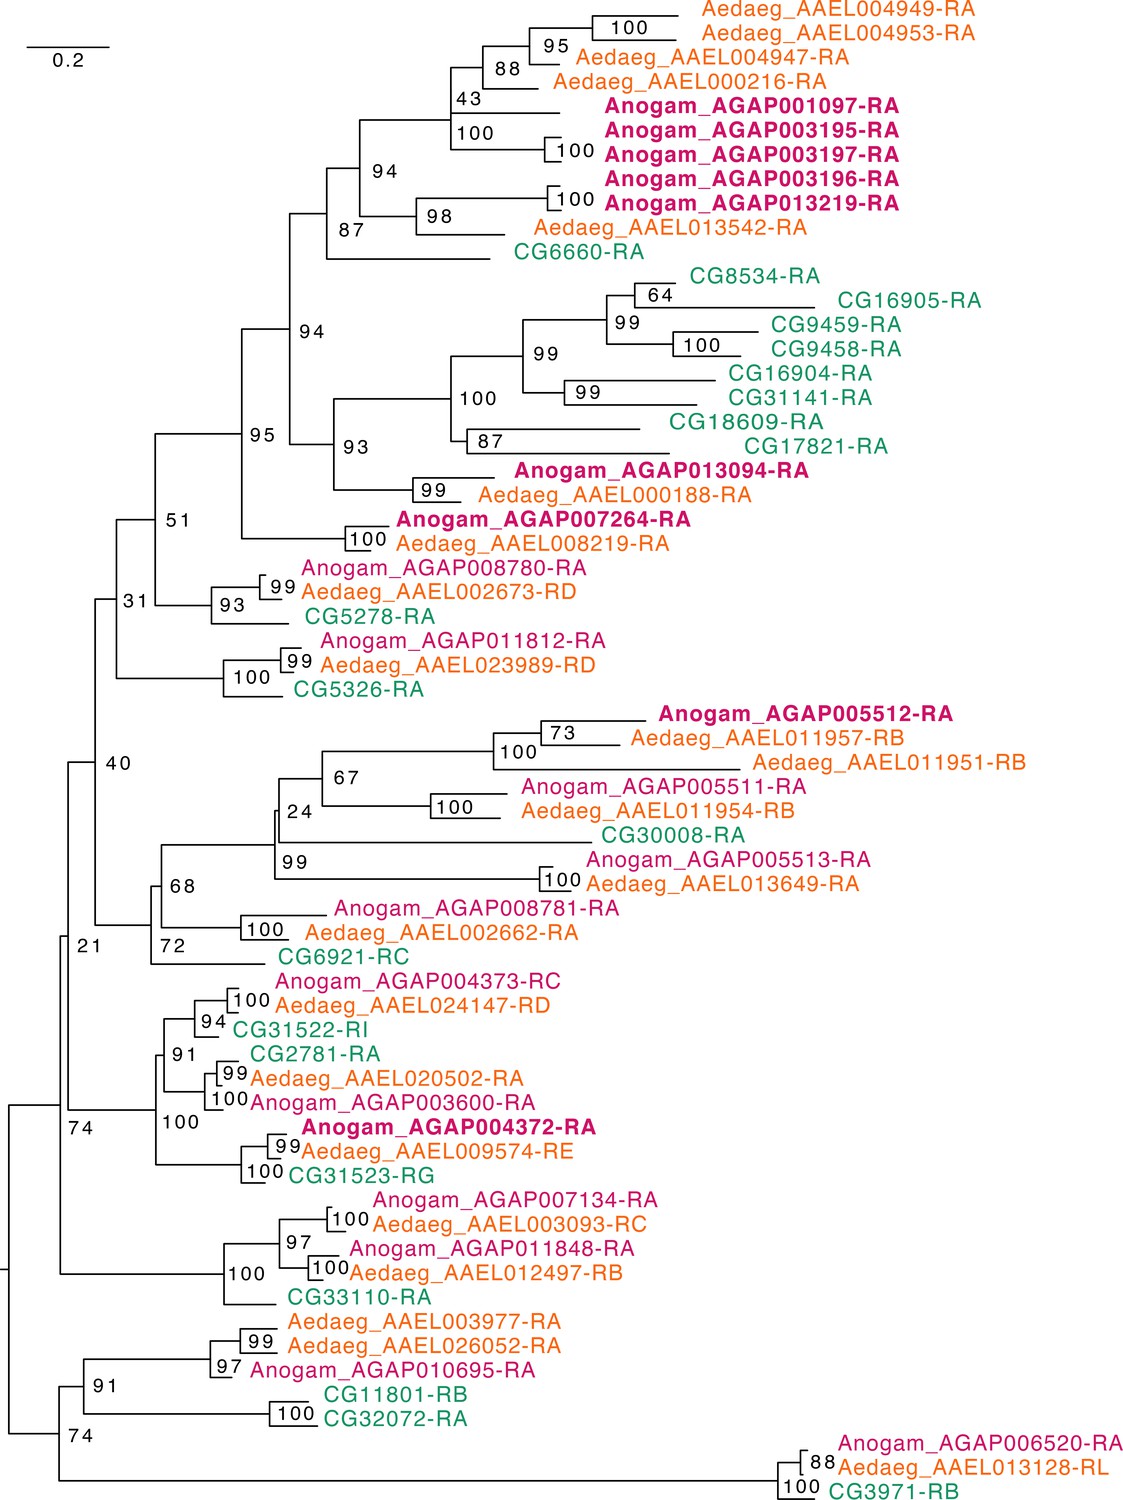
Phylogenetic tree for Anopheles gambiae, Aedes aegypti and Drosophila melanogaster Elongases.
Scale bar shows the number of aminoacid substitutions per alignment position. Node supports are % of bootstrap supports on 1000 replications.
Figure 4—figure supplement 4
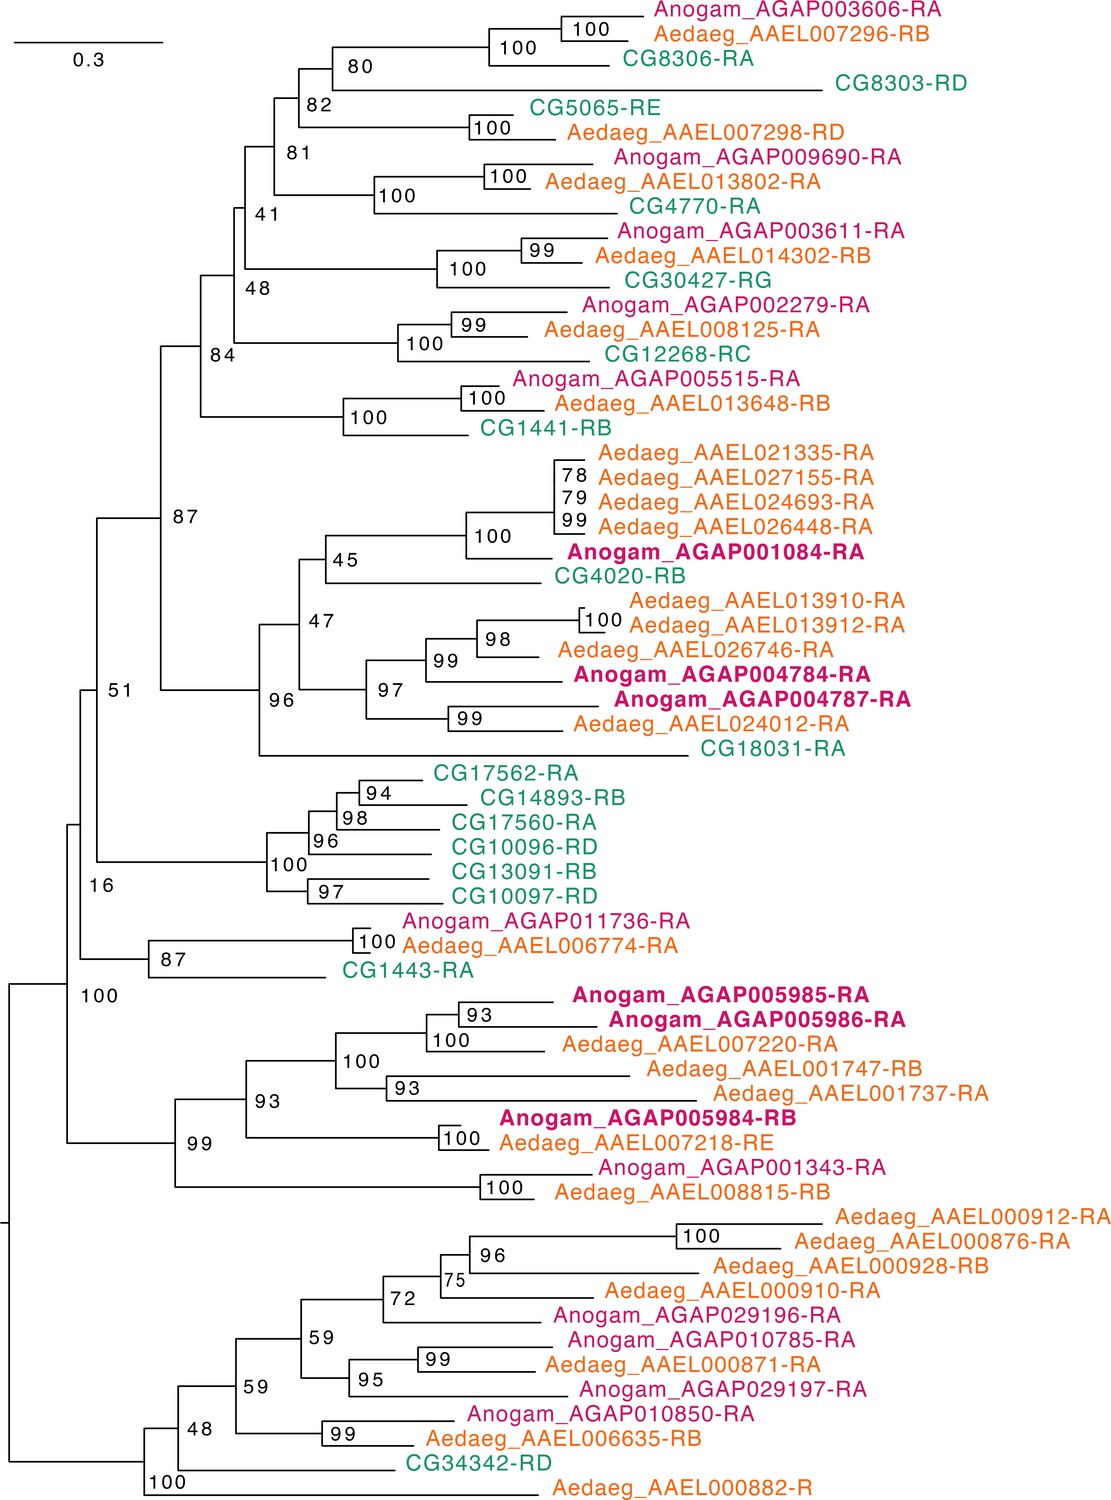
Phylogenetic tree for Anopheles gambiae, Aedes aegypti and Drosophila melanogaster Fatty acyl-CoA reductases.
Scale bar shows the number of aminoacid substitutions per alignment position. Node supports are % of bootstrap supports on 1000 replications.
Figure 5 with 1 supplement
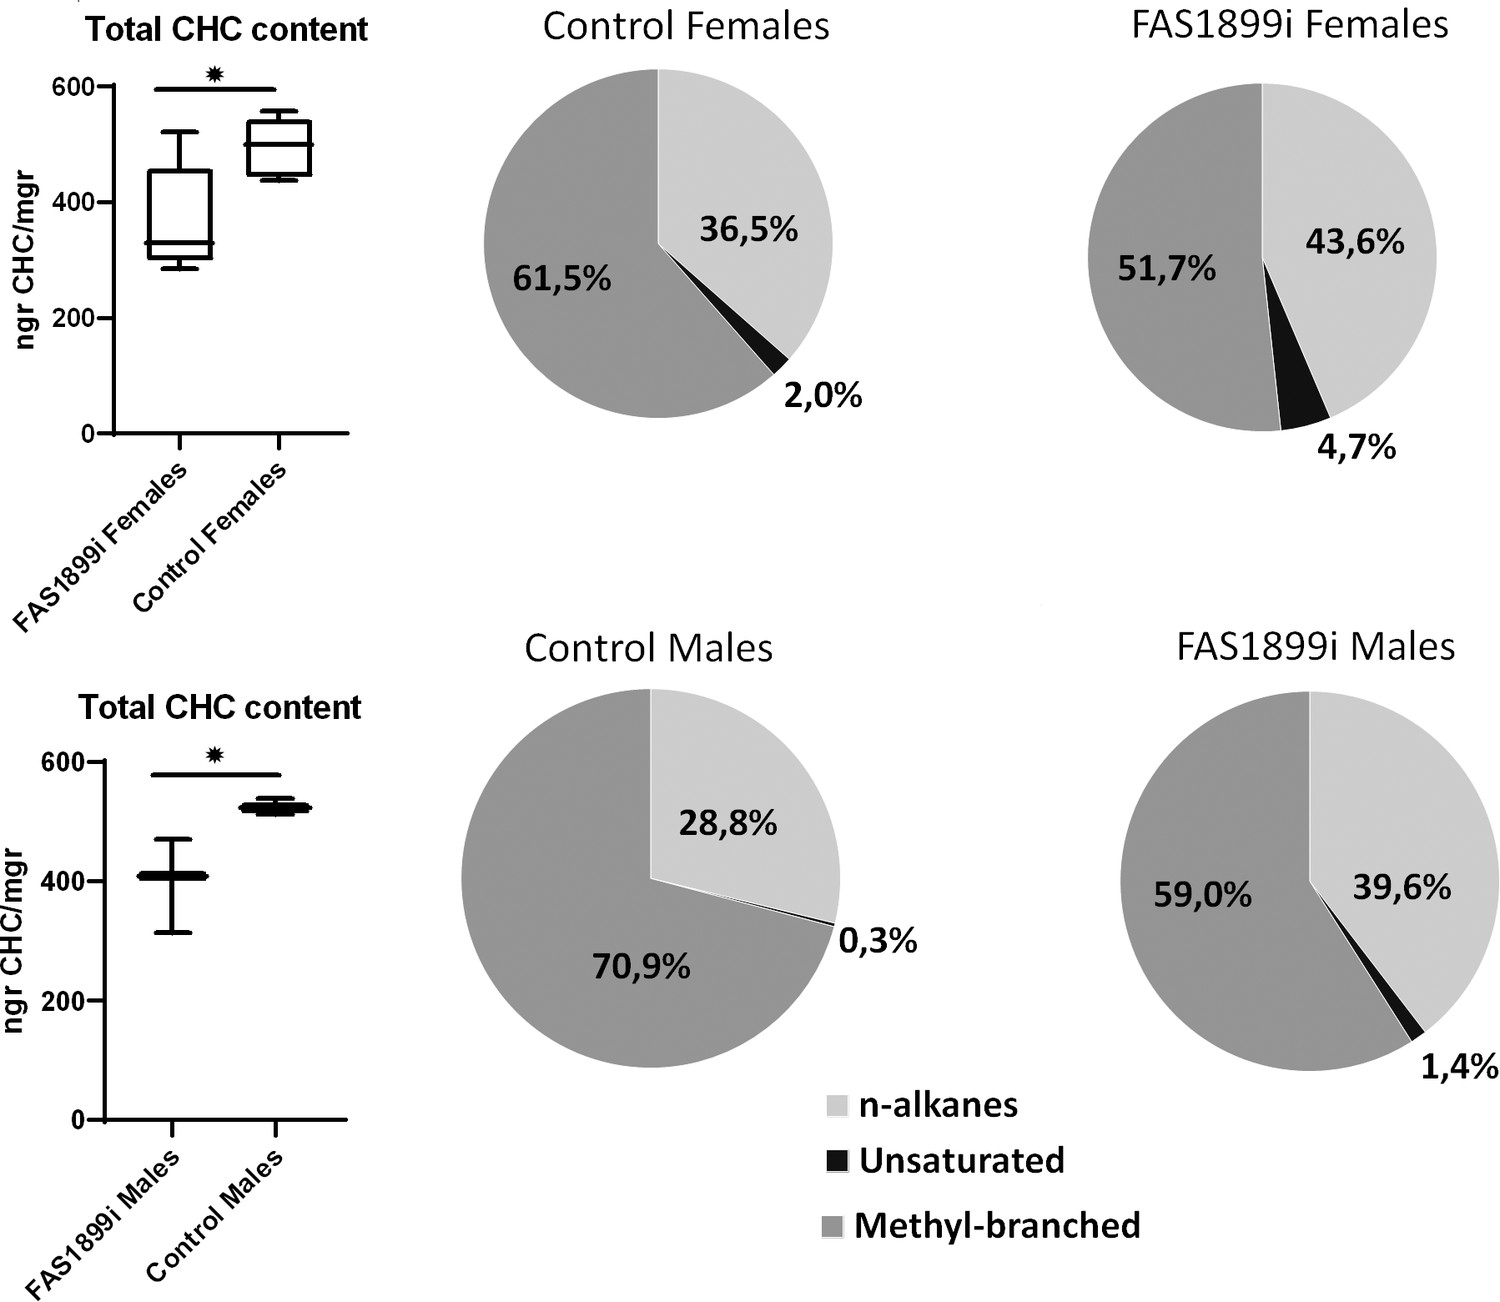
Comparison of the total CHC content quantified with GC-MS in female and male adults with knock down of FAS1899 (Ubi-A10 Gal4/UAS-FAS1899i) and control siblings (heterozygous Ubi-A10 Gal4/+).
The mean values of total CHC/mgr (± SEM) are: for FAS1899i females 368ngr/mgr, for control females 494ngr/mgr, for FAS1899i males 398ngr/mgr and for control males 525ngr/mgr (five biological replicates for females and three for males). The box plots show the 25th and 75th percentile; the mean is shown as a black line within the box; error bars correspond to the minimum and maximum values. Pie charts represent the relative abundance of the three CHC categories (n-alkanes, unsaturated alkanes and methyl-branched alkanes) in FAS1899i and control individuals. Statistical test performed: Student’s t-test (p-value≤0.05), Source data and p-values provided in Figure 5—source data 1.
-
Figure 5—source data 1
GC-MS analysis of CHCs.
The CHC peaks identified in each sample are shown as well as their amount (ngr) (in 2 μl of hexane extract) normalised to the internal standard. A summary of the total ngr of CHCs/mgr is provided for all samples. In the last sheet the FAS1899i females and control females are used to show the relative abundance (in % to the total) of each CHC peak.
- https://cdn.elifesciences.org/articles/58019/elife-58019-fig5-data1-v2.xlsx
Figure 5—figure supplement 1
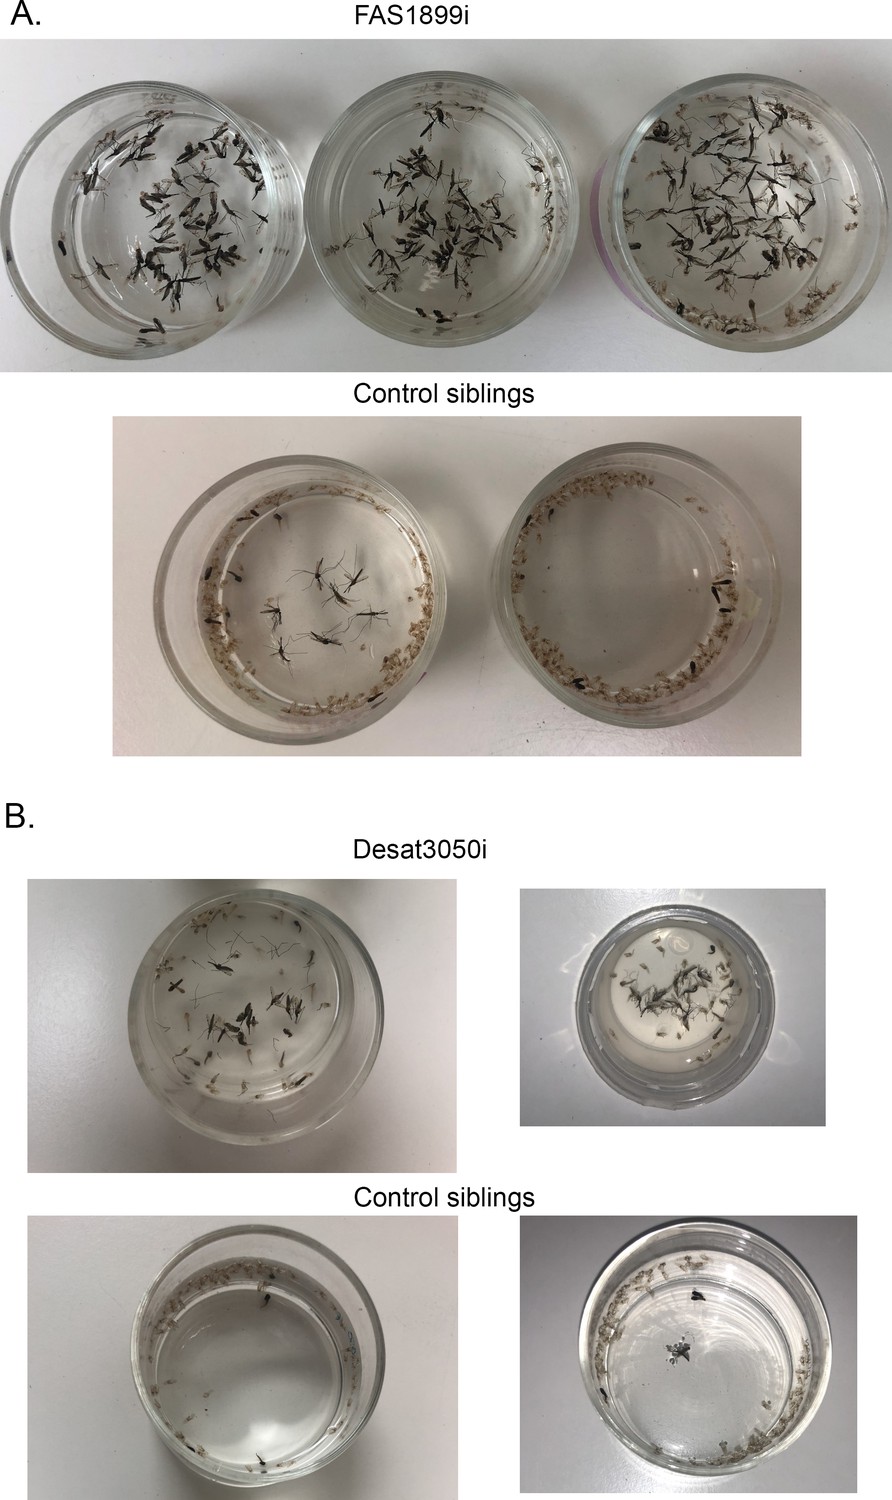
Lethality phenotype of progeny from crosses.
( A) UAS-FAS1899i x Ubi-A10 Gal4 and (B) UAS-Desat3050i x Ubi-A10 Gal4. In each panel the upper photograph corresponds to individuals with FAS1899 or Desat3050 knockdown. The lower photograph corresponds to control siblings, showing the pupae cases left after successful adult emergence.
Appendix 1—figure 1
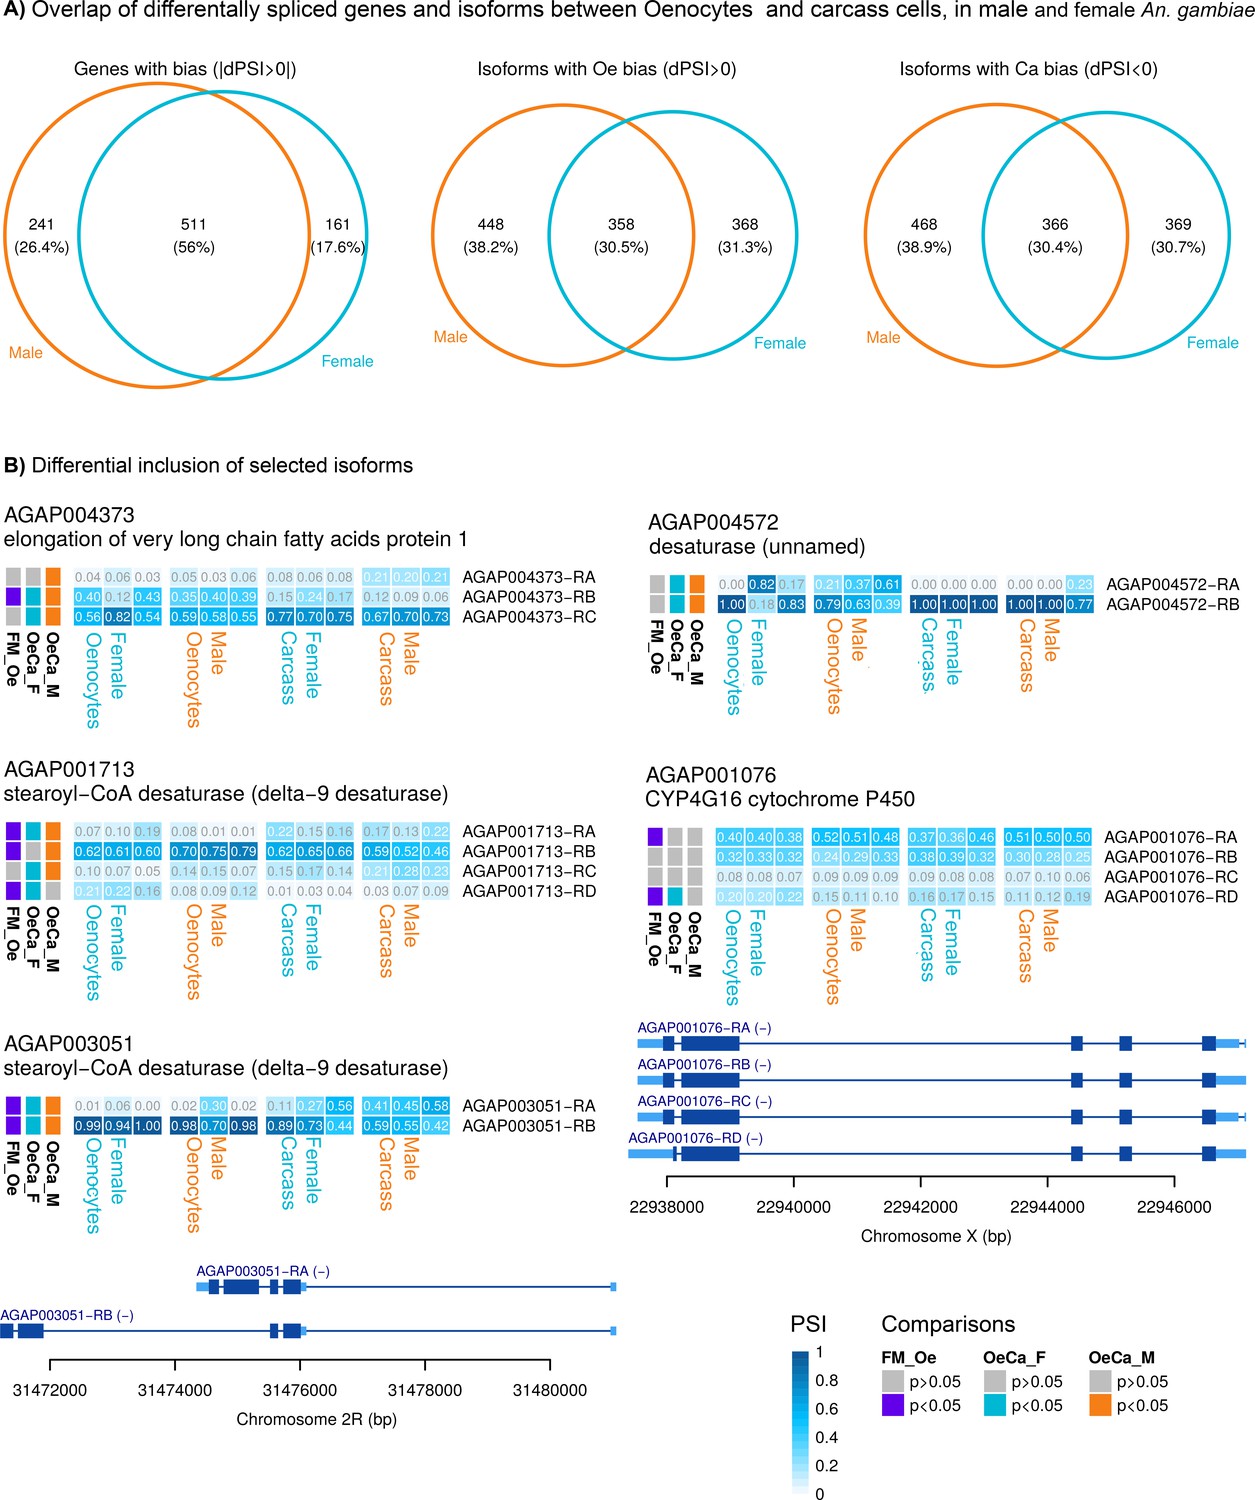
Splice variant analysis.
(A) Venn diagram (on the left) showing the number of genes with differential expression of at least one isoform in female and/or male oenocytes compared to total carcass cells. Venn diagrams showing the number of gene isoforms with enriched (middle diagram) or reduced (right diagram) expression in female and/or male oenocytes compared to total carcass cells. (B) Heat maps showing the frequency (PSI) of isoforms (in each sample used for RNAseq) for genes belonging to gene families implicated in CHC biosynthesis. Isoforms that encode for different proteins are depicted. Comparisons performed: Female Oenocytes vs Female total carcass cells (OeCa_F), Male Oenocytes vs Male total carcass cells (OeCa_M), Female Oenocytes vs Male Oenocytes (FM_Oe). Source data: Supplementary file 2.
-
Appendix 1—figure 1—source data 1
Genes showing isoform specific differential expression in oenocytes.
Comparisons performed are: Female Oenocytes vs Female total Carcass cells (sheet 1), Male Oenocytes vs Male total Carcass cells (sheet 2) and Female Oenocytes vs Male Oenocytes (sheet 3).
- https://cdn.elifesciences.org/articles/58019/elife-58019-app1-fig1-data1-v2.xlsx
Tables
Key resources table
| Reagent type (species) or resource | Designation | Source or reference | Identifiers | Additional information |
|---|---|---|---|---|
| Gene (Anopheles gambiae) | AGAP001899 | NA | NCBI Gene ID: 1281226 | |
| Gene (Anopheles gambiae) | AGAP003050 | NA | NCBI Gene ID: 1272902 | |
| Genetic reagent (An. gambiae) | UAS-mCD8: mCherry responder line | doi: https://doi.org/10.1016/j.ibmb.2018.03.005 | NA | Transgenic line previously generated in Adolfi et al., 2018 and referred to as UAS-mCD8:mCherry line. Contains the coding sequence for the m-cherry fluorescent protein under the UAS promoter |
| Genetic reagent (An. gambiae) | Ubi-A10 Gal4 driver line | doi: https://doi.org/10.1016/j.ibmb.2018.03.005 | NA | Transgenic line previously generated in Adolfi et al., 2018 and referred to as PUBc-GAL4. Contains the coding sequence for the Gal4 transcription factor under the control of the An. gambiae Polyubiquitin-c (PUBc) gene |
| Genetic reagent (An. gambiae) | Oeno-Gal4 driver line | doi: https://doi.org/10.1101/742619 | NA | Transgenic line previously generated in Lynd et al., 2019 and referred to as A14Gal4. Contains the coding sequence for the Gal4 transcription factor under the control of an oenocyte specific enhancer |
| Genetic reagent (An. gambiae) | A11 docking line | doi: https://doi.org/10.1101/742619 | NA | Transgenic line previously generated in Lynd et al., 2019. It is carrying two AttP docking sites flanking 3xP3:eCFP marker gene. Used for phiC31 driven RMCE of UAS-inverted repeat contructs tagged with alternative fluorescent marker gene |
| Genetic reagent (An. gambiae) | UAS-FAS1899i Responder line | This paper | NA | Transgenic line generated in this study carrying inverted repeats targeting the FAS1899 gene under the control of the UAS promoter |
| Genetic reagent (An. gambiae) | UAS-Desat3050i Responder line | This paper | NA | Transgenic line generated in this study carrying inverted repeats targeting the FAS1899 gene under the control of the UAS promoter (See Materials and methods section) |
| Recombinant DNA reagent | pSL*attB:YFP:Gyp:UAS14i:Gyp:attB (plasmid) | doi: https://doi.org/10.1101/742619 | Used to synthesise the inverted repeats for the generation of FAS1899i and Desat3050i transgenic lines (See Materials and methods section) | |
| Commercial assay or kit | Arcturus PicoPure RNA Isolation Kit | Thermo Fisher | Cat. #: KIT0204 |
Additional files
-
Supplementary file 1
Genes differentially expressed in female oenocytes vs female total carcass cells (sheet 1); in male oenocytes vs male total carcass cells (sheet 2) and genes commonly over-expressed in female and male oenocytes compared to female and male total carcass cells (sheet 3).
- https://cdn.elifesciences.org/articles/58019/elife-58019-supp1-v2.xlsx
-
Supplementary file 2
Genes, members of gene families implicated in CHC biosynthesis and over-expressed in oenocytes, ranked in order of highest to lowest expression in Female Oenocytes.
Their differential expression (Log2Fold change) compared to female carcass cells is also shown. Genes above the double line are within the 200 most highly expressed genes.
- https://cdn.elifesciences.org/articles/58019/elife-58019-supp2-v2.docx
-
Supplementary file 3
Genes, members of gene families implicated in CHC biosynthesis and over-expressed in oenocytes, ranked in order of highest to lowest expression in Male Oenocytes.
Their differential expression (Log2Fold change) compared to male carcass cells is also shown. Genes above the double line are within the 200 most highly expressed genes.
- https://cdn.elifesciences.org/articles/58019/elife-58019-supp3-v2.docx
-
Supplementary file 4
Genes differentially expressed in female oenocytes vs male oenocytes.
- https://cdn.elifesciences.org/articles/58019/elife-58019-supp4-v2.xlsx
-
Supplementary file 5
Samples used for Illumina RNAseq.
Number of raw reads produced for each sample and number of reads after quality control.
- https://cdn.elifesciences.org/articles/58019/elife-58019-supp5-v2.docx
-
Transparent reporting form
- https://cdn.elifesciences.org/articles/58019/elife-58019-transrepform-v2.docx
-
Appendix 1—figure 1—source data 1
Genes showing isoform specific differential expression in oenocytes.
Comparisons performed are: Female Oenocytes vs Female total Carcass cells (sheet 1), Male Oenocytes vs Male total Carcass cells (sheet 2) and Female Oenocytes vs Male Oenocytes (sheet 3).
- https://cdn.elifesciences.org/articles/58019/elife-58019-app1-fig1-data1-v2.xlsx
Download links
A two-part list of links to download the article, or parts of the article, in various formats.
Downloads (link to download the article as PDF)
Open citations (links to open the citations from this article in various online reference manager services)
Cite this article (links to download the citations from this article in formats compatible with various reference manager tools)
Isolation and transcriptomic analysis of Anopheles gambiae oenocytes enables the delineation of hydrocarbon biosynthesis
eLife 9:e58019.
https://doi.org/10.7554/eLife.58019


