The RIF1-long splice variant promotes G1 phase 53BP1 nuclear bodies to protect against replication stress
- Institute of Medical Sciences, University of Aberdeen, United Kingdom
- Department of Chromosome Science, National Institute of Genetics, Research Organization of Information and Systems (ROIS), Japan
- Department of Genetics, The Graduate University for Advanced Studies (SOKENDAI), Japan
- MRC Human Genetics Unit, The University of Edinburgh, United Kingdom
Figures
Figure 1 with 1 supplement
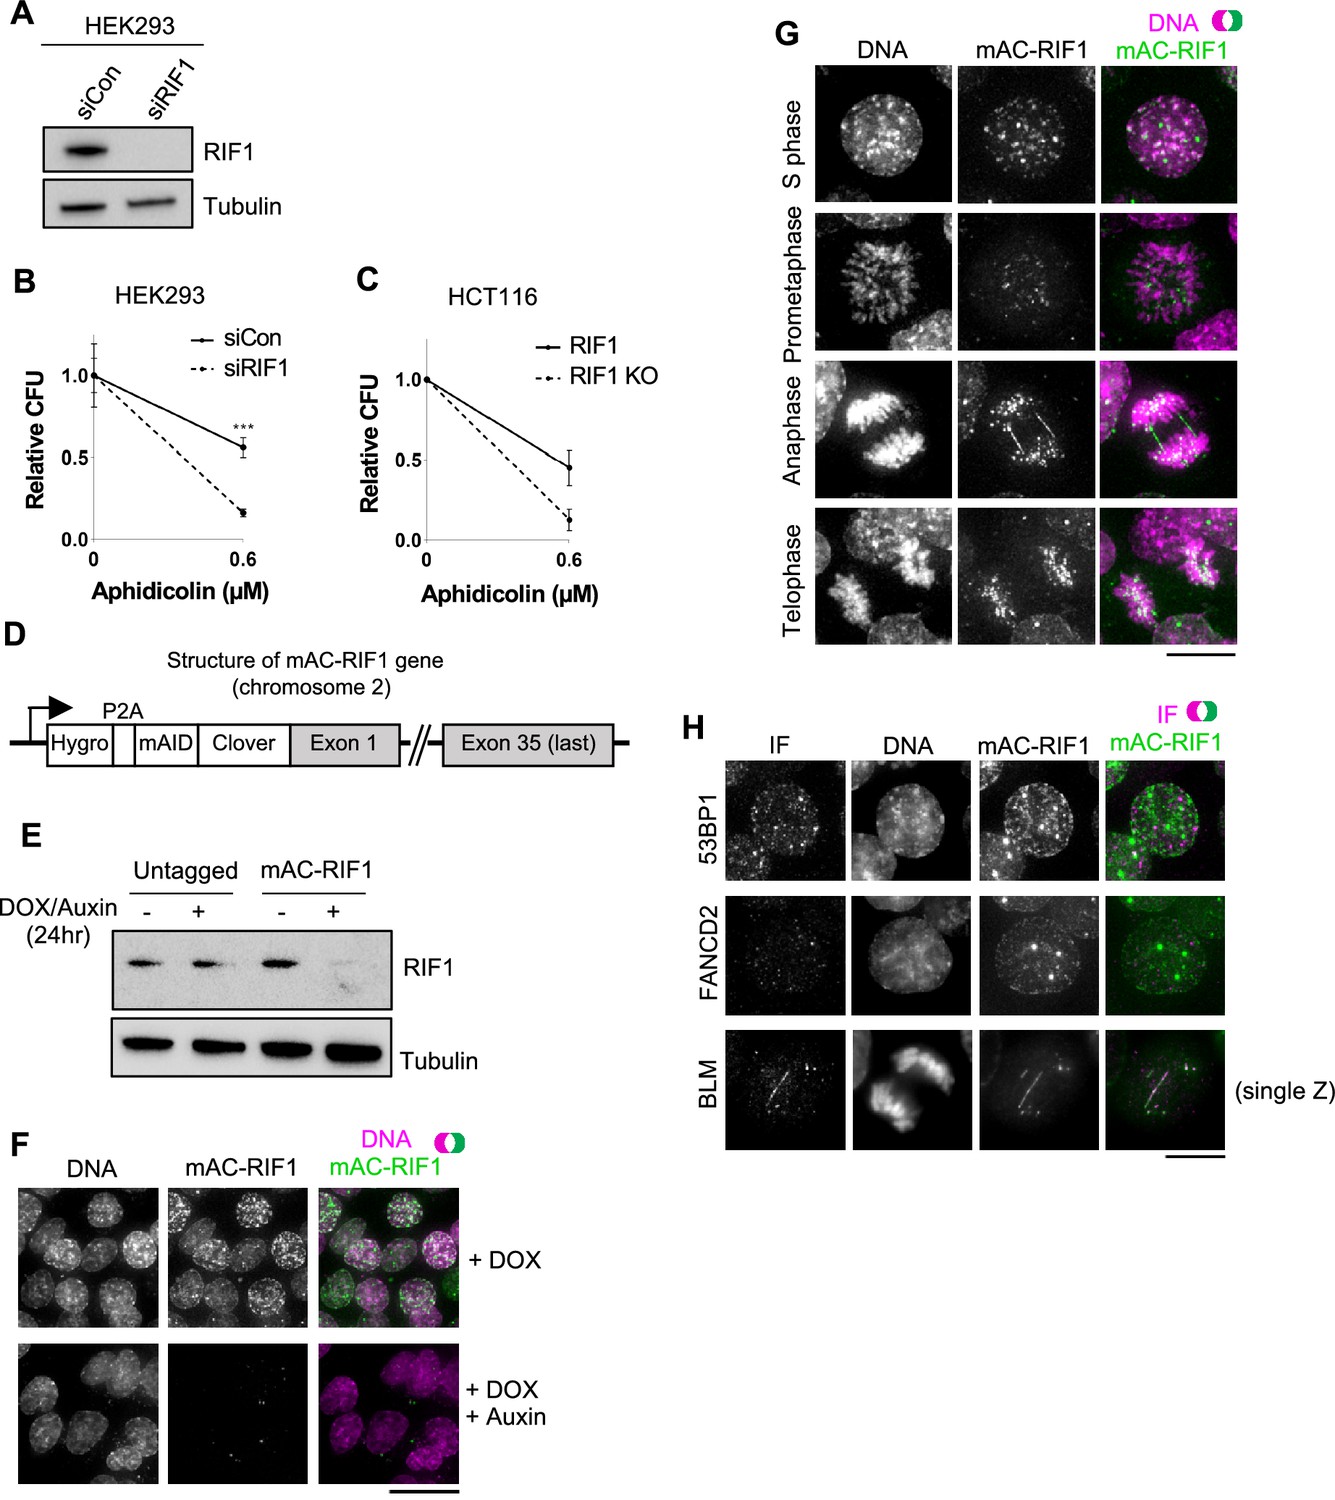
Characterisation of HCT116-based cell lines with auxin-inducible Degron-tagged RIF1.
(A) Confirmation of siRIF1 efficacy three days after siRNA transfection. Whole cell protein extracts were analysed by western blotting with anti-RIF1 antibody. Tubulin shown as a loading control. (B) Colony Formation Assay (CFA) confirming Aphidicolin sensitivity of HEK293 cells treated with siRIF1. Plot shows mean and range of technical triplicates. ***p<0.001. (C) CFA testing Aphidicolin sensitivity of HCT116 RIF1-KO cells. ‘RIF1’ cell line is HCT116 mAC-RIF1. Plot shows mean and range from two biological replicates (each performed in technical triplicate). (D) Structure of auxin-inducible degron (AID)-tagged RIF1 construct (mAC-RIF1), located at both endogenous RIF1 loci in HCT116 cells carrying the auxin-responsive F-box protein Oryza sativa TIR1 (OsTIR1) under DOX control. The RIF1 gene is fused to a tag containing a self-cleaving P2A peptide, hygromycin resistance marker, mini-auxin-inducible degron (mAID) and monomer Clover (mClover) protein. After self-cleavage at the P2A, RIF1 protein is expressed as N-terminal in-frame fusion with mAID and Clover. (E) Confirmation of mAC-RIF1 protein degradation. Cells were incubated with 2 μg/ml DOX and 500 μM Auxin for 24 hr, then protein extracts analysed by western blotting with antibody against RIF1. Tubulin is shown as a loading control. Testing of drug concentrations is shown in Figure 1—figure supplement 1. (F) mAC-RIF1 degradation assessed by microscopy. mAC-RIF1 cells were treated with 2 μg/ml DOX and 500 μM Auxin for 24 hr. DNA was stained with SiR-DNA (magenta). Scale bar = 10 µm. (G) Examples of mAC-RIF1 localisation at different cell cycle stages. DNA stained with SiR-DNA. Scale bar = 10 µm. (H) mAC-RIF1 co-localises with BLM at UFBs but not with 53BP1 or FANCD2 repair proteins. Fixed cells were stained with the above-mentioned antibodies. Scale bar = 10 µm.
Figure 1—figure supplement 1
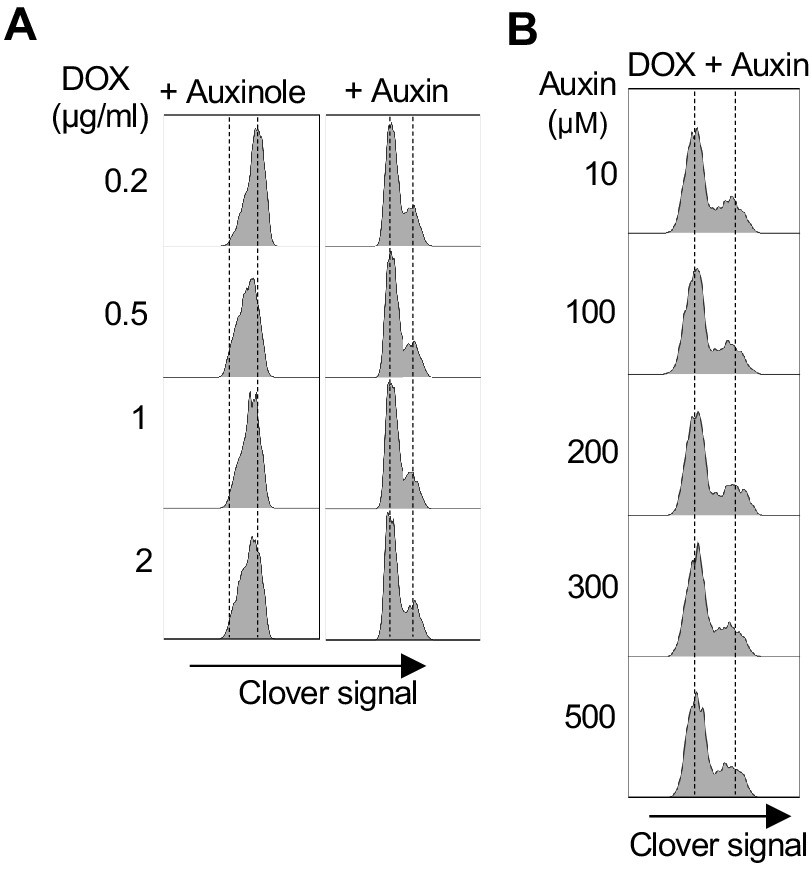
Characterisation and testing of mAC-RIF1 depletion.
(A) Testing DOX concentration for TIR1 induction in HCT116 mAC-RIF1 cell line. Cells were treated with DOX concentrations indicated and mClover signal was analysed by flow cytometry, establishing that treatment with DOX in the range 0.2–2.0 μg/ml is sufficient for degradation. (B) Testing of Auxin for SCF-OsTIR1-mediated RIF1 depletion in HCT116 mAC-RIF1 cell line. Cells were treated with Auxin concentrations indicated and mClover signal was analysed by flow cytometry, establishing that 10 μM Auxin is sufficient for degradation.
Figure 2 with 2 supplements
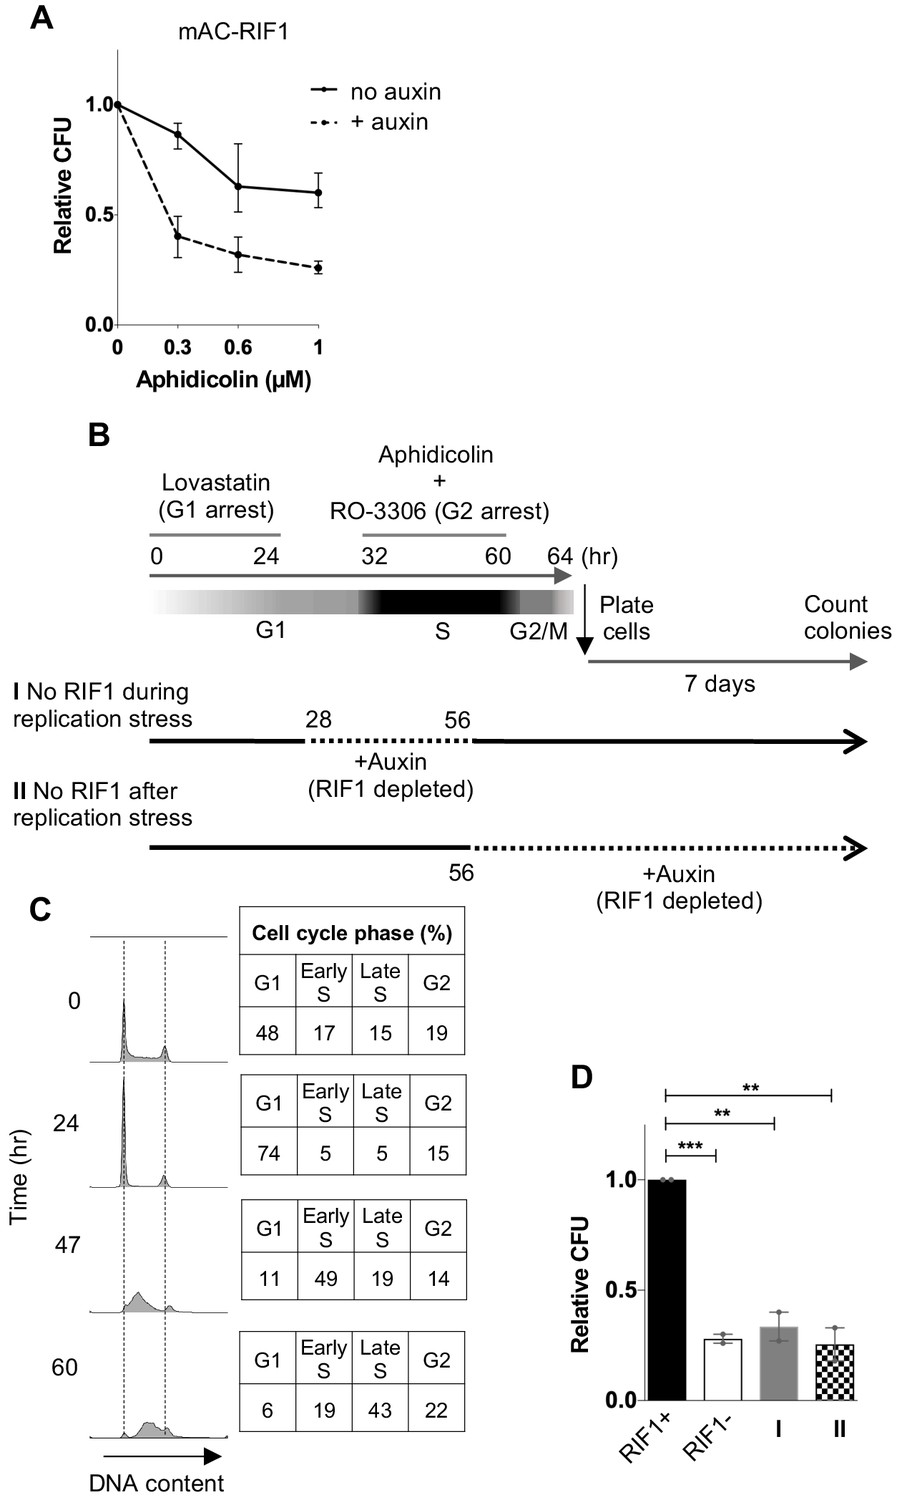
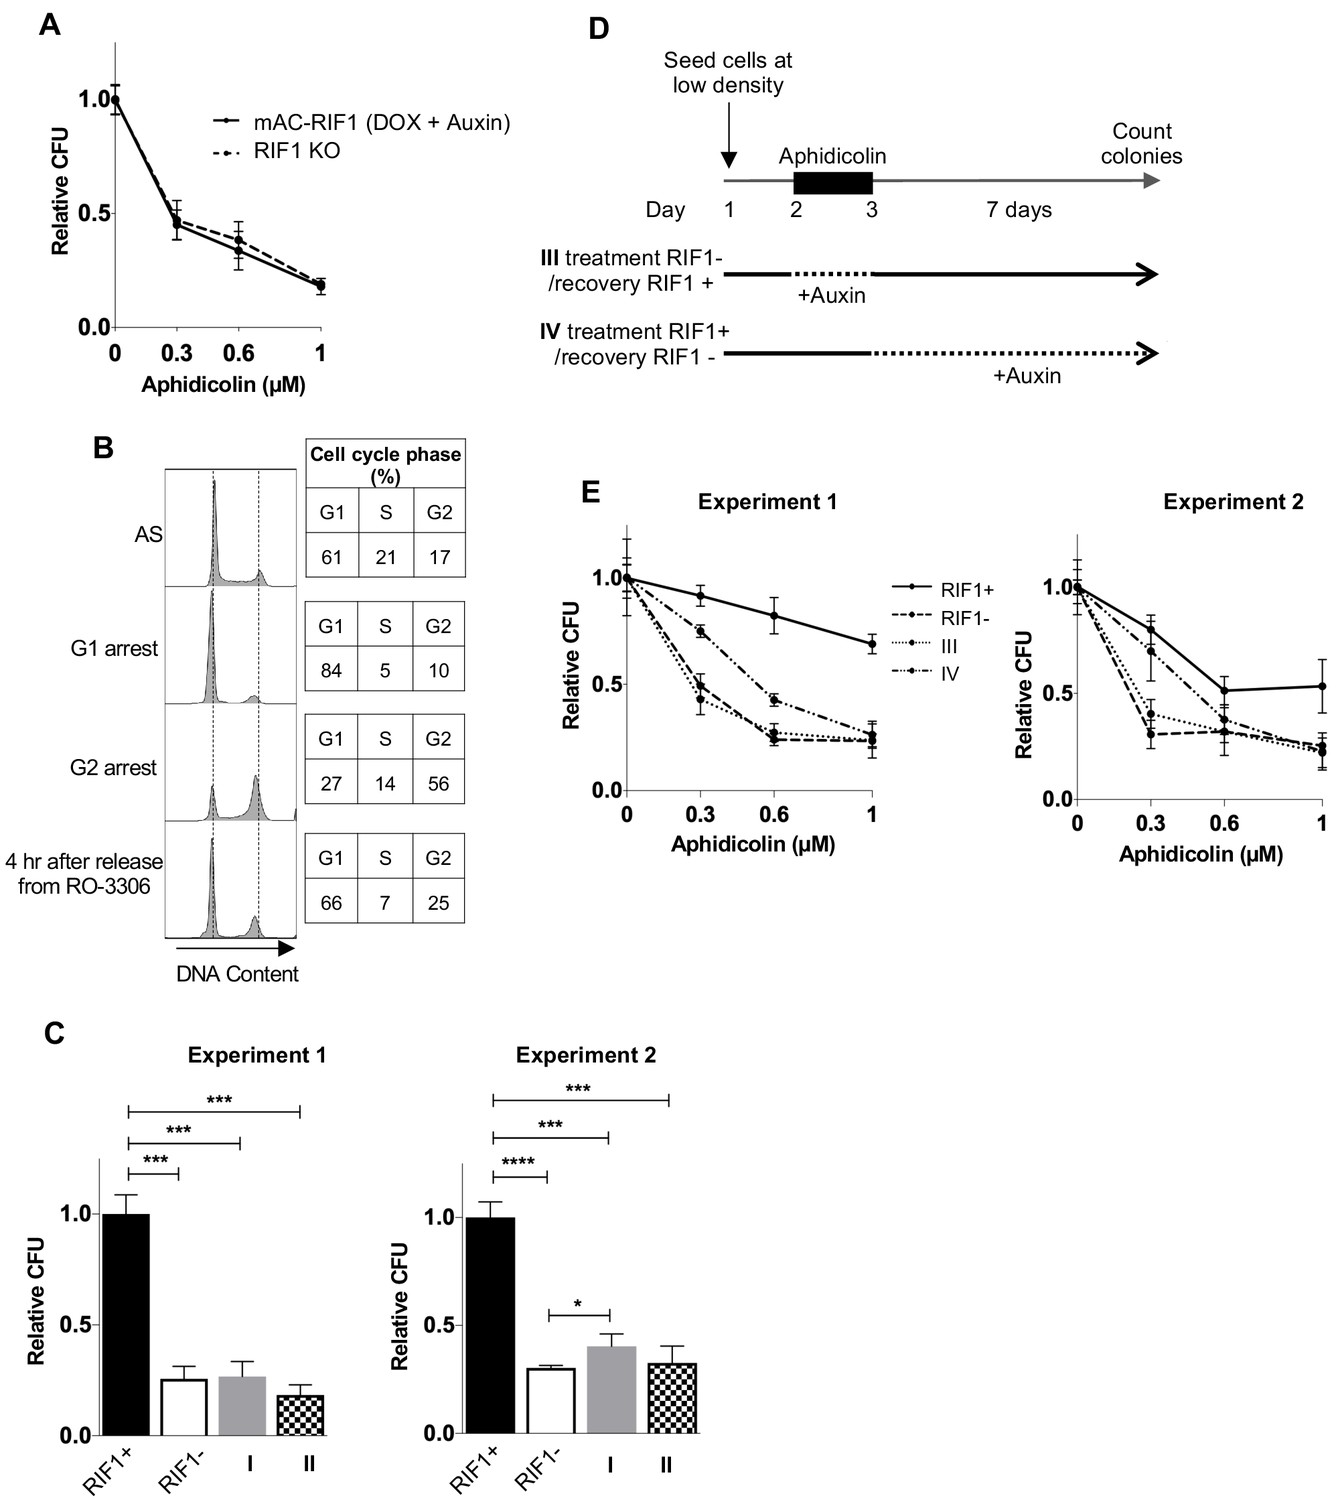
RIF1 is essential during and after drug treatment to protect against effects of replication stress.
(A) CFA testing Aphidicolin sensitivity of HCT116 mAC-RIF1 cells depleted for RIF1. Cells were treated with DOX and Auxin for 48 hr before seeding at low density and treatment with Aphidicolin at the concentrations indicated. ‘No Auxin’ cells were treated with DOX and Auxinole. After Aphidicolin removal, medium was replaced with DOX + Auxin medium for ‘+ Auxin’ cells or DOX + Auxinole medium for ‘No Auxin’ cells. Plot shows mean and range from three biological replicates, each plated in technical triplicate. (B) Procedure for testing effect of depleting RIF1 during or after Aphidicolin treatment in synchronised cultures. HCT116 mAC-RIF1 cells were incubated with Lovastatin to arrest cells in G1. After 24 hr, cells were released from G1 arrest with Mevalonic Acid. 4 hr into release (28 hr from the initial addition of Lovastatin), RIF1 depletion was induced in ‘condition I’ cells by addition of DOX and Auxin. 8 hr into release (32 hr), 1 μM Aphidicolin was added (to both cultures) to induce replication stress and simultaneously, RO-3306 was added to arrest cells in G2 phase. 24 hr later (at 56 hr), in ‘condition I’ cells RIF1 was re-expressed by removal of DOX and Auxin and addition of Auxinole. Also at 56 hr, in ‘condition II’ cells RIF1 depletion was induced by addition of DOX and Auxin. 4 hr later (60 hr), both cell cultures were released from RO-3306. After 4 hr (64 hr), cells were seeded in triplicate at 250/well in 6-well plates (condition I in medium containing DOX + Auxinole and condition II in medium containing DOX + Auxin) then incubated for 7 days after which colonies were counted. mAC-RIF1 depletion and re-expression data is shown in Figure 2—figure supplement 1. (C) Cell cycle progression in HCT116 mAC-RIF1 cells during the procedure shown in B. Synchronisation was performed as in B using 1 μM Aphidicolin. Histograms show distribution of cellular DNA content at the time indicated. Tables show % of cells in each cell cycle phase at the time indicated. (D) Effect on colony formation efficiency of mAC-RIF1 depletion procedures with 1 μM Aphidicolin treatment: ‘condition I’ and ‘condition II’ cells were treated according to the procedure in B. RIF1+ and RIF1- correspond to control mAC-RIF1 cells in which RIF1 was either expressed or depleted throughout the procedure. Values shown are normalised to the RIF1+ control. Plot shows the mean and range from two biological replicates, each plated in technical triplicate. **p<0.01; ***p<0.001. See Figure 2—figure supplement 2C for individual plots.
Figure 2—figure supplement 1
mAC-RIF1 depletion and re-expression.
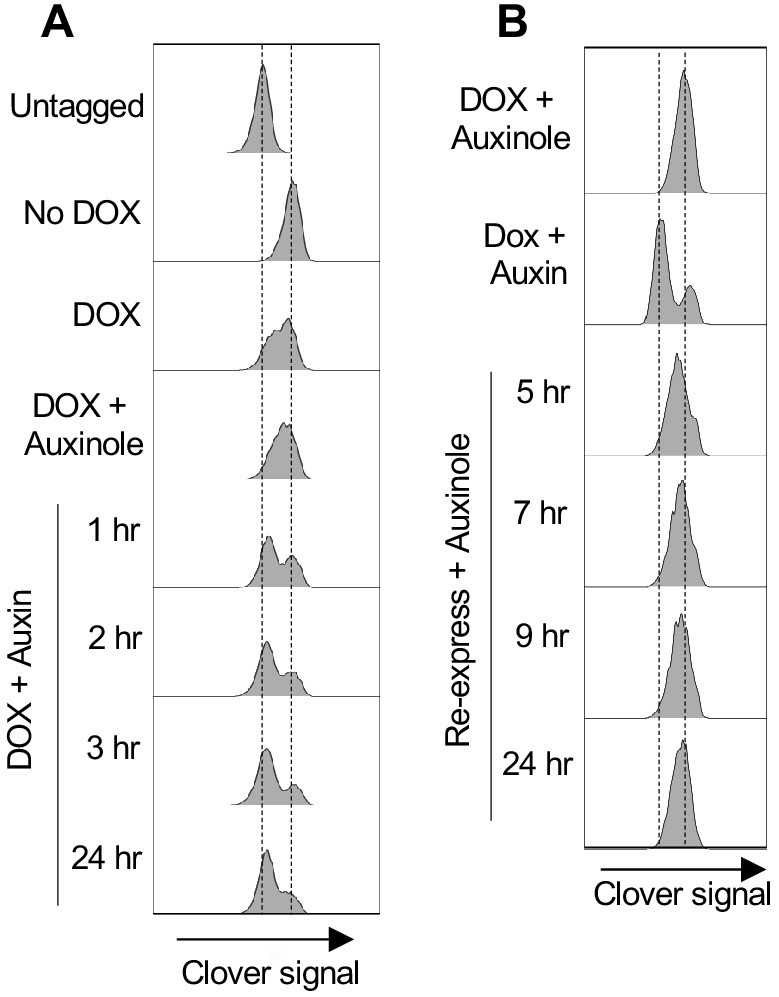
(A) mAC-RIF1 depletion analysed by flow cytometry. Cells were treated with 2 μg/ml DOX and Auxinole for 24 hr (plot four from top; Auxinole suppresses reduction in mAC-RIF1 fluorescence caused by OsTIR1 induction with DOX only), then medium was replaced with 2 μg/ml DOX and 500 μM Auxin for the indicated time periods (plots 5–8). Plots 1–3 respectively show mClover signal in untagged cells, and in mAC-RIF1 cells treated with no drug or DOX only. Samples were taken at the indicated time points and mClover signal analysed by flow cytometry. mAC-RIF1 depletion was largely complete after 3 hr of Auxin treatment, as assessed by comparison with a DOX + Auxin 24 hr sample (seventh and eighth plots). (B) Testing re-expression of mAC-RIF1 following a period of depletion. RIF1 was first depleted by adding DOX and Auxin for 24 hr. Cells were washed three times after which Auxinole-containing medium was added. Samples were taken at the indicated time points and mClover signal analysed by flow cytometry. Based on the kinetics of RIF1 depletion and re-expression, a 4 hr window was allowed for complete depletion or re-expression of RIF1.
Figure 2—figure supplement 2
In asynchronous cycling cells, RIF1 is essential during and after drug treatment to protect against effects of replication stress.
(A) CFA comparing Aphidicolin sensitivity of HCT116 cells depleted for RIF1 and RIF1 KO cells. HCT116 mAC-RIF1 cells and HCT116 RIF1 KO cells were seeded at low density, then the HCT116 mAC-RIF1 cells were treated with DOX and Auxin for 24 hr, before treatment of both cell lines with Aphidicolin at concentrations indicated. Plot shows mean and standard deviation from one experiment, carried out in technical triplicate. (B) Synchronisation of HCT116 mAC-RIF1 cells. Cells were arrested at G1 phase with Lovastatin for 24 hr (‘G1 arrest’) then released with Mevalonic acid. After 8 hr, RO-3306 was added to arrest cells in G2 phase (no Aphidicolin). 19 hr later (‘G2 arrest’), cells were released by washing out the RO-3306, and sampled 4 hr later. Samples were taken at the indicated points through the experiment and DNA stained with PI prior to flow cytometry analysis. Tables show % of cells in each cell cycle phase at the time indicated. (C) Results of individual experiments testing effect on colony formation of mAC-RIF1 depletion during or after 1 μM Aphidicolin treatment, treated according to ‘condition I’ or ‘condition II’ procedures shown in Figure 2B. RIF1+ and RIF1- correspond to control mAC-RIF1 cells with RIF1 either expressed or depleted throughout the experiment. Values were normalised to the RIF1+ condition. *p<0.05; ***p<0.001; ****p<0.0001. (D) Outline of procedure for testing effect of RIF1 depletion either during or after Aphidicolin treatment, in asynchronous cultures. Cells were seeded at 250 cells/well in 6-well plates in the presence of DOX and Auxinole. On day 2, Aphidicolin was added, and then removed on day 3. Cells were incubated for 7 days after which colonies were counted. For condition III (treatment RIF1-/recovery RIF1+), RIF1 was depleted during the drug treatment period, with DOX and Auxin added to the medium 3 hr before Aphidicolin was added. 3 hr before the end of the drug treatment, RIF1 was re-expressed for the recovery period by replacing medium with medium containing Auxinole. For condition IV (treatment RIF1+/recovery RIF1-), DOX and Auxinole were maintained in the medium until 3 hr before the end of the drug treatment when it was replaced with medium containing DOX and Auxin to induce RIF1 depletion for the recovery period. (E) Results of experiment outlined in D testing whether RIF1 is needed during or after drug treatment to protect cells from replication stress. HCT116 mAC-RIF1 cells were depleted of RIF1 either during the 24 hr Aphidicolin treatment (condition III) or during the recovery period (condition IV). For the ‘RIF1-’ condition, RIF1 was depleted by DOX and Auxin addition 24 hr before drug treatment. Experiment two is a duplicate experiment, except that a window of 4 hr was used for depletion and re-expression of RIF1 Plot shows mean and standard deviation of technical triplicate.
Figure 3 with 5 supplements
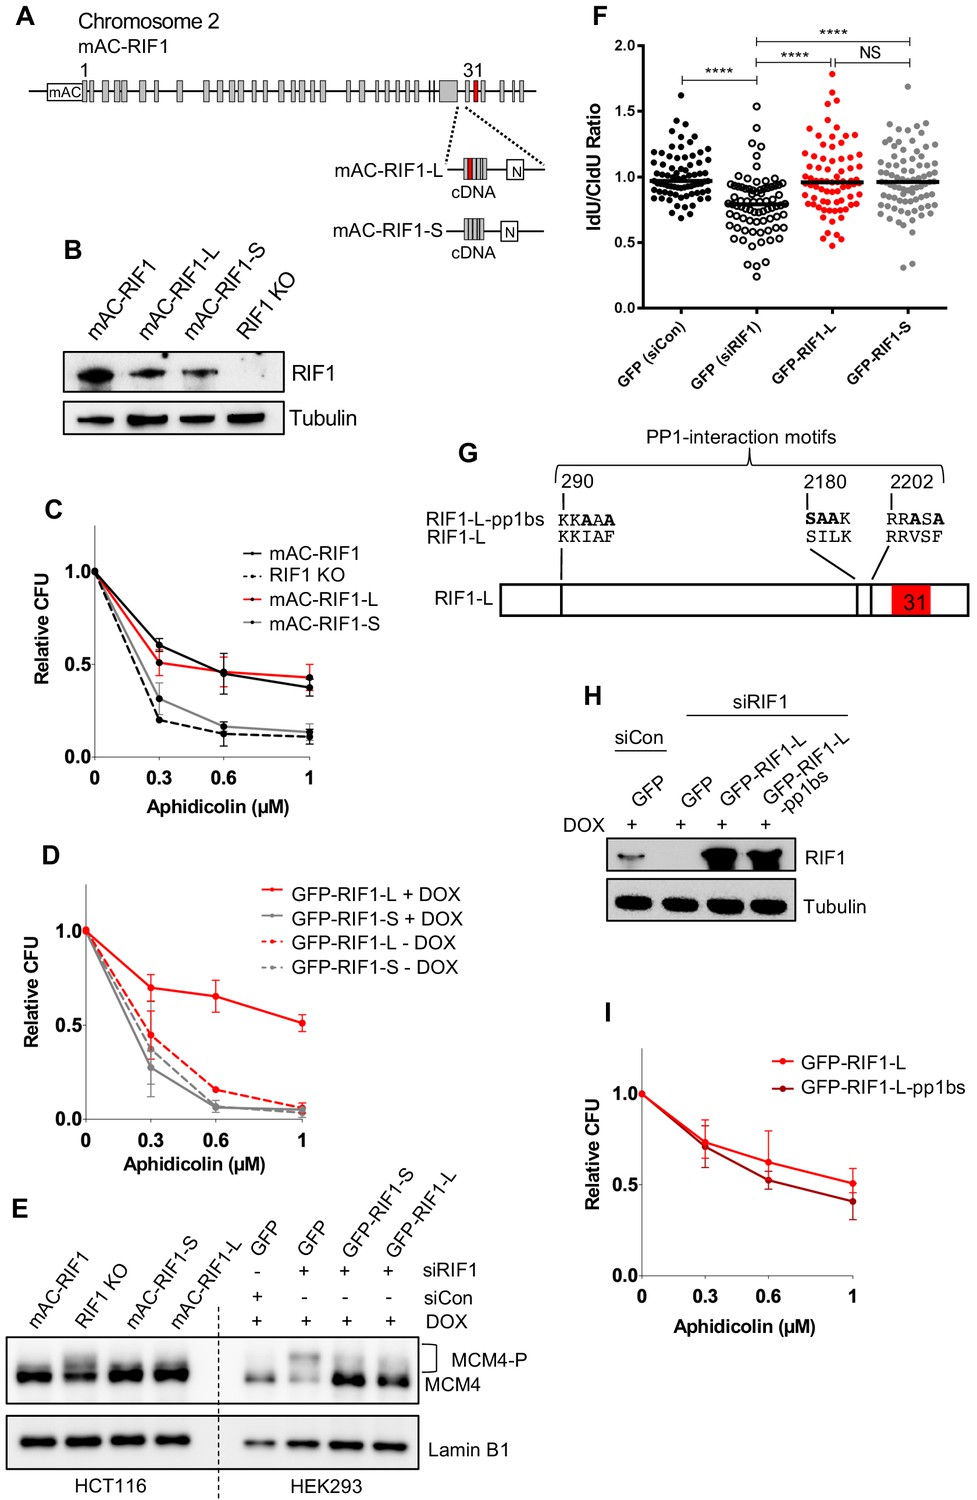
RIF1-L promotes resistance to Aphidicolin treatment but RIF1-S cannot.
(A) RIF1 exon structure and construction of HCT116 mAC-RIF1-L and mAC-RIF1-S cell lines. Constructs containing cDNA encoding the C-terminal portion of either RIF1-L or RIF1-S were inserted at the end of exon 29 as illustrated, by CRISPR-mediated integration of donor plasmids into the HCT116 mAC-RIF1 cell line. ‘N’ is Neomycin resistance gene. (B) Expression of RIF1 in HCT116 mAC-RIF1, mAC-RIF1-L, mAC-RIF1-S and RIF1 KO cell lines. Whole cell extracts were harvested for western blotting with anti-RIF1 antibody. Tubulin is shown as a loading control. (C) CFA comparing resistance to Aphidicolin of mAC-RIF1, mAC-RIF1-L, mAC-RIF1-S, and RIF1-KO cell lines. Plot shows the mean and range from two biological replicates. See Figure 3—figure supplement 2 for individual plots. (D) CFA comparing effects of HEK293 GFP-RIF1-L and GFP-RIF1-S expression on Aphidicolin resistance. Endogenous RIF1 was depleted in all samples by siRIF1 treatment prior to ectopic RIF1-L/S induction by DOX addition. Plot shows the mean and range from two biological replicates. See Figure 3—figure supplement 3D for individual experiments. (E) Both RIF1-L and RIF1-S can counteract MCM4 hyperphosphorylation caused by depletion of endogenous RIF1. For HEK293 cells, 24 hr after transfection with either siCon or siRIF1, DOX was added to the culture medium. 24 hr later, chromatin-enriched protein fractions were prepared and analysed by western blotting with anti-MCM4 antibody. Hyperphosphorylated MCM4 protein (MCM4-P) is detected based on its retarded mobility as indicated by bracket. (F) DNA fibre assay to assess nascent DNA degradation. HEK293-derived cell lines were transfected with siCon or siRIF1 to deplete endogenous RIF1. The following day, expression of the stably integrated GFP, GFP-RIF1-L and GFP-RIF1-S was induced by addition of DOX. 2 days later cells were labelled with CldU then IdU, followed by treatment with 2 mM hydroxyurea for 4 hr, after which the IdU:CldU ratio was measured in fibre analysis. Black bars represent median value. 75 forks were analysed per sample. NS: not significant; ****p≤0.0001. (G) Illustration of RIF1 PP1-interaction motifs. To prevent PP1 interaction, critical residues in all three potential PP1 interaction motifs were replaced with alanine, creating a RIF1-pp1bs allele as described (Hiraga et al., 2017). (H) Expression of GFP-RIF1-pp1bs in HEK293 Flp-In T-Rex cells. 48 hr after transfection with siRIF1, DOX was added to the culture medium. After 24 hr, expression was assessed by western blotting with anti-RIF1 antibody. Tubulin is shown as a loading control. (I) CFA comparing effect of GFP-RIF1-L and GFP-RIF1-L-pp1bs expression on Aphidicolin resistance. The CFA was carried out as in (D). Plot shows the mean and range from three biological replicates, each carried out in technical triplicate. See Figure 3—figure supplement 5 for individual plots.
Figure 3—figure supplement 1
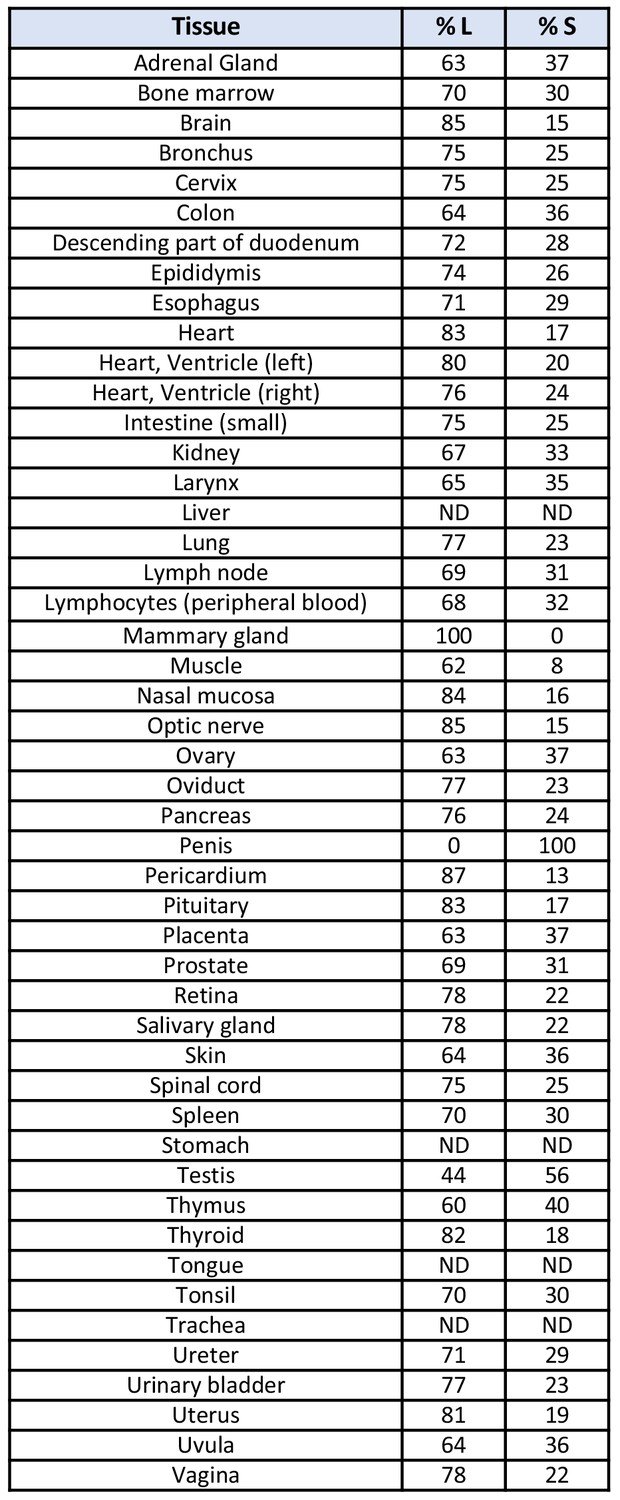
RIF1 splice variants are expressed in vivo.
RIF1 splice variants were amplified from a human cDNA panel covering 48 major tissues, using primers LW030 and LW031 that produce bands of 322 bp for RIF1-S and 400 bp for RIF1-L. The PCR products were analysed on a 2% agarose gel and the relative abundance of RIF1-L and RIF1-S were calculated based on the band intensities using ImageLab Software (Bio-Rad). ND – not detected.
Figure 3—figure supplement 2
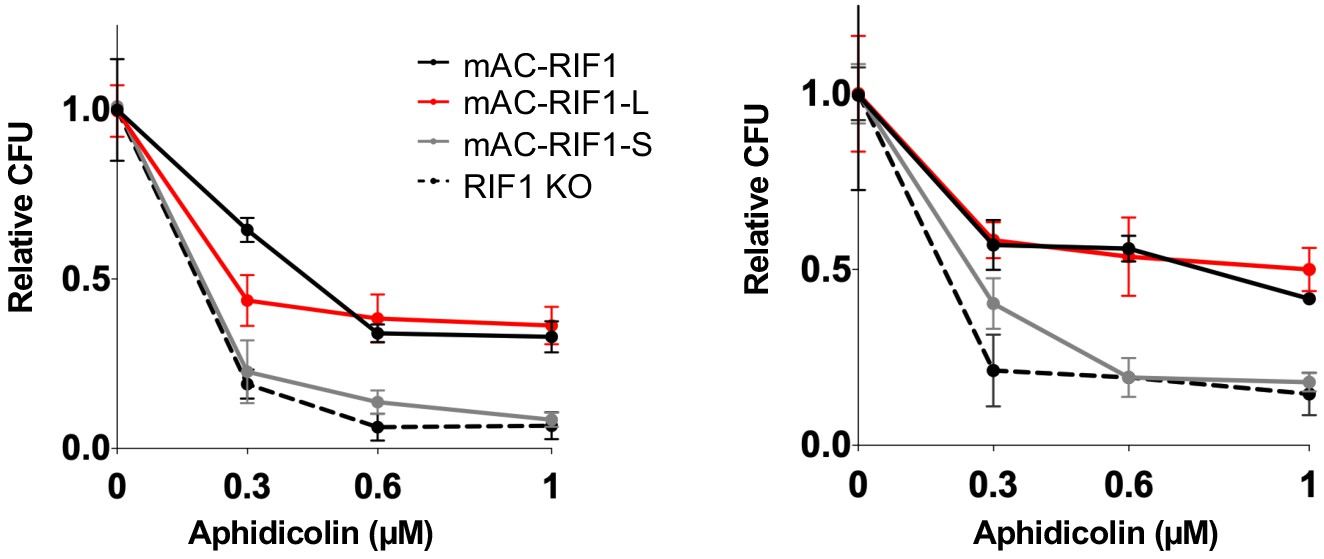
HCT116 mAC-RIF1-L promotes resistance to Aphidicolin treatment but mAC-RIF1-S cannot.
Individual CFA experiments comparing resistance of mAC-RIF1, mAC-RIF1-L, mAC-RIF1-S, and RIF1-KO cell lines to treatment with different Aphidicolin concentrations. Plots show mean and standard deviation of technical triplicates.
Figure 3—figure supplement 3
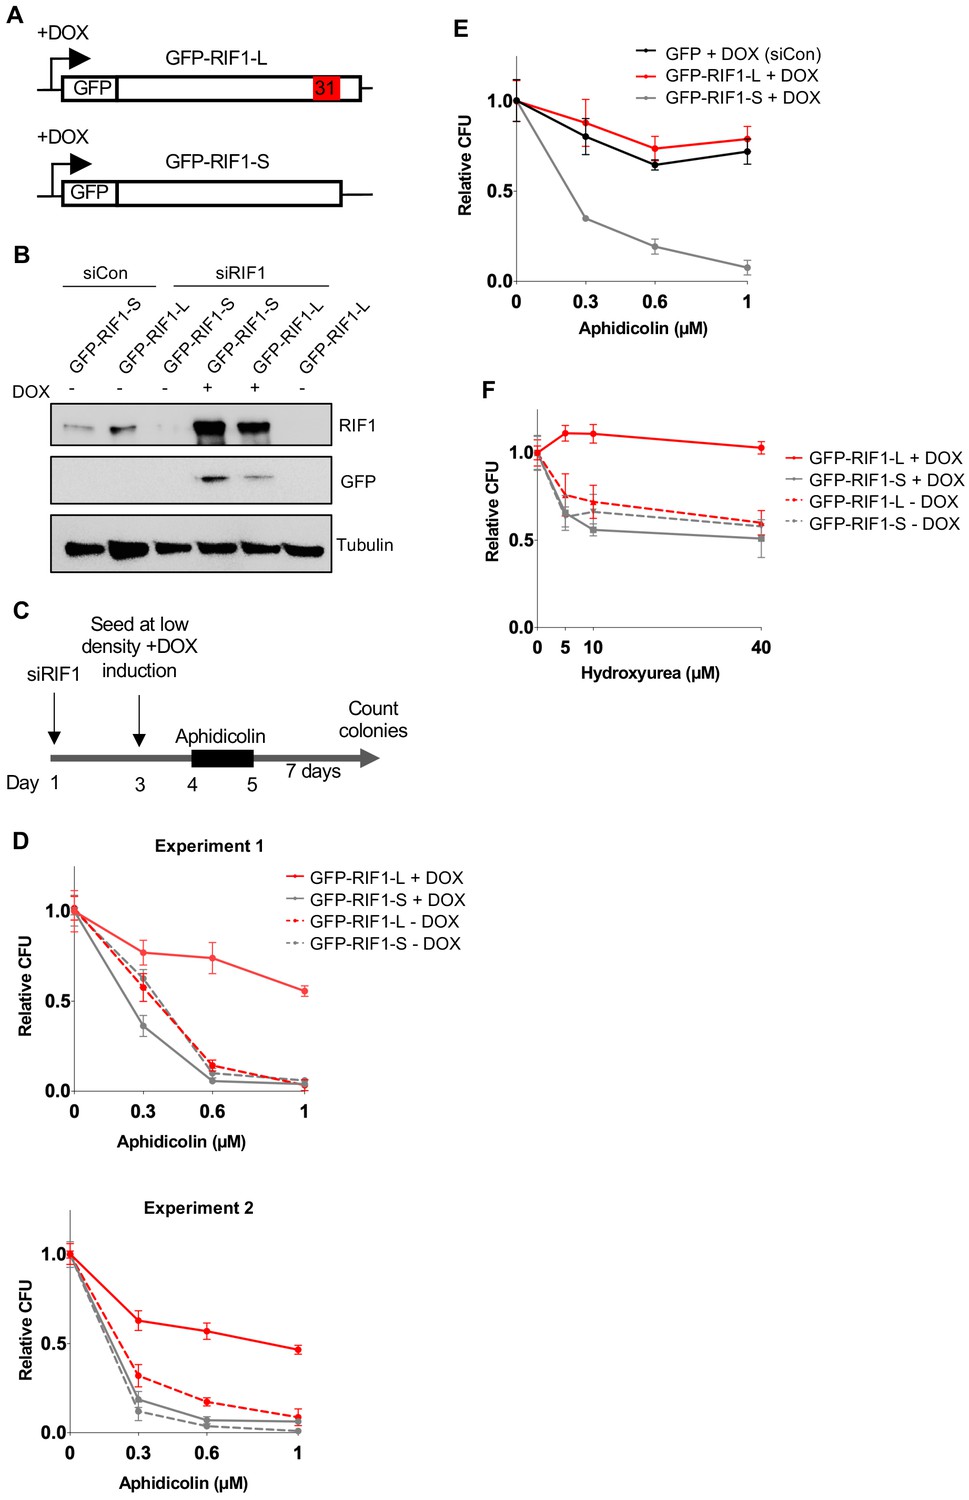
In HEK293-derived cells RIF1-L promotes resistance to Aphidicolin treatment but RIF1-S cannot.
(A) Illustration of DOX-controlled GFP-RIF1-L and GFP-RIF1-S cDNA constructs. Following siRNA-mediated depletion of endogenous RIF1, splice variant-specific expression of RIF1 is induced by the addition of 1 μg/ml DOX. (B) Expression of endogenous RIF1, or GFP-RIF1-L and GFP-RIF1-S, in cells treated with siControl or siRIF1. DOX was added to the culture medium 24 hr before harvesting and preparation of whole cell extracts for western blotting. The same protein samples are shown probed with anti-RIF1 (top), anti-GFP (middle), or loading control anti-tubulin (bottom). (C) Modified CFA. On day 1, GFP-RIF1-L and GFP-RIF1-S cells were transfected with siRIF1 or non-targeting control siRNA. On day 3, cells were seeded with DOX to induce transcription of siRNA-resistant GFP-RIF1-L or GFP-RIF1-S constructs. On day 4, Aphidicolin was added then removed on day 5. Cells were incubated for a further 7 days then colonies counted on day 12. (D) Individual CFA experiments comparing effects of GFP-RIF1-L and GFP-RIF1-S expression on Aphidicolin resistance. Experiment was carried out as in C, with Aphidicolin treatment at concentrations indicated. Plots show mean and standard deviation of technical triplicate. (E) CFA comparing effects of HEK293 GFP (siControl), HEK293 GFP-RIF1-L (siRIF1) and GFP-RIF1-S (siRIF1) expression on Aphidicolin resistance. Experiment was carried out as in C, with Aphidicolin treatment at concentrations indicated. Plot shows mean and standard deviation. (F) CFA comparing effects of Hydroxyurea on HEK293-derived cells expressing only GFP-RIF1-L or only GFP-RIF1-S in place of endogenous RIF1. Experiment was carried out as in C, but replacing Aphidicolin with Hydroxyurea treatment at concentrations indicated. Plot shows mean and standard deviation of technical triplicate.
Figure 3—figure supplement 4
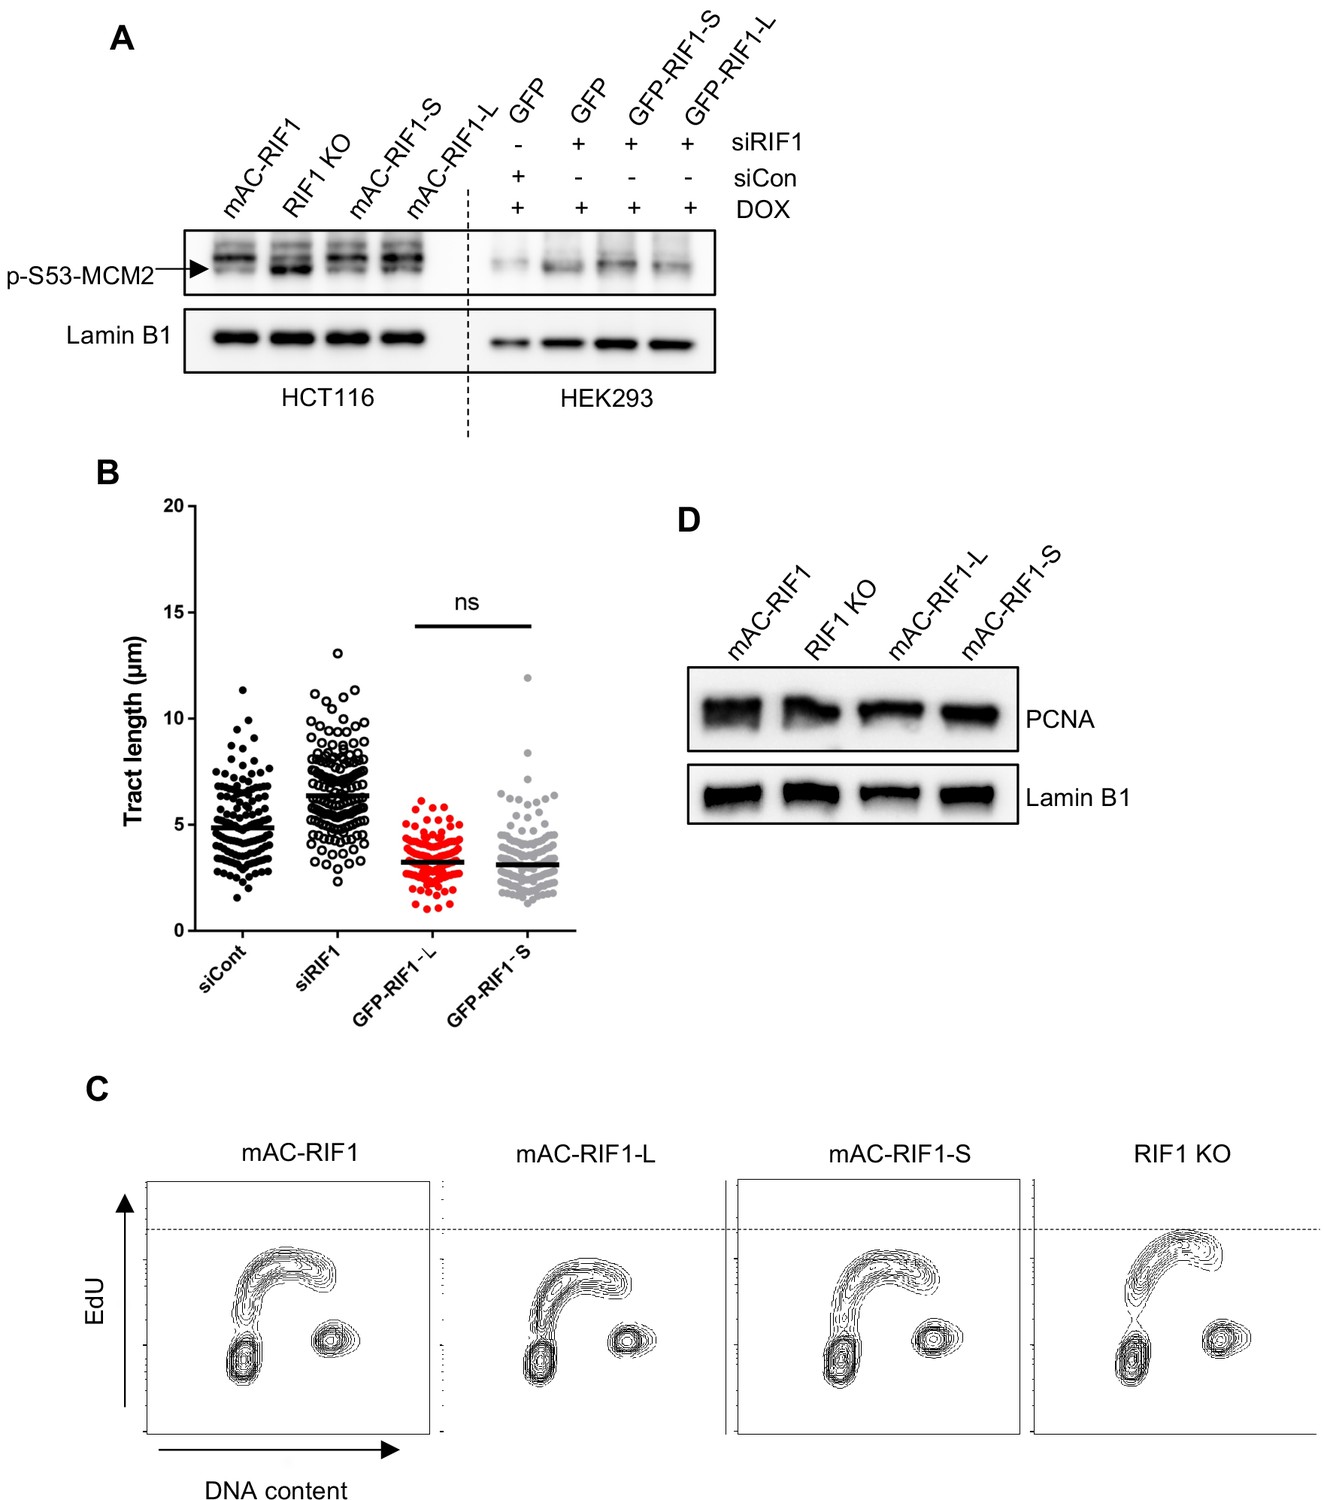
Replication fork speed, bulk DNA synthesis levels and replisome density are similar in RIF1-L and RIF1-S.
(A) Both RIF1-L and RIF1-S can suppress MCM2 hyperphosphorylation caused by depletion of endogenous RIF1. In HEK293-derived cells, 24 hr after transfection with either siCon or siRIF1, DOX was added to the culture medium to induce RIF1-L or RIF1-S. 24 hr later, chromatin-enriched protein fractions were prepared and analysed by western blotting with anti-p-S53-MCM2 antibody. Hyperphosphorylated MCM2 is detected based on a specific p-S53-MCM2 band (indicated by arrow), with the phosphorylated form running faster than bulk MCM2. (B) HEK293-derived cell lines were transfected with siControl or siRIF1, then 24 hr later DOX was added to induce expression of GFP constructs. 2 days after DOX induction cells were labelled with CldU (20 min) then IdU (20 min) and DNA fibre analysis was performed. CldU tract length shown in the graph represents a measure of fork speed. At least 125 forks were analysed per sample. (C) Bulk DNA synthesis analysed in HCT116-derived cell lines. Asynchronously growing cells were pulsed with EdU for 15 min before fixing and analysis by flow cytometry. Contour plots show EdU signal plotted against DAPI content. (D) PCNA loading on chromatin suggests similar replisome density in cells containing only RIF1-L or only RIF1-S. Chromatin-enriched protein fractions were prepared from HCT116-derived cells for western blotting with anti-PCNA antibody. Lamin B1 is shown as a loading control.
Figure 3—figure supplement 5
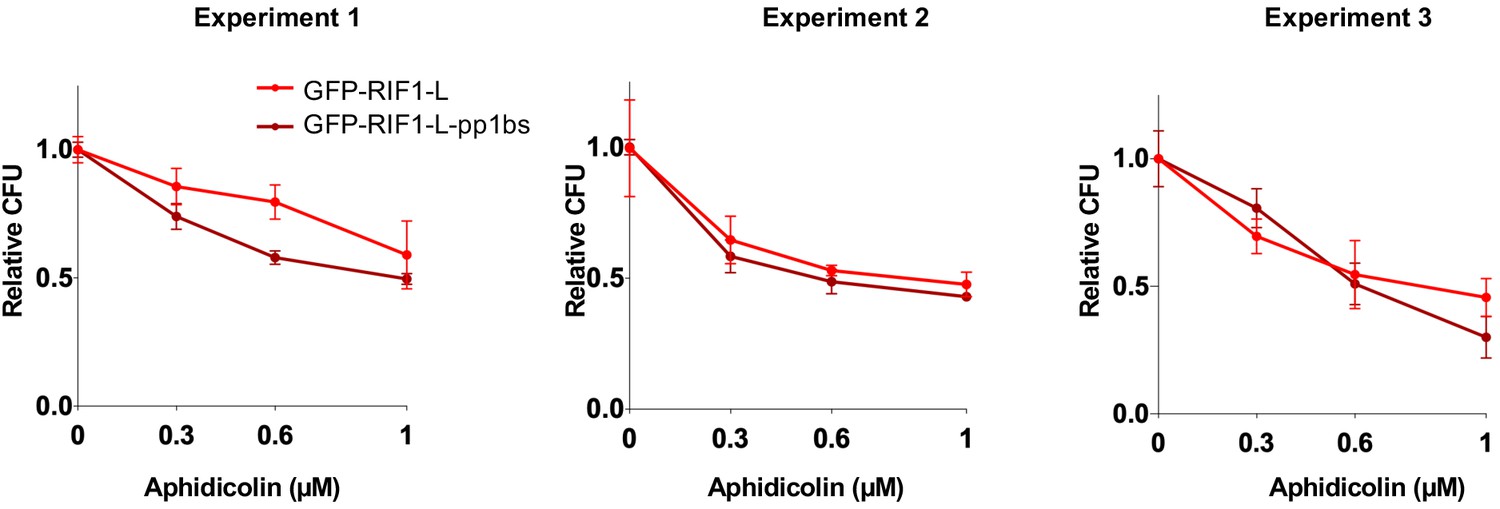
RIF1-L resistance to Aphidicolin treatment is largely independent of PP1 interaction.
Individual CFA experiments comparing effect of GFP-RIF1-L and GFP-RIF1-L-pp1bs expression on Aphidicolin resistance. The CFA was carried out as in Figure 3—figure supplement 3C. Plots show mean of technical triplicates and standard deviation.
Figure 4 with 1 supplement
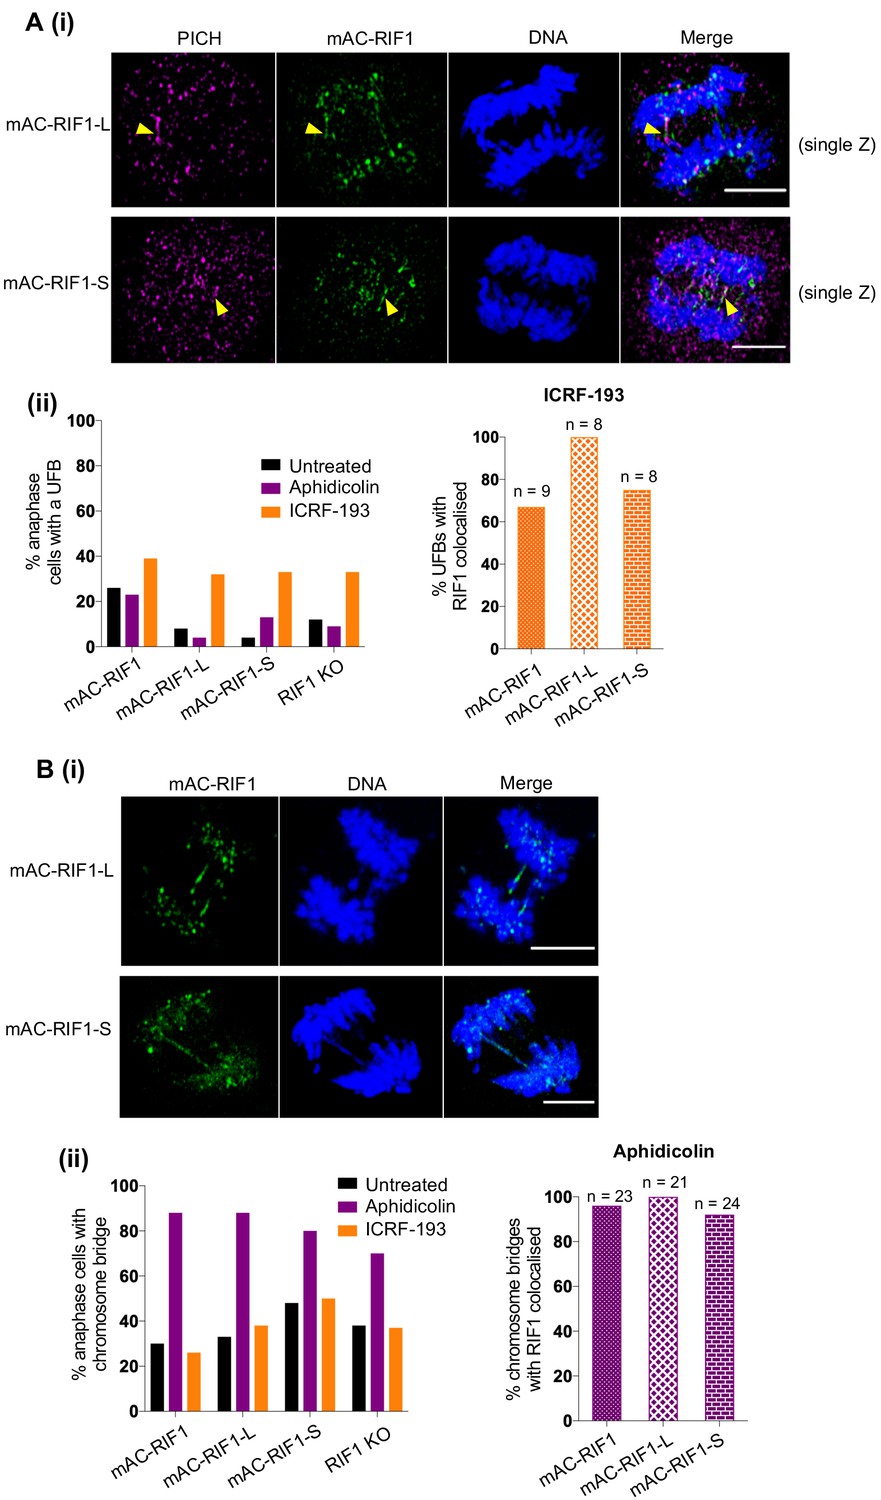
Both RIF1-L and RIF1-S localise to replication stress-induced chromosome bridges.
(A) (i) Representative images showing PICH and mAC-RIF1 localised at UFBs induced by ICRF-193 treatment of HCT116 cells containing only RIF1-L (upper panels) or RIF1-S (lower panels) isoforms. Yellow arrowheads indicate UFBs. Scale bars = 5 μm. (ii) Left: Fraction of anaphase HCT116 cells with at least one UFB after treatment with Aphidicolin or ICRF-193. At least 23 anaphase cells were imaged for each sample. Right: % of ICRF-193-induced UFBs with colocalised RIF1. Cells were treated with 1 μM Aphidicolin for 24 hr then released for 12 hr before mitotic enrichment and fixation, or with 0.1 μM ICRF-193 for 30 min before mitotic enrichment and fixation. (B) (i) Representative images showing mAC-RIF1 at localised at chromosome bridges induced by Aphidicolin treatment of HCT116 cells containing only RIF1-L (upper panels) or RIF1-S (lower panels) isoforms. Scale bars = 5 μm. (ii) Left: Fraction of anaphase HCT116 cells with a chromosome bridge after treatment as described in A(ii). At least 23 anaphase cells were imaged for each sample. Right: % of Aphidicolin-induced chromosome bridges with colocalised RIF1.
Figure 4—figure supplement 1
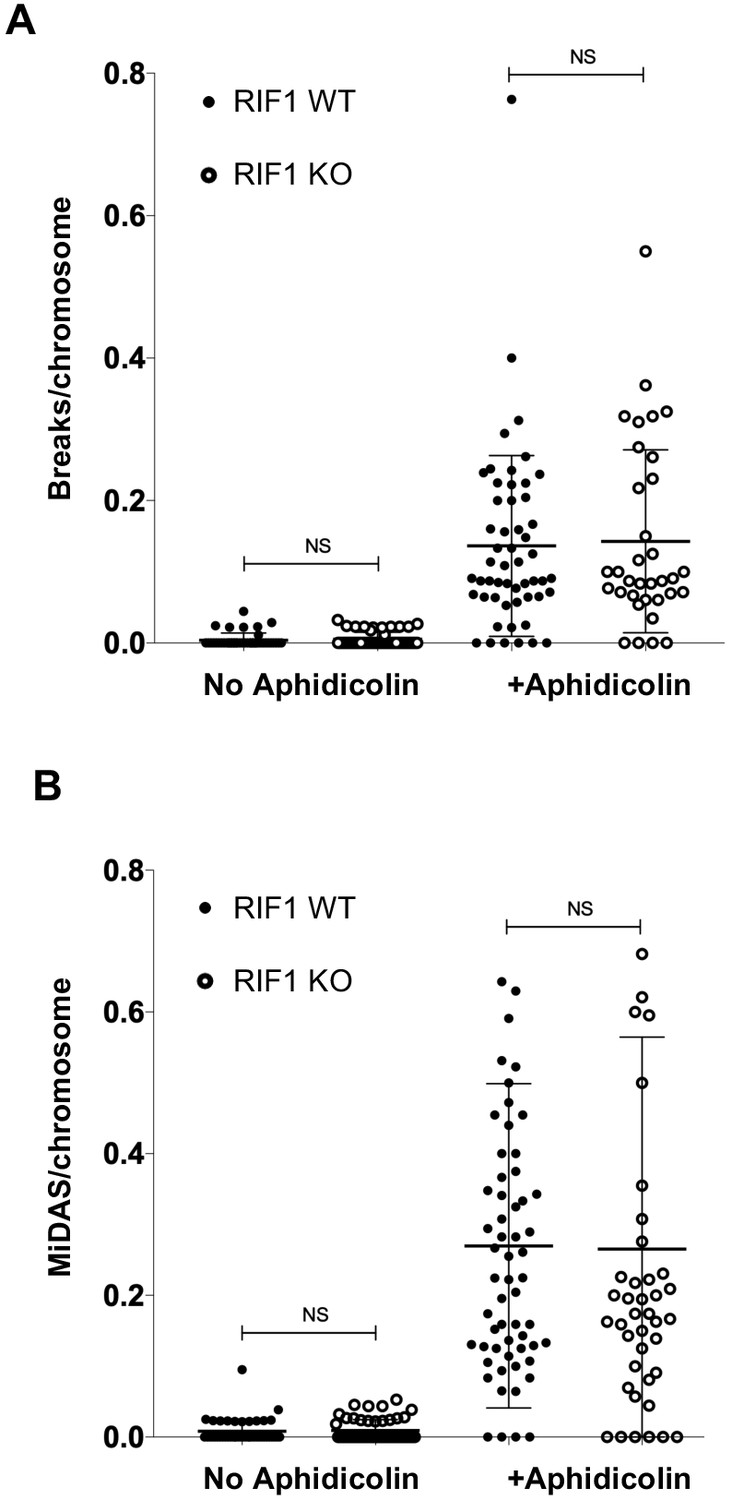
Cells lacking RIF1 show neither elevated chromatin breaks nor altered MiDAS after Aphidicolin treatment.
(A) Number of breaks (including gaps) per mitotic chromosome in HCT116 RIF1 WT and RIF1 KO cells, in untreated cells and after Aphidicolin treatment. A minimum of 34 metaphase spreads were counted per sample. NS = not significant. (B) Number of MiDAS sites (represented by EdU foci at chromosomes) per chromosome in HCT116 RIF1 WT and RIF1 KO cells in untreated cells and after Aphidicolin treatment. A minimum of 42 metaphase spreads were counted per sample. NS = not significant.
Figure 5 with 2 supplements
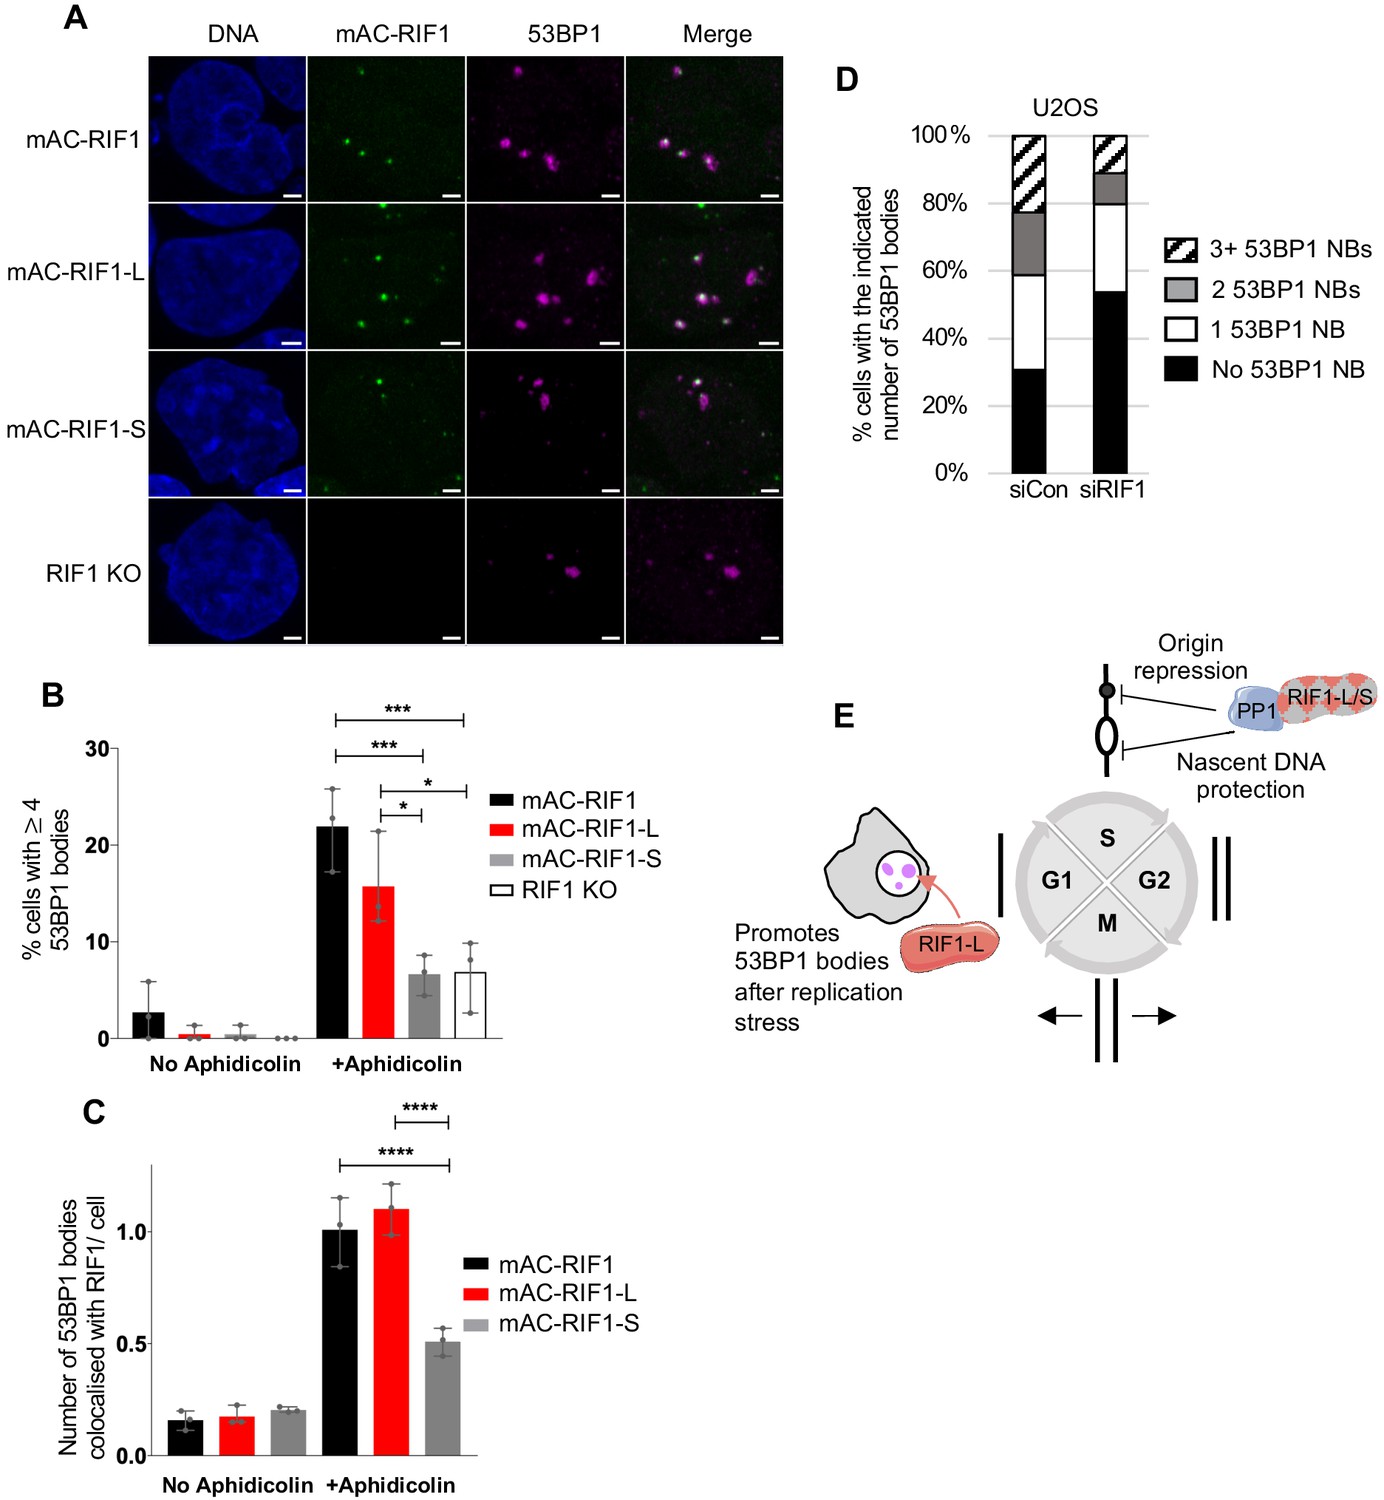
RIF1-L preferentially localises to 53BP1 protective nuclear bodies and promotes their formation.
(A) Representative images showing 53BP1 nuclear bodies and RIF1 foci in HCT116 cell lines. Cells were treated with 1 μM Aphidicolin for 24 hr then released for 12 hr before fixation. In total, a minimum of 132 cells were analysed per sample. Scale bar = 2 μm. (B) Number of cells with 4 or more 53BP1 nuclear bodies in cells either untreated or treated with Aphidicolin as in A. Plot shows the mean and range from three independent experiments. *p<0.05; ***p<0.001. See Figure 5—figure supplement 1C for plots showing distribution of 53BP1 foci per cell. (C) Number of 53BP1 nuclear bodies colocalised with RIF1 foci per cells in untreated and Aphidicolin-treated HCT116 cells. Plot shows the mean and range from three biological replicates. ****p<0.0001. (D) Mean distribution of 53BP1 NBs in U2OS cells treated as in A from three biological replicates. In total, a minimum of 140 cells were analysed per sample. See Figure 5—figure supplement 1D for individual plots. (E) Illustration of RIF1-L and -S isoform functions.
Figure 5—figure supplement 1

Distribution of 53BP1 nuclear bodies after Aphidicolin treatment.
(A) 53BP1 protein level in HCT116-derived cell lines. Whole cell extracts were harvested for western blot analysis with anti-53BP1 antibody. Tubulin is shown as a loading control. (B) Representative images of CyclinA2 staining in experiment shown in Figure 5A. Nuclei whose boundaries marked by white dotted lines correspond to those in the panels of Figure 5A. Apparent magenta foci in CyclinA2-negative nuclei represent bleed-through from channel used for 53BP1 visualisation. Scale bar = 5 μM. (C) Distribution of the number of 53BP1 NBs per cell as a % of the cell population, from same cultures as in Figure 5A. Plots show mean and range from biological replicates. (D). Distribution of 53BP1 NBs in U2OS cells treated as in Figure 5A.
Figure 5—figure supplement 2
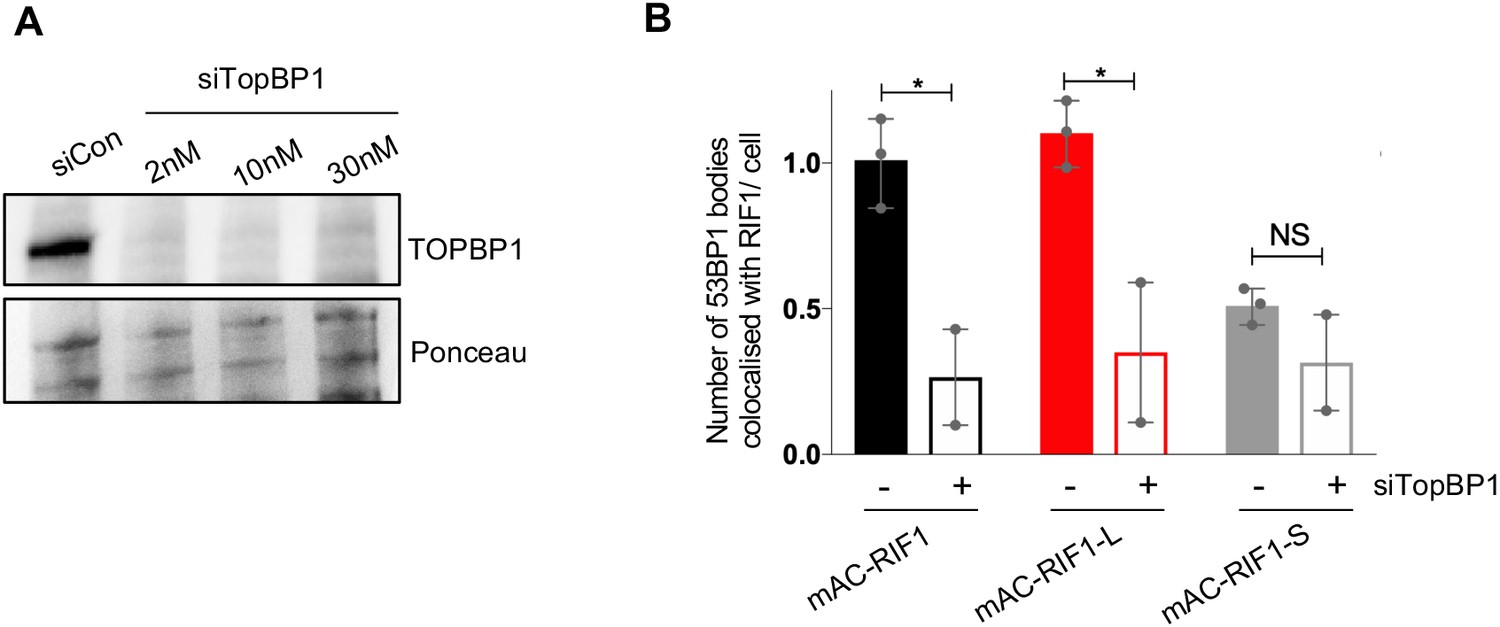
Colocalisation of 53BP1 with RIF1-L requires TopBP1.
(A) Confirmation of siTopBP1 efficacy by western blotting four days after siRNA transfection. Whole cell protein extracts analysed with anti-TopBP1 antibody. Ponceau S staining shown as a loading control. (B) Number of 53BP1 nuclear bodies colocalised with RIF1 foci per cell, in TopBP1+ and siTopBP1-treated HCT116 cells. Plots show the mean and range from three (TopBP1+) or two (siTopBP1) biological replicates. Data for TopBP1+ taken from the untreated condition in the experiment shown in Figure 5. In total, a minimum of 92 cells were analysed per sample (siTopBP1 data). *p<0.05. NS = not significant.
Videos
Video 1
mClover-tagged RIF1 from early to late S phase.
Time-lapse imaging video of unsynchronised HCT116 mAC-RIF1 mCherry-PCNA cells transitioning from early to late S phase. Blue represents DNA (DAPI stain), red represents PCNA (mCherry-PCNA) and green represents mAC-RIF1 (mClover).
Video 2
mClover-tagged RIF1 from late S to the following G1 phase.
Time-lapse imaging video of unsynchronised HCT116 mAC-RIF1 mCherry-PCNA cells transitioning from late S to the following G1 phase. Blue represents DNA (DAPI stain), red represents PCNA (mCherry-PCNA) and green represents mAC-RIF1 (mClover).
Tables
Key resources table
| Reagent type (species) or resource | Designation | Source or reference | Identifiers | Additional information |
|---|---|---|---|---|
| Cell line (Homo sapiens) | HEK293 Flp-In T-REx 293 derived cell lines: GFP, GFP-RIF1-L, GFP-RIF1-L-pp1bs, GFP-RIF1-S | This study and Hiraga et al., 2017 | ||
| Cell line (Homo sapiens) | HCT116 OsTIR1 derived cell lines: mAC-RIF1, mAC-RIF1 mCherry-PCNA, mAC-RIF1-L, mAC-RIF1-S | This study | ||
| Cell line (Homo sapiens) | HCT116 RIF1 KO | This study | ||
| Cell line (Homo sapiens) | U2OS | ATCC | RRID:CVCL_0042 | |
| Transfected construct (human) | pcDNA5/FRT/TO-GFP-RIF1 derived plasmids: L, L-pp1bs | This study | ||
| Transfected construct (human) | pOG44 | O'Gorman et al., 1991 | Flp recombinase expression vector | |
| tTransfected construct (human) | pX330-RIF1-N | This study | CRISPR/Cas9 plasmid targeting exon one for construction of HCT116 mAC-RIF1 cell line | |
| Transfected construct (human) | pmAC-RIF1 | This study | Donor plasmid for construction of HCT116 mAC-RIF1 cell line | |
| Transfected construct (human) | pX330-RIF1-29 | This study | CRISPR/Cas9 plasmid targeting exon 29 for construction of HCT116 mAC-RIF1-L/S cell lines | |
| Transfected construct (human) | pmAC-RIF1-L | This study | Donor plasmid for construction of HCT116 mAC-RIF1-L cell line | |
| Transfected construct (human) | pmAC-RIF1-S | This study | Donor plasmid for construction of HCT116 mAC-RIF1-S cell line | |
| Transfected construct (human) | pRIF1-KO | This study | Donor plasmid for construction of HCT116 RIF KO cell line | |
| Antibody | Rabbit polyclonal anti-RIF1 | Bethyl Laboratories | Cat#A300-568A RRID:AB_669806 | WB (1:5000) |
| Antibody | Rabbit polyclonal anti-GFP | Abcam | Cat#ab290 RRID:AB_303395 | WB (1:100,000) |
| Antibody | Rat monoclonal anti-Tubulin | Santa Cruz Biotechnology | Cat#sc-53030 RRID:AB_2272440 | WB (1:2000) |
| Antibody | Rabbit polyclonal anti-MCM4 | Abcam | Cat#ab4459 RRID:AB_304468 | WB (1:2000) |
| Antibody | Rabbit polyclonal anti-MCM2 phospho-S53 | Bethyl Laboratories | Cat#A300-765A | WB (1:2500) |
| Antibody | Mouse monoclonal anti-PCNA | Santa Cruz Biotechnology | Cat#sc-56 RRID:AB_628110 | WB (1:1000) |
| Antibody | Rabbit monoclonal anti-Lamin B1-HRP | Abcam | Cat#ab194109 | WB (1:5000) |
| Antibody | Rabbit polyclonal anti-TopBP1 | Bethyl Laboratories | Cat#A300-111A RRID:AB_2272050 | WB (1:5000) |
| Antibody | Rat monoclonal anti-CldU | Abcam | Cat#ab6326 | IF (1:100) |
| Antibody | Mouse monoclonal anti-IdU | Beckton Dickinson | Cat#347580 | IF (1:100) |
| Antibody | Mouse monoclonal anti-ssDNA | Merck Millipore | Cat#MAB3034 RRID:AB_94645 | IF (1:00) |
| Antibody | Goat polyclonal anti-Rat IgG Alexa Fluor 594 | Invitrogen | Cat#A11007 RRID:AB_141374 | IF (1:300) |
| Antibody | Goat polyclonal anti-Mouse IgG1 Alexa Fluor 488 | Invitrogen | Cat#A21121 RRID:AB_2535764 | IF (1:300) |
| Antibody | Goat polyclonal anti-Mouse IgG2a Alexa Fluor 350 | Invitrogen | Cat#A21130 RRID:AB_1500822 | IF (1:300) |
| Antibody | Rabbit polyclonal anti-53BP1 | Santa Cruz Biotechnology | Cat#sc22760 RRID:AB_2256326 | IF (1/500) |
| Antibody | Rabbit polyclonal anti-FANCD2 | Novus Biologics | Cat#NB100-182 RRID:AB_10002867 | IF (1/500) |
| Antibody | Goat polyclonal anti-BLM | Santa Cruz Biotechnology | Cat#sc7790 RRID:AB_2243489 | IF (1/500) |
| Antibody | Goat polyclonal anti-Rabbit IgG Alexa Fluor 594 | Invitrogen | Cat#A-11037 RRID:AB_2534095 | IF (1/1000) |
| Antibody | Donkey polyclonal anti-Goat Alexa 594 | Invitrogen | Cat#A-11058 RRID:AB_142540 | IF (1/1000) |
| Antibody | Alpaca/recombinant VHH domain monoclonal GFP-Booster ATTO 488 | Chromotek | Cat#gba488 RRID:AB_2631386 | IF (1:000) |
| Antibody | Rabbit monoclonal anti-CyclinA2 Alexa Fluor 555 | Abcam | Cat#ab217731 | IF (1:000) |
| Antibody | Rabbit polyclonal anti-53BP1 | Novus Biologics | Cat#NB100-94 | IF and WB (1:1000) |
| Antibody | Mouse monoclonal anti-PICH | Sigma | Cat#04–1540 RRID:AB_10616795 | IF (1:00) |
| Antibody | Donkey polyclonal IgG anti-Mouse Alexa Fluor 647 | Abcam | Cat#ab150111 | IF (1:1000) |
| Recombinant DNA reagent | pcDNA5/FRT/TO-GFP-RIF1 derived plasmids:L, L-pp1bs | This study | ||
| Recombinant DNA reagent | pOG44 | O'Gorman et al., 1991 | Flp recombinase expression vector | |
| Recombinant DNA reagent | pX330-RIF1-N | This study | CRISPR/Cas9 plasmid targeting exon one for construction of HCT116 mAC-RIF1 cell line | |
| Recombinant DNA reagent | pmAC-RIF1 | This study | Donor plasmid for construction of HCT116 mAC-RIF1 cell line | |
| Recombinant DNA reagent | pX330-RIF1-29 | This study | CRISPR/Cas9 plasmid targeting exon 29 for construction of HCT116 mAC-RIF1-L/S cell lines | |
| Recombinant DNA reagent | pmAC-RIF1-L | This study | Donor plasmid for construction of HCT116 mAC-RIF1-L cell line | |
| Recombinant DNA reagent | pmAC-RIF1-S | This study | Donor plasmid for construction of HCT116 mAC-RIF1-S cell line | |
| Recombinant DNA reagent | pRIF1-KO | This study | Donor plasmid for construction of HCT116 RIF KO cell line | |
| Sequence-based reagent | siRNA against RIF1 5’ AGACGGTGCTCTATTGTTA 3’ | Horizon Discovery | Cat#D-027983-02-0050 | |
| Sequence-based reagent | siRNA against Luciferase GL2 Duplex 5’ CGTACGCGGAATACTTCGA 3’ | Horizon Discovery | Cat#D-001100–01 | |
| Sequence-based reagent | siRNA against TopBP1 5’ GGATATATCTTTGCGGTTTT 3’ | Life Technologies | Cat#s21823 | |
| Sequence-based reagent | Primers: 5' – CTATGGAATTGAATGTAGGAAATGAAGCTAGC – 3' 5' – ACCGAGCTCGGATCGATCACCATGACGGCCAGGG – 3' 5' – GCCGCGGATCCGAATTCTAAATAGAATTTTCATGGGATGG – 3' 5' –GCTACGTGATCCTGGGGACAGAAATCCTTTGGCTGAAGTGGTATTATGCTTAGATTGTGTAGTAGGAGAAG – 3' 5' –TCCCCAGGATCACGTAGCCCTAAATTTAAGAGCTCAAAGAAGT GTTTAATTTCAGAAATGGCCAAAG– 3' 5' – GATCAGTTATCTATGCGGCCG – 3' | Sigma | Primers used to construct pcDNA5/FRT/TO-GFP-RIF1-L | |
| Sequence-based reagent | Primers: 5’- ccgggctgcaggaattcgatTAGGAGGGAGCGCGCCGCACGCGTG – 3’ 5’ – ggctttttcatggtggcgatCACCCTGAGGCCCGAACCGGAAGAG – 3’ 5’-gctggtgcaggcgccggatccATGACGGCCAGGGGTCAGAGtCCCCTCGCGCC – 3’ 5’ – acggtatcgataagcttgatCTCTGGGTAGCCACATTTTCCCAAC – 3’ | Eurofins Genomics | Primers used to amplify genomic DNA for the homology arms for the mAC-RIF1 donor plasmid pmAC-RIF1 | |
| Sequence-based reagent | Primers: 5’- ccgggctgcaggaattcgatTAGGAGGGAGCGCGCCGCACGCGTG– 3’ 5’ - tcgctgcagcccgggggatcGGGGGCTCTGACCCCTGGCCGTCATGTCGC– 3’ 5’ – aagcttatcgataccgtcgaCTTTGGAAGACCCTTCTGCCTCCCATGGAG – 3’ 5’ – acggtatcgataagcttgatCTCTGGGTAGCCACATTTTCCCAAC – 3’ | Eurofins Genomics | PCR primers used to amplify genomic DNA for the homology arms for the RIF1 KO donor plasmid pRIF1-KO | |
| Sequence-based reagent | Primers: 5’ – AAATCTCATCACCTGTTAATAAG – 3’ 5’ – acaagttaacaacaacaattCTAAATAGAATTTTCATGGGATGGT– 3’ | Eurofins Genomics | PCR primers used to amplify the C-terminal portion of either pcDNA5/FRT/TO-GFP-RIF1-L or pcDNA5/FRT/TO-GFP-RIF1 for donor plasmids pmAC-RIF1-L and pmAC-RIF1-S | |
| Sequence-based reagent | Primers: 5’ – ATGCAgagctcGAAACAGAGAATGAGGGCATAACTA – 3’ 5’ – ATGCAggtaccATTCATTCAACAAACTATGTGCAAG – 3’ | Eurofins Genomics | PCR primers used to amplify the homology arms for donor plasmids pmAC-RIF1-L and pmAC-RIF1-S | |
| Sequence-based reagent | Primers: 5’– GTCTCCTTTGGCTTCTCCGT–3’ 5’–GATGTCAACTGGTGCCACAC–3’ | Sigma | PCR primers used for cDNA analysis of RIF1 splice variants | |
| Commercial assay or kit | Clarity ECL Blotting Substrate | Bio-Rad | Cat#1705061 | |
| Commercial assay or kit | RC-DC protein assay kit | Bio-Rad | Cat#5000121 | |
| Commercial assay or kit | In-Fusion HD Cloning kit | Clonetech | Cat#639646 | |
| Commercial assay or kit | Fugene HD | Promega | Cat#E2311 | |
| Commercial assay or kit | Click-iT EdU Imaging Kit | Invitrogen | Cat#C10340 (AF647) Cat#C10337 (AF488) | |
| Commercial assay or kit | Lightning-Link Rapid Alexa Fluor 647 Antibody Labeling Kit | Expedeon | Cat#336–0030 | |
| Commercial assay or kit | TissueScan, Human Normal cDNA Array | Insight Biotechnology | Cat#HMRT104 | |
| Chemical compound, drug | Lovastatin | Sigma | Cat#M2147 | |
| Chemical compound, drug | Auxinole | Bioacademia | Cat#30–001 | |
| Chemical compound, drug | Auxin | Sigma | Cat#I3750 | |
| Chemical compound, drug | Hydroxyurea | Sigma | Cat#H8627 | |
| Chemical compound, drug | Aphidicolin | Abcam | Cat#ab142400 | |
| Chemical compound, drug | Doxycycline | Sigma | Cat#D9891 | |
| Chemical compound, drug | Mevalonic Acid | Sigma | Cat#4667 | |
| Chemical compound, drug | RO-3306 | Sigma | Cat#SML0569 | |
| Chemical compound, drug | ICRF-193 | Sigma | Cat#I4659 | |
| Chemical compound, drug | Colcemid | Gibco | Cat#15212012 | |
| Chemical compound, drug | FcCyclePI/RNase | Molecular Probes | Cat# F10797 | |
| Chemical compound, drug | SiR-DNA | Spirochrome | Cat#SC007 | |
| Chemical compound, drug | Ibidi Mounting Medium | Ibidi | Cat#50001 | |
| Chemical compound, drug | Prolong Glass Mounting Medium | Invitrogen | Cat#15808401 | |
| Chemical compound, drug | 10% Neutral Buffered Formalin | Sigma | Cat#HT5012 | |
| Software, algorithm | Cell Profiler (3.1.8) | Broad Institute | https://cellprofiler.org RRID:SCR_007358 | |
| Software, algorithm | Zen Black | Zeiss | https://www.zeiss.com RRID:SCR_018163 | |
| Software, algorithm | Prism 7 | Graphpad Software | https://www.graphpad.com RRID:SCR_002798 | |
| Software, algorithm | Volocity | PerkinElmer | https://www.perkinelmer.com RRID:SCR_002668 | |
| Software, algorithm | SoftWoRx | Cytiva Life Sciences | https://www.cytivalifesciences.com | |
| Software, algorithm | FlowJo | Beckton, Dickinson and Company | https://www.flowjo.com RRID:SCR_008520 | |
| Software, algorithm | FIJI | ImageJ Software | https://imagej.net/Fiji RRID:SCR_002285 | |
| Software, algorithm | ImageLab | Bio-Rad | https://www.bio-rad.com | |
| Other | Microscope: LSM880 + Airyscan | Zeiss | ||
| Other | Microscope: Axioplan 2 Epifluorescence | Zeiss |
Additional files
-
Source data 1
Underlying data for graphs.
- https://cdn.elifesciences.org/articles/58020/elife-58020-data1-v2.xlsx
-
Transparent reporting form
- https://cdn.elifesciences.org/articles/58020/elife-58020-transrepform-v2.docx
Download links
A two-part list of links to download the article, or parts of the article, in various formats.
Downloads (link to download the article as PDF)
Open citations (links to open the citations from this article in various online reference manager services)
Cite this article (links to download the citations from this article in formats compatible with various reference manager tools)
The RIF1-long splice variant promotes G1 phase 53BP1 nuclear bodies to protect against replication stress
eLife 9:e58020.
https://doi.org/10.7554/eLife.58020


