Complementary α-arrestin-ubiquitin ligase complexes control nutrient transporter endocytosis in response to amino acids
- Institute for Cell Biology, Medical University of Innsbruck, Austria
- ADSI – Austrian Drug Screening Institute GmbH, Austria
- Division of Clinical Biochemistry, ProteinMicroAnalysis Facility, Medical University of Innsbruck, Austria
- Université de Paris, CNRS, Institut Jacques Monod, France
Figures
Figure 1 with 2 supplements
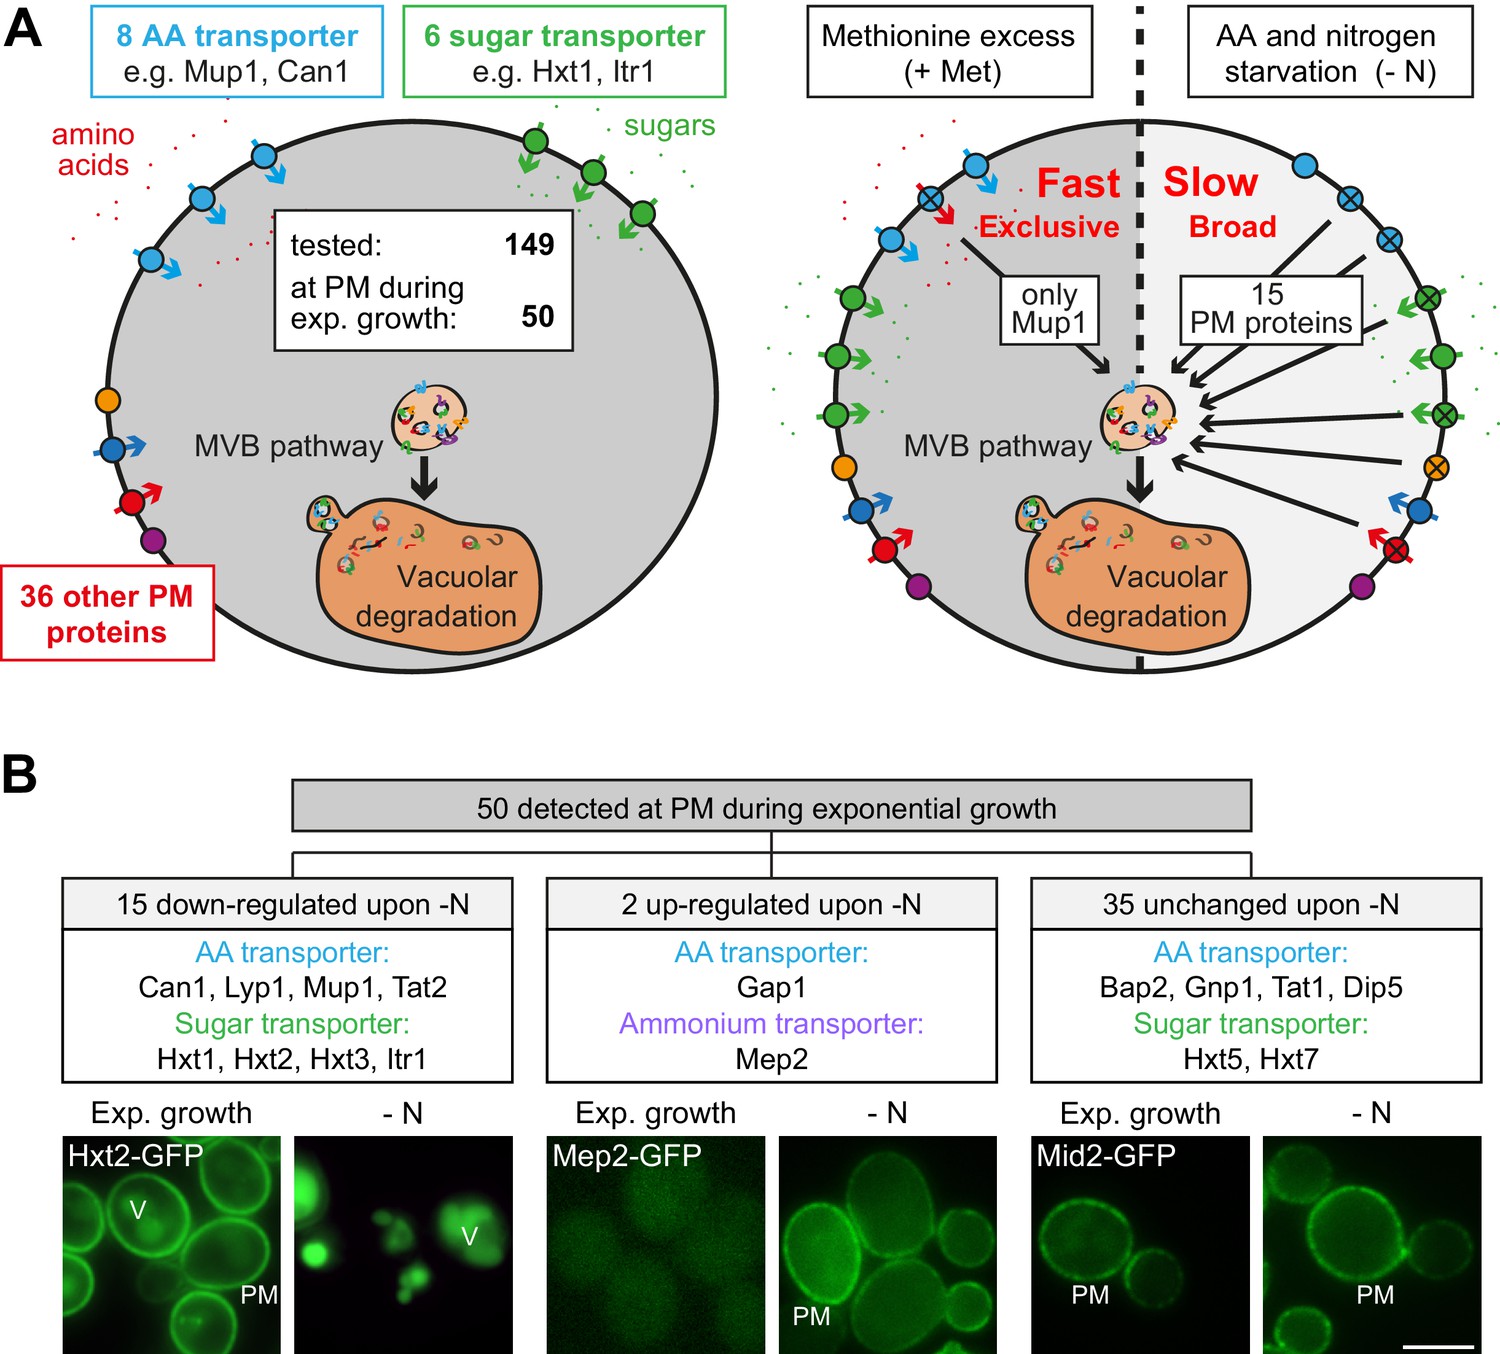
Amino acid and nitrogen starvation triggers broad but specific endocytosis and lysosomal degradation of plasma membrane proteins.
(A) Left: a library of 149 yeast strains expressing chromosomally GFP-tagged membrane proteins was tested for plasma membrane (PM) localization during nutrient replete exponential growth. Right: verified PM proteins were starved 6–8 hr for amino acids and nitrogen (- N) or treated with 20 µg/ml L-methionine (+Met) after 24 hr of exponential growth. The localization of GFP was assayed by fluorescence microscopy. (B) Summary of the phenotypes of GFP-tagged PM proteins during starvation. Indicated are numbers of PM proteins that are down-regulated, up-regulated or unchanged compared to the exponential growth phase, each exemplified by one representative strain. PM: plasma membrane; V: vacuole. Scale bars = 5 µm. See also Figure 1—figure supplements 1 and 2 and Supplementary file 1.
Figure 1—figure supplement 1
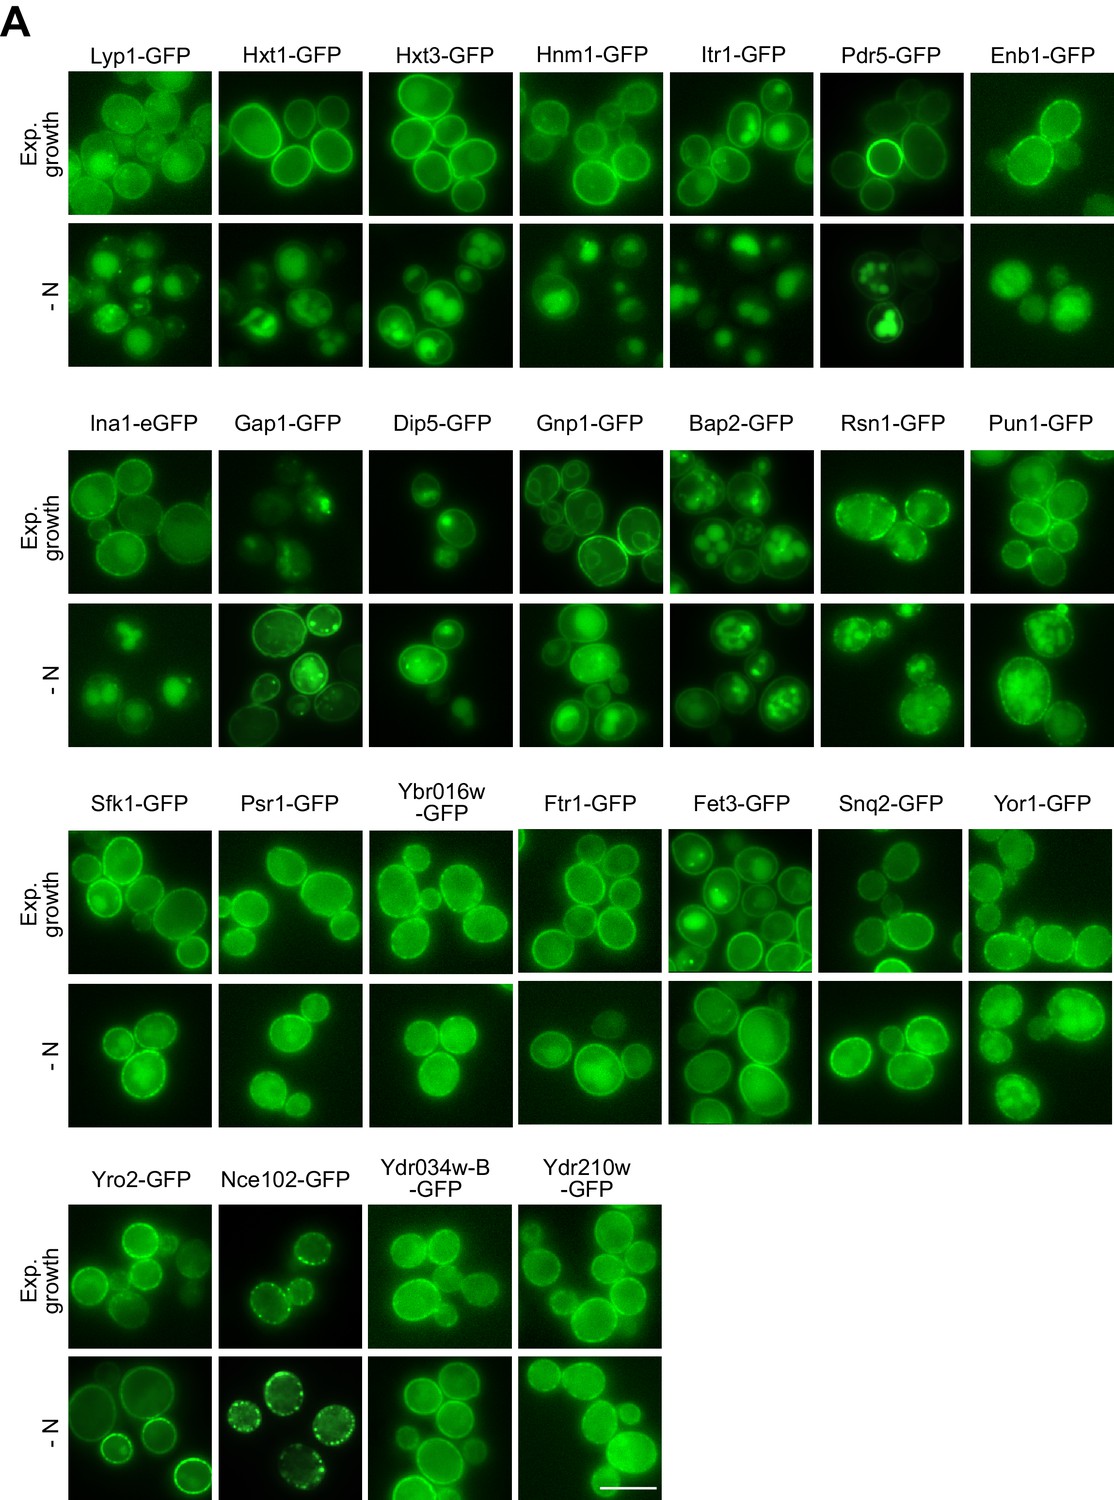
Localization of PM proteins during exponential, rich growth and starvation.
(A) Live-cell fluorescence microscopy analysis of chromosomally GFP-tagged plasma membrane proteins. Cells were starved (- N) for 6–8 hr after 24 hr exponential growth. Scale bar = 5 µm.
Figure 1—figure supplement 2
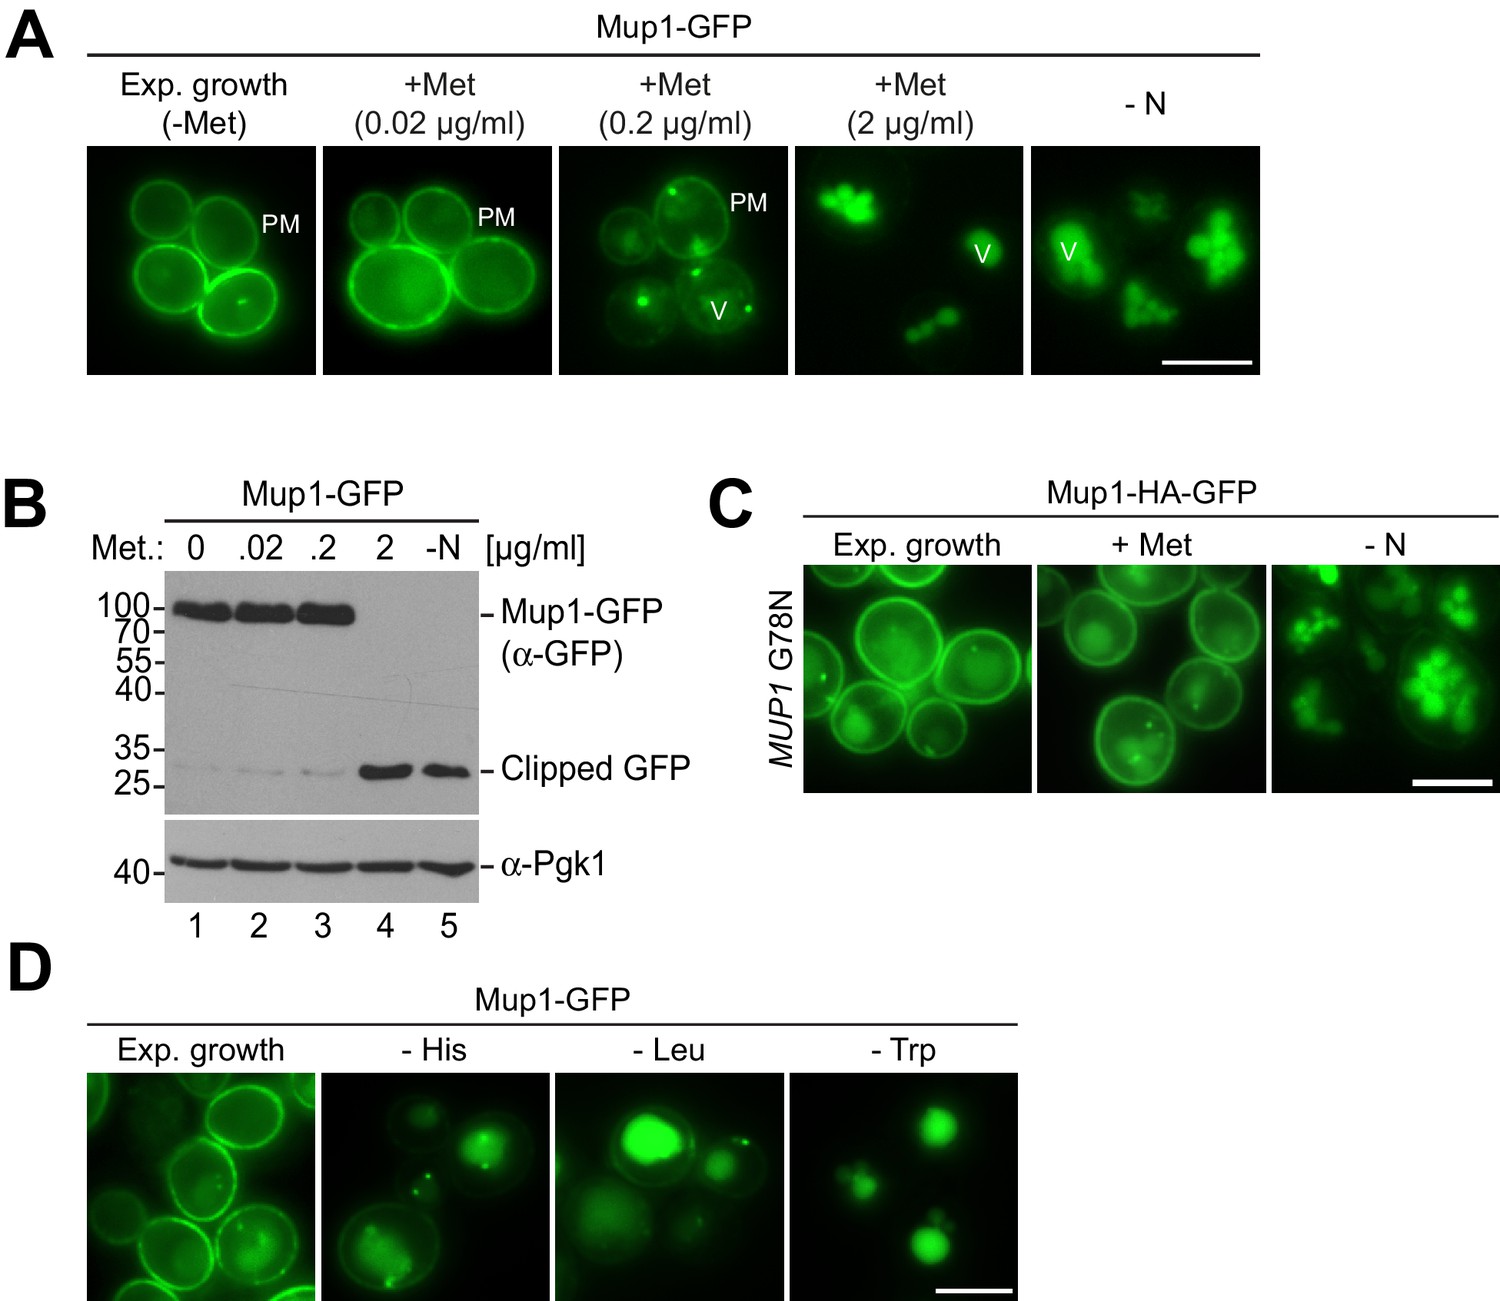
Characterization of starvation- and substrate-induced endocytosis of Mup1.
(A) Live-cell fluorescence microscopy analysis of WT cells expressing MUP1-GFP. Cells were treated with the indicated methionine concentrations (+ Met) for 1.5 hr or starved (- N) for 6 hr after 24 hr exponential growth. (B) SDS-PAGE and western blot analysis with the indicated antibodies of WT cells expressing MUP1-GFP. Cells were treated with the indicated methionine concentrations (+ Met) for 1.5 hr or starved (- N) for 6 hr after 24 hr exponential growth. (C) Live-cell fluorescence microscopy analysis of MUP1(G78N)-HA-GFP cells. Cells were treated with 20 µg/ml L-methionine (+ Met) for 1.5 hr or starved (- N) for 6 hr after 24 hr exponential growth. (D) Live-cell fluorescence microscopy analysis of WT cells expressing MUP1-GFP. Cells were starved for histidine (- His), leucine (- Leu) or tryptophan (- Trp) for 4.5 hr after in presence of all other amino acids required for growth after 24 hr nutrient replete exponential growth. PM: plasma membrane; V: vacuole. Scale bars = 5 µm.
Figure 2 with 1 supplement
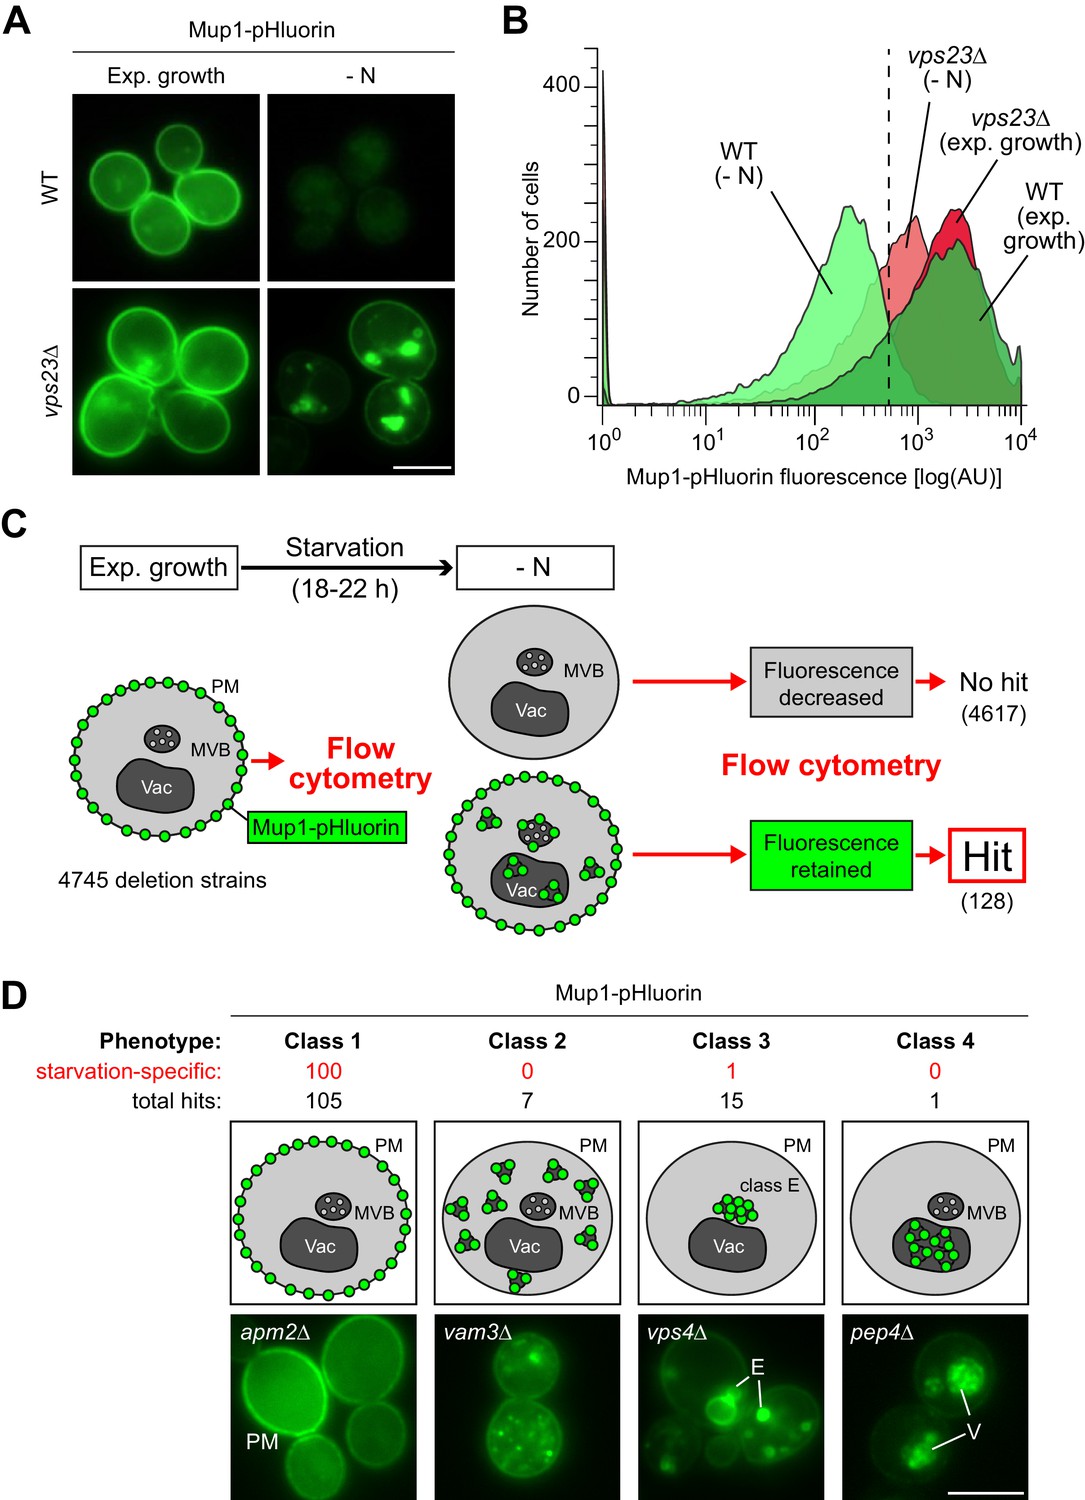
A genome wide screen revealed genes affecting Mup1-pHluorin endocytosis during starvation.
(A) Live-cell fluorescence microscopy analysis of WT (BY4742) and vps23∆ cells expressing MUP1-pHluorin from plasmid and starved (- N) for 18–22 hr. The images exemplify quenched pHluorin fluorescence in vacuoles of wild type (WT)-like cells and retained fluorescence in mutants with defects in the starvation-induced endocytosis of Mup1-pHluorin. (B) The strains from (A) were exponentially grown in 96-well plates for 5 hr and starved (- N) for 18–22 hr. At least 15,000 cells from each strain and condition were analyzed by flow cytometry. The exemplified histograms display decrease of fluorescence in wild type (WT)-like strains and fluorescence retention in mutants with defects in the starvation-induced endocytosis of Mup1-pHluorin (e.g. vps23∆). (C) Workflow of the flow-cytometry-based genome-wide screen for mutants defective in starvation-induced endocytosis of Mup1-pHluorin. (D) Summary of phenotypes of all mutants scored in the starvation-induced endocytosis screen (C) as determined by fluorescence microscopy. Class one mutants retain Mup1-pHluorin fluorescence at the plasma membrane (PM); class two mutants in small cytosolic objects; class three mutants in class E-like objects (E); class four mutants within vacuoles (V). Each phenotype is exemplified by one representative deletion mutant. Indicated are the numbers of strains that share a similar phenotype and the number of hits specific for starvation-induced endocytosis of Mup1-pHluorin (red). Scale bars = 5 µm. See also Figure 2—figure supplement 1 and Supplementary file 2.
Figure 2—figure supplement 1
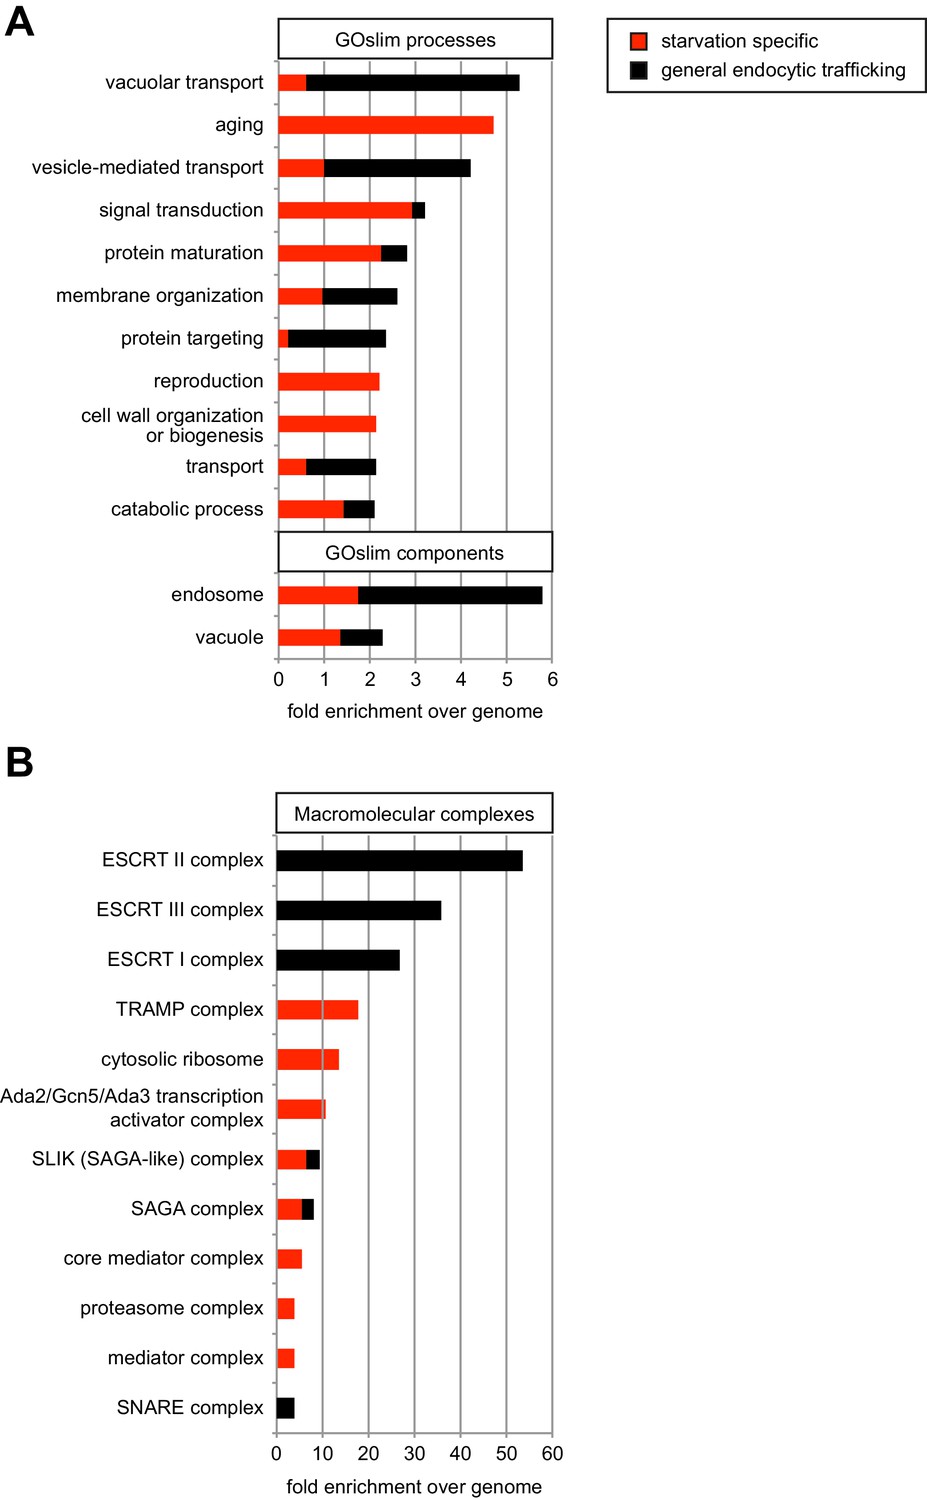
Gene ontology term analysis of the genome wide screen for genes affecting starvation-induced endocytosis of Mup1-pHluorin.
(A) Enrichment of cellular processes and components GO terms in 128 hits from the genome-wide screen for genes involved in the starvation-induced endocytosis of Mup1-pHluorin (Supplementary file 2). Data are represented as fold-enrichment over whole genome frequency, with the fraction of starvation-specific genes in red and general endocytic trafficking regulators in black. Only GO terms with more than two-fold enrichment over genome were included. (B) Enrichment of macromolecular complex GO terms in 128 hits from the genome-wide screen for genes involved in the starvation-induced endocytosis of Mup1-pHluorin analyzed as in (A). See also Supplementary file 3.
Figure 3 with 1 supplement
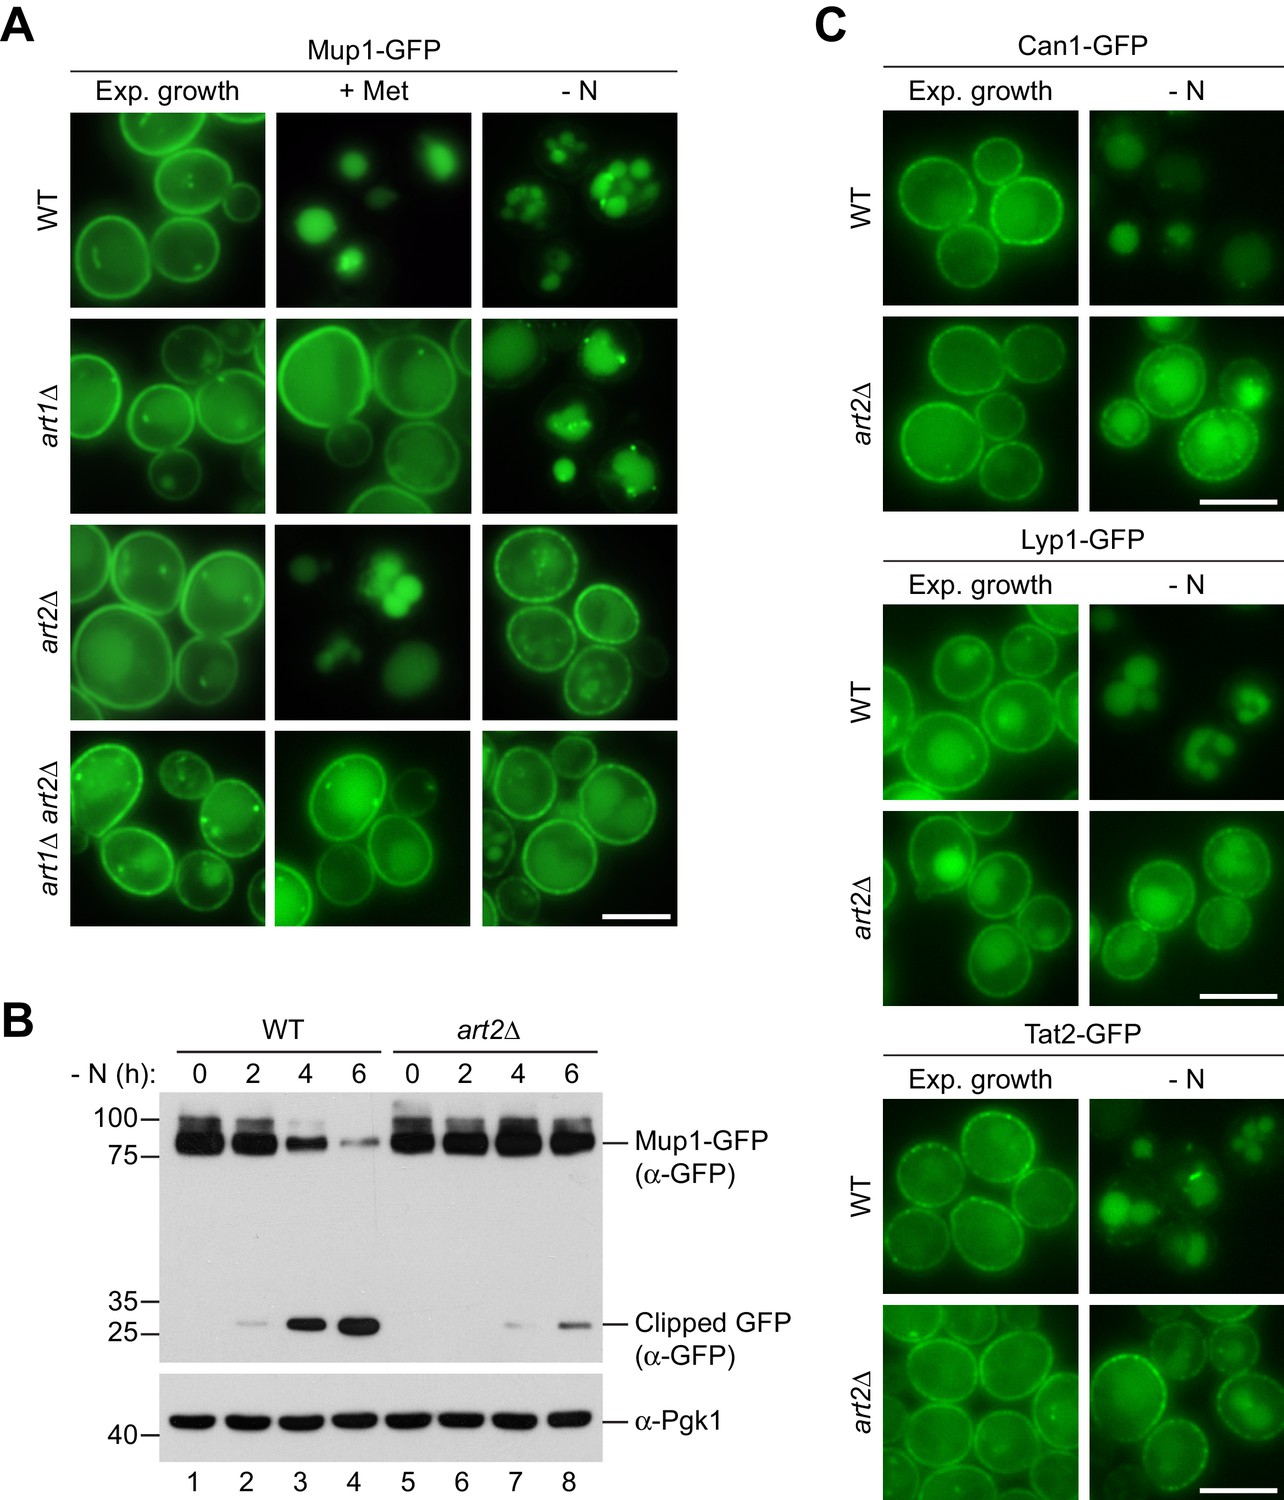
Art1 and Art2 are non-redundant in promoting substrate- and starvation-induced endocytosis of amino acid transporters.
(A) Live-cell fluorescence microscopy analysis of Mup1-GFP endocytosis in wild type (WT), art1∆, art2∆ and art1∆ art2∆ cells expressing MUP1-GFP from plasmid. Cells were treated with 20 µg/ml L-methionine (+ Met) for 1.5 hr or starved (- N) for 6 hr after 24 hr exponential growth. (B) SDS PAGE and western blot analysis with the indicated antibodies of whole cell protein extracts from wild type (WT) and art2∆ cells expressing MUP1-GFP that were starved (- N) for the indicated times after 24 hr exponential growth. Quantification in Figure 3—figure supplement 1A. (C) Live-cell fluorescence microscopy analysis of wild type (WT) and art2∆ cells expressing CAN1-GFP, LYP1-GFP or TAT2-GFP. Cells were starved (- N) for 6 hr after 24 hr exponential growth. Scale bars = 5 µm. See also Figure 3—figure supplement 1.
Figure 3—figure supplement 1
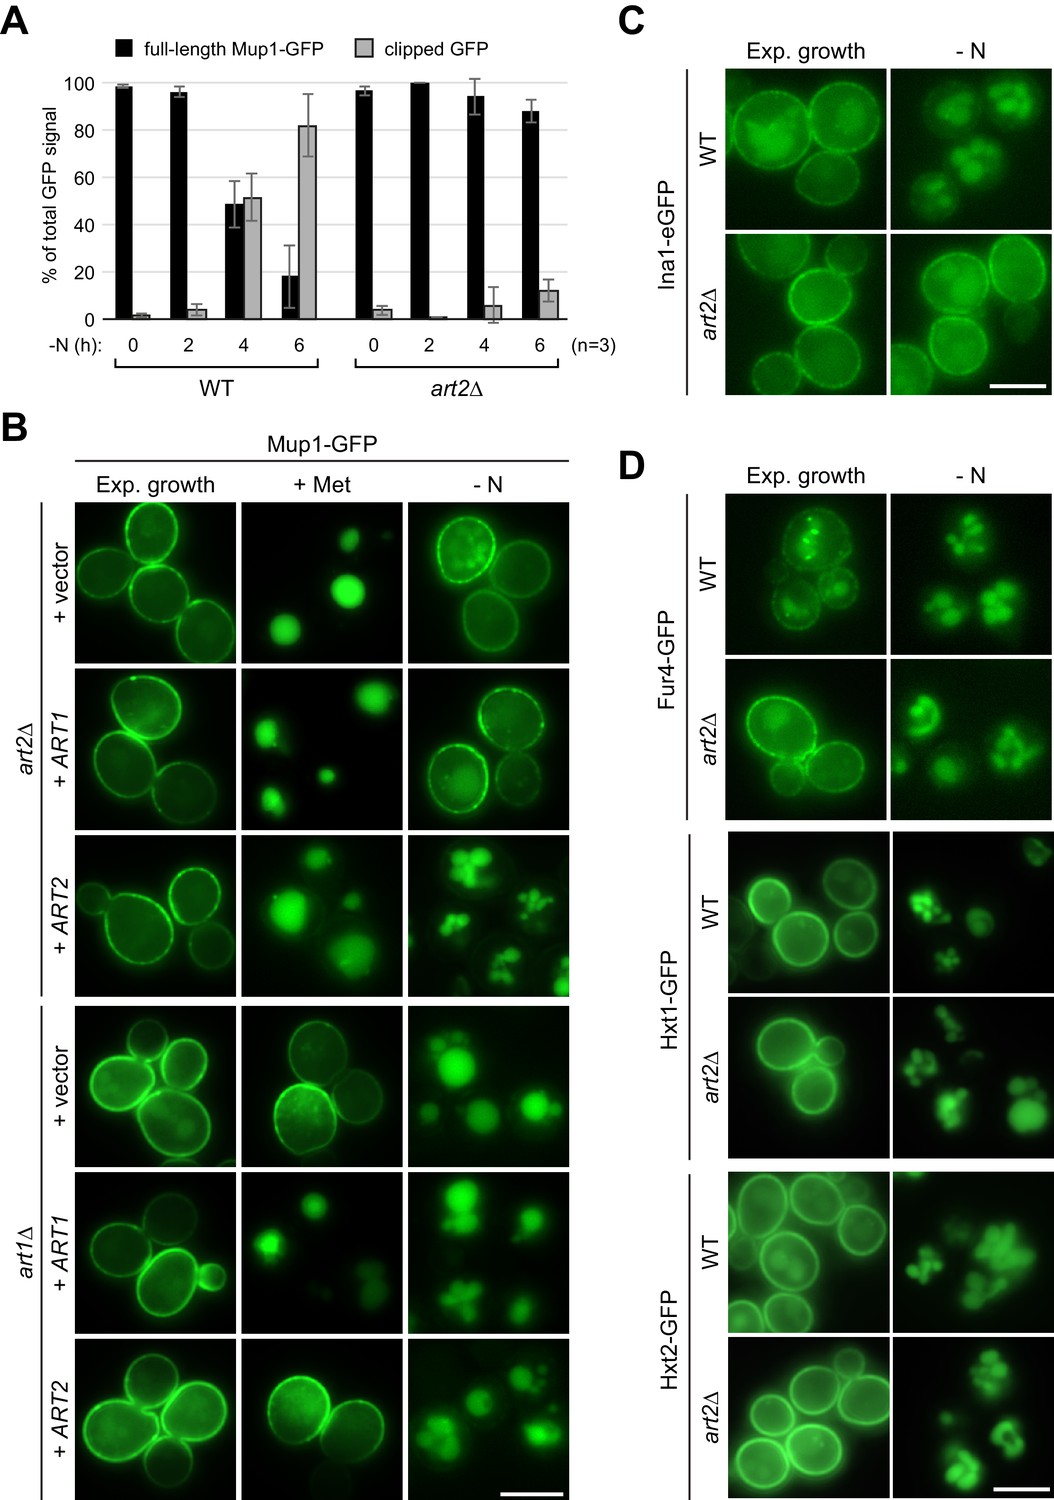
Art2-dependent and -independent starvation-induced endocytosis of PM proteins.
(A) Densitometric quantification of Figure 3B. Displayed is the distribution of the GFP signal into full length Mup1-GFP and clipped GFP fragment. Mean % of total GFP signal in each lane ± standard deviation from n = 3 independent experiments. (B) Live-cell fluorescence microscopy analysis of art2∆ and art1Δ cells expressing MUP1-GFP and plasmids encoding ART1, ART2 or empty vectors as indicated. Cells were treated with 20 µg/ml L-methionine (+ Met) for 1.5 hr or starved (- N) for 6 hr after 24 hr exponential growth. (C) Live-cell fluorescence microscopy analysis of wild type (WT) and art2∆ cells expressing INA1-eGFP. Cells were starved (- N) for 6 hr after 24 hr exponential growth. (D) Live-cell fluorescence microscopy analysis of wild type (WT) and art2∆ cells expressing pRS416-FUR4-GFP, HXT1-GFP or HXT2-GFP. Cells were starved (- N) for 6 hr after 24 hr exponential growth. Scale bars = 5 µm.
Figure 4 with 2 supplements
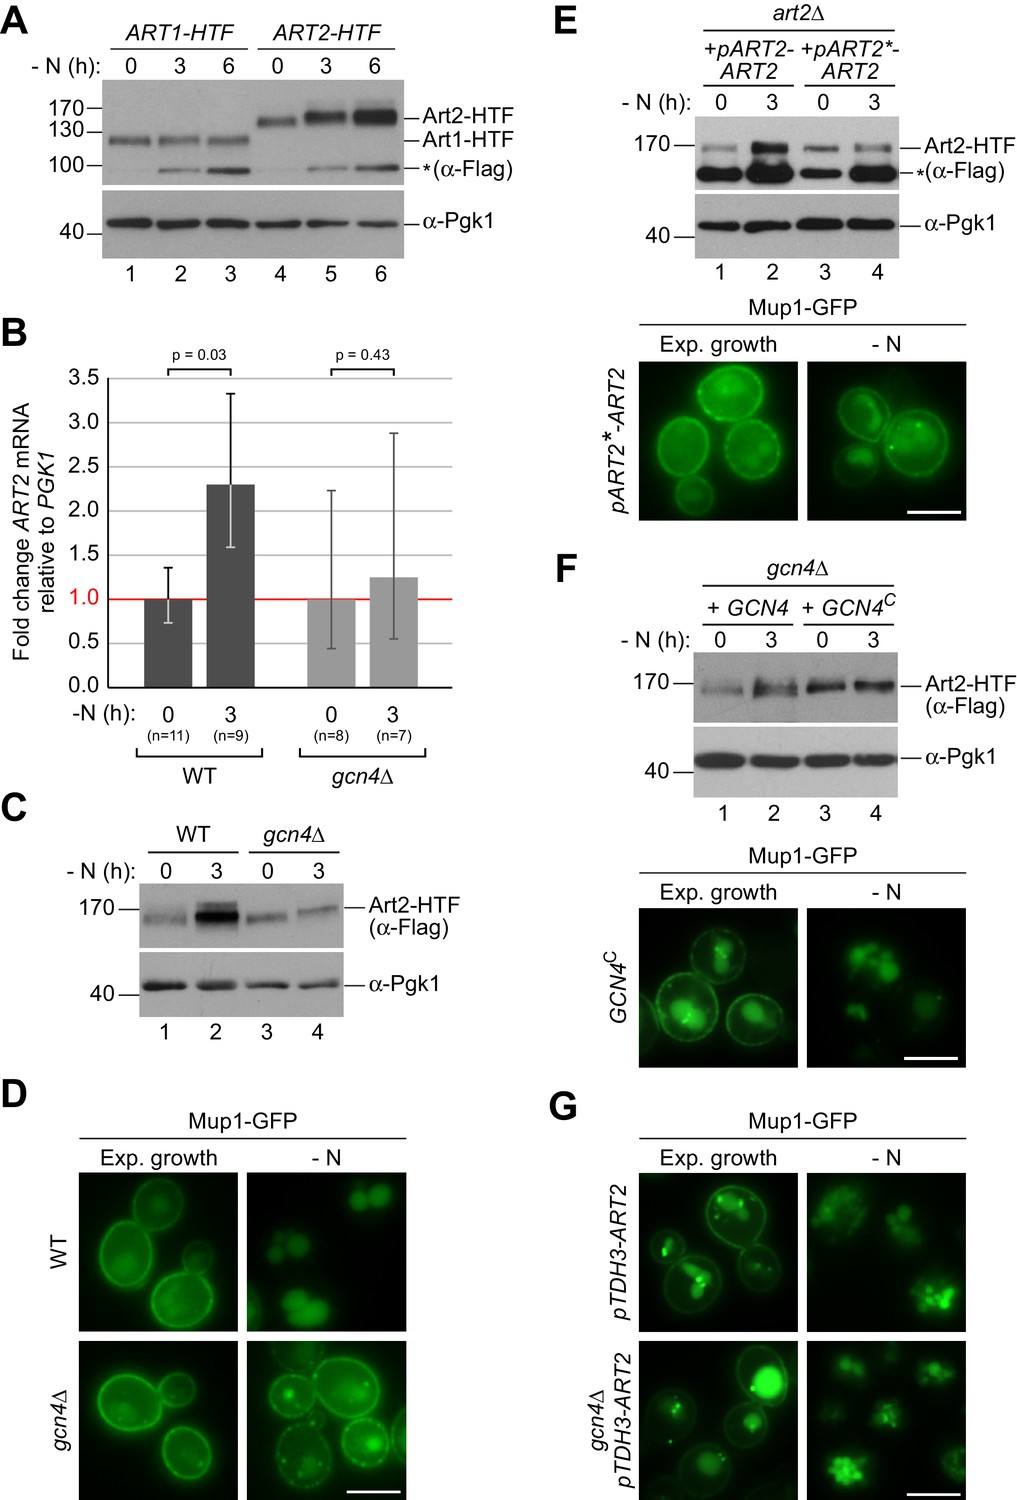
The general amino acid control pathway promotes starvation-induced endocytosis Mup1 by up-regulating Art2.
(A) SDS PAGE and western blot analysis with the indicated antibodies of whole cell protein extracts from WT cells expressing ART1-HTF or ART2-HTF. Cells were starved (- N) for the indicated times after 24 hr exponential growth. The asterisk indicates a non-specific background band of the FLAG antibody. Quantification in Figure 4—figure supplement 1B. (B) RT-qPCR analysis of ART2 transcript levels (normalized to the stable PGK1 transcript) in wild type (WT) and gcn4∆ cells. Cells were starved (- N) for 3 hr after 24 hr exponential growth. Values are presented as fold-change of the starting values (t = 0). Error bars represent the standard deviation. Statistical significance was assessed by Student’s t-test. (C) SDS PAGE and western blot analysis with the indicated antibodies of whole cell protein extracts from the indicated strains expressing ART2-HTF. Cells were starved (- N) for 3 hr after 24 hr exponential growth. Quantification in Figure 4—figure supplement 1C. (D) Live-cell fluorescence microscopy analysis of the indicated strains expressing MUP1-GFP from plasmid. Cells were starved (- N) for 6 hr after 24 hr exponential growth. (E), (F) The indicated strains were analyzed as in C) (upper panels) and D) (lower panels). Quantification of western blots in Figure 4—figure supplement 1F,G. (G) Live-cell fluorescence microscopy analysis of art2∆ or gcn4∆ cells expressing pRS415-MUP1-GFP and pRS416-pTDH3-ART2 starved (- N) for 6 hr after 24 hr exponential growth. Scale bars = 5 µm. See also Figure 4—figure supplements 1 and 2.
Figure 4—figure supplement 1
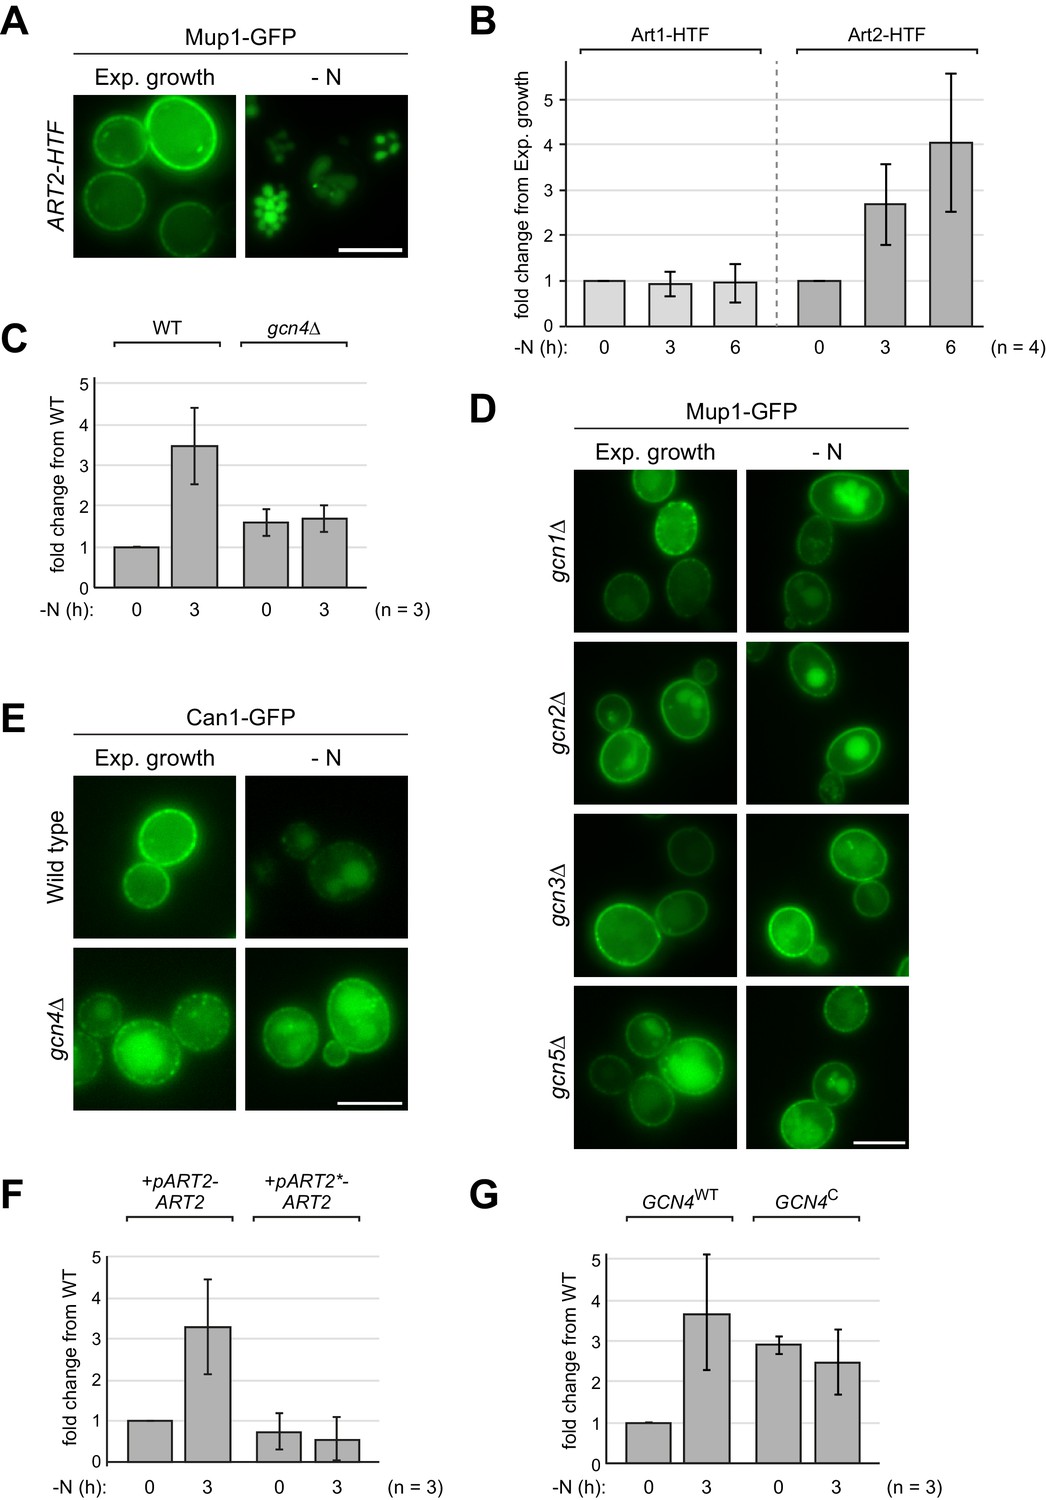
The general amino acid control pathway promotes starvation-induced endocytosis Mup1 by up-regulating Art2 – supporting experiments and quantifications.
(A) Live-cell fluorescence microscopy analysis of WT cells expressing chromosomally 6xHis-TEV-3xFLAG-tagged ART2 (ART2-HTF) and MUP1-GFP starved (- N) for 6 hr after 24 hr exponential growth. (B) Densitometric quantification of Art1-HTF and Art2-HTF protein levels in Figure 4A. Data were normalized to Pgk1 loading control and presented as fold-change from expression in exponential growth (0 hr) (mean ± standard deviation from n = 4 independent experiments). (C) Densitometric quantification of Art2-HTF protein levels in Figure 4C. Data were normalized to Pgk1 loading control and presented as fold-change in expression from WT in exponential growth (0 hr) (mean ± standard deviation from n = 3 independent experiments). (D), (E) Live-cell fluorescence microscopy analysis of the indicated strains starved (- N) for 6 hr after 24 hr exponential growth. (F), (G) Densitometric quantification of Art2-HTF protein levels in Figure 4E and F analyzed as in C). Scale bars = 5 µm.
Figure 4—figure supplement 2
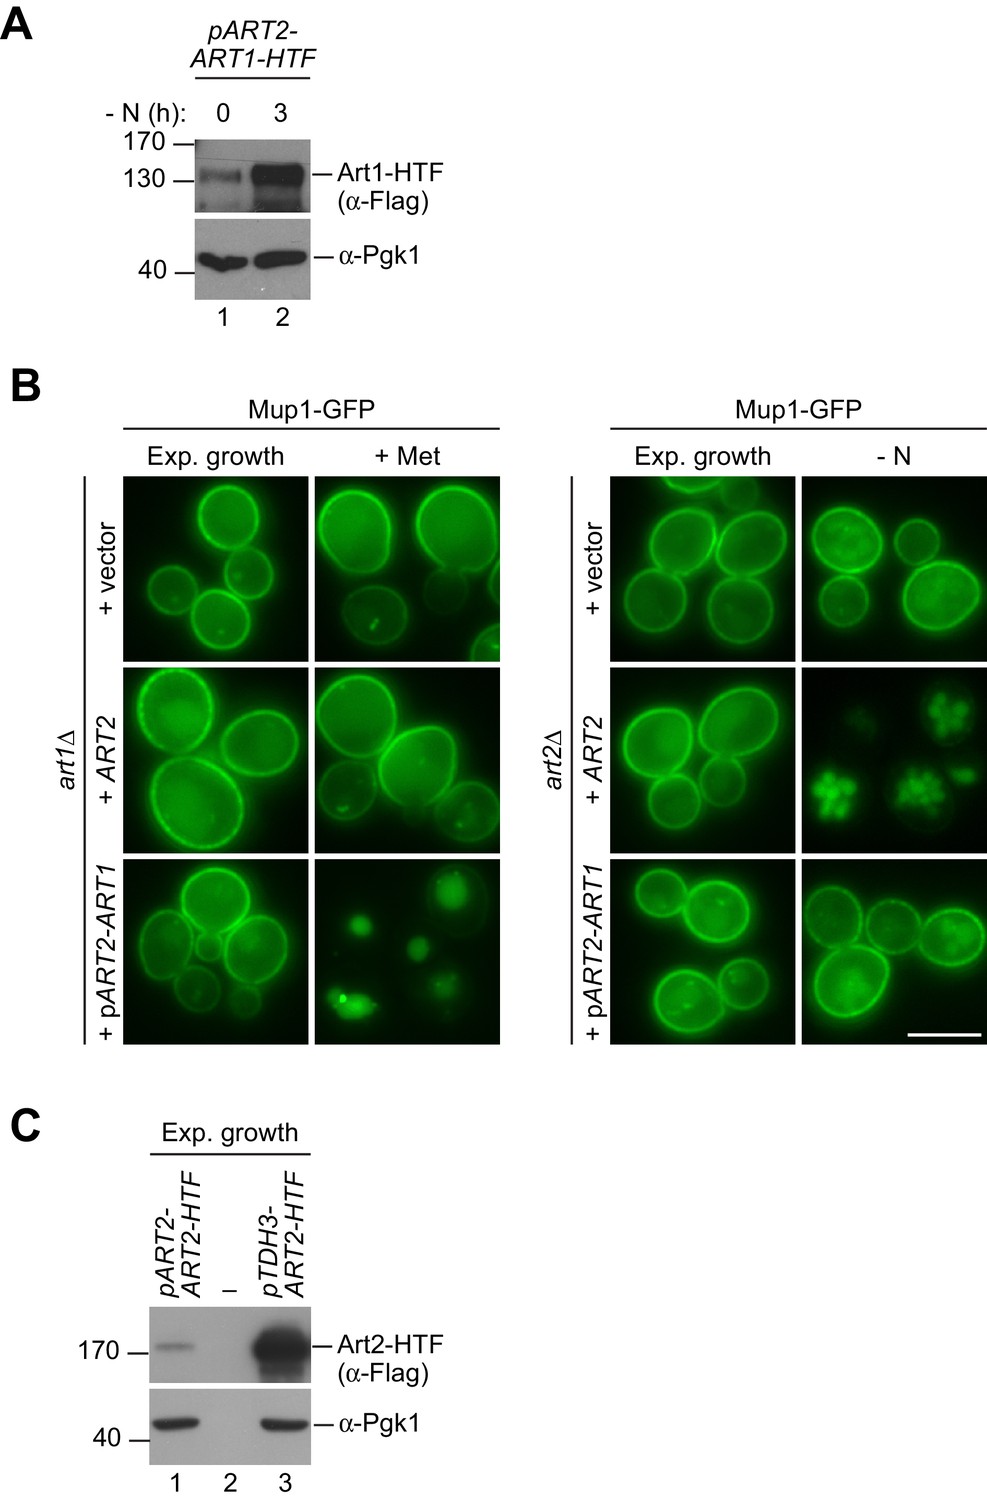
Upregulation of Art1 cannot substitute Art2 in starvation-induced endocytosis of Mup1.
(A) SDS PAGE and western blot analysis with the indicated antibodies of whole cell protein extracts from art2∆ cells expressing pRS416-pART2-ART1-HTF starved (- N) for 3 hr after 24 hr exponential growth. (B) Live-cell fluorescence microscopy analysis of art1∆ and art2∆ cells expressing MUP1-GFP and the indicated plasmids. Cells were treated with 20 µg/ml L-methionine (+ Met) for 1.5 hr or starved (- N) for 6 hr after 24 hr exponential growth. (C) SDS PAGE and western blot analysis with the indicated antibodies of whole cell protein extracts from WT cells expressing pART2-ART2-HTF or pRS416-pTDH3-ART2-HTF after 24 hr exponential growth. Scale bars = 5 µm.
Figure 5 with 1 supplement
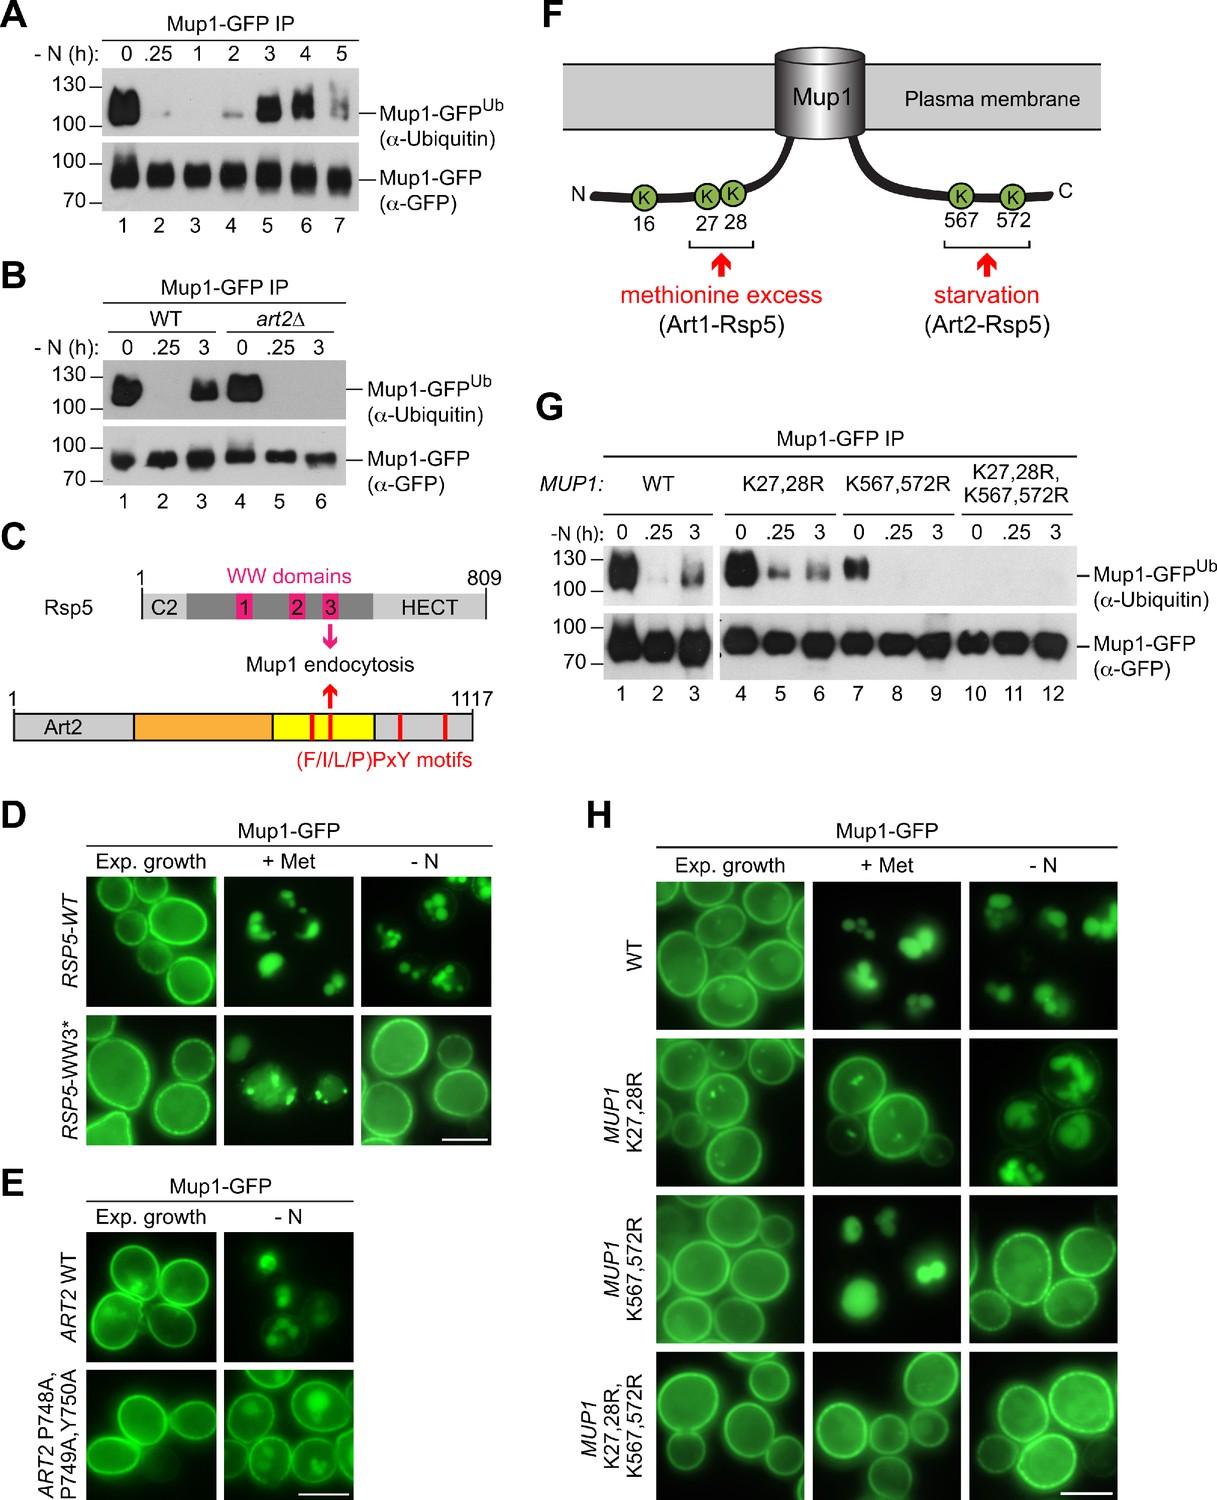
Art2-Rsp5 mediates the starvation-induced ubiquitination of Mup1-GFP at two specific C-terminal lysine residues.
(A), (B) SDS PAGE and western blot analysis with the indicated antibodies of immunoprecipitated Mup1-GFP from WT cells or art2∆ cells starved for the indicated times after 24 hr of exponential growth. Equal amounts of immunoprecipitated Mup1-GFP were loaded to compare the extent of ubiquitination. (C) Scheme depicting the domain arrangement of Rsp5 and Art2, indicating the localization of the WW domains and PY motifs required for starvation-induced endocytosis of Mup1. (D) Live-cell fluorescence microscopy analysis of rsp5∆ cells expressing pRS416-MUP1-GFP and pRS415-HTF-RSP5-WT (wild type) or pRS415-HTF-RSP5-WW3*. Cells were treated with 20 µg/ml L-methionine (+ Met) for 1.5 hr or starved (- N) for 6 hr after 24 hr exponential growth. (E) Live-cell fluorescence microscopy analysis of art2∆ cells expressing MUP1-GFP and pRS416-ART2 (WT) or pRS416-ART2 P748A,P749A,Y750A. Cells were starved (- N) for 6 hr after 24 hr exponential growth. (F) Scheme of Mup1 topology with the N- and C-terminal ubiquitination sites targeted during substrate excess by Art1-Rsp5 and during starvation by Art2-Rsp5. Ubiquitinated lysines (K) shown in green with numbers corresponding to amino acid positions in the Mup1 sequence. (G) WT cells expressing MUP1-GFP WT or the indicated MUP1-GFP mutants starved for the indicated times after 24 hr of exponential growth analyzed as in B). (H) Live-cell fluorescence microscopy analysis of cells expressing MUP1-GFP (wild type (WT)), MUP1 K27,28R-GFP, MUP1 K567,572R-GFP or MUP1 K27,28,567,572R-GFP as in D). Scale bars = 5 µm. See also Figure 5—figure supplement 1.
Figure 5—figure supplement 1
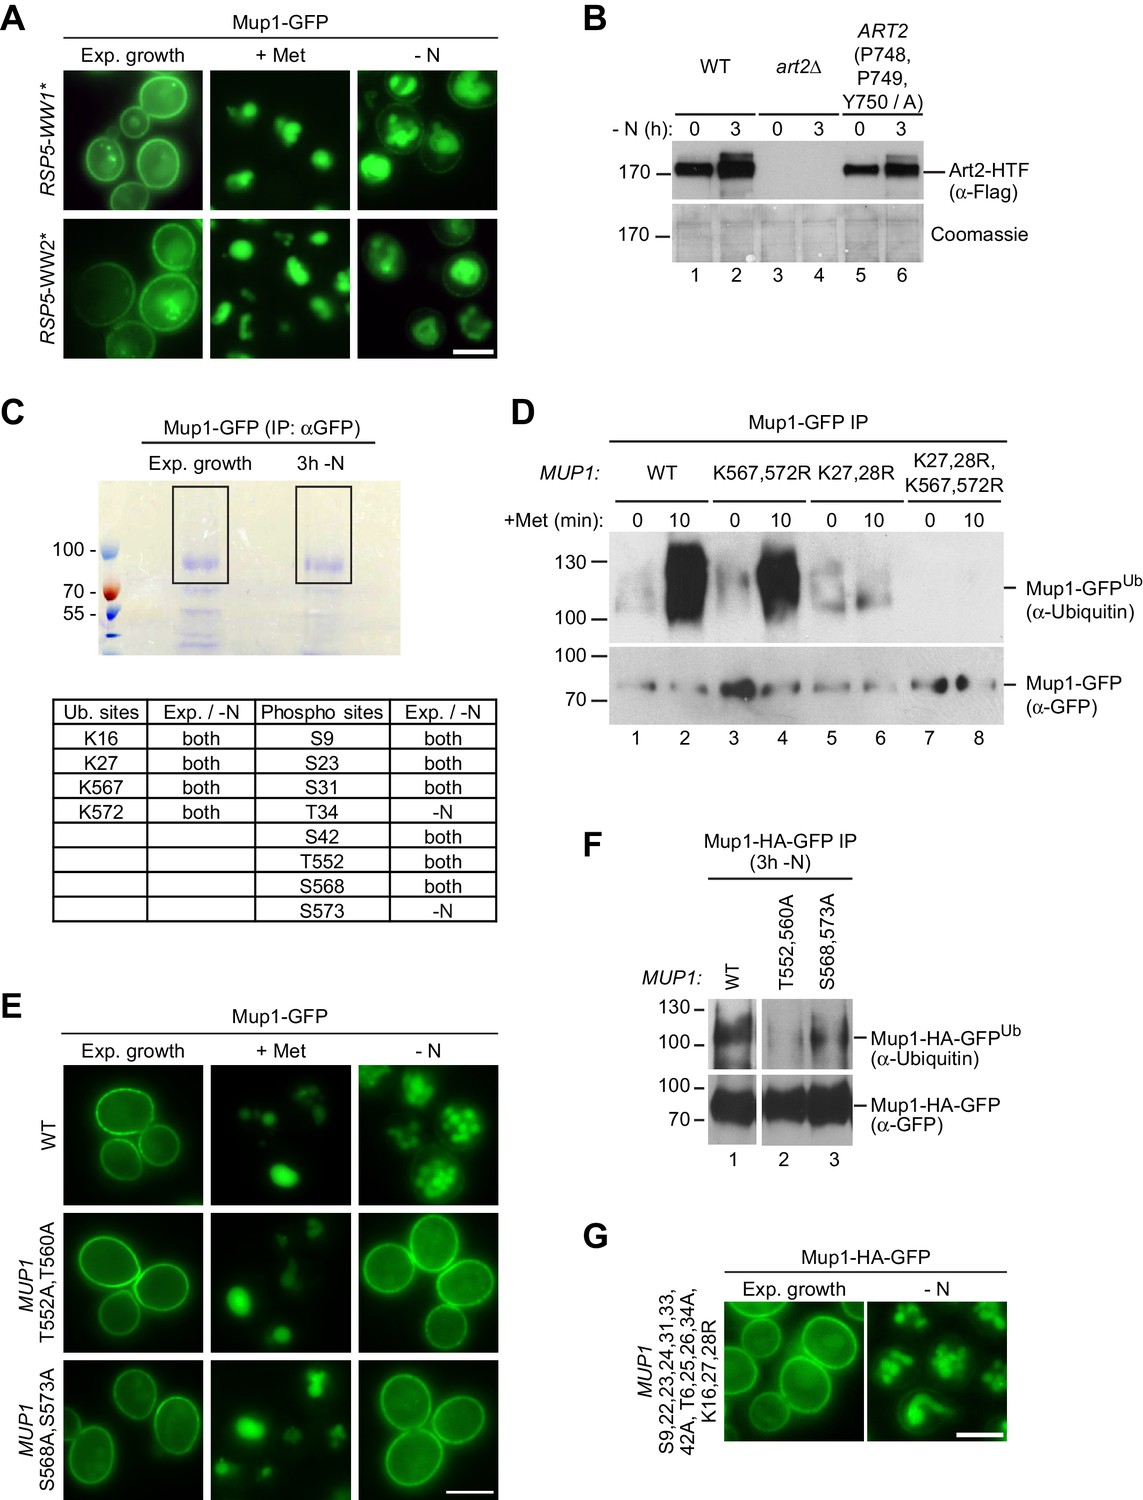
Post-translational modifications regulating starvation- and substrate-induced endocytosis of Mup1.
(A) Live-cell fluorescence microscopy analysis of rsp5∆ cells expressing pRS416-MUP1-GFP and pRS415-HTF-RSP5-WW1* or pRS415-HTF-RSP5-WW2*. Cells were treated with 20 µg/ml L-methionine (+ Met) for 1.5 hr or starved (- N) for 6 hr after 24 hr exponential growth. (B) SDS PAGE and western blot analysis with the indicated antibodies of whole cell protein extracts from art2∆ cells expressing pRS416-ART2-HTF (WT), pRS416 or pRS416-ART2 P748A,P749A,Y750A-HTF. Cells were starved (- N) for 3 hr after 24 hr exponential growth. (C) Upper panel: Coomassie-stained SDS PAGE of immunoprecipitated Mup1-GFP from WT cells after 24 hr exponential growth or subsequent 3 hr starvation (-N). The black rectangles indicate the regions of the gel analyzed by mass spectrometry. Lower panel: Ubiquitinated lysine (K) and phosphorylated serine (S) and threonine (T) residues of Mup1 identified by mass spectrometry during exponential growth and/or starvation with numbers corresponding to amino acid positions in the Mup1 sequence. (D) SDS PAGE and western blot analysis with the indicated antibodies of immunoprecipitated Mup1-GFP from WT cells or the indicated MUP1 mutants treated with 20 µg/ml L-methionine for 10 min after 24 hr of exponential growth. Equal amounts of immunoprecipitated Mup1-GFP were loaded to compare the extent of ubiquitination. (E) Live-cell fluorescence microscopy analysis of cells expressing MUP1-GFP (wild type (WT)), MUP1 T552,560A-GFP or MUP1 S568,573A-GFP. Cells were treated with 20 µg/ml L-methionine (+ Met) for 1.5 hr or starved (- N) for 6 hr after 24 hr exponential growth. (F) MUP1-HA-GFP (wild type (WT)), MUP1 T552,560A-HA-GFP or MUP1 S568,573A-HA-GFP cells were starved (- N) for 3 hr and analyzed as in D). (G) Live-cell fluorescence microscopy analysis of cells expressing MUP1 T6,25,26,34A,S9,22,23,24,31,33,42A,K16,27,28R-HA-GFP. Cells were starved (- N) for 3 hr after 24 hr exponential growth. Scale bars = 5 µm.
Figure 6 with 2 supplements

The C-terminus of Mup1 harbors a transplantable, starvation-responsive acidic degron.
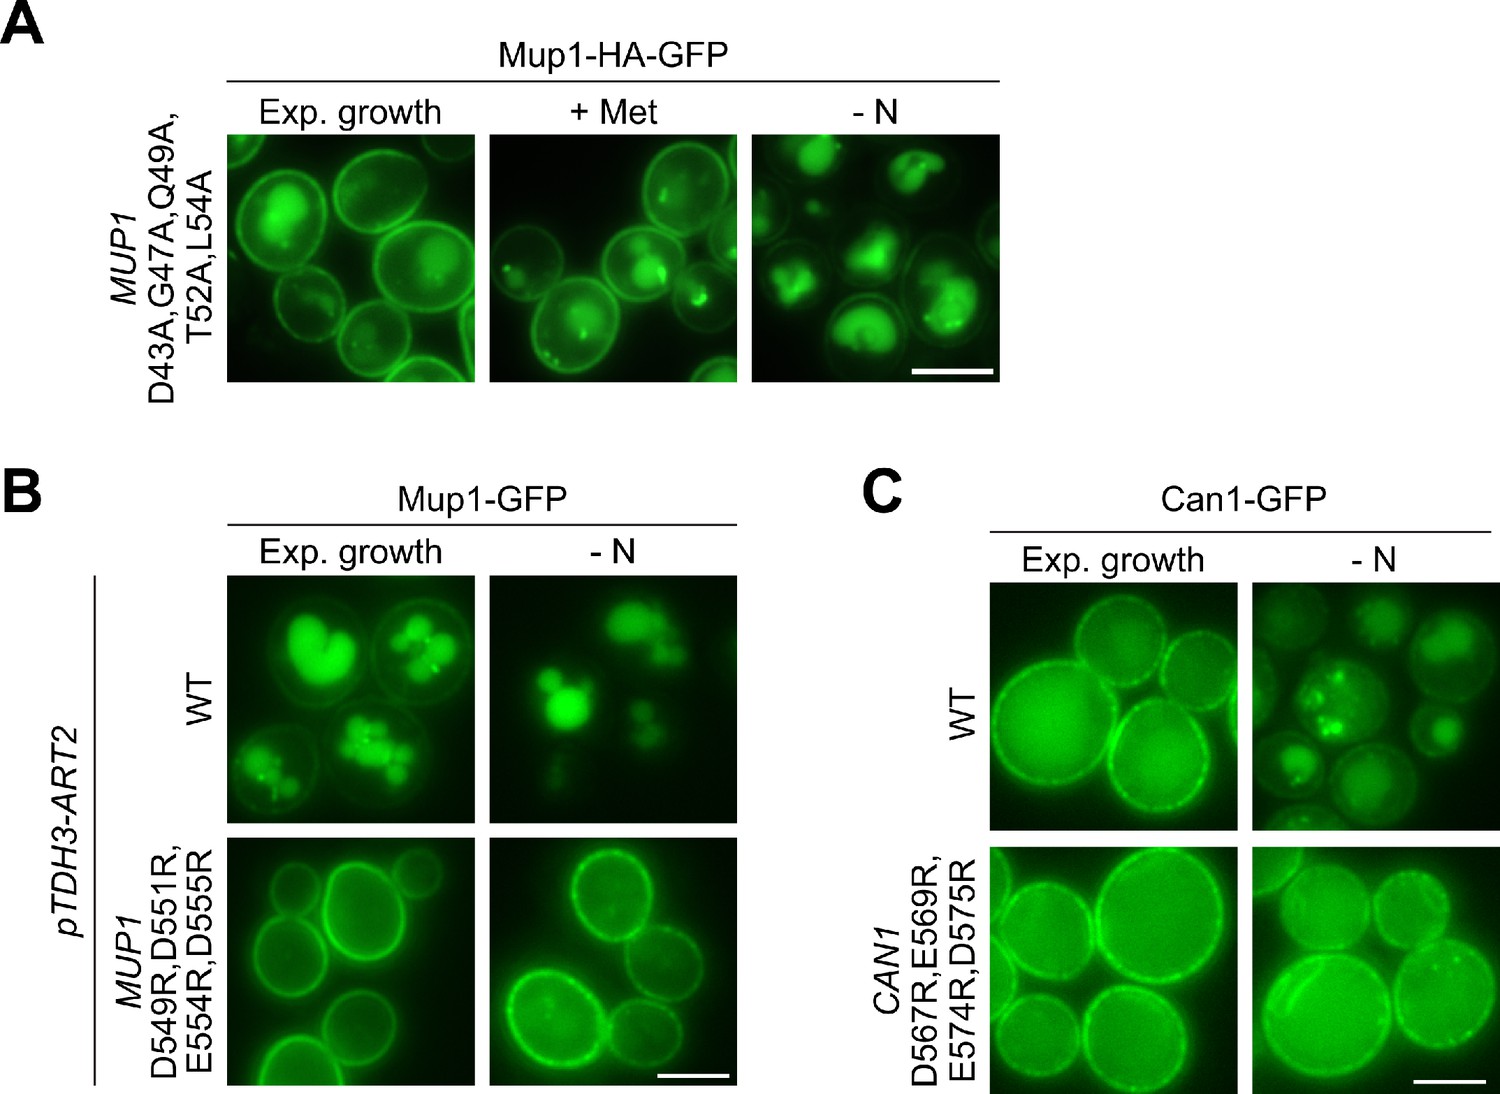
(A) Left: scheme of Mup1 topology with N- and C-terminal ubiquitination sites and acidic patches targeted by Art1-Rsp5 and Art2-Rsp5, respectively, and the C-terminal phosphorylation sites of Mup1 that promote its starvation-induced endocytosis. Ubiquitinated lysines (K) shown in green and phosphorylated serines (S) and threonines (T) in red with numbers corresponding to amino acid positions in the Mup1 sequence. Right: Hxt3 as an Art4-Rsp5 dependent cargo during nitrogen starvation. (B) Live-cell fluorescence microscopy analysis of Mup1-GFP endocytosis in cells expressing MUP1-GFP (wild type (WT)) or MUP1 D549R,D551R,E554R,D555R-GFP. Cells were treated with 20 µg/ml L-methionine (+ Met) for 1.5 hr or starved (- N) for 6 hr after 24 hr exponential growth. (C) SDS PAGE and western blot analysis with the indicated antibodies of immunoprecipitated Mup1-GFP from cells expressing MUP1-GFP (WT) or MUP1 D549R,D551R,E554R,D555R-GFP starved for the indicated times after 24 hr of exponential growth. Equal amounts of immunoprecipitated Mup1-GFP were loaded to compare the extent of ubiquitination. (D) Amino acid sequence alignment of the C-terminal acidic patches of Mup1, Can1, Lyp1, Tat2 and Ina1. The boxes indicate acidic residues (red) and phosphorylation sites (blue), which are required for Art2-dependent starvation-induced endocytosis. Red letters illustrate further acidic residues. (E) Live-cell fluorescence microscopy analysis of wild type (WT), art4∆ and art2∆ art4∆ cells expressing HXT3-GFP (top), HXT3-MUP1-C-GFP (second row), HXT3-MUP1-C K567,572R-GFP (third row) or HXT3-MUP1-C D549R,D551R,E554R,D555R-GFP (bottom). Cells were starved (- N) for 6 hr after 24 hr exponential growth. Scale bars = 5 µm. See also Figure 6—figure supplements 1 and 2.
Figure 6—figure supplement 1
The role of acidic patches in AATs for starvation-induced endocytosis.
(A-C) Live-cell fluorescence microscopy analysis of the indicated strains treated with 20 µg/ml L-methionine (+ Met) for 1.5 hr or starved (- N) for 6 hr after 24 hr exponential growth. Scale bars = 5 µm.
Figure 6—figure supplement 2
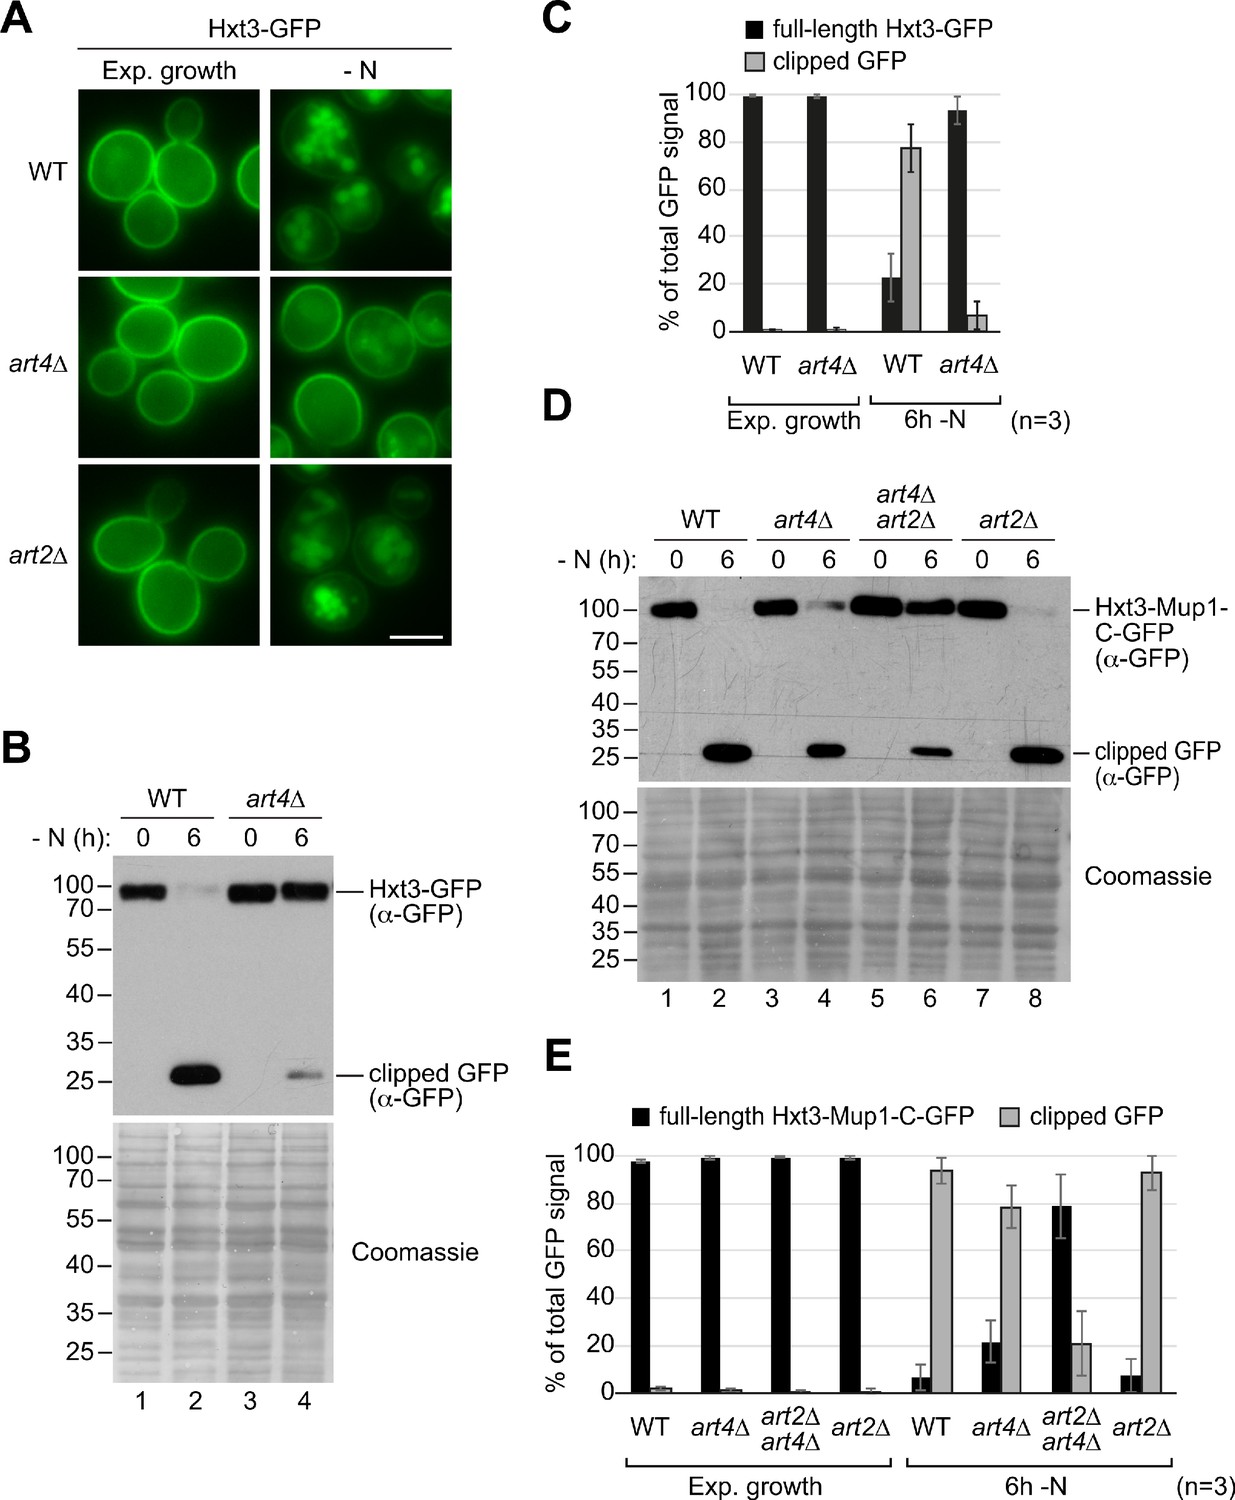
Art4-dependent starvation-induced endocytosis of Hxt3.
(A) Live-cell fluorescence microscopy analysis of the indicated strains starved (- N) for 6 hr after 24 hr exponential growth. (B) SDS PAGE and western blot analysis with the indicated antibodies of whole cell protein extracts from wild type (WT) and art4∆ cells expressing HXT3-GFP. Cells were starved (- N) for 6 hr after 24 hr exponential growth. Coomassie staining of the membrane serves as loading control. (C) Densitometric quantification of B). Displayed is the distribution of the GFP signal into full length Hxt3-GFP and clipped GFP fragment. Mean % of total GFP signal in each lane ± standard deviation from n = 3 independent experiments. (D) Wild type (WT), art4∆, art2∆ art4∆ and art2∆ cells expressing HXT3-MUP1-C-GFP were treated as in B). (E) Densitometric quantification of C). Displayed is the distribution of the GFP signal into full-length Hxt3-Mup1-C-GFP and clipped GFP fragment. Mean % of total GFP signal in each lane ± standard deviation from n = 3 independent experiments. Scale bars = 5 µm.
Figure 7 with 1 supplement

A basic patch of Art2 promotes the starvation-induced endocytosis of Mup1, Can1 and Lyp1.
(A) Scheme of Art2 topology with arrestin-N domain in orange, arrestin-C domain in yellow and tails and interspersed extended loops (Baile et al., 2019) in light grey. The basic amino acid residues shown in blue mediate the starvation-induced endocytosis of Mup1, Can1 and Lyp1 (numbers correspond to amino acid positions in the Art2 sequence). Below is aligned the HHpred consensus sequence for Art2/Ecm21 derived from three HHblits iterations (Zimmermann et al., 2018), suggesting conservation of the basic patch in the Art2 protein family. (B) Live-cell fluorescence microscopy analysis of art2∆ cells expressing MUP1-GFP, CAN1-GFP or LYP1-GFP and pRS416-ART2-WT, empty vector or pRS416-ART2 K664D,R665D,R666D,K667D. Cells were starved (- N) for 6 hr after 24 hr exponential growth. (C) Scheme for the regulation of the substrate- and starvation-induced endocytosis of Mup1. During substrate excess TORC1 inhibits the Npr1 kinase which otherwise would phosphorylate and inhibit Art1. Art1-Rsp5 becomes dephosphorylated and subsequently binds the acidic patch 1 at the N-terminal tail of Mup1, leading to the ubiquitination of K27 and K28 and degradation of Mup1 (left). During amino acid and nitrogen starvation, the general amino acid control (GAAC) pathway upregulates the ubiquitin ligase adaptor Art2 via the transcriptional regulator Gcn4. The ensuing Art2-Rsp5 complex binds with its basic patch to the acidic patch 2 of Mup1 leading to the ubiquitination of K567 and K572 and degradation of Mup1 (right). At the same time, starvation causes TORC1 inhibition and activation of Npr1 and inhibits Art1-dependent ubiquitination. Ubiquitinated lysines (K) shown in green and phosphorylated serines (S) and threonines (T) in red with numbers corresponding to amino acid positions in the Mup1 sequence. Scale bars = 5 µm. See also Figure 7—figure supplement 1.
Figure 7—figure supplement 1
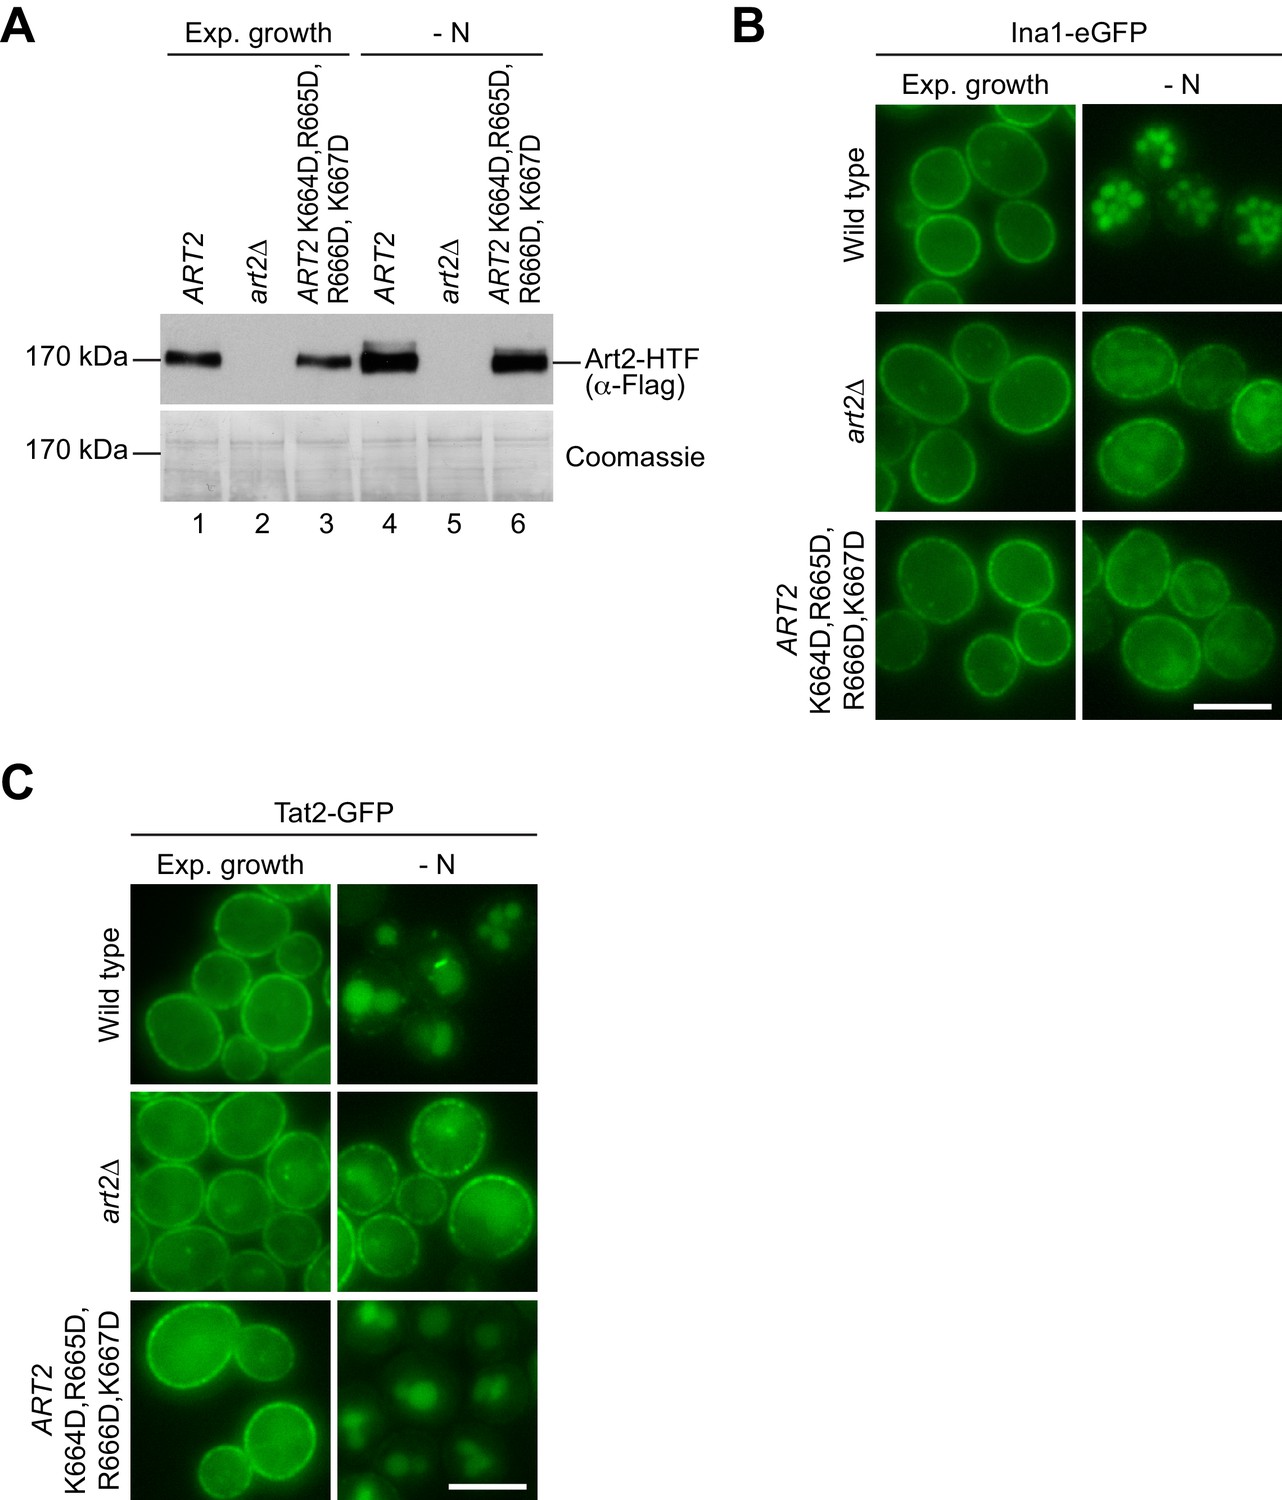
Additional characterization of the basic patch mutant of Art2.
(A) SDS PAGE and western blot analysis with the indicated antibodies of whole cell protein extracts from art2∆ cells expressing pRS416-ART2-HTF, empty vector or pRS416-ART2 K664D,R665D,R666D,K667D-HTF. Cells were starved (- N) for 3 hr after 24 hr exponential growth. (B) Live-cell fluorescence microscopy analysis of art2∆ cells expressing INA1-eGFP and pRS416-ART2, empty vector or pRS416-ART2 K664D,R665D,R666D,K667D. Cells were starved (- N) for 6 hr after 24 hr exponential growth. (C) Live-cell fluorescence microscopy analysis of art2∆ cells expressing TAT2-GFP and pRS416-ART2, empty vector or pRS416-ART2 K664D,R665D,R666D,K667D. Cells were starved (- N) for 6 hr after 24 hr exponential growth. Scale bars = 5 µm.
Author response image 1
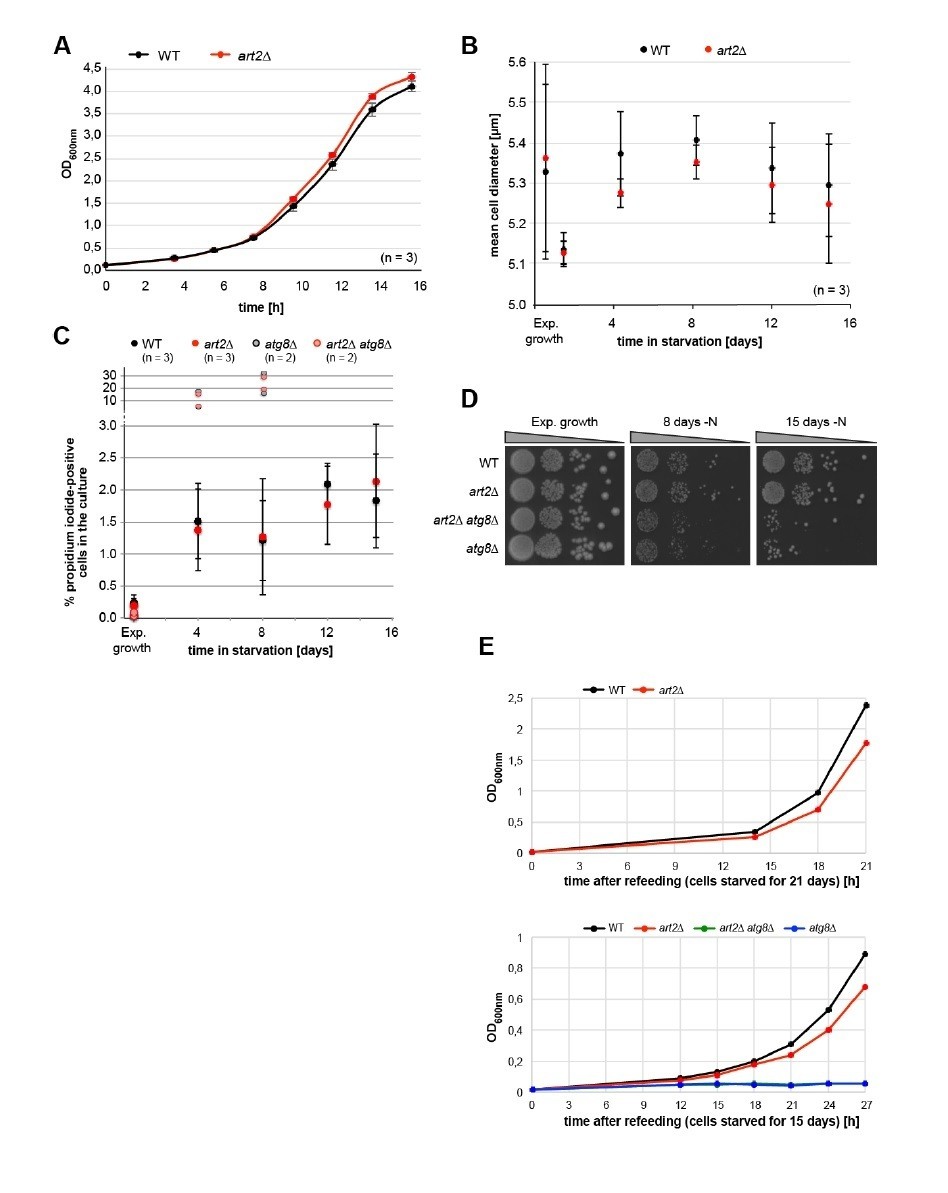
Physiological effects of ART2 deletion.
(A) Growth of isogenic WT (art2Δ + pART2) and art2Δ cells in synthetic auxotrophy medium (YNB) at 26°C. Cultures were grown exponentially for 24 hours and then inoculated to OD600nm = 0.1 at t=0h. Culture density was followed by OD600nm. Mean ± standard deviation from n = 3 independent experiments. (B) Mean cell diameter (± standard deviation) measured with CASY TTT cell counter (Omni Life Sciences, Bremen, Germany) of isogenic WT (art2Δ + pART2) and art2Δ cells grown exponentially for >24 hours and then starved for amino acids and nitrogen for the indicated time. (C) Isogenic WT (art2Δ + pART2), art2Δ, atg8Δ (art2Δ, atg8Δ + pART2) and art2Δatg8Δ cells grown exponentially for >24 hours and then starved for amino acids and nitrogen for the indicated time. Cells were stained with propidium iodide (PI, 3 μg/ml) for ten minutes, washed, and PI-positive cells were counted on an Attune TM NxT Cytometer (Life Technologies). 50000 cells were counted for each genotype and replicate. WT and art2Δ: mean ± standard deviation from n = 3 independent experiments. For the atg8Δ and art2Δatg8Δ cells two independent experiments are shown. (D) Isogenic WT (art2Δ + pART2), art2Δ, atg8Δ (art2Δatg8Δ + pART2) and art2Δatg8Δ cells were grown exponentially for >24 hours and then starved for amino acids and nitrogen (-N) for the indicated time. Survival was assessed by colony forming ability. Serial dilutions of the cultures were spotted on YPD rich medium. (E) Isogenic WT (art2Δ + pART2), art2Δ, atg8Δ (art2Δatg8Δ + pART2) and art2Δatg8Δ cells were grown exponentially for >24 hours and then starved for amino acids and nitrogen (-N) for 21 (upper panel) and 15 days (lower panel). Starved cells were re-inoculated into fresh auxotrophic selection medium (YNB) to OD600nm = 0.1 at t = 0h. Culture density was followed by OD600nm.
Author response image 2
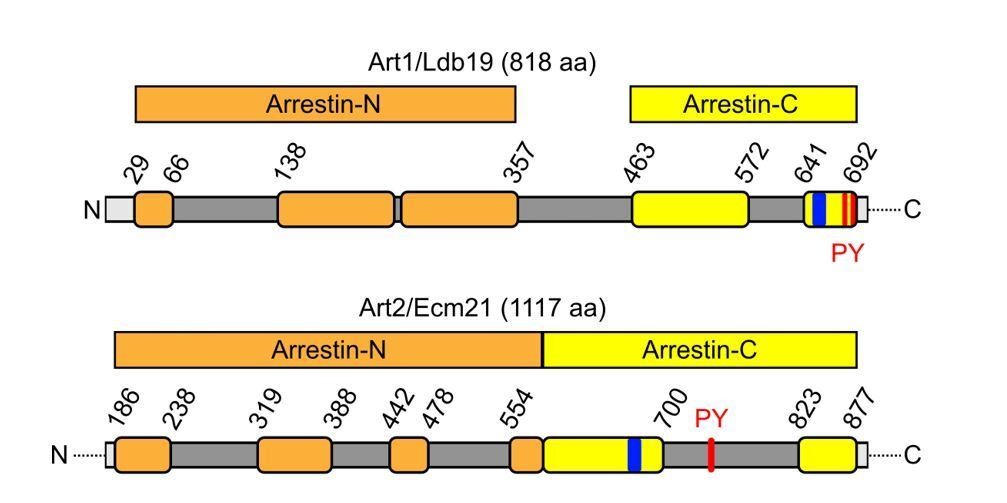
Schematic depicting the primary structure of Art1 and Art2 with predicted arrestin-N (orange) and arrestin-C (yellow) domains and the position of interspersed, disordered loops (dark grey), basic patches (blue) and PY motifs (red) drawn according to Baile et al., 2019).
Author response image 3

Life cell fluorescence microscopy of the indicated strains chromosomally expressing.
Thi7-eGFP, or expressing Thi-eGFP or Nrt1-eGFP from centromeric plasmids under control of the THI7 promoter (Savocco et al., 2019) during exponential growth and after 6 hours of amino acid and nitrogen starvation (-N).
Author response image 4
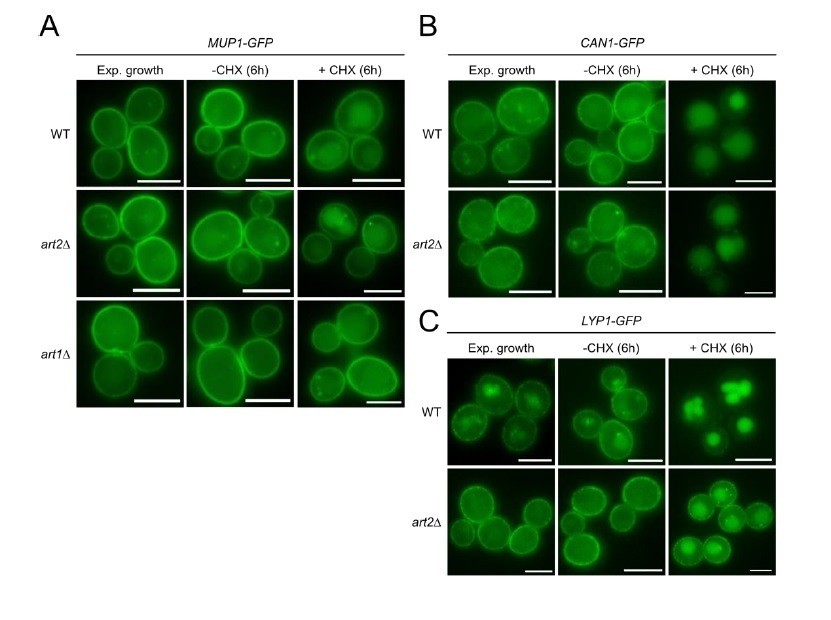
Life cell fluorescence microscopy of WT, art2Δ or art1Δ cells chromosomally expressing Mup1-GFP (A), Can1-GFP (B) or Lyp1-GFP (C) during exponential growth and 6 hour after treatment with 50 μg/ml cycloheximide (+CHX) or vehicle (water; -CHX).
Author response image 5
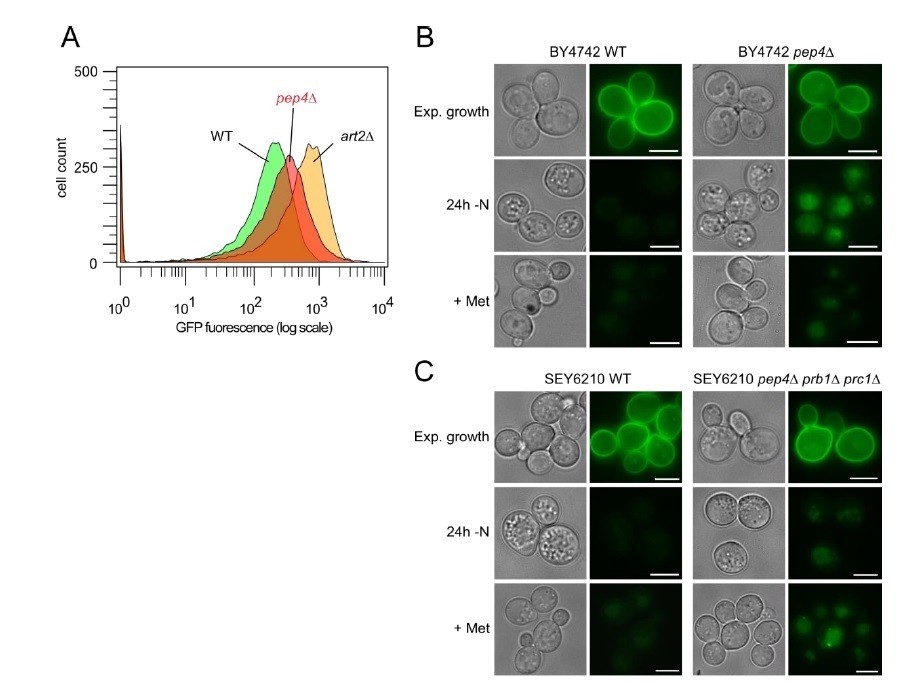
Impaired pHluorin quenching in pep4Δ cells.
(A) Flow cytometry analysis of BY4742 WT (green histogram), art2Δ (yellow) and pep4Δ cells (red) after 20h of amino acid and nitrogen starvation. (B) Live cell fluorescence microscopy of BY4742 WT and pep4Δ cells during exponential growth, after 24h of amino acid and nitrogen starvation (-N), and after 90 minutes of methionine treatment (20 μg/ml; +Met). Fluorescence images of WT and pep4Δ cells were equally adjusted to allow for comparison of GFP fluorescence intensity. (C) Live cell fluorescence microscopy of SEY6210 WT and pep4Δprb1Δprc1Δ cells analyzed as in B).
Tables
Key resources table
| Reagent type (species) or resource | Designation | Source or reference | Identifiers | Additional information |
|---|---|---|---|---|
| Strain, strainbackground Saccharomyces cerevisiae | SEY6210 | Robinson et al., 1988 | SEY6210 | Parental yeast strain (genotype: MATα leu2-3,112 ura3-52 his3-Δ200 trp1-Δ901 suc2-Δ9 lys2-801 GAL), obtained from the Emr lab |
| Strain, strain background Saccharomyces cerevisiae | SEY6210.1 | Robinson et al., 1988 | SEY6210.1 | Parental yeast strain (genotype: MATa leu2-3,112 ura3-52 his3-Δ200 trp1-Δ901 suc2-Δ9 lys2-801 GAL), obtained from the Emr lab |
| Strain, strain background Saccharomyces cerevisiae | SEY6210 rsp5Δ::HIS3 pRS415-6xHIS-TEV-3xFLAG-RSP5 | This paper | DTY557 | RSP5 wild type yeast strain, obtained from the Emr lab (previously unpublished) |
| Strain, strain background Saccharomyces cerevisiae | SEY6210 rsp5Δ::HIS3 pRS415-6xHIS-TEV-3xFLAG-RSP5-WW1* | This paper | DTY558 | RSP5 mutant yeast strain, obtained from the Emr lab (previously unpublished) |
| Strain, strain background Saccharomyces cerevisiae | SEY6210 rsp5Δ::HIS3 pRS415-6xHIS-TEV-3xFLAG-RSP5-WW2* | This paper | DTY559 | RSP5 mutant yeast strain, obtained from the Emr lab (previously unpublished) |
| Strain, strain background Saccharomyces cerevisiae | SEY6210 rsp5Δ::HIS3 pRS415-6xHIS-TEV-3xFLAG-RSP5-WW3* | This paper | DTY560 | RSP5 mutant yeast strain, obtained from the Emr lab (previously unpublished) |
| Strain, strain background Saccharomyces cerevisiae | SEY6210 art4Δ::HIS3 HXT3-GFP::TRP1 | This paper | ISY001 | Mutant yeast strain generated by homologous recombination (for PCR primer see Supplementary file 4) |
| Strain, strain background Saccharomyces cerevisiae | SEY6210 art2Δ::HIS3 HXT3-GFP::TRP1 | This paper | ISY013 | Mutant yeast strain generated by homologous recombination (for PCR primer see Supplementary file 4) |
| Strain, strain background Saccharomyces cerevisiae | SEY6210 MUP1 D549,551,555R,E554R-GFP::HIS3 | This paper | ISY018 | Mutant yeast strain generated by homologous recombination (for PCR primer see Supplementary file 4) |
| Strain, strain background Saccharomyces cerevisiae | SEY6210 HXT3-MUP1-C AA545-574 D549,551,555R,E554R-GFP::TRP1 | This paper | ISY025 | Mutant yeast strain generated by homologous recombination (for PCR primer see Supplementary file 4) |
| Strain, strain background Saccharomyces cerevisiae | SEY6210.1 art4Δ::HIS3 HXT3-MUP1-C AA545-574 D549,551,555R,E554R-GFP::TRP1 | This paper | ISY026 | Mutant yeast strain generated by homologous recombination (for PCR primer see Supplementary file 4) |
| Strain, strain background Saccharomyces cerevisiae | SEY6210 art2Δ::HIS3 art4Δ::HIS3 HXT3-MUP1-C AA545-574 D549,551,555R,E554R-GFP::TRP1 | This paper | ISY027 | Mutant yeast strain generated by homologous recombination and mating/tetrad dissection (for PCR primer seeSupplementary file 4) |
| Strain, strain background Saccharomyces cerevisiae | SEY6210 art2Δ::HIS3 HXT3-MUP1-C AA545-574 D549,551,555R,E554R-GFP::TRP1 | This paper | ISY028 | Mutant yeast strain generated by homologous recombination (for PCR primer see Supplementary file 4) |
| Strain, strain background Saccharomyces cerevisiae | SEY6210 HXT3-MUP1-C AA545-574-GFP::TRP1 | This paper | ISY029 | Mutant yeast strain generated by homologous recombination (for PCR primer see Supplementary file 4) |
| Strain, strain background Saccharomyces cerevisiae | SEY6210.1 art4∆::HIS3 HXT3-MUP1-C AA545-574-GFP::TRP1 | This paper | ISY030 | Mutant yeast strain generated by homologous recombination (for PCR primer see Supplementary file 4) |
| Strain, strain background Saccharomyces cerevisiae | SEY6210 art2Δ::HIS3 art4Δ::HIS3 HXT3-MUP1-C AA545-574-GFP::TRP1 | This paper | ISY031 | Mutant yeast strain generated by homologous recombination and mating/tetrad dissection (for PCR primer seeSupplementary file 4) |
| Strain, strain background Saccharomyces cerevisiae | SEY6210 art2∆::HIS3 HXT3-MUP1-C AA545-574-GFP::TRP1 | This paper | ISY032 | Mutant yeast strain generated by homologous recombination (for PCR primer see Supplementary file 4) |
| Strain, strain background Saccharomyces cerevisiae | SEY6210 CAN1 D567,575R,E569,574R-GFP::HIS3 | This paper | ISY033 | Mutant yeast strain generated by homologous recombination (for PCR primer see Supplementary file 4) |
| Strain, strain background Saccharomyces cerevisiae | SEY6210 HXT3-MUP1-C AA545-574 K567,572R-GFP::TRP1 | This paper | ISY042 | Mutant yeast strain generated by homologous recombination (for PCR primer see Supplementary file 4) |
| Strain, strain background Saccharomyces cerevisiae | SEY6210.1 art4Δ::HIS3 HXT3-MUP1-C AA545-574 K567,572R-GFP::TRP1 | This paper | ISY053 | Mutant yeast strain generated by homologous recombination (for PCR primer see Supplementary file 4) |
| Strain, strain background Saccharomyces cerevisiae | SEY6210 art2Δ::HIS3 art4Δ::HIS3 HXT3-MUP1-C AA545-574 K567,572R-GFP::TRP1 | This paper | ISY054 | Mutant yeast strain generated by homologous recombination and mating/tetrad dissection (for PCR primer see Supplementary file 4) |
| Strain, strain background Saccharomyces cerevisiae | SEY6210 art2Δ::HIS3 HXT3-MUP1-C AA545-574 K567,572R-GFP::TRP1 | This paper | ISY055 | Mutant yeast strain generated by homologous recombination (for PCR primer see Supplementary file 4) |
| Strain, strain background Saccharomyces cerevisiae | SEY6210 art2Δ::HIS3 art4::HIS3 HXT3-GFP::TRP1 | This paper | ISY061 | Mutant yeast strain generated by homologous recombination and mating/tetrad dissection (for PCR primer seeSupplementary file 4) |
| Strain, strain background Saccharomyces cerevisiae | SEY6210.1 gcn1Δ::HIS3 | This paper | JZY001 | Mutant yeast strain generated by homologous recombination (for PCR primer see Supplementary file 4) |
| Strain, strain background Saccharomyces cerevisiae | SEY6210.1 gcn3Δ::HIS3 | This paper | JZY002 | Mutant yeast strain generated by homologous recombination (for PCR primer see Supplementary file 4) |
| Strain, strain background Saccharomyces cerevisiae | SEY6210.1 gcn5Δ::HIS3 | This paper | JZY003 | Mutant yeast strain generated by homologous recombination (for PCR primer see Supplementary file 4) |
| Strain, strain background Saccharomyces cerevisiae | SEY6210.1 gcn4Δ::HIS3 | This paper | OSY250 | Mutant yeast strain generated by homologous recombination (for PCR primer see Supplementary file 4) |
| Strain, strain background Saccharomyces cerevisiae | SEY6210.1 gcn2Δ::HIS3 | This paper | OSY354 | Mutant yeast strain generated by homologous recombination (for PCR primer see Supplementary file 4) |
| Strain, strain background Saccharomyces cerevisiae | SEY6210.1 art2Δ::HIS3 MUP1-GFP::TRP1 | This paper | TSY3 | Mutant yeast strain generated by homologous recombination (for PCR primer see Supplementary file 4) |
| Strain, strain background Saccharomyces cerevisiae | SEY6210 art2Δ::HIS3 | This paper | TSY4 | Mutant yeast strain generated by homologous recombination (for PCR primer see Supplementary file 4) |
| Strain, strain background Saccharomyces cerevisiae | SEY6210.1 art1Δ::HIS3 | This paper | VIY011 | Mutant yeast strain generated by homologous recombination (for PCR primer see Supplementary file 4) |
| Strain, strain background Saccharomyces cerevisiae | SEY6210.1 art2Δ::TRP1 | This paper | VIY012 | Mutant yeast strain generated by homologous recombination (for PCR primer see Supplementary file 4) |
| Strain, strain background Saccharomyces cerevisiae | SEY6210 ART2-6xHIS-TEV-3xFLAG::HIS3 | This paper | VIY030 | Mutant yeast strain generated by homologous recombination (for PCR primer see Supplementary file 4) |
| Strain, strain background Saccharomyces cerevisiae | SEY6210 ART1-6xHIS-TEV-3xFLAG::HIS3 | This paper | VIY031 | Mutant yeast strain generated by homologous recombination (for PCR primer see Supplementary file 4) |
| Strain, strain background Saccharomyces cerevisiae | SEY6210 CAN1-GFP::HIS3 | This paper | VIY036 | Mutant yeast strain generated by homologous recombination (for PCR primer see Supplementary file 4) |
| Strain, strain background Saccharomyces cerevisiae | SEY6210 HXT3-GFP::TRP1 | This paper | VIY042 | Mutant yeast strain generated by homologous recombination (for PCR primer see Supplementary file 4) |
| Strain, strain background Saccharomyces cerevisiae | SEY6210 MUP1-GFP::TRP1 | This paper | VIY054 | Mutant yeast strain generated by homologous recombination (for PCR primer see Supplementary file 4) |
| Strain, strain background Saccharomyces cerevisiae | SEY6210.1 art2Δ::TRP1 INA1-eGFP::HIS3 | This paper | OSY924 | Mutant yeast strain generated by homologous recombination (for PCR primer see Supplementary file 4) |
| Strain, strain background Saccharomyces cerevisiae | SEY6210 MUP1 S568,573A-GFP::TRP1 | This paper | VIY059 | Mutant yeast strain generated by homologous recombination (for PCR primer see Supplementary file 4) |
| Strain, strain background Saccharomyces cerevisiae | SEY6210.1 art2Δ::TRP1 CAN1-GFP::HIS3 | This paper | VIY062 | Mutant yeast strain generated by homologous recombination (for PCR primer see Supplementary file 4) |
| Strain, strain background Saccharomyces cerevisiae | SEY6210.1 art2Δ::TRP1 HXT2-GFP::HIS3 | This paper | VIY063 | Mutant yeast strain generated by homologous recombination (for PCR primer see Supplementary file 4) |
| Strain, strain background Saccharomyces cerevisiae | SEY6210.1 art2Δ::TRP1 TAT2-GFP::HIS3 | This paper | VIY064 | Mutant yeast strain generated by homologous recombination (for PCR primer see Supplementary file 4) |
| Strain, strain background Saccharomyces cerevisiae | SEY6210.1 art2Δ::TRP1 HXT1-GFP::HIS3 | This paper | VIY065 | Mutant yeast strain generated by homologous recombination (for PCR primer see Supplementary file 4) |
| Strain, strain background Saccharomyces cerevisiae | SEY6210.1 art2Δ::TRP1 LYP1-GFP::HIS3 | This paper | VIY068 | Mutant yeast strain generated by homologous recombination (for PCR primer see supplementary file 4) |
| Strain, strain background Saccharomyces cerevisiae | SEY6210 MUP1 K567,572R-GFP::TRP1 | This paper | VIY073 | Mutant yeast strain generated by homologous recombination (for PCR primer seeSupplementary file 4) |
| Strain, strain background Saccharomyces cerevisiae | SEY6210 MUP1 T552,560A-GFP::TRP1 | This paper | VIY076 | Mutant yeast strain generated by homologous recombination (for PCR primer see Supplementary file 4) |
| Strain, strain background Saccharomyces cerevisiae | SEY6210.1 art1Δ::HIS3 MUP1-GFP::TRP1 | This paper | VIY079 | Mutant yeast strain generated by homologous recombination (for PCR primer see Supplementary file 4) |
| Strain, strain background Saccharomyces cerevisiae | SEY6210 MUP1 K27,28R-GFP::TRP1 | This paper | VIY082 | Mutant yeast strain generated by homologous recombination (for PCR primer see Supplementary file 4) |
| Strain, strain background Saccharomyces cerevisiae | SEY6210.1 art2Δ::TRP1 MUP1-GFP::HIS3 | This paper | VIY092 | Mutant yeast strain generated by homologous recombination (for PCR primer see Supplementary file 4) |
| Strain, strain background Saccharomyces cerevisiae | SEY6210 MUP1 K27,28,567,572R-GFP::TRP1 | This paper | VIY093 | Mutant yeast strain generated by homologous recombination (for PCR primer see Supplementary file 4) |
| Strain, strain background Saccharomyces cerevisiae | SEY6210.1 art1Δ::HIS3 art2Δ::TRP1 | This paper | VIY107 | Mutant yeast strain generated by homologous recombination (for PCR primer see Supplementary file 4) |
| Strain, strain background Saccharomyces cerevisiae | SEY6210 MUP1-HA-TEV-GFP K1R::TRP1 | This paper | VIY200 | Mutant yeast strain generated by homologous recombination (for PCR primer see Supplementary file 4) |
| Strain, strain background Saccharomyces cerevisiae | SEY6210 MUP1 S568,573A-HA-TEV-GFP K1R::TRP1 | This paper | VIY242 | Mutant yeast strain generated by homologous recombination (for PCR primer see Supplementary file 4) |
| Strain, strain background Saccharomyces cerevisiae | SEY6210 MUP1 T552,560A-HA-TEV-GFP K1R::TRP1 | This paper | VIY255 | Mutant yeast strain generated by homologous recombination (for PCR primer see Supplementary file 4) |
| Strain, strain background Saccharomyces cerevisiae | SEY6210 MUP1 G78N-HA-TEV-GFP K1R::TRP1 | This paper | VIY263 | Mutant yeast strain generated by homologous recombination (for PCR primer see supplementary file 4) |
| Strain, strain background Saccharomyces cerevisiae | SEY6210.1 ART2-6xHIS-TEV-3xFLAG::HIS3 gcn4Δ::HIS3 | This paper | VIY291 | Mutant yeast strain generated by homologous recombination and mating/tetrad dissection (for PCR primer see supplementary file 4) |
| Strain, strain background Saccharomyces cerevisiae | SEY6210 MUP1 D43A,G47A,Q49A,T52A,L54A-HA-TEV-GFP K1R::TRP1 | This paper | VIY295 | Mutant yeast strain generated by homologous recombination (for PCR primer see supplementary file 4) |
| Strain, strain background Saccharomyces cerevisiae | SEY6210 MUP1 T6,25,26,34A,S9,22,23,24,31,33,42A,K16,27,28R-HA-TEV-GFP K1R::TRP1 | This paper | VIY335 | Mutant yeast strain generated by homologous recombination (for PCR primer see supplementary file 4) |
| Strain, strain background Saccharomyces cerevisiae | SEY6210 MUP1-GFP::HIS3 | This paper | YSM24 | Mutant yeast strain generated by homologous recombination (for PCR primer see supplementary file 4) |
| Recombinant DNA reagent | pRS413 (Plasmid) | Sikorski and Hieter, 1989 | pRS413 | Empty centromer vector HIS3 |
| Recombinant DNA reagent | pRS414 (Plasmid) | Sikorski and Hieter, 1989 | pRS414 | Empty centromer vector TRP1 |
| Recombinant DNA reagent | pRS415 (Plasmid) | Sikorski and Hieter, 1989 | pRS415 | Empty centromer vector LEU2 |
| Recombinant DNA reagent | pRS416 (Plasmid) | Sikorski and Hieter, 1989 | pRS416 | Empty centromer vector URA3 |
| Recombinant DNA reagent | YCp5O-GCN4 (Plasmid) | Hinnebusch, 1985 | p180 | Wild type GCN4 (centromeric plasmid, URA3 selection) |
| Recombinant DNA reagent | YCp5O-GCN4C (Plasmid) | Mueller et al., 1987 | p227 | Constitutively active GCN4 (centromeric plasmid, URA3 selection) |
| Recombinant DNA reagent | pRS416-CAN1-GFP (Plasmid) | Lin et al., 2008 | pCHL571 | GFP-tagged version of CAN1 (centromeric plasmid, URA3 selection) |
| Recombinant DNA reagent | pRS416-MUP1-GFP (Plasmid) | Lin et al., 2008 | pCHL642 | GFP-tagged version of MUP1 (centromeric plasmid, URA3 selection) |
| Recombinant DNA reagent | pRS416-ART2-6xHIS-TEV-3xFLAG (Plasmid) | This paper | pIS001 | HTF-tagged version of ART2 (centromeric plasmid, URA3 selection; for cloning primer seesupplementary file 4) |
| Recombinant DNA reagent | pRS416-ART2 P748,749A,Y750A-6xHIS-TEV-3xFLAG (Plasmid) | This paper | pIS003 | PxY mutant ofART2-HTF (centromeric plasmid, URA3 selection; for cloning primer see Supplementary file 4) |
| Recombinant DNA reagent | pRS416-ART2 K664,667D,R665,666D-6xHIS-TEV-3xFLAG (Plasmid) | This paper | pIS004 | Basic patch mutant of ART2-HTF (centromeric plasmid, URA3 selection; for cloning primer see supplementary file 4) |
| Recombinant DNA reagent | pRS415-ART2-6xHIS-TEV-3xFLAG (Plasmid) | This paper | pJZ001 | HTF-tagged version of ART2 (centromeric plasmid, LEU2 selection; for cloning primer seesupplementary file 4) |
| Recombinant DNA reagent | pRS415-pART2*-ART2-6xHIS-TEV-3xFLAG (Plasmid) | This paper | pJZ002 | Promotor mutant of ART2-HTF (centromeric plasmid, LEU2 selection; for cloning primer seesupplementary file 4) |
| Recombinant DNA reagent | pRS416-pART2-ART1-6xHIS-TEV-3xFLAG (Plasmid) | This paper | pOS258 | ART1-HTF expressed under ART2 promoter (centromeric plasmid, URA3 selection; for cloning primer see supplementary file 4) |
| Recombinant DNA reagent | pRS416-MUP1-pHluorin (Plasmid) | This paper | pLZ78 | pHluorin-tagged version ofMUP1, obtained from the Emr lab (previously unpublished) (centromeric plasmid, URA3 selection) |
| Recombinant DNA reagent | pRS415-MUP1-GFP (Plasmid) | Schmidt et al., 2017 | pMM02 | GFP-tagged version of MUP1 (centromeric plasmid, LEU2 selection) |
| Recombinant DNA reagent | pRS416-FUR4-GFP (Plasmid) | MacGurn et al., 2011 | pSR21 | GFP-tagged version of FUR4 (centromeric plasmid, URA3 selection) |
| Recombinant DNA reagent | pRS415-ART1 (Plasmid) | This paper | pVI009 | untagged version of ART1 (centromeric plasmid, LEU2 selection; for cloning primer see Supplementary file 4) |
| Recombinant DNA reagent | pRS416-pTDH3-ART2-6xHIS-TEV-3xFLAG (Plasmid) | This paper | pVI013 | Overexpression of ART2-HTF (centromeric plasmid, URA3 selection; for cloning primer seeSupplementary file 4) |
| Antibody | α-FLAG M2 (Mouse monoclonal) | Sigma, Austria | F1804 (RRID:AB_259529) | WB (1:10.000) |
| Antibody | α-GFP IgG1K (Mouse monoclonal) | Sigma, Austria | 11814460001 (RRID:AB_390913) | WB (1:1000) |
| Antibody | α-Pgk1 22C5D8 (Mouse monoclonal) | Invitrogen, USA | 459250 (RRID:AB_2532235) | WB (1:10.000) |
| Antibody | α-ubiquitin P4D1 (Mouse monoclonal) | Santa Cruz Biotechnology, USA | 3936S (RRID:AB_628423) | WB (1:500) |
| Antibody | goat a-mouse (polyclonal)-peroxidase | Sigma | A4416 (RRID:AB_258167) | WB (1:5000) |
| Commercial assay or kit | RevertAid First Strand cDNA Synthesis Kit | Thermo Fisher, USA | K1622 | |
| Commercial assay or kit | RNeasy Mini Kit | Qiagen, Germany | 74104 | |
| Commercial assay or kit | TaqMan Assay ECM21/ART2 | Thermo Fisher, USA | Sc04099967_s1 | |
| Commercial assay or kit | TaqMan Assay PGK1 | Thermo Fisher, USA | Sc04104844_s1 | |
| Commercial assay or kit | TaqMan Gene Expression Master Mix | Thermo Fisher, USA | 4369016 | |
| Commercial assay or kit | Non-essential gene deletion strain collection in BY4742 | Open Biosystems, USA | YSC1054 | |
| Chemical compound, drug | GFP-Trap_MA Magnetic Agarose beads | ChromoTek, Germany | gtma-20 | |
| Chemical compound, drug | Nonidet P 40 | Fluka, Germany | 74385 | |
| Chemical compound, drug | Yeast Nitrogen Base without amino acids | Roth, Germany | HP26.1 | |
| Chemical compound, drug | Yeast Nitrogen Base without amino acids and ammonium sulfate | VWR, USA | J630-100G | |
| Software, algorithm | Fiji | Schindelin et al., 2012 | Version 1.0 | |
| Software, algorithm | GuavaSoft | Luminex | Version 2.7 | |
| Software, algorithm | Illustrator CS5.1 | Adobe | Version 15.1.0 (RRID:SCR_010279) | |
| Software, algorithm | ImageJ2 | Rueden et al., 2017 | Version 2.0.0-rc49/1.51 hr (RRID:SCR_003070) | |
| Software, algorithm | Photoshop CS5 | Adobe | Version 12.0.4 × 64 (RRID:SCR_014199) | |
| Software, algorithm | PikoReal | Thermo Fisher | version 2.2 | |
| Software, algorithm | VisiView | Visitron | version 2.1.4 |
Additional files
-
Supplementary file 1
Fluorescence microscopy-based screen for substrates of starvation-induced endocytosis.
- https://cdn.elifesciences.org/articles/58246/elife-58246-supp1-v3.xlsx
-
Supplementary file 2
Flow cytometry and fluorescence microscopy-based screen for genes specifically involved in starvation-induced endocytosis.
- https://cdn.elifesciences.org/articles/58246/elife-58246-supp2-v3.xlsx
-
Supplementary file 3
Gene ontology term analysis of 128 genes required for starvation-induced endocytosis of Mup1-pHluorin.
- https://cdn.elifesciences.org/articles/58246/elife-58246-supp3-v3.xlsx
-
Supplementary file 4
Primer for cloning and PCR-based genetic modifications.
- https://cdn.elifesciences.org/articles/58246/elife-58246-supp4-v3.xlsx
-
Transparent reporting form
- https://cdn.elifesciences.org/articles/58246/elife-58246-transrepform-v3.pdf
Download links
A two-part list of links to download the article, or parts of the article, in various formats.
Downloads (link to download the article as PDF)
Open citations (links to open the citations from this article in various online reference manager services)
Cite this article (links to download the citations from this article in formats compatible with various reference manager tools)
Complementary α-arrestin-ubiquitin ligase complexes control nutrient transporter endocytosis in response to amino acids
eLife 9:e58246.
https://doi.org/10.7554/eLife.58246


