Lymphangiogenic therapy prevents cardiac dysfunction by ameliorating inflammation and hypertension
- Internal Medicine Research Unit, Pfizer Inc, United States
- Comparative Medicine, Pfizer Inc, United States
- Drug Safety Research & Development, Pfizer Inc, United States
- Early Clinical Development, Pfizer Inc, United States
- Acceleron Pharma, United States
- Eisai Inc, United States
- Inflammation and Immunology Research Unit, Pfizer Inc, United States
- Target Sciences, Emerging Science and Innovation, Pfizer Inc, United States
- Department of Pharmacology, Vascular Biology and Therapeutics Program, Yale University School of Medicine, United States
Figures
Figure 1

Lymphatic endothelial markers are reduced in human failing heart.
(A–D) Expression of lymphatic endothelial marker genes VEGFC (A), LYVE1 (B), PDPN (C), FLT4 (D) in hearts from healthy human donors (HH) and hearts from patients with chronic heart failure (CHF). The data were normalized to the expression of the housekeeping gene HPRT1 and represented as fold change from the HH group (n = 16–18 for HH and n = 10–11 for CHF). Data are mean ± s.d. Student’s t-test was used for statistics. *p<0.05.
-
Figure 1—source data 1
Clinical information.
- https://cdn.elifesciences.org/articles/58376/elife-58376-fig1-data1-v2.xlsx
-
Figure 1—source data 2
Raw data supporting Figure 1.
- https://cdn.elifesciences.org/articles/58376/elife-58376-fig1-data2-v2.xlsx
Figure 2 with 1 supplement
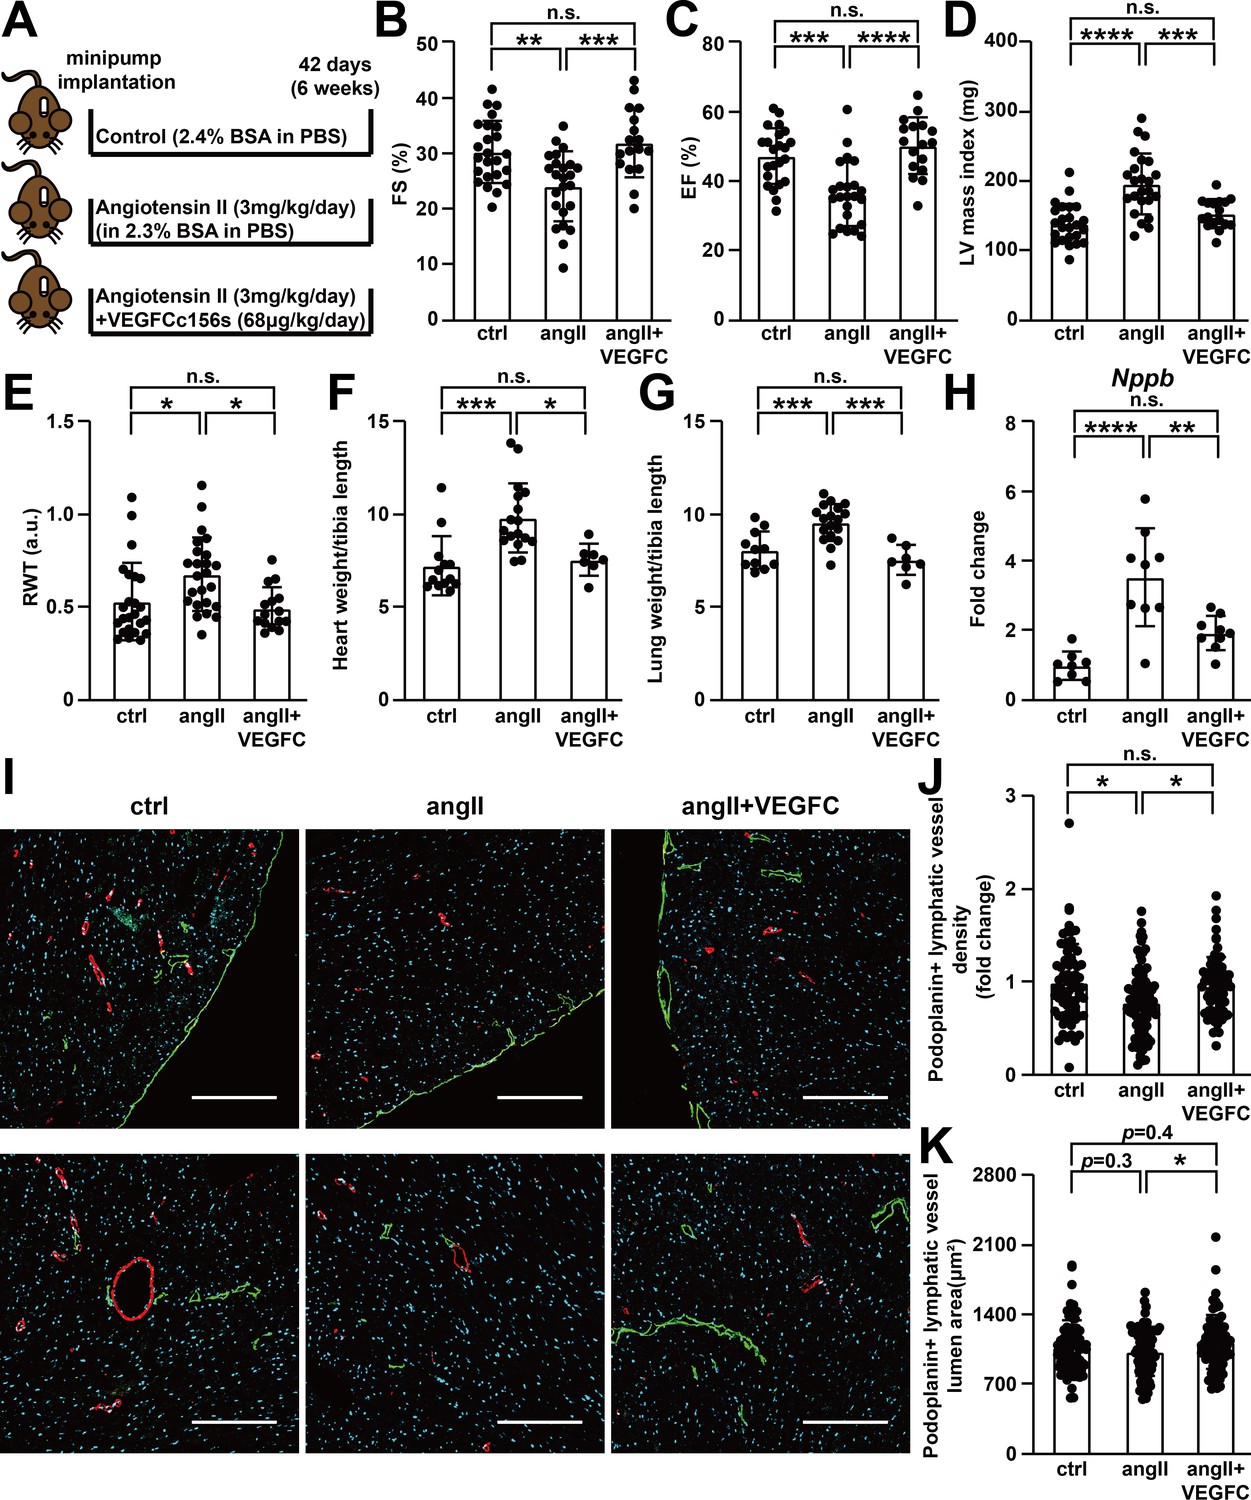
VEGFCC156S treatment prevented angiotensin II-induced cardiac dysfunction.
(A) Experimental design for animal studies. Angiotensin II (angII) was infused to induce cardiac dysfunction, and VEGFCc156s (VEGFC) was infused as a lymphangiogenic therapy via the same subcutaneously-implanted osmotic pump. Bovine serum albumin (BSA) was loaded to the pumps for control (ctrl) and angII groups to balance for the loading of VEGFCc156s in the therapeutic arm. (B–E) Echocardiography was conducted 6 weeks after minipump implantation. Fractional Shortening (FS) (B), Ejection Fraction (EF) (C), Left Ventricular (LV) mass index (D) and Relative Wall Thickness (RWT) (E) are shown (n = 17–24/group). (F–G) Heart weight (F) and lung weight (G) (normalized to tibia length) of the animals at euthanasia (n = 7–18/group). (H) RNA was isolated from the mouse hearts, and quantitative RT-PCR was performed for Nppb and normalized to the expression of housekeeping gene Hprt. The data were normalized to ctrl group and represented as fold change (n = 8–9/group). (I) Mouse hearts were fixed, OCT embedded, sectioned, and stained for podoplanin, smooth muscle actin and DAPI (light blue). Representative images of podoplanin-positive lymphatic vessels (green) and smooth muscle actin-positive arteries (red) for each group were shown. Scale bar, 200 μm. (J) Quantification of podoplanin-positive lymphatic vessel density (J, normalized to total area and represented as fold change to ctrl group) and podoplanin-positive lymphatic vessel lumen area (K) in mouse hearts (n = 8–10 animal/group, n = 10–12 sections/animal). Data are mean ± s.d. One-way ANOVA with Bonferroni posthoc was used for all figures except 2J and 2K (a linear mixed model was used for statistics). *p<0.05, **p<0.01, ***p<0.001, ****p<0.0001, n.s. not significant.
-
Figure 2—source data 1
Raw data supporting Figure 2.
- https://cdn.elifesciences.org/articles/58376/elife-58376-fig2-data1-v2.xlsx
Figure 2—figure supplement 1
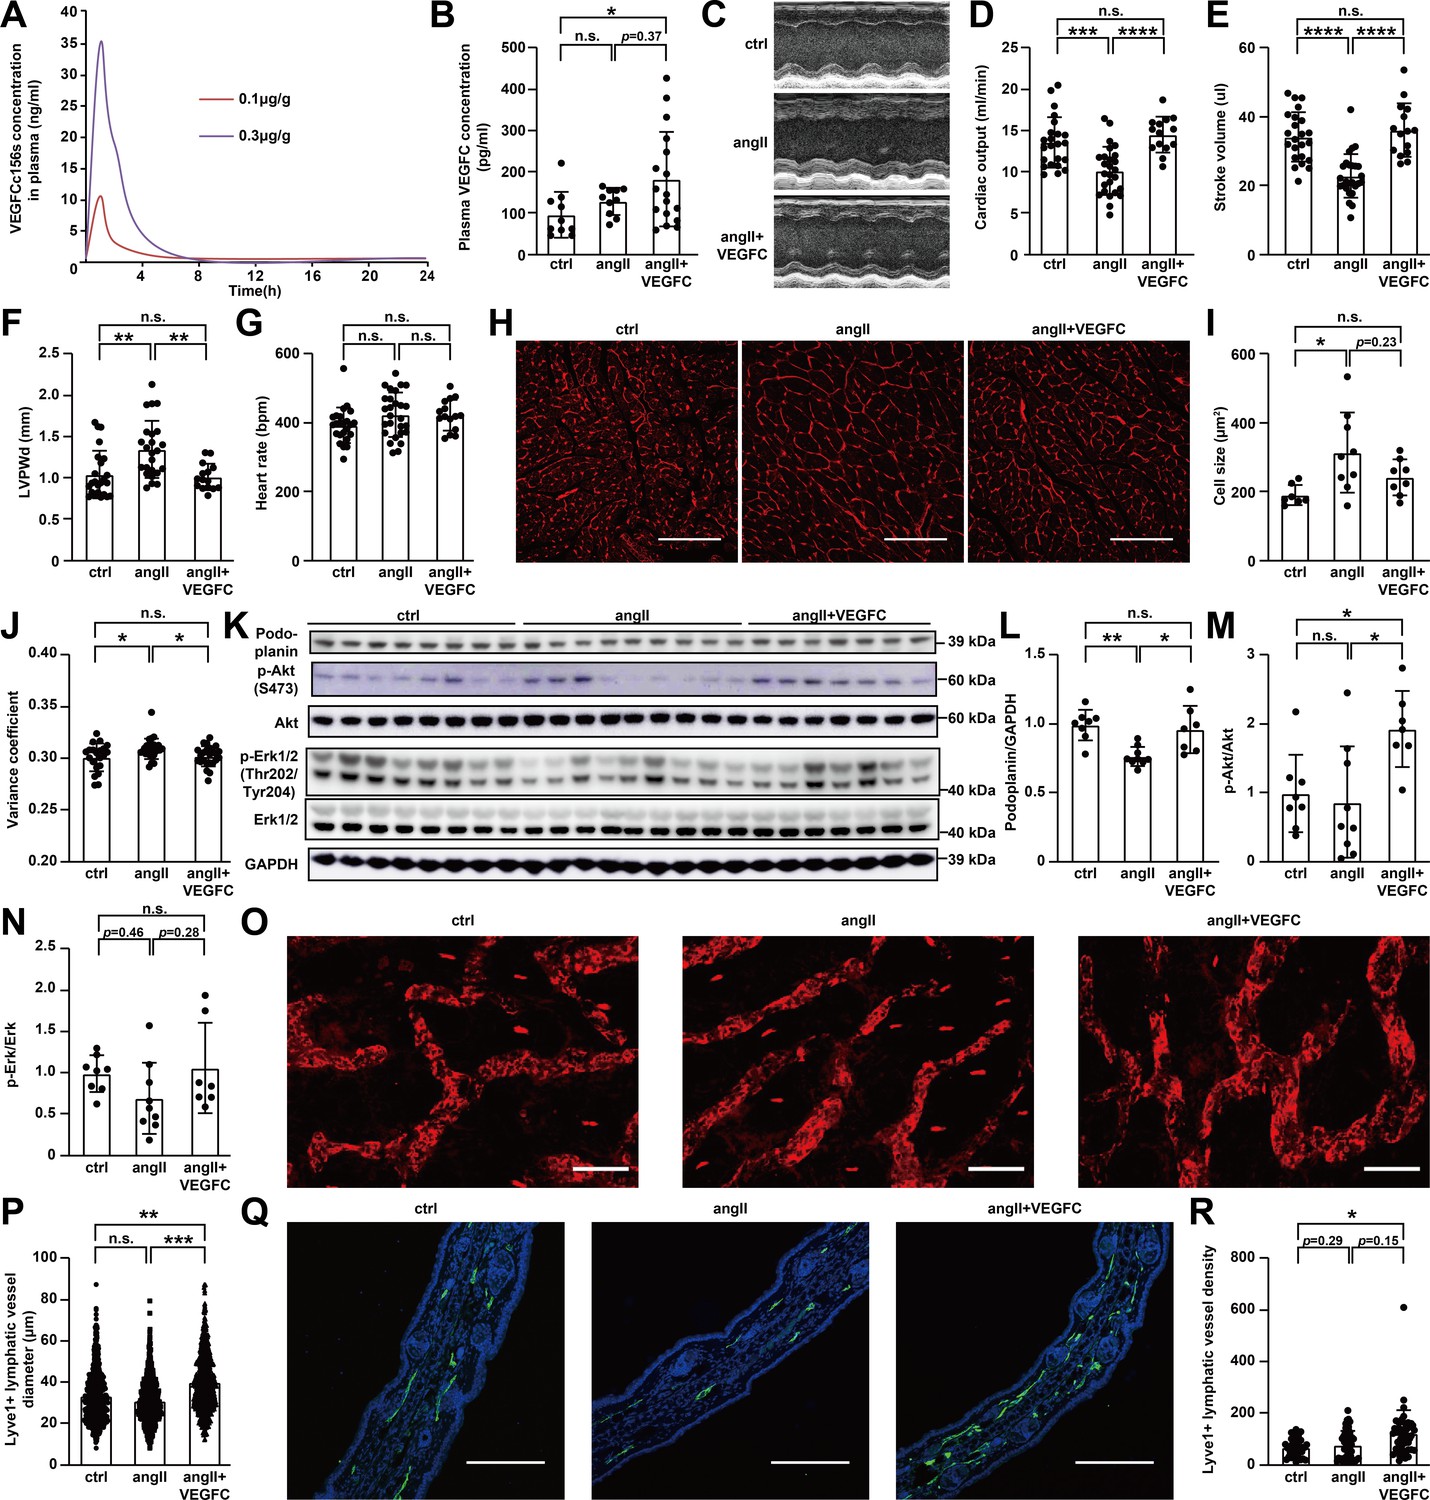
Effect of VEGFCC156S on angiotensin II-induced cardiac dysfunction, cardiac lymphatics, and skin lymphatics.
(A) Pharmacokinetic analysis of VEGFCC156S in mice (n = 2 per dose group). (B) Plasma VEGFC concentration measured by ELISA at euthanasia (n = 10–17/group). (C–S) Mice were infused with saline + BSA, angiotensin II + BSA, or angiotensin II + VEGFCC156S as described in Figure 2A. (C) Representative M-mode echocardiography images for each group. (D–G) Echocardiography parameters cardiac output (D), stroke volume (E), Left Ventricular Posterior Wall thickness at diastole (LVPWd) (F) and heart rate (G) are shown (n = 15–24/group). (H–J) Hearts were arrested in diastole, fixed, sectioned, and stained with wheat germ agglutinin (WGA). (H) Representative images of WGA stain for each group. Scale bar, 100 μm. (I) Cardiomyocyte size was assessed (n = 7–9/group). (J) Analysis of cell size variance coefficient from WGA-stained mouse heart sections (n = 21–27/group; a linear mixed model was used for statistics). (K–N) Protein lysates were prepared from mouse hearts and immunoblotted for podoplanin, p-Akt, Akt, p-Erk1/2, Erk1/2, and GAPDH. (K) Representative immunoblots. (L–N) Densitometric quantification of podoplanin (L), p-Akt to Akt ratio (M) and p-Erk to Erk ratio (N) (n = 7–9/group). (O) Representative images of the whole mount stain of lyve1-positive lymphatic vessels in ear skin for each group. Scale bar, 100 μm. (P) Quantification of lyve1-positive lymphatic vessel diameter in ear skin (n = 737–880 vessel/group; a linear mixed model was used for statistics). (Q) Ear skin samples were fixed, sectioned, and stained for lyve1(green) and DAPI (blue). Representative images of lyve1-positive lymphatic vessels in ear skin cross-section for each group. Scale bar, 200 μm. (R) Quantification of lyve1-positive lymphatic vessel density (normalized to total area) in ear skin (n = 6–8 animals/group, n = 6–8 sections/animal; a linear mixed model was used for statistics). Ctrl, control. AngII, angiotensin II. VEGFC, VEGFCc156s. Data are mean ± s.d. One-way ANOVA with Bonferroni posthoc was used for statistics for all figures except 2J, 2P and 2R (a linear mixed model was used for statistics). *p<0.05, **p<0.01, ***p<0.001, ****p<0.0001, n.s. not significant.
Figure 3 with 1 supplement
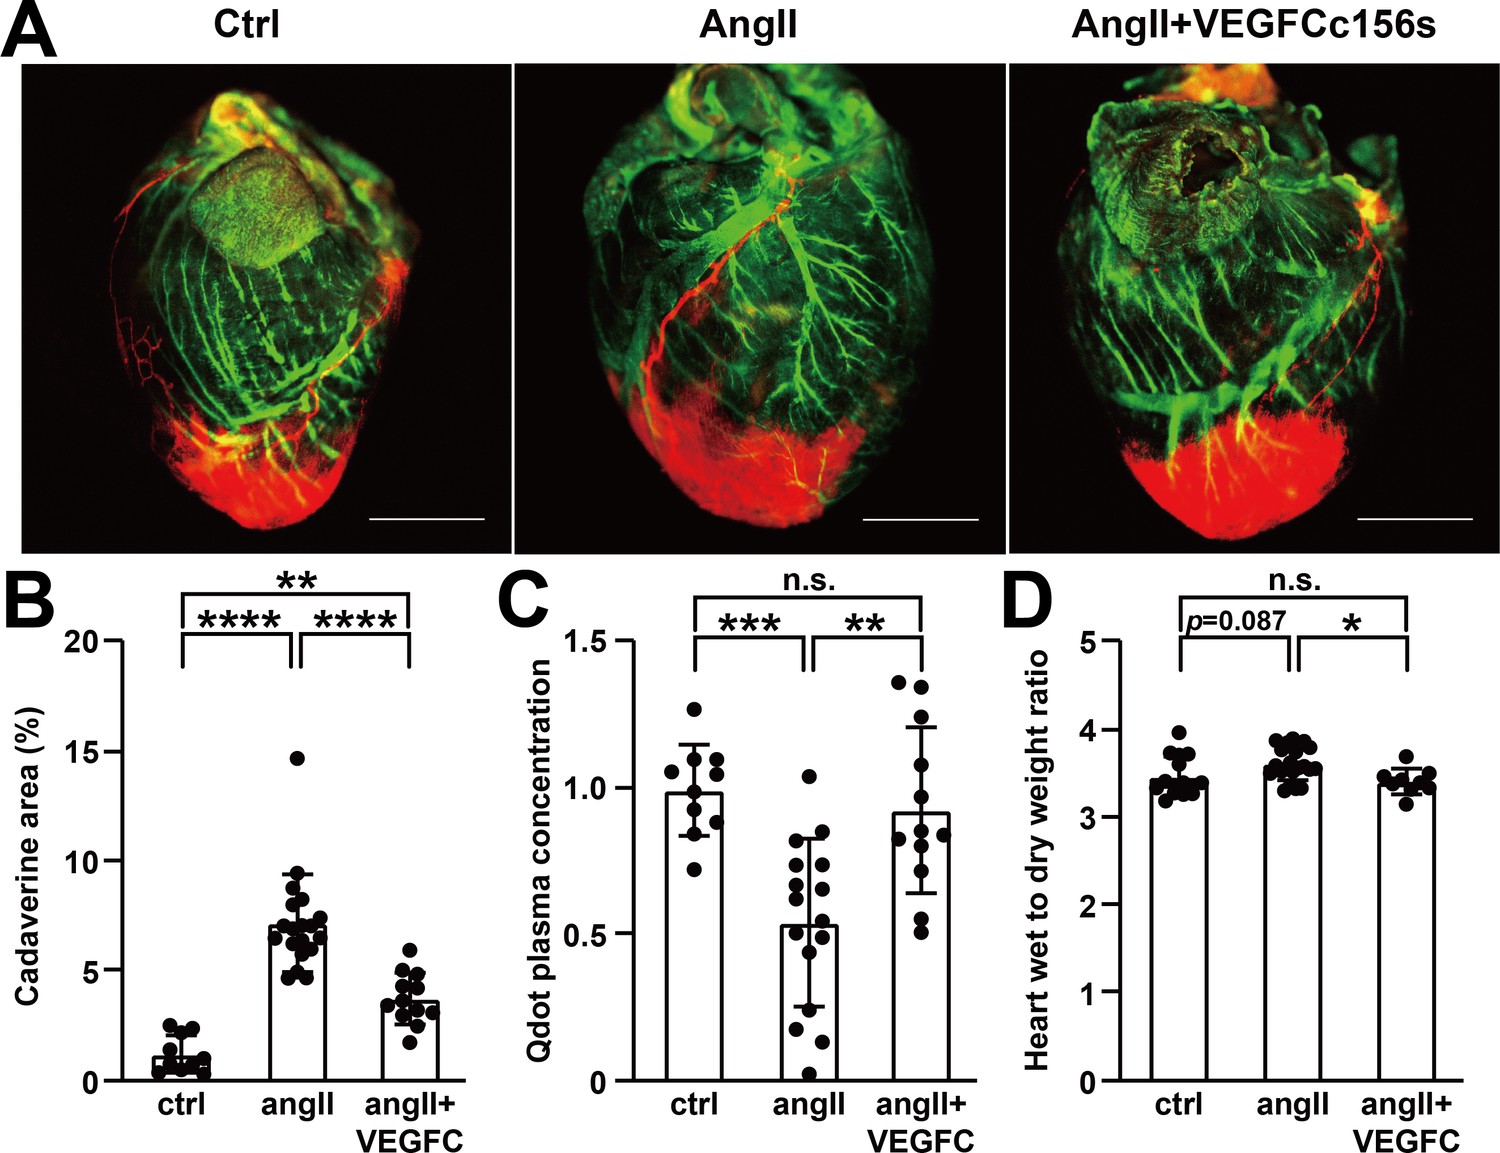
VEGFCC156S treatment improved cardiac lymphatic vascular function.
(A) Representative lymphangiography images of adult mouse hearts. FITC-dextran (green) indicates blood vessels, cadaverine (orange) indicates vascular leak and qdot (red) indicates injection site and cardiac lymphatics. Objective, 1x. Scale bar, 2000 μm. (B) Analysis of cadaverine-positive area (normalized to total area) in heart 5 mins after injection. The data were normalized to ctrl group and represented as fold change (n = 10–19/group). (C) Analysis of qdot plasma concentration 5 mins after injection (n = 10–16/group). (D) Wet-to-dry weight ratio of hearts (n = 9–22/group). Ctrl, control. AngII, angiotensin II. VEGFC, VEGFCc156s. Data are mean ± s.d. One-way ANOVA with Bonferroni posthoc was used for statistics. *p<0.05, **p<0.01, ***p<0.001, ****p<0.0001, n.s. not significant.
-
Figure 3—source data 1
Raw data supporting Figure 3.
- https://cdn.elifesciences.org/articles/58376/elife-58376-fig3-data1-v2.xlsx
Figure 3—figure supplement 1
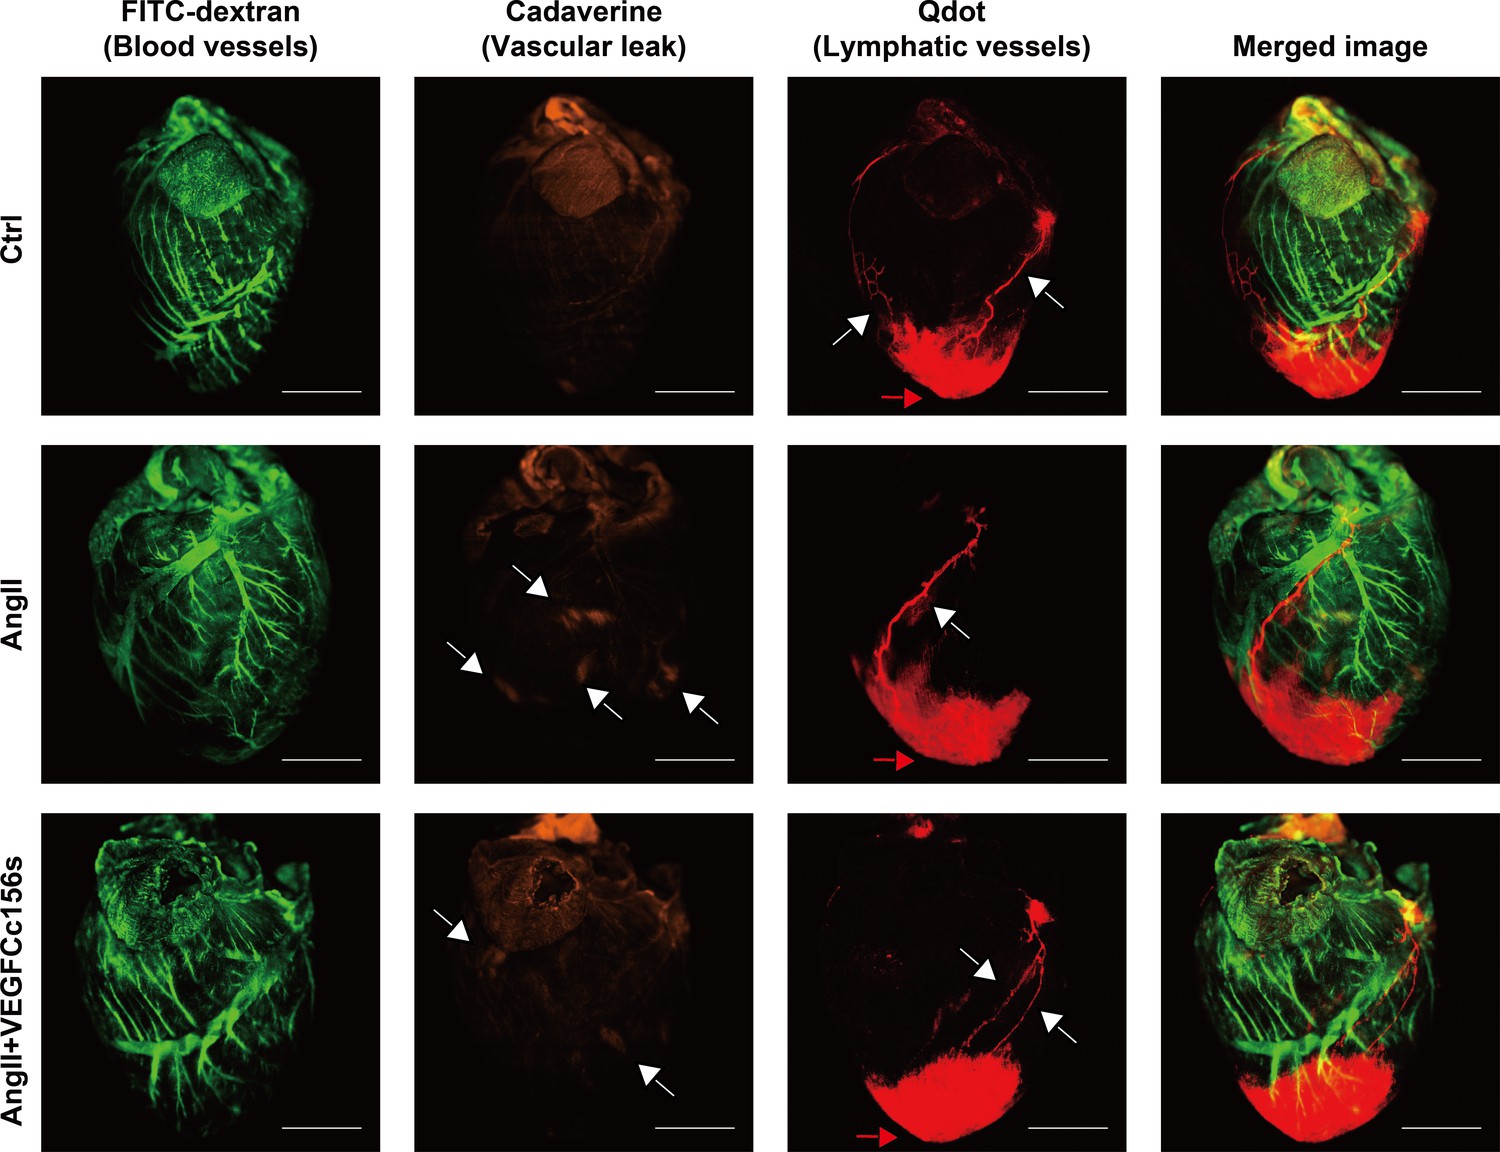
Single-channel lymphangiography images.
FITC-dextran (green) indicates blood vessels, cadaverine (orange, with white arrowheads) indicates vascular leak and qdot (red) indicates injection site (with a red arrowhead) and lymphatic vessels (with white arrowheads). Objective, 1x. Scale bar, 2000 μm.
Figure 4 with 1 supplement
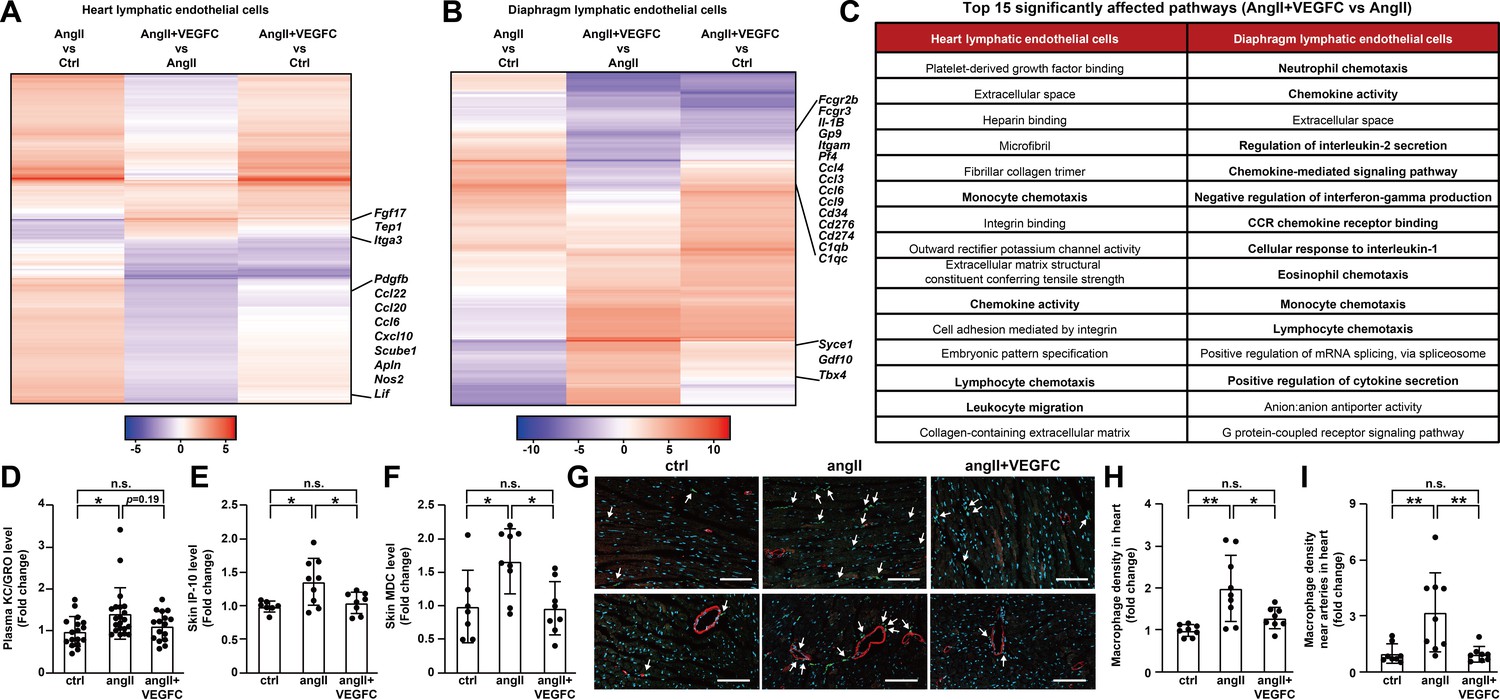
VEGFCC156S treatment ameliorated angiotensin II-induced inflammatory responses.
(A–B) Heat map visualization of all FDR-significant differential expression changes in genes comparing angII and ctrl groups (angII vs ctrl), angII+VEGFC and angII groups (angII+VEGFC vs angII), and angII+VEGFC and ctrl groups (angII+VEGFC vs ctrl) in heart lymphatic endothelial cells (LECs) and diaphragm LECs. The differential expression test-statistics are indicated by the shading in the heatmap and several genes that are significantly regulated by VEGFC treatment are shown. (C) Top 15 affected signaling pathways in angII+VEGFC vs angII comparison for heart LECs and diaphragm LECs from gene ontology (GO) pathway analysis. (D) KC/GRO levels in mouse plasma (n = 16–21/group). (E–F) IP-10 and MDC levels in native mouse skin lysates. The values of IP-10 levels were log-transformed, and the values were normalized to the ctrl group and represented as fold change (n = 7–9/group). (G) Mouse hearts were fixed, OCT embedded, sectioned, and stained for CD68 (green), smooth muscle actin (red) and DAPI (light blue). Representative images for each group are shown and CD68/DAPI double-positive macrophages are indicated with arrowheads. Scale bar, 100 μm. (H–I) CD68/DAPI double-positive macrophage density and macrophage density near smooth muscle actin-positive arteries (normalized to total area and represented as fold change to ctrl group) in mouse hearts (n = 8–9/group). Ctrl, control. AngII, angiotensin II. VEGFC, VEGFCc156s. Data are mean ± s.d. One-way ANOVA with Bonferroni posthoc was used for all figures except 4E (One-way ANOVA with Tukey’s posthoc was used for log-transformed data). *p<0.05, **p<0.01, n.s. not significant.
-
Figure 4—source data 1
Raw data supporting Figure 4.
- https://cdn.elifesciences.org/articles/58376/elife-58376-fig4-data1-v2.xlsx
Figure 4—figure supplement 1
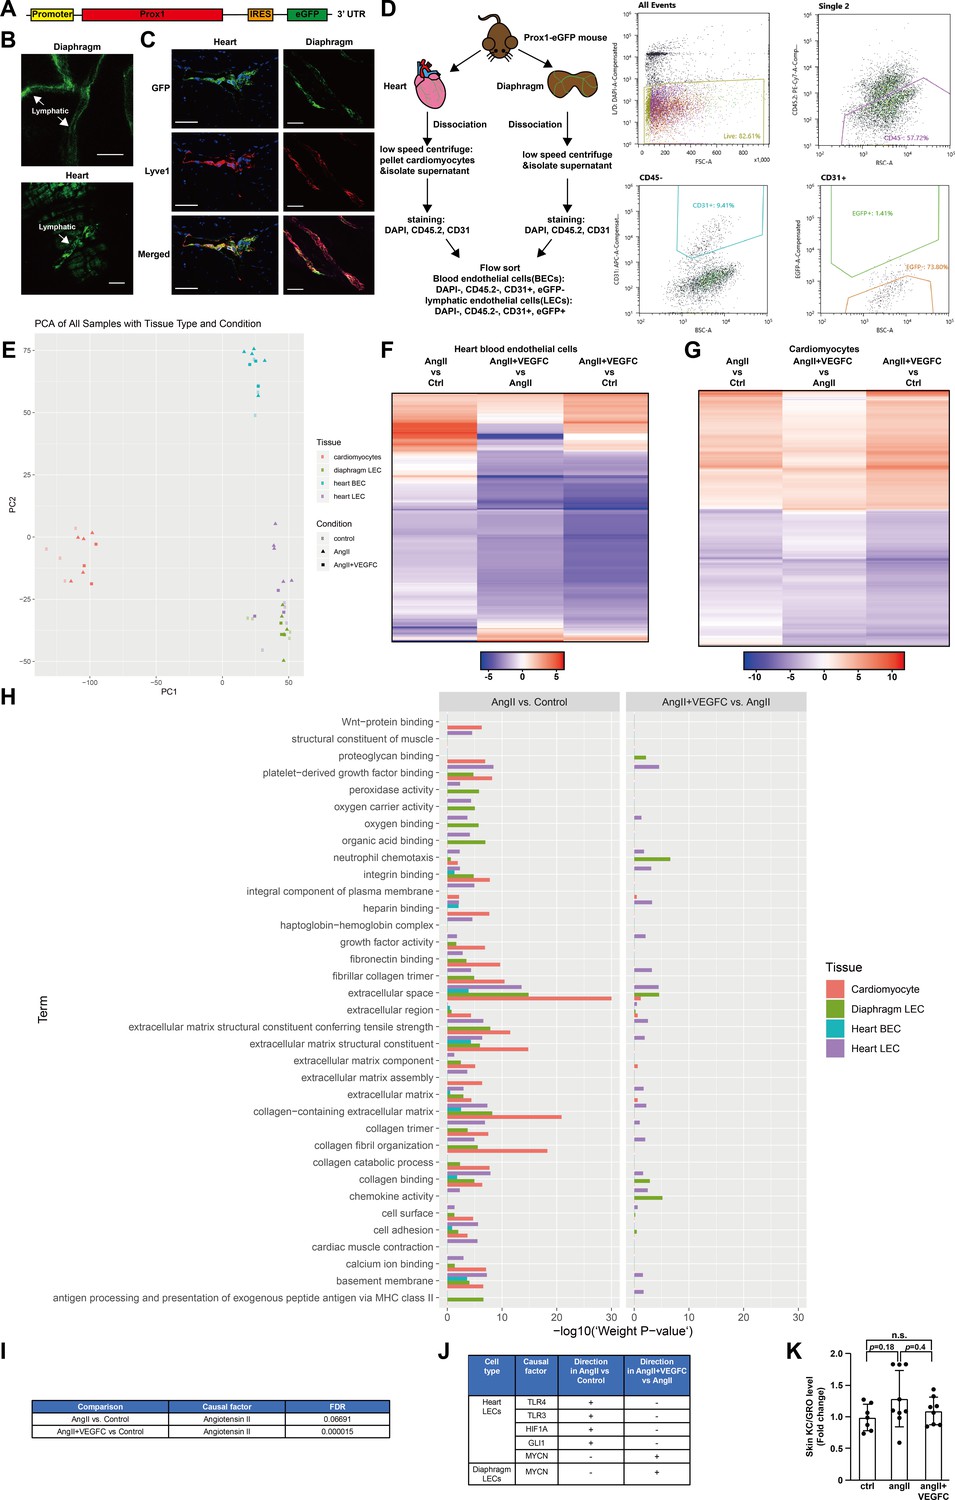
Isolation of cardiomyocytes, lymphatic endothelial cells and blood endothelial cells using Prox1-eGFP mice for RNA-seq and additional data analysis.
(A) Design of Prox1-eGFP KI mouse model. The model was generated using CRISPR/Cas9 Technology, and an IRES-eGFP cassette was inserted into the 3’UTR of the endogenous Prox1 locus. (B) Representative images of lymphatic vessels with eGFP fluorescence in the diaphragm(top) and heart(bottom) from Prox1-eGFP mice. Scale bar, 100 μm. (C) Representative images of lymphatic vessels in the heart (left) of Prox1-eGFP mice stained with GFP (green), Lyve1 (lymphatic endothelial marker, red) and DAPI(blue), and lymphatic vessels in the diaphragm(right) of prox1-eGFP mice stained with GFP (green) and Lyve1 (red). The GFP stain overlapped with Lyve1 stain. Scale bar, 50 μm. (D) Schematic illustration of cardiomyocytes, heart lymphatic endothelial cell (heart LEC), heart blood endothelial cell (heart BEC) and diaphragm lymphatic endothelial cell (diaphragm LEC) isolation from Prox1-eGFP mice and representative flow cytometry plots. (E) Principal component analysis (PCA) for RNA-seq data, with tissue and treatment conditions denoted by color and shape, respectively. (F–G) Heat map visualization of all FDR-significant differential expression changes in genes comparing angII and ctrl groups (angII vs ctrl), angII+VEGFC and angII groups (angII+VEGFC vs angII), and angII+VEGFC and ctrl groups (angII+VEGFC vs ctrl) in heart BECs and cardiomyocytes. The differential expression test-statistics are indicated by the shading in the heatmap. (H) Summary of signaling pathway analysis in angII vs ctrl and angII+VEGFC vs angII comparisons in different tissue and cell types. The unit for x-axis (-log10(‘weight p-value’)) indicates significance level and does not indicate directionality of the change. (I) Causal reasoning analysis indicated that angiotensin II is a causal factor for the transcriptional changes in cardiomyocytes in both angII vs ctrl comparison and angII+VEGFC vs ctrl comparison. FDR less than 0.05 was defined as significant. (J) Top five common FDR-significant causal proteins for heart LECs and the common FDR-significant causal protein for diaphragm LECs in angII vs ctrl comparison and angII+VEGFC vs angII comparison from causal reasoning analysis. The directionality of the effect was shown in the table as activation (+) and inactivation (-). (K) KC/GRO levels in native mouse skin lysates. The values of KC/GRO were log-transformed, and the values were normalized to the ctrl group and represented as fold change (n = 7–9/group). Ctrl, control. AngII, angiotensin II. VEGFC, VEGFCc156s. Data are mean ± s.d. One-way ANOVA with Tukey’s posthoc was used for log-transformed data. n.s. not significant.
Figure 5 with 1 supplement

VEGFCC156S treatment ameliorated angiotensin II-induced hypertension.
(A) Experimental design for telemetry study. (B) Mean blood pressure of control, angII and angII+VEGFCc156s mice after minipump implantation (a linear mixed model was used for statistics). (C–E) Analysis of mean blood pressure at baseline (C), week 1 (D) and week 4 (E) (n = 5–6/group). (F) Pulse wave velocity assessment (aortic stiffness) 4.5 weeks after minipump implantation (n = 9–19/group). (G) RNA was extracted from mouse kidneys and qPCR was performed for Ace2 and normalized to Hprt. The data were normalized to the ctrl group and represented as fold change (n = 16–21/group). Ctrl, control. AngII, angiotensin II. VEGFC, VEGFCc156s. Data are mean ± s.d. One-way ANOVA with Bonferroni posthoc was used for statistics. *p<0.05, **p<0.01, ***p<0.001, ****p<0.0001, n.s. not significant.
-
Figure 5—source data 1
Raw data supporting Figure 5.
- https://cdn.elifesciences.org/articles/58376/elife-58376-fig5-data1-v2.xlsx
Figure 5—figure supplement 1
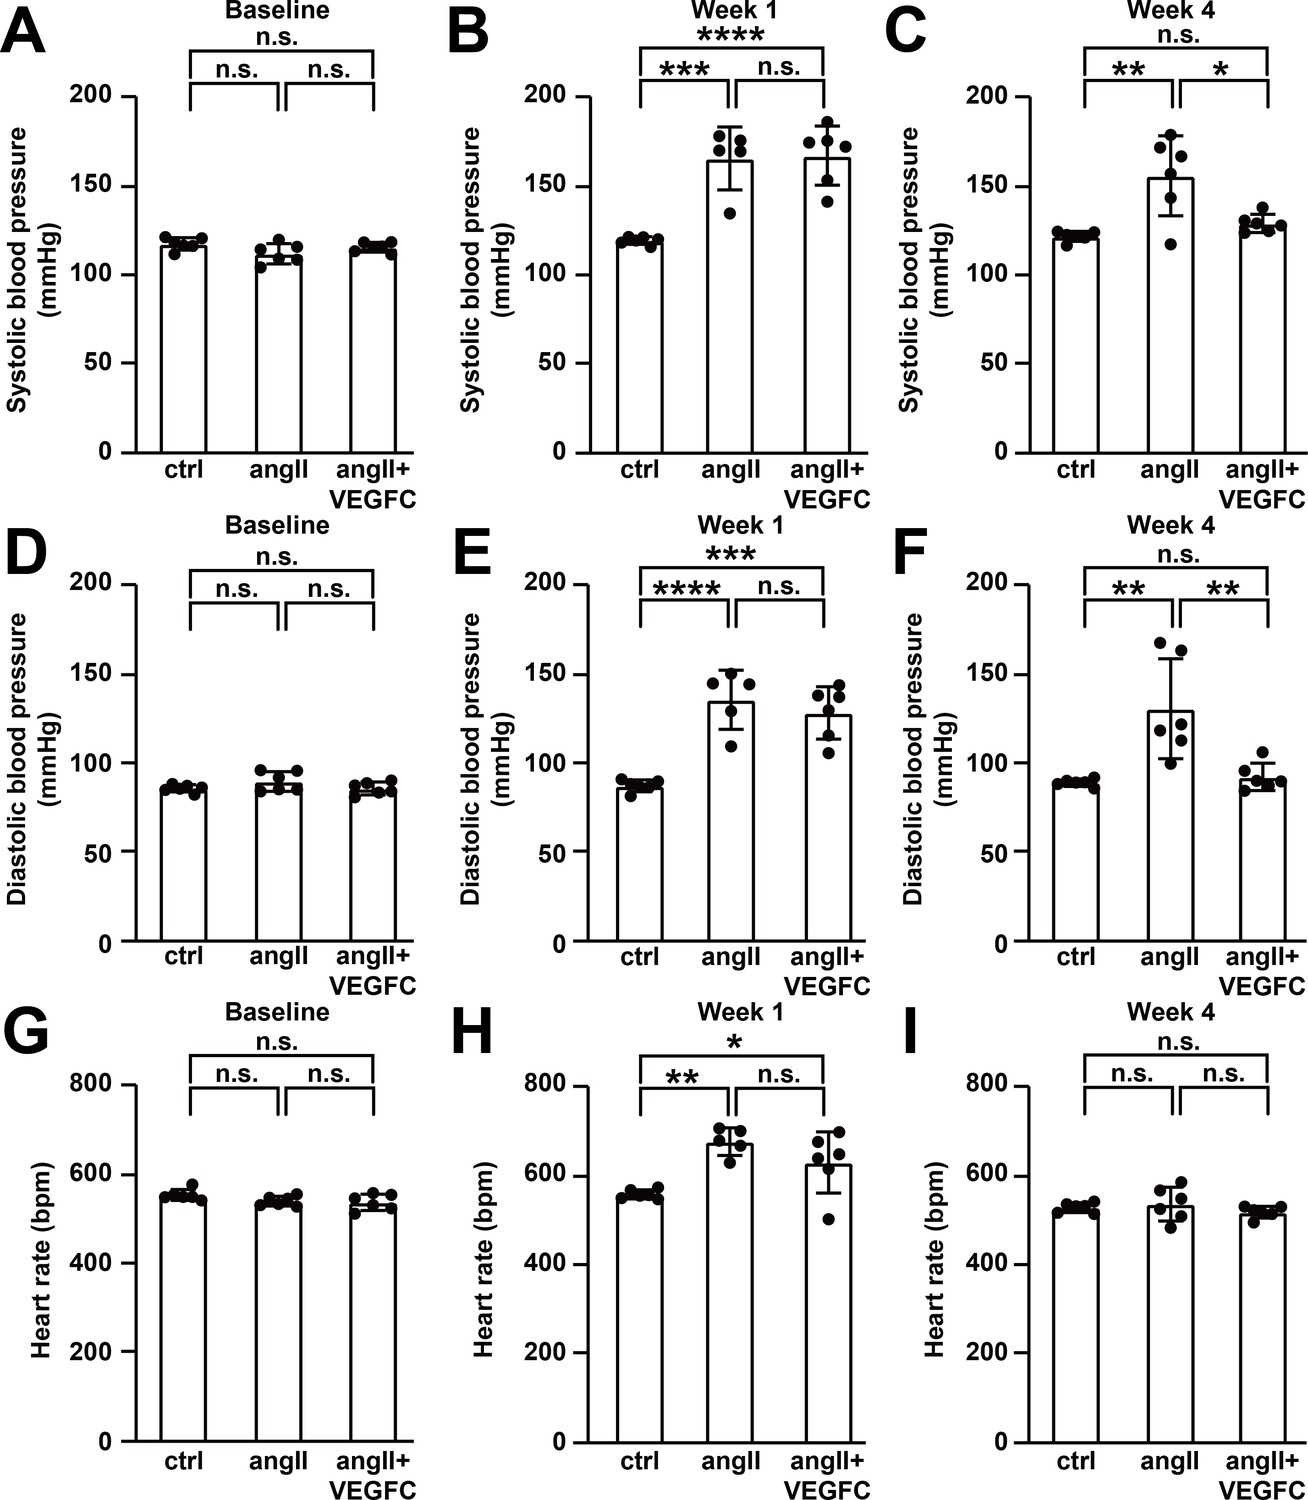
VEGFCC156S treatment ameliorated angiotensin II-mediated blood pressure increase.
(A–I) Telemeters were implanted into mice followed by minipump implantation as described in Figure 5A. Systolic blood pressure at baseline (A), week 1 (B) and week 4 (C), diastolic blood pressure at baseline (D), week 1 (E) and week 4 (F), and heart rate at baseline (G), week 1 (H) and week 4 (I) are analyzed. n = 5–6 per group. Ctrl, control. AngII, angiotensin II. VEGFC, VEGFCc156s. Data are mean ± s.d. One-way ANOVA with Bonferroni posthoc was used for statistics. *p<0.05, **p<0.01, ***p<0.001, ****p<0.0001, n.s. not significant.
Figure 6 with 1 supplement
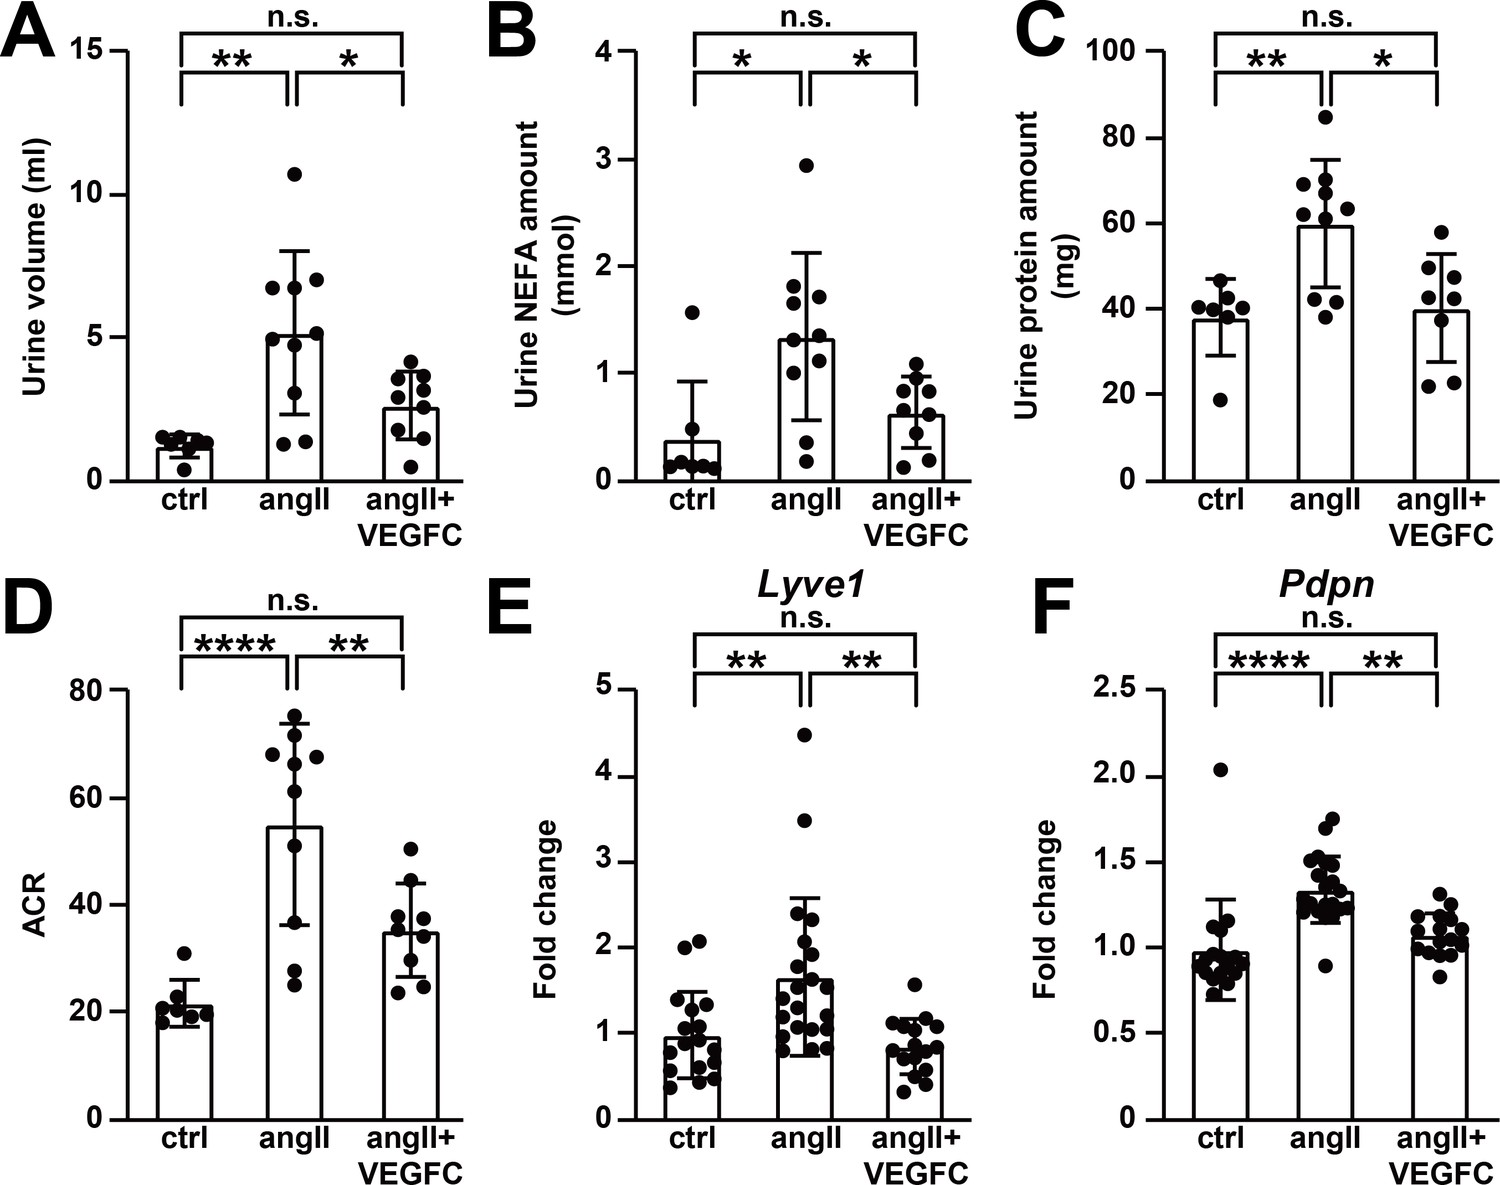
VEGFCC156S treatment improved angiotensin II-induced kidney dysfunction.
(A–D) Urine was collected 4.5 weeks after minipump implantation. Urine volume (A), Urine non-esterified fatty acid (NEFA) levels (B), total urinary protein (C) and albumin to creatinine ratio (ACR) (D) are shown (n = 7–10/group). (E–F) RNA was extracted from whole kidney, and quantitative RT-PCR was performed for Lyve1 (E) and Pdpn (F) and normalized to the expression of housekeeping gene Hprt. The data were normalized to the control group and represented as fold change (n = 16–21/group). Ctrl, control. AngII, angiotensin II. VEGFC, VEGFCc156s. Data are mean ± s.d. One-way ANOVA with Bonferroni posthoc was used for statistics. *p<0.05, **p<0.01, ****p<0.0001, n.s. not significant.
-
Figure 6—source data 1
Raw data supporting Figure 6.
- https://cdn.elifesciences.org/articles/58376/elife-58376-fig6-data1-v2.xlsx
Figure 6—figure supplement 1
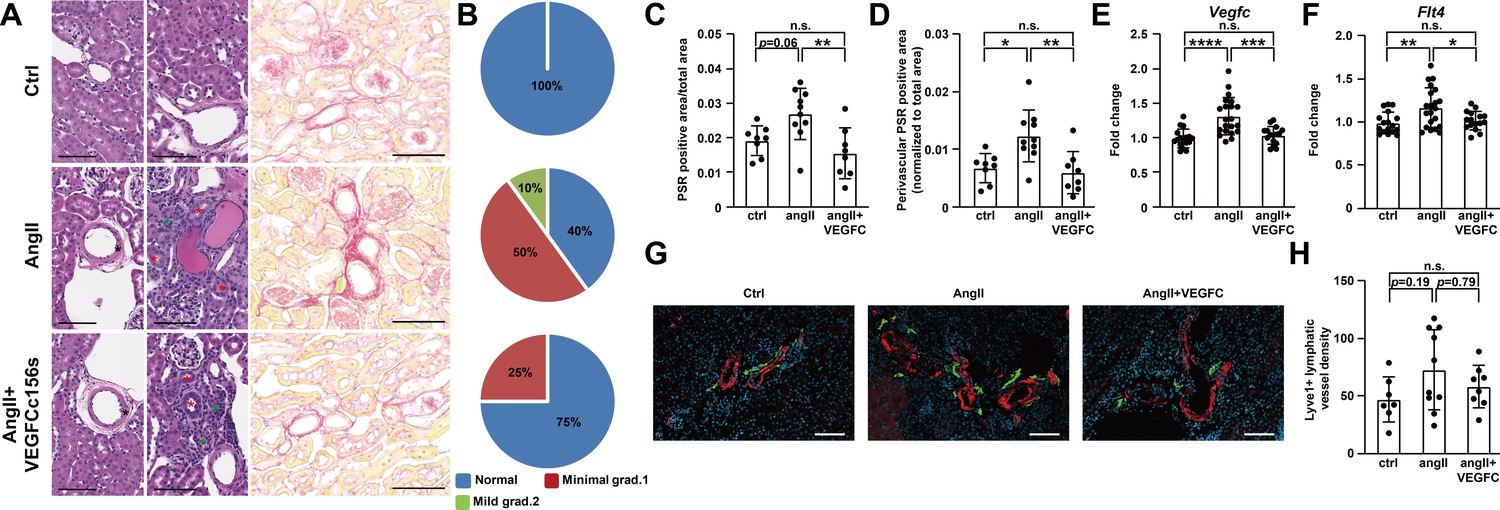
Analysis of pathological features, gene expression, and lymphatic vessel density in mouse kidneys.
(A) Kidneys from the mice described in Figure 2A were fixed, sectioned, and stained. Representative H and E stains and Picrosirius red (PSR) stains of mouse kidney sections are shown (n = 8–10/group). Black asterisk indicates vascular hypertrophy, green asterisk indicates interstitial mononuclear cell infiltrates and red asterisk indicates tubular basophilia. Scale bar, 100 μm. (B) A summary of pathological grading of kidney damage based on H and E stained kidney sections. (C–D) Quantification of PSR-positive area (C) and perivascular PSR-positive area (D) (normalized to total area) on PSR-stained kidney sections (n = 8–10/group). (E–F) RNA was extracted from mouse kidneys and qPCR was performed for Vegfc (E), Flt4 (F) and normalized to the expression of housekeeping gene Hprt in mouse kidneys. The data were normalized to the ctrl group and represented as fold change (n = 16–21/group). (G) Mouse kidneys were fixed, OCT embedded, sectioned, and stained for lyve1 (green), smooth muscle actin (red), and DAPI (light blue). Representative images for each group are shown. Scale bar, 100 μm. (H) Quantification of lyve1-positive lymphatic vessel density (normalized to total area) in stained mouse kidney sections (n = 7–10/group). Ctrl, control. AngII, angiotensin II. VEGFC, VEGFCc156s. Data are mean ± s.d. One-way ANOVA with Bonferroni posthoc was used for statistics. *p<0.05, **p<0.01, ***p<0.001, ****p<0.0001, n.s. not significant.
Figure 7 with 2 supplements
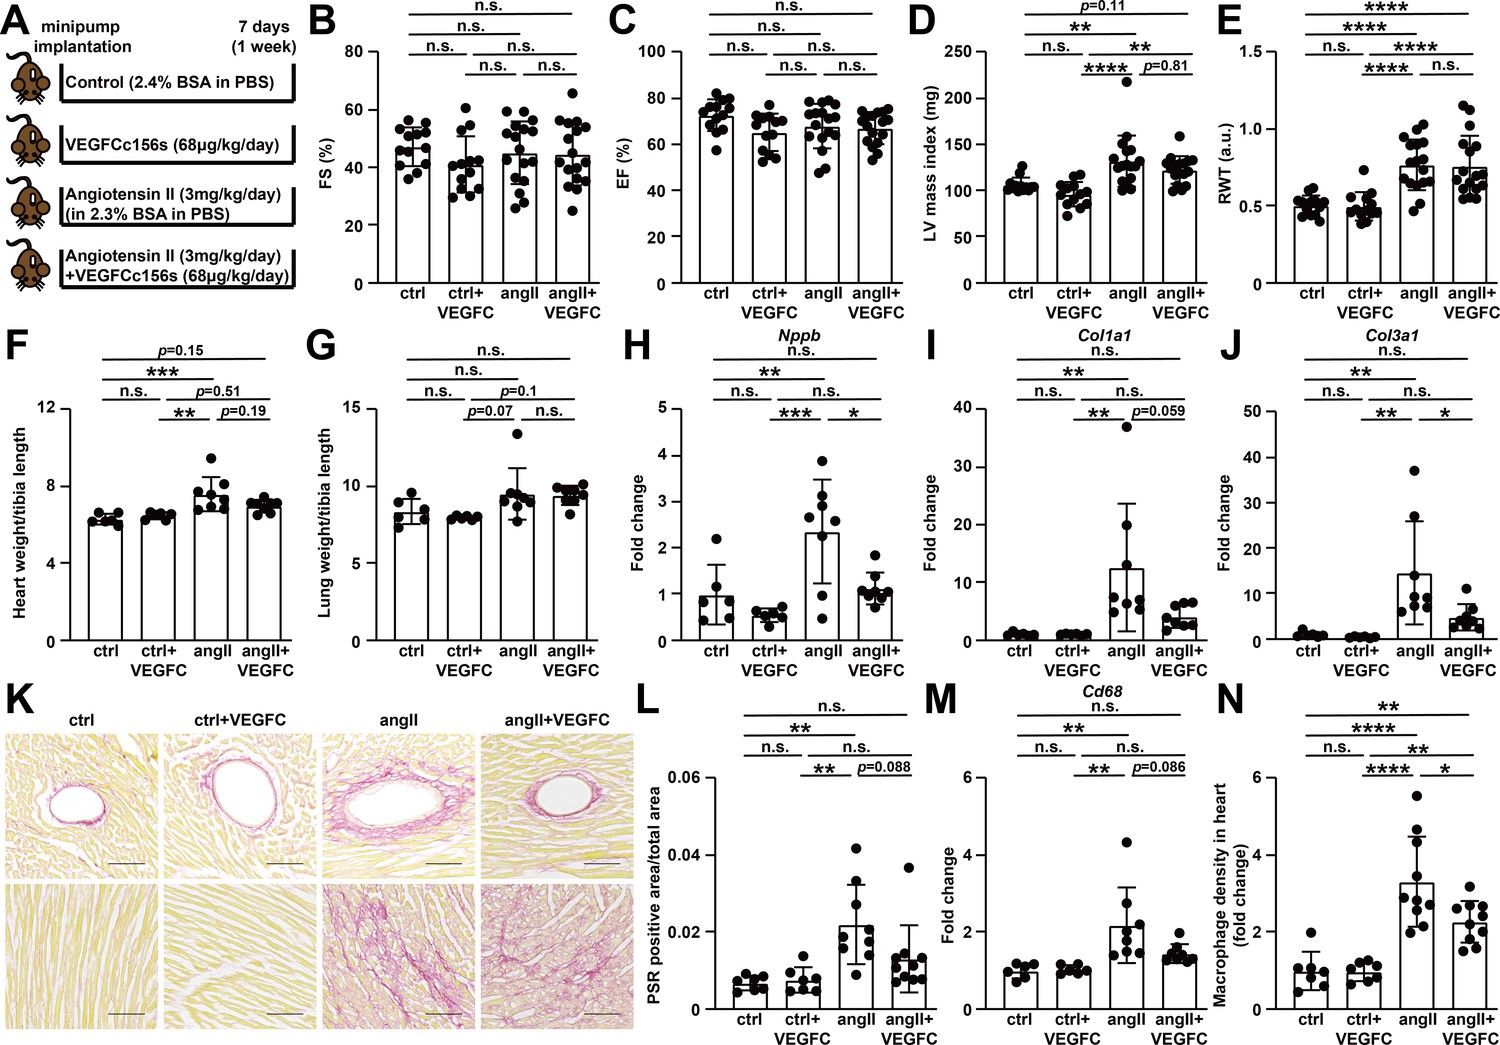
VEGFCC156S treatment reduced the gene expression of cardiac dysfunction, fibrosis and inflammatory markers, and alleviated cardiac fibrosis and inflammation at 1 week after treatment.
(A) Experimental design for the animal study. Angiotensin II (angII) was infused to induce cardiac dysfunction, and VEGFCc156s (VEGFC) was infused as a lymphangiogenic therapy via a subcutaneously-implanted osmotic pump. Bovine serum albumin (BSA) was loaded to the pumps for control (ctrl) and angII groups to balance for the loading of VEGFCc156s. (B–E) Echocardiography was conducted at day 6 after minipump implantation. Fractional Shortening (FS) (B), Ejection Fraction (EF) (C), Left Ventricular (LV) mass index (D) and Relative Wall Thickness (RWT) (E) are shown (n = 13–17/group). (F–G) Heart weight (F) and lung weight (G) (normalized to tibia length) of the animals at euthanasia (n = 6–8/group). (H–J) RNA was isolated from the mouse hearts, and quantitative RT-PCR was performed for Nppb(H), Col1a1(I), Col3a1(J), and normalized to the expression of housekeeping gene Hprt. The data were normalized to ctrl group and represented as fold change (n = 6–8/group). (K) Hearts from the mice described in (A) were fixed, sectioned, and stained. Representative Picrosirius red (PSR) stains of mouse heart sections are shown. Scale bar, 100 μm. (L) Quantification of PSR-positive area (normalized to total area) on PSR-stained heart sections (n = 7–10/group). (M) Quantitative RT-PCR was performed for Cd68 and normalized to the expression of housekeeping gene Hprt. The data were normalized to ctrl group and represented as fold change (n = 6–8/group). (N) CD68/DAPI double-positive macrophage density (normalized to total area and represented as fold change to ctrl group) in mouse hearts (n = 7–10/group). Data are mean ± s.d. One-way ANOVA with Bonferroni posthoc was used for statistics. *p<0.05, **p<0.01, ***p<0.001, ****p<0.0001, n.s. not significant.
-
Figure 7—source data 1
Raw data supporting Figure 7.
- https://cdn.elifesciences.org/articles/58376/elife-58376-fig7-data1-v2.xlsx
Figure 7—figure supplement 1
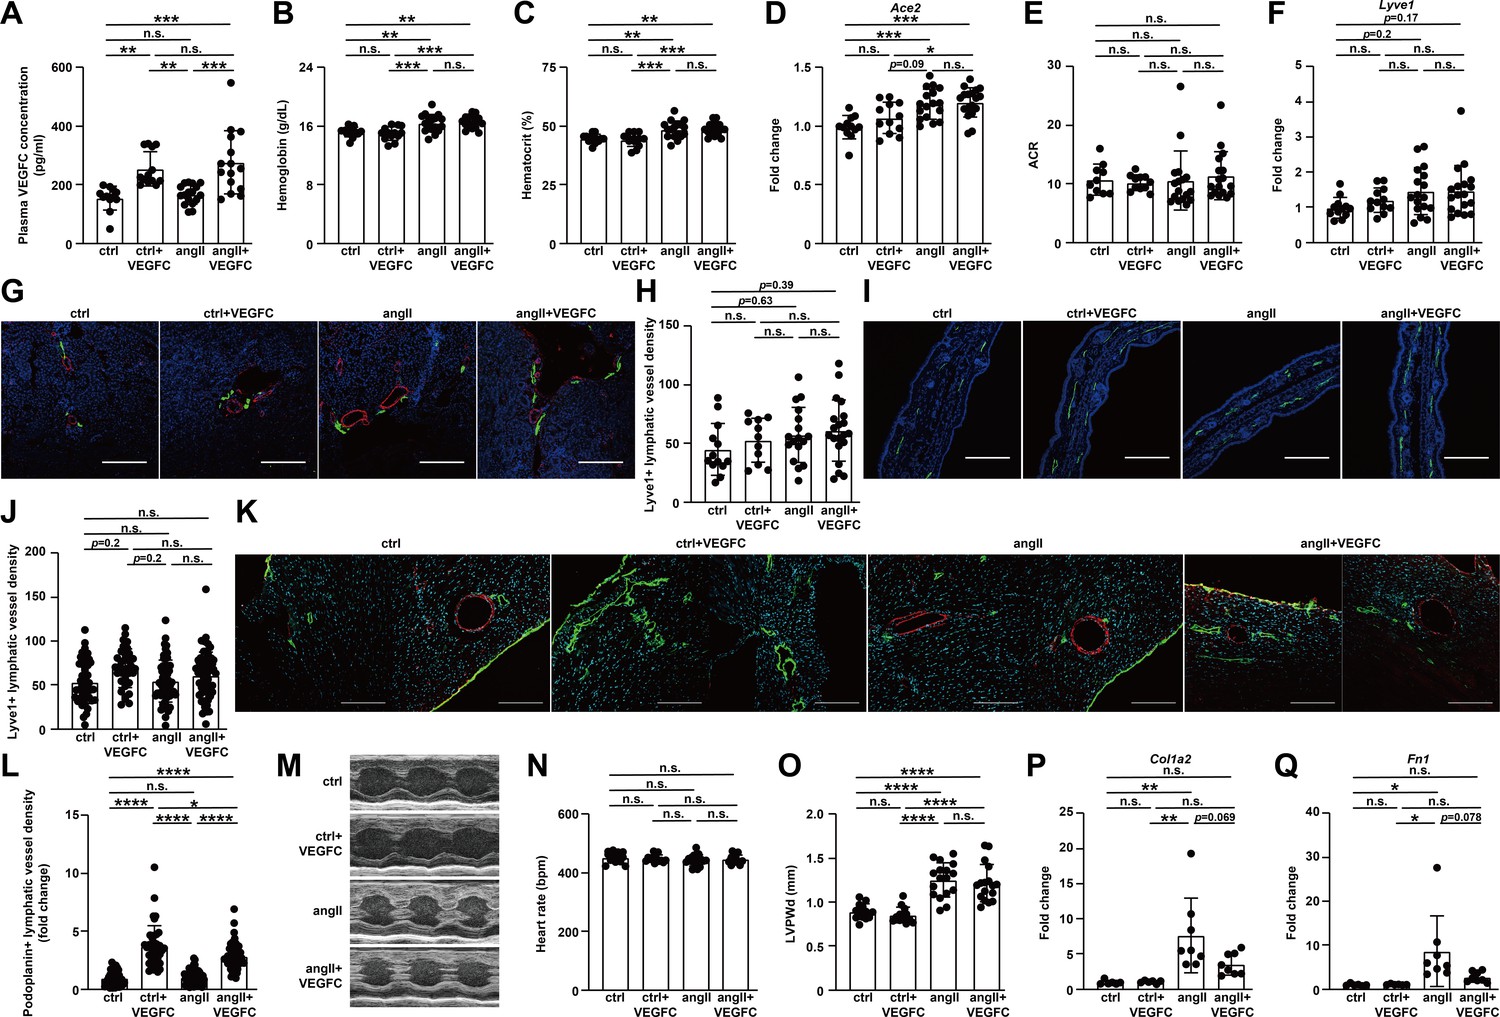
Effect of VEGFCC156S on the lymphatic vessels in heart, kidney and ear skin at 1 week after treatment.
Mice were infused with saline + BSA, saline+ VEGFCC156S, angiotensin II + BSA, or angiotensin II + VEGFCC156S as described in Figure 7A. (A) Plasma VEGFC concentration measured by ELISA at euthanasia (1 week post-treatment) (n = 12–17/group). (B–C) Plasma hemoglobin concentration (B) and hematocrit percentage (C) measured at euthanasia (1 week post-treatment) (n = 13–18/group). (D) RNA was extracted from mouse kidneys and qPCR was performed for Ace2 and normalized to Hprt. The data were normalized to the control (ctrl) group and represented as fold change (n = 12–18/group). (E) Urine was collected at day 5 after minipump implantation. Urine albumin to creatinine ratio (ACR) was measured and is shown (n = 10–17/group). (F) RNA was extracted from whole kidney, and quantitative RT-PCR was performed for Lyve1 and normalized to the expression of housekeeping gene Hprt. The data were normalized to the ctrl group and represented as fold change (n = 12–18/group). (G) Mouse kidneys were fixed, OCT embedded, sectioned and stained for lyve1 (green), smooth muscle actin (red) and DAPI (blue). Representative images for each group are shown. Scale bar, 200 μm. (H) Quantification of lyve1-positive lymphatic vessel density (normalized to total area) in stained mouse kidney sections (n = 11–20/group). (I) Ear skin samples were fixed, sectioned, and stained for lyve1(green) and DAPI (blue). Representative images of lyve1-positive lymphatic vessels in ear skin cross-section for each group. Scale bar, 200 μm. (J) Quantification of lyve1-positive lymphatic vessel density (normalized to total area) in ear skin (n = 6–10 animals/group, n = 5–7 sections/animal; a linear mixed model was used for statistics). (K) Mouse hearts were fixed, OCT embedded, sectioned and stained, for podoplanin, smooth muscle actin, and DAPI (light blue). Representative images of podoplanin-positive lymphatic vessels (green) and smooth muscle actin-positive arteries (red) for each group were shown. Scale bar, 200 μm. (L) Quantification of podoplanin-positive lymphatic vessel density (normalized to total area and represented as fold change to ctrl group) in mouse hearts (n = 7–10 animal/group, n = 4–6 sections/animal; a linear mixed model was used for statistics). (M) Representative M-mode echocardiography images for each group. (N–O) Echocardiography parameters heart rate (N) and Left Ventricular Posterior Wall thickness at diastole (LVPWd) (O) are shown (n = 13–17/group). (P–Q) RNA was isolated from the mouse hearts, and quantitative RT-PCR was performed for Col1a2(P) and Fn1(Q) and normalized to the expression of housekeeping gene Hprt. The data were normalized to ctrl group and represented as fold change (n = 6–8/group). AngII, angiotensin II. VEGFC, VEGFCc156s. Data are mean ± s.d. One-way ANOVA with Bonferroni posthoc was used for all figures except 7J and 7L (a linear mixed model was used for statistics). *p<0.05, **p<0.01, ***p<0.001, ****p<0.0001, n.s. not significant.
Figure 7—figure supplement 2
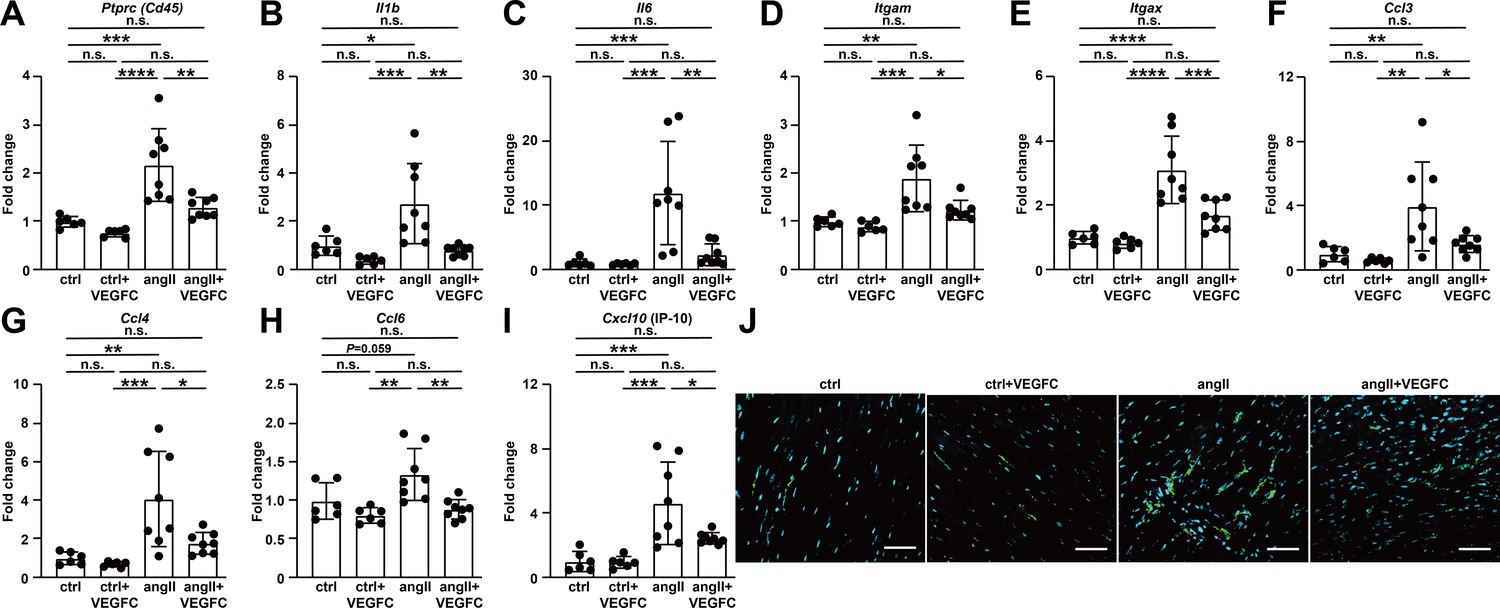
VEGFCC156S treatment reduced the gene expression of inflammatory markers in heart and alleviated cardiac inflammation at 1 week after treatment.
(A–I) RNA was isolated from the mouse hearts, and quantitative RT-PCR was performed for Ptprc(Cd45) (A), Il1b (B), Il6 (C), Itgam (D), Itgax (E), Ccl3 (F), Ccl4 (G), Ccl6 (H), Cxcl10(IP-10) (I), and normalized to the expression of housekeeping gene Hprt. The data were normalized to ctrl group and represented as fold change (n = 6–8/group). (J) Mouse hearts were fixed, OCT embedded, sectioned, and stained for CD68 (green) and DAPI (light blue). Representative images for each group are shown. Scale bar, 50 μm. Ctrl, control. AngII, angiotensin II. VEGFC, VEGFCc156s. Data are mean ± s.d. One-way ANOVA with Bonferroni posthoc was used for statistics. *p<0.05, **p<0.01, ***p<0.001, ****p<0.0001, n.s. not significant.
Author response image 1
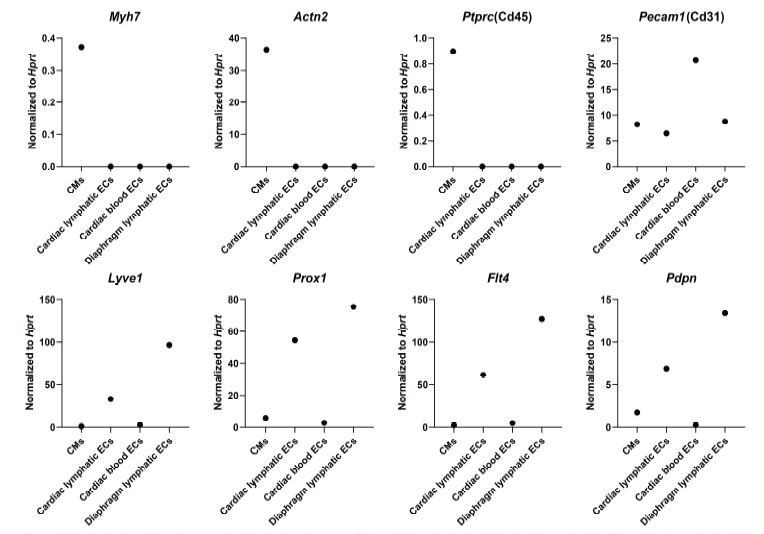
Analysis of cell-specific marker expression in isolated cardiomyocytes (CMs), cardiac lymphatic endothelial cells (ECs), cardiac blood ECs and diaphragm lymphatic ECs.
The cells were isolated from the heart and diaphragm of a Prox1-eGFP mouse following the cell isolation procedure shown in Figure 4—figure supplement 1D in main manuscript. RNA was isolated from the cells, and quantitative RT-PCR was performed for Myh7, Actn2, Ptprc, Pecam1, Lyve1, Prox1, Flt4, Pdpn and normalized to the expression of housekeeping gene Hprt(n=1/group).
Tables
Table 1
SNPs mapping to lymphatic endothelial markers associate with cardiac comorbidities.
SNPs in human genetic loci, where lymphatic endothelial marker genes VEGFC, LYVE1, FLT4 are located, are associated with cardiovascular and metabolic phenotypes. MRVI1, murine retrovirus integration site one homolog. ADM, adrenomedullin. CTR9, RNA polymerase-associated protein CTR9 homolog. MGAT1, alpha-1,3-mannosyl-glycoprotein 2-beta-N-acetylglucosaminyltransferase. SCGB3A1, Secretoglobin Family 3A Member 1. OR2Y1, olfactory receptor family two subfamily Y member 1.
| SNP | Nearest gene(s) | Associated phenotype | p Value | Reference |
|---|---|---|---|---|
| rs2333496 | VEGFC | Waist-to-hip ratio (WHR) adj BMI | 8.00E-11 | Lotta, et al. |
| rs7660760 | VEGFC | Left ventricle wall thickness | 4.00E-07 | Wild, et al. |
| rs309795 | VEGFC | 2 hr Glucose Adj. for BMI | 2.22E-06 | Saxena, et al. |
| rs114108584 | VEGFC | Idiopathic dilated cardiomyopathy | 9.00E-06 | Xu, et al. |
| rs11042906 | LYVE1 and MRVI1 | Systolic BP | 2.00E-14 | Kichaev, et al. |
| rs2218793 | LYVE1 and ADM | High density lipoprotein cholesterol (HDL-C) | 1.60E-11 | Sinnott-Armstrong, et al. |
| rs11042937 | LYVE1 and CTR9 | Coronary artery disease | 3.00E-10 | Van der harst, et al. |
| rs7940646 | LYVE1 and MRVI1 | Triglycerides 2017 Mostly European and East Asian | 2.93E-08 | Lu, et al. |
| rs10840457 | LYVE1 and MRVI1 | Arterial stiffness index | 3.00E-08 | Fung, et al. |
| rs11603178 | LYVE1 and MRVI1 | Diastolic BP | 9.85E-08 | Nealelab-uk-biobank |
| rs12807023 | LYVE1 and ADM | Plasma + serum IDL-TAG levels | 8.21E-07 | Kettunen, et al. |
| rs12807023 | LYVE1 and ADM | Plasma + serum XS-VLDL values (concentration, TAG) | 5.41E-06 | Kettunen, et al. |
| rs634501 | FLT4 and MGAT1 | High density lipoprotein cholesterol (HDL-C) | 9.35E-08 | Lu, et al. |
| rs142342609 | FLT4 and SCGB3A1 | WHR adjusted BMI | 7.00E-07 | Justice, et al. |
| rs12517906 | FLT4 and OR2Y1 | Body mass index (females) | 6.00E-06 | Johansson, et al. |
Appendix 1—key resources table
| Reagent type (species) or resource | Designation | Source or reference | Identifiers | Additional information |
|---|---|---|---|---|
| Mice, male | C67/BL6N | Charles River laboratories | Catalog: #027 | |
| Mice, male | Prox1-eGFP KI | This paper | eGFP gene was inserted at the end of endogenous Prox1 gene to generate this indicator line. The sperms of the animals are cryopreserved in Charles River Laboratories. | |
| Peptide, recombinant protein | Bovine serum albumin | Sigma-Aldrich | A7030 | |
| Peptide, recombinant protein | human angiotensin II | Sigma-Aldrich | A9525 | |
| Peptide, recombinant protein | recombinant human VEGF-C (Cys156Ser) protein VEGFC | R and D systems | 752-VC | |
| Other | minipump | Alzet | Alzet 1002 or Alzet 2006 | |
| Sequence-based reagent | Prox1-eGFP genotyping forward primer | This paper | PCR primer | The primer sequence is 5’TCCAGGCAACAGTTCTACAG. It can be ordered from Integrated DNA Technologies using the sequence. |
| Sequenced-based reagent | Prox1-eGFP genotyping reverse primer | This paper | PCR primer | The primer sequence is 5’TGCACATCAGATTGTCTAAGG. It can be ordered from Integrated DNA Technologies using the sequence. |
| Commercial assay or kit | human VEGFC Quantikine ELISA kit | R and D systems | DVEC00 | |
| Commercial assay or kit | V-PLEX Human VEGFC kit | MSD | K151LTD-1 | |
| Other | Telemeters | Data Sciences International | PA-C10 or HD-X10 | |
| Other | Vevo2100 or Vevo3100 | VisualSonics Inc | ||
| Other | doppler flow velocity system | Indus Instruments | ||
| Other | AimStrip Hb Hemoglobin test system | Germaine Laboratories | ||
| Other | Trizol reagent | ThermoFisher | 15596026 | |
| Commercial assay or kit | RNeasy mini kits | Qiagen | 74104 | |
| Commercial assay or kit | TaqMan RNA to Ct 1-step kit | Thermofisher | 4392938 | |
| Commercial assay or kit | high capacity cDNA reverse transcription kit | Thermofisher | 4368814 | |
| Other | TaqMan gene expression master mix | Thermofisher | 4369016 | |
| Other | Tapman probes for mouse | Thermofisher | Nppb, Mm01255770_g1; Pdpn, Mm01348912_g1; Lyve1, Mm00475056_m1; Flt4, Mm01292604_m1; Vegfc, Mm00437310_m1; Col1a1, Mm00801666; Col1a2, Mm00483888; Col3a1, Mm00802300_m1; Fn1, Mm01256744; Cd68, Mm03047343_m1; Cxcl10, Mm00445235_m1; Ptprc, Mm01293577_m1; Itgax, Mm00498701_m1; Itgam, Mm00434455_m1; Il1b, Mm00434228_m1; Il6, Mm00446190_m1; Ccl6, Mm01302419_m1; Ccl4, Mm00443111_m1; Ccl3, Mm00441259_g1; Ace2, Mm01159006_m1; Hprt, Mm03024075_m1 | |
| Other | QuantStudio 7 Flex Real-Time PCR System | ThermoFisher | ||
| Antibody | Anti-mouse Podoplanin antibody (Goat polyclonal) | R and D systems | AF3244 | 1:500 dilution for Western blot |
| Antibody | anti-Akt antibody (Rabbit polyclonal) | Cell signaling | #9272 | 1:1000 dilution for Western blot |
| Antibody | anti- p-Akt (Ser473) antibody (Rabbit polyclonal) | Cell signaling | #9271 | 1:1000 dilution for Western blot |
| Antibody | p44/42 MAPK (Erk 1/2) antibody (Rabbit polyclonal) | Cell signaling | #9102 | 1:2000 dilution for Western blot |
| Antibody | phsopho-p44/42 MAPK (Erk1/2) (Thr202/Tyr204) antibody (Rabbit monoclonal) | Cell signaling | #4370 | 1:2000 dilution for Western blot |
| Antibody | GAPDH antibody (Rabbit monoclonal) | Cell signaling | #5174 | 1:5000 dilution for Western blot |
| Antibody | Lyve1 antibody (Rabbit polyclonal) | Abcam | ab14917 | 1:500 dilution for IF |
| Antibody | podoplanin antibody (Hamster monoclonal) | Abcam | ab11936 | 1:250 dilution for IF |
| Antibody | CD68 antibody (Rat monoclonal) | ThermoFisher | MA5-16674 | 1:300 dilution for IF |
| Antibody | smooth muscle actin antibody (Mouse monoclonal) | Abcam | ab7817 | 1:100 dilution for IF |
| Antibody | GFP antibody (Chicken polyclonal) | Abcam | ab13970 | 1:100 dilution for IF |
| Commercial assay or kit | trueview autofluorescence quenching kit | Vector laboratories | SP-8400–15 | |
| Other | Alexa 594-conjugated WGA | ThermoFisher | W11262 | 1:200 dilution for IF |
| Software, algorithm | Pathology image analysis software Visiopharm | Visiopharm | ||
| Other | FITC-Dextran | Sigma-Aldrich | FD500S | |
| Other | alexa Fluor 555 Cadaverine | ThermoFisher | A30677 | |
| Other | Qdot 655 | ThermoFisher | Q21021MP | |
| Other | Hamilton neuros micro-injection syringe | Hamilton | 6546006 | |
| Antibody | PE-Cy7 Mouse Anti-Mouse CD45.2 antibody (Mouse monoclonal) | BD Pharmingen | 560696 | 1:100 dilution for FACS |
| Antibody | APC Rat Anti-Mouse CD31 Clone MEC 13.3 (RUO) antibody (Rat monoclonal) | BD Pharmingen | 561814 | 1:100 dilution for FACS |
| Other | DAPI | Thermo Fisher | D1306 | 1:5000 dilution for FACS |
| Commercial assay or kit | RNeasy MinElute cleanup kit | Qiagen | 74204 | |
| Commercial assay or kit | Smart-Seq ultra low input RNA kit | Takara | 634890 | |
| Commercial assay or kit | Nextera DNA XT Library Prep Kit | Illumina | FC-131–1096 | |
| Commercial assay or kit | NextSeq 500/550 High Output Kit | Illumina | 20024907 | |
| Software, algorithm | R | R-project | v.3.5.3 and v.3.6.1 | |
| Commercial assay or kit | U-plex chemokine combo 1 (Ms) kit | MSD | K15321K-1 | |
| Other | Siemens clinical analyzer | ADVIA Chemistry XPT system | ||
| Commercial assay or kit | BCP albumin assay kit | Sigma-Aldrich | MAK125-1KT | |
| Other | Taqman probes for human | Thermo Fisher | LYVE1, Hs00272659_m1; PDPN, Hs00366766_m1; FLT4, Hs01047677_m1; VEGFC, Hs01099203_m1; HPRT1, Hs02800695_m1 | |
| Software, algorithm | Graphpad Prism | Graphpad |
Additional files
Download links
A two-part list of links to download the article, or parts of the article, in various formats.
Downloads (link to download the article as PDF)
Open citations (links to open the citations from this article in various online reference manager services)
Cite this article (links to download the citations from this article in formats compatible with various reference manager tools)
Lymphangiogenic therapy prevents cardiac dysfunction by ameliorating inflammation and hypertension
eLife 9:e58376.
https://doi.org/10.7554/eLife.58376


