The LINC complex transmits integrin-dependent tension to the nuclear lamina and represses epidermal differentiation
- Department of Cell Biology, Yale School of Medicine, United States
- Department of Molecular, Cell and Developmental Biology, Yale University, United States
- Sunnycrest Bioinformatics, United States
- Department of Dermatology, Yale School of Medicine, United States
Figures
Figure 1 with 1 supplement
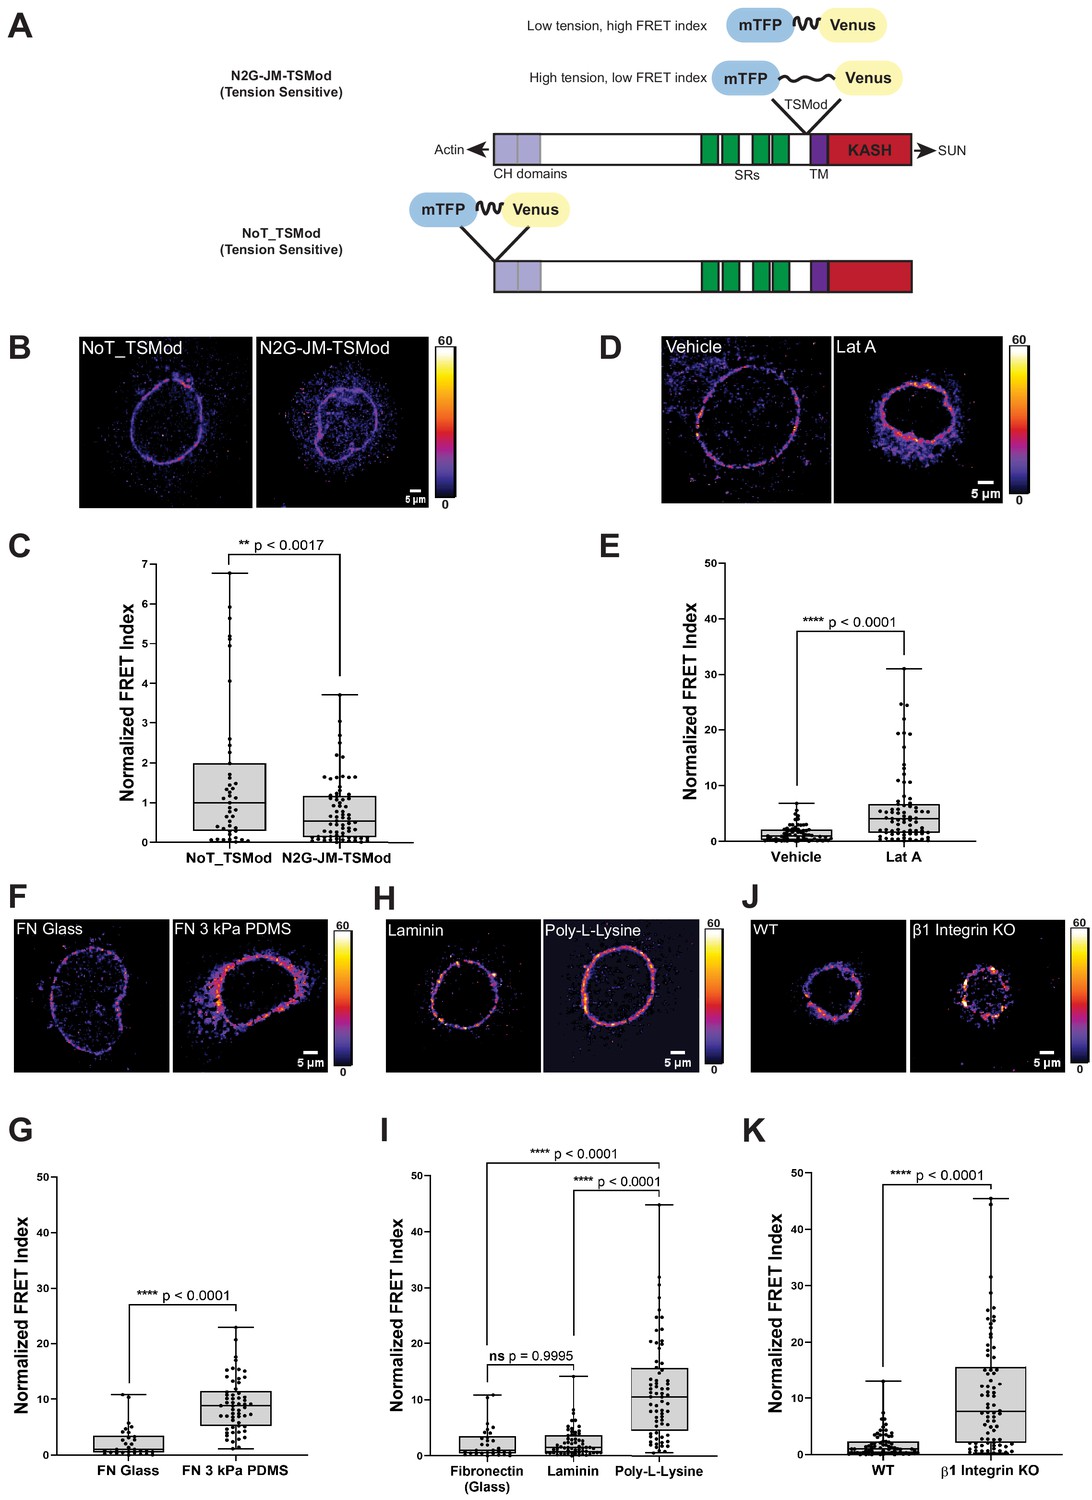
A tension sensor in mini-Nesprin-2 is under actin-dependent tension when mouse keratinocytes (MKCs) engage the extracellular matrix through integrins.
(A) Cartoon of the N2G-JM-TSMod, in which the mTFP-Venus tension sensor module is inserted between the cytoplasmic domain and the C-terminal KASH domain/transmembrane domain of mini-Nesprin-2. Tension leads to a reduction in the fluorescence resonance energy transfer (FRET) index. Cartoon of the NoT_TSMod control, in which the TSMod resides at the N-terminus of the N2G, and therefore cannot experience intramolecular tension. (B, C) The N2G-JM-TSMod displays higher tension (lower FRET index) than the no-tension NoT_TSMod control (higher FRET index) when expressed in MKCs plated on FN-coated glass. Representative images show that, at low expression levels, both the N2G-JM-TSMod and NoT_TSMod are successfully targeted to the nuclear envelope. Images are pseudocolored according to the normalized FRET index (Feige et al., 2005). The median FRET index value of cells expressing the NoT_TSMod was set to a value of 1 in (C) and used to scale to relative values for the N2G-JM-TSMod. (D, E) Disruption of actin filaments with 0.5 μM latrunculin A (Lat A) decreases the tension on the N2G-JM-TSMod, leading to a higher FRET index. The median FRET index of cells expressing the N2G-JM-TSMod was set to a value of 1 in (E). (F, G) Tension on the N2G-JM-TSMod is sensitive to substrate mechanics. Plating of MKCs on FN-coated compliant substrates (3 kPa PDMS) leads to increased FRET compared to MKCs plated on FN-coated glass. (H, I) Plating of MKCs on extracellular matrix that engages integrins drives high tension on the N2G-JM-TSMod. MKCs grown on glass coated with fibronectin or laminin drive a higher tension state (low FRET index) than for cells grown on glass coated with poly-L-lysine (high FRET index). The median FRET index value of cells expressing the N2G-JM-TSMod plated on FN-coated glass was set to a value of 1 in (G) and (I). Data for FN replotted from (I). (J, K) MKCs lacking β1 integrin fail to drive high tension on the N2G-JM-TSMod. Representative images demonstrate that the N2G-JM-TSMod is successfully targeted to the nuclear envelope in wild-type (WT) and β1 integrin null MKCs. Higher FRET indexes at the nuclear envelope in β1 integrin null MKCs demonstrate that β1 integrin engagement with the extracellular matrix is required for high tension on the N2G-JM-TSMod. The median FRET index value of cells expressing the N2G-JM-TSMod plated on fibronectin-coated glass was set to a value of 1 in (K). For all plots, errors reflect SD, n ≥ 30 cells for each condition measured from n = 3 experiments. ****p<0.0001 as determined by unpaired t-test (C, E, G, K) or one-way ANOVA (I). All scale bars = 5 μm.
Figure 1—figure supplement 1
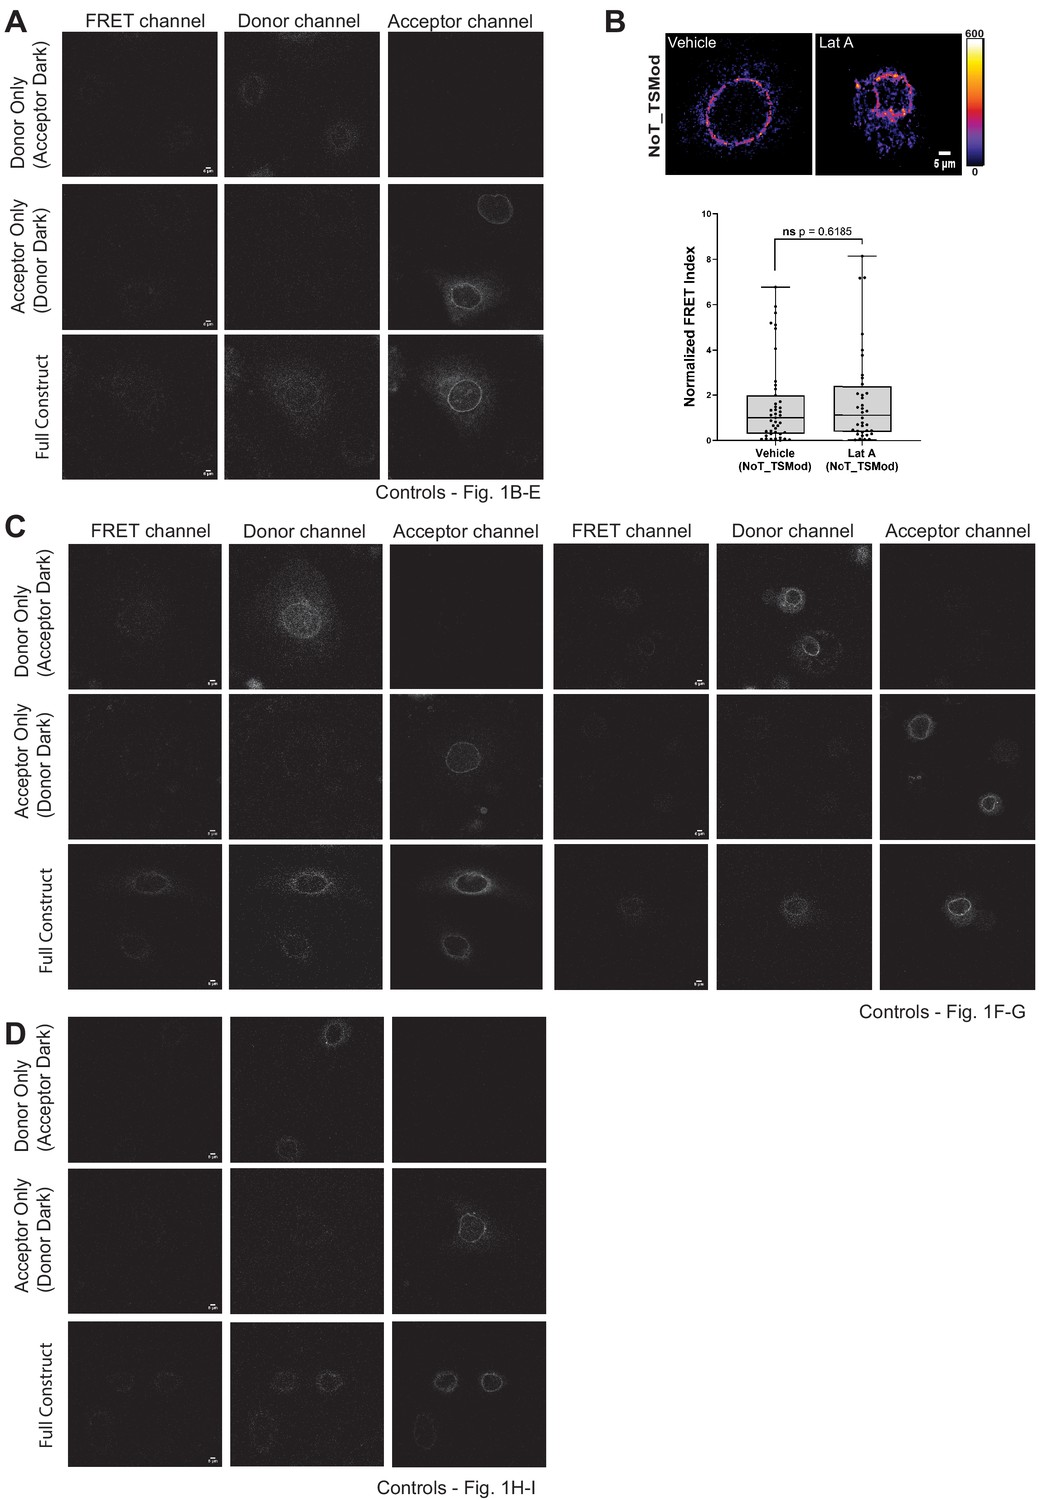
Validation controls for the N2G-JM-TSMod.
(A, C, D) Representative images of the ‘dark’ control constructs (mTFP donor or Venus acceptor fluorescence only) used for bleed through assessment as required for fluorescence resonance energy transfer (FRET) experiments. For comparison, representative images of the N2G-JM-TSMod construct in which fluorescent signals can be readily detected in the donor, acceptor, and FRET channels are included. (B) The FRET index for the NoT_TSMod control is unaffected by actin depolymerization. In wiild-type mouse keratinocytes expressing the NoT_TSMod control, there is no significant (ns) change in FRET index as assessed by unpaired t-test upon addition of 0.5 μM latrunculin A (Lat A) compared to vehicle controls. Data for vehicle alone replotted from Figure 1C. Errors reflect SD, n ≥ 30 cells for each condition measured from n = 3 experiments. Scale bar = 5 μm.
Figure 2 with 1 supplement
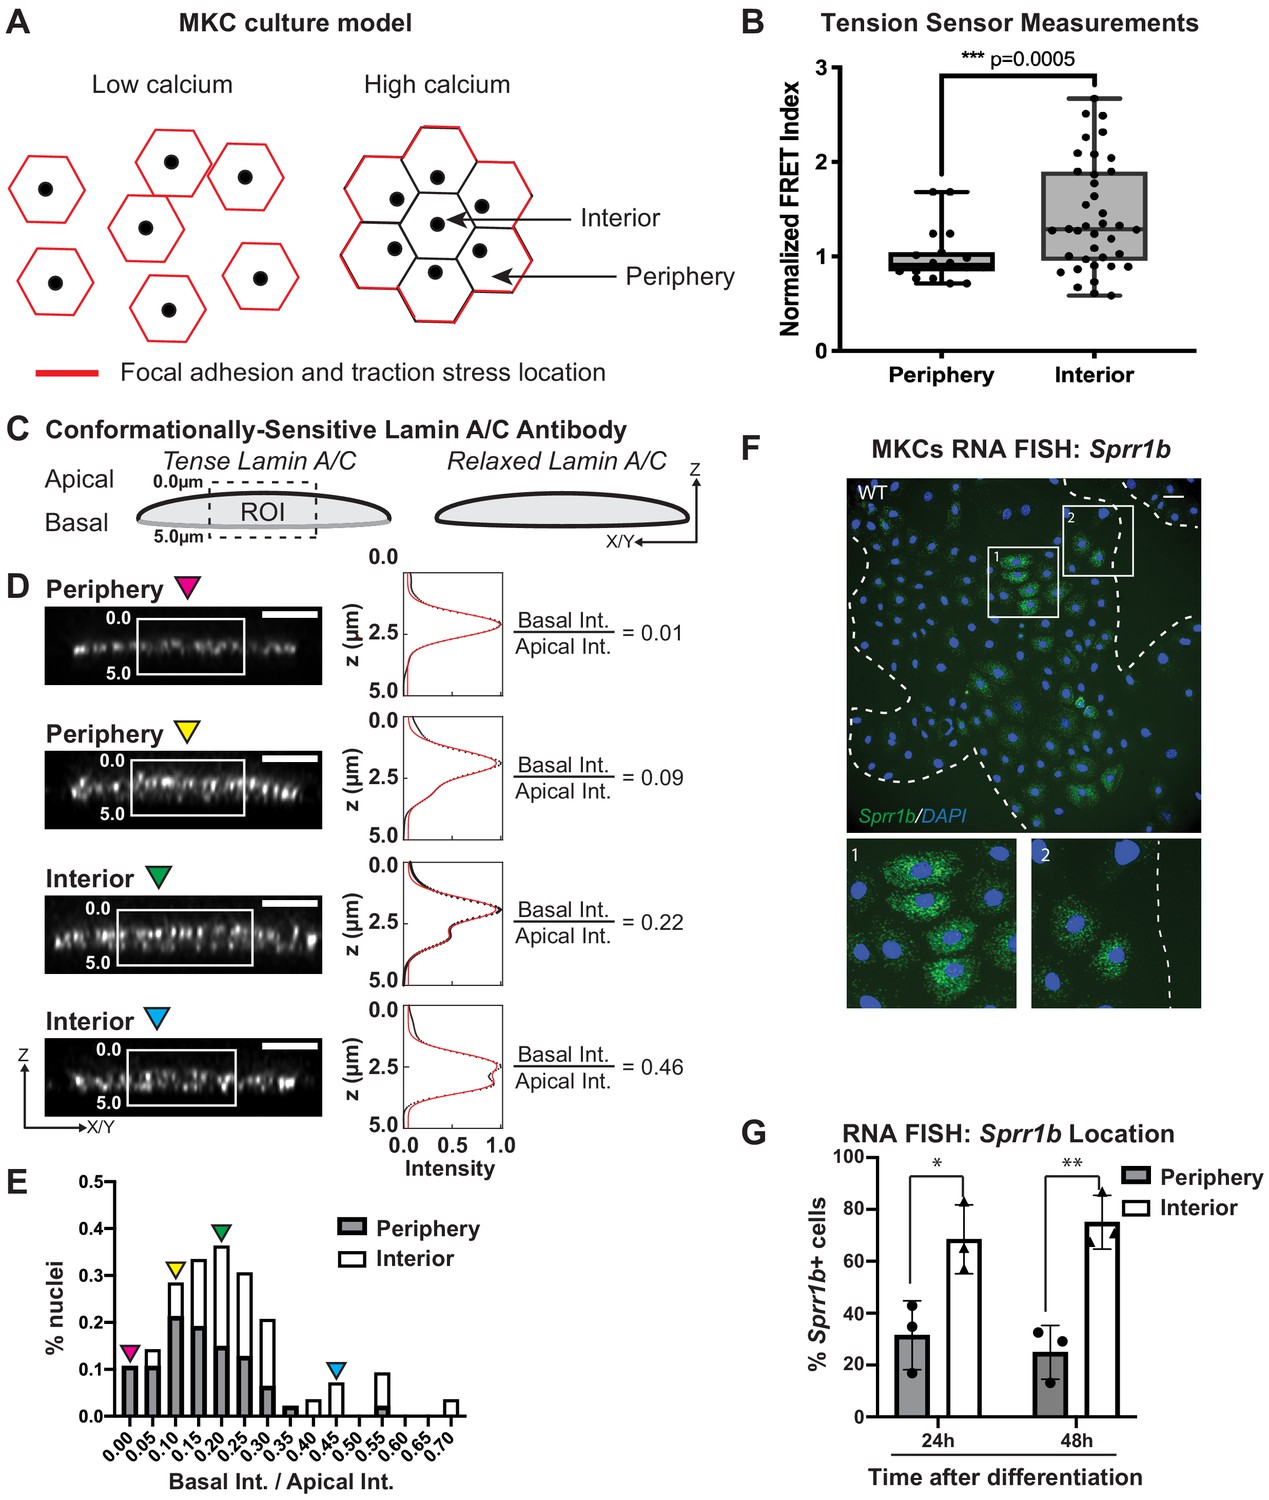
Tension on the N2G-JM-TSMod and nuclear lamina is released at the interior of cohesive mouse keratinocyte (MKC) colonies concomitant with differentiation.
(A) Cartoon of cell junction reorganization upon differentiation. In single MKCs grown in low calcium media, focal adhesions and traction forces are found at the periphery of each cell (red). In response to high calcium, MKCs form cohesive colonies and engage cell-cell junctions, which leads to a reorganization of focal adhesions and traction forces to the colony periphery. Cells in the colony interior have cell-cell but not cell-matrix adhesions. (B) The fluorescence resonance energy transfer index is higher in cells at the interior of cohesive MKC colonies compared to cells at the periphery, suggesting that tension on the N2G-JM-TSMod requires cell-intrinsic focal adhesion engagement. (C) Cartoon of method used to measure changes in the tension state of A-type lamins using a conformationally sensitive lamin A/C antibody whose epitope is lost when lamins are under tension. Cells under tension (left) lose staining on the basal side of the nuclear envelope. The profile of fluorescence intensity from the apical to basal side of each nuclei was measured for a region of interest in XZ and YZ slices from individual nuclei at varying locations within a colony. (D) Tension at the basal surface of nuclei is lost at the interior of cohesive MKC colonies and is maintained in cells at the colony periphery in response to differentiation. Examples of XZ and YZ confocal sections of individual nuclei and corresponding Z-intensity profiles measured in the region of interest, indicated by the white box (left). Intensity profiles were fit to two gaussians (right), representing staining of the apical and basal sides of the nuclear envelope. The intensity of antibody staining was defined as the area under the curve of the gaussian distribution corresponding to each side of the nuclear envelope. A ratio of the intensity of antibody staining of the basal relative to the apical side of the nuclear envelope was calculated. This analysis revealed that tension on the basal nuclear surface is relaxed at the colony interior relative to the colony periphery. Scale bar = 5 μm. (E) A histogram of the ratio of basal to apical intensity calculated as described in (C) for all cells analyzed (n = 47 for periphery and n = 28 for interior) shows that the ratio of basal to apical intensity for interior cells is shifted to higher values relative to cells at the periphery, indicating the lamina is under less tension. Values were binned every 0.05 arbitrary units, and the central value of each bin is labeled. Representative images for the low (magenta triangle) and high (blue triangle) bins, and bins corresponding to the highest percentage of periphery (yellow triangle) and interior (green triangle) are shown in (C). (F, G) The differentiation marker Sprr1b is expressed at higher levels in the colony interior than at the colony periphery. (F) Representative image of RNA fluorescence in situ hybridization for Sprr1b 24 hr after addition of calcium to induce differentiation. Inset 1 shows Sprr1b-positive cells at the colony interior. Inset 2 shows Sprr1b-positive and -negative cells at the colony periphery. Dotted lines are colony outline. Scale bar = 100 μm. (G) Quantitation of the percent of Sprr1b-positive cells that are located at the interior and periphery of WT MKC colonies normalized to the total Sprr1b-positive cells. 24h: 24 hr calcium treatment; 48h: 48 hr calcium treatment. *p<0.05. **p<0.01 as determined by unpaired t-test. Error bars are SD. N = 3 biological replicates.
Figure 2—figure supplement 1
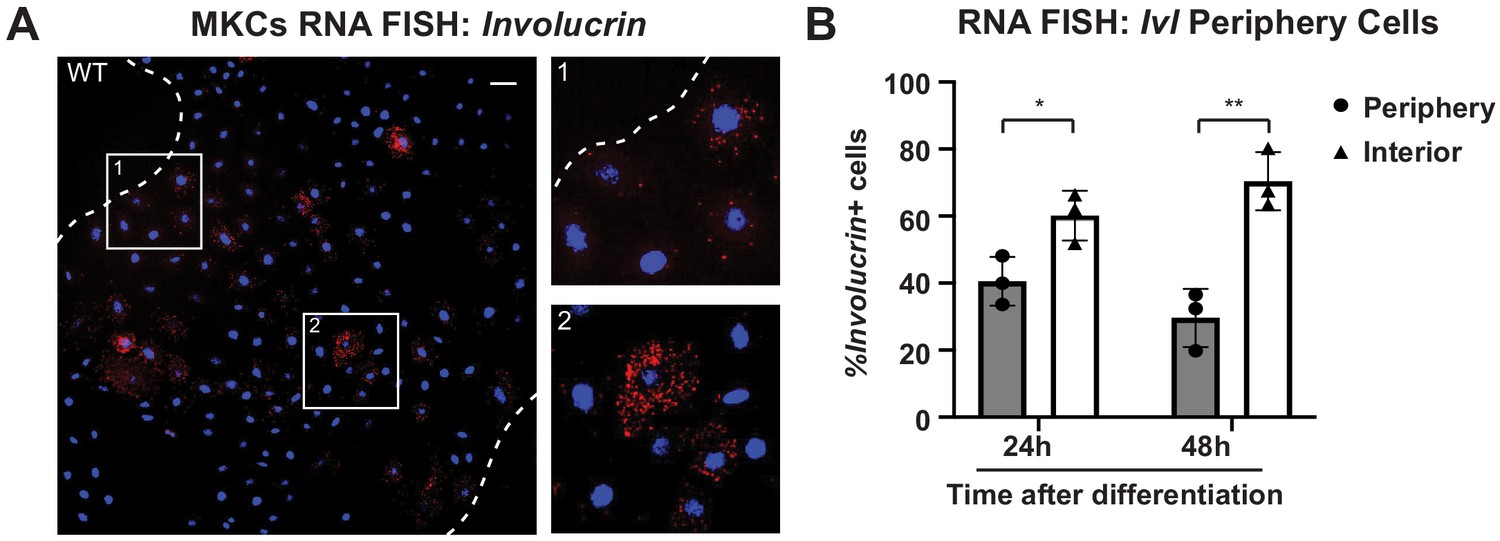
The differentiation marker involucrin (Ivl) is expressed at higher levels in the colony interior than at the colony periphery.
(A) Representative image of RNA fluorescence in situ hybridization in WT mouse keratinocytes (MKCs) for Ivl 24 hr after addition of calcium to induce differentiation. Inset 1 shows Ivl-positive cells at the colony interior. Inset 2 shows Ivl-positive cells at the colony periphery. Dotted lines are colony outline. Scale bar = 100 μm. (B) Quantitation of the percent of Ivl-positive cells that are located at the interior and periphery of WT MKC colonies normalized to the total Ivl-positive cells. 24h: 24 hr calcium treatment; 48h: 48 hr calcium treatment. Statistical significance determined by unpaired t-test. *p<0.05. **p<0.01. Error bars are SD. N = 3 biological replicates.
Figure 3 with 2 supplements
Linker of nucleoskeleton and cytoskeleton complex ablation leads to precocious epidermal differentiation in vivo.
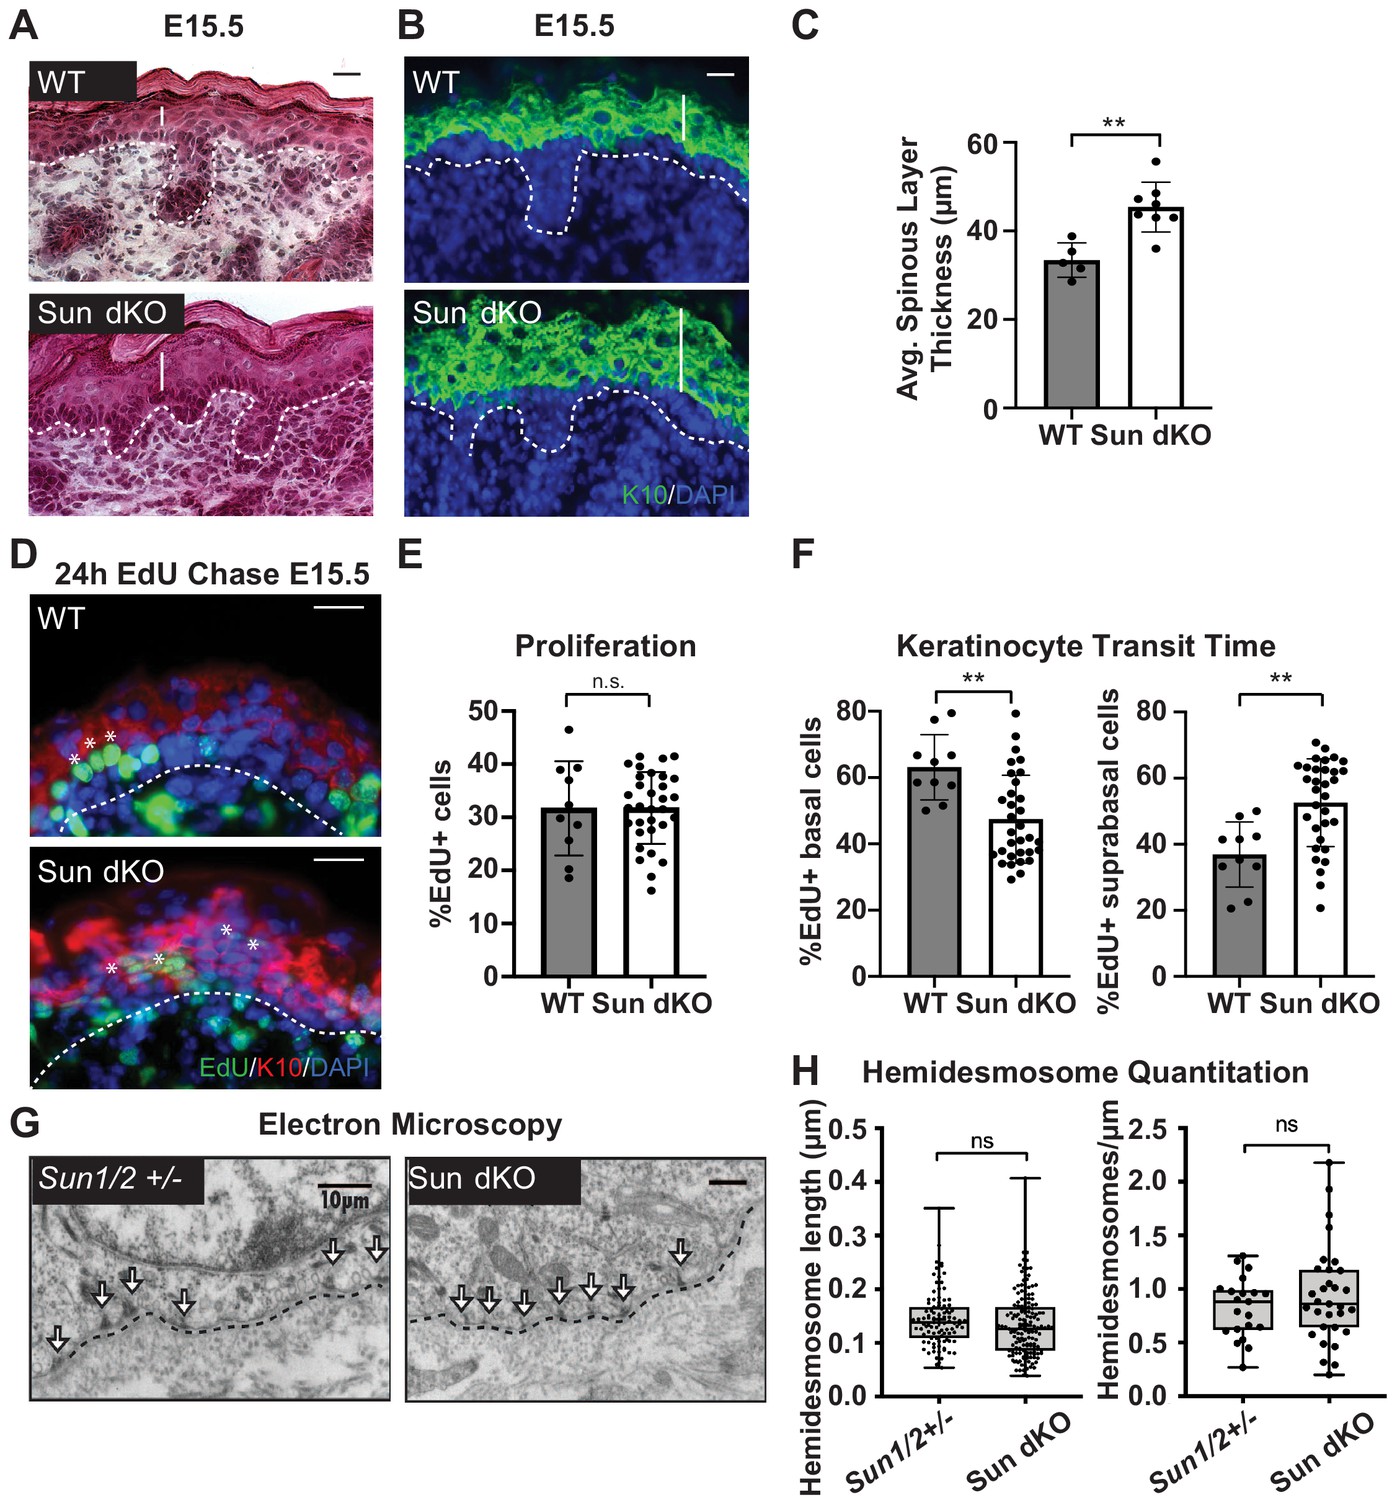
(A) Increased epidermal thickness in Sun dKO mice. Representative hematoxylin and eosin staining of WT and Sun dKO skin at age E15.5. Dotted line denotes dermal/epidermal junction. Vertical line denotes epidermal thickness. Scale bar = 20 μm. (B) Expansion of the spinous layer in Sun dKO mice. Representative immunostaining for keratin 10 (K10) in WT and Sun dKO skin at age E15.5. Dotted line denotes dermal/epidermal junction. Vertical line denotes spinous layer thickness. Scale bar = 20 μM. Nuclei are stained with DAPI. (C) Quantitation of average spinous layer thickness as determined by immunostaining for K10 in WT and Sun dKO epidermis at E15.5. Unpaired t-test was used to determine statistical significance. **p<0.01. Error bars are SD. N = 5–8 biological replicates per genotype. (D–F) Pulse chase analysis reveals an increase in EdU-positive cells in the suprabasal layers of Sun dKO mice (and a decrease in EdU-positive basal cells) but no increase in overall proliferation. (D) Representative images of E15.5 WT and Sun dKO skin 24 hr after EdU pulse. Spinous layer keratinocytes are marked by K10 staining. Dotted line denotes dermal/epidermal junction. Asterisks denote suprabasal keratinocytes marked with EdU. Scale bar = 20 μm. Nuclei are stained with DAPI. (E) Quantitation of total EdU-positive cells normalized to total epidermal cells in both WT and Sun dKO epidermis at E15.5. Statistical significance was determined using unpaired t-test. ns: not significant. N = 3 mice/genotype. (F) Quantitation of location of EdU-positive cells in the epidermis of E15.5 WT and Sun dKO epidermis 24 hr after EdU pulse. K10 staining was used to differentiate suprabasal from basal keratinocytes. Statistical significance was determined by performing unpaired t-test. **p<0.01. N = 3 mice/genotype. (G, H) Adhesion between basal keratinocytes and the basal lamina is normal in the Sun dKO skin. (G) Representative electron microscopy images of P0.5 WT and Sun dKO basal keratinocytes in vivo. Scale bar = 10 μm. Dotted line denotes basement membrane. Arrows point to hemidesmosomes. (H) Quantitation of hemidesmosome length (left) and the number of hemidesmosomes per surface area (right) in control and Sun dKO epidermis at age P0.5. ns: not statistically significant as determined by unpaired t-test.
Figure 3—figure supplement 1
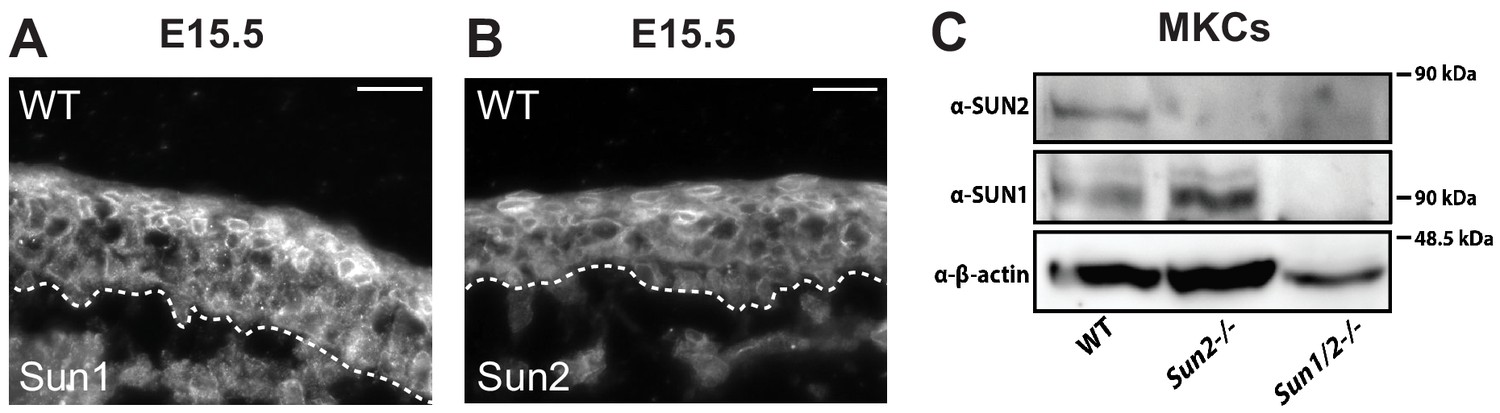
SUN1 and SUN2 are expressed throughout the epidermis.
(A, B) Representative immunostaining for proteins SUN1 (A) and SUN2 (B) in WT skin at age E15.5. Dotted line denotes dermal/epidermal junction. Scale bar = 20 μm. (C) Western blot analysis of WT, Sun2 -/- and Sun dKO primary keratinocytes confirming loss of SUN1 and SUN2 expression as expected. β-Actin was used as a loading control.
Figure 3—figure supplement 2
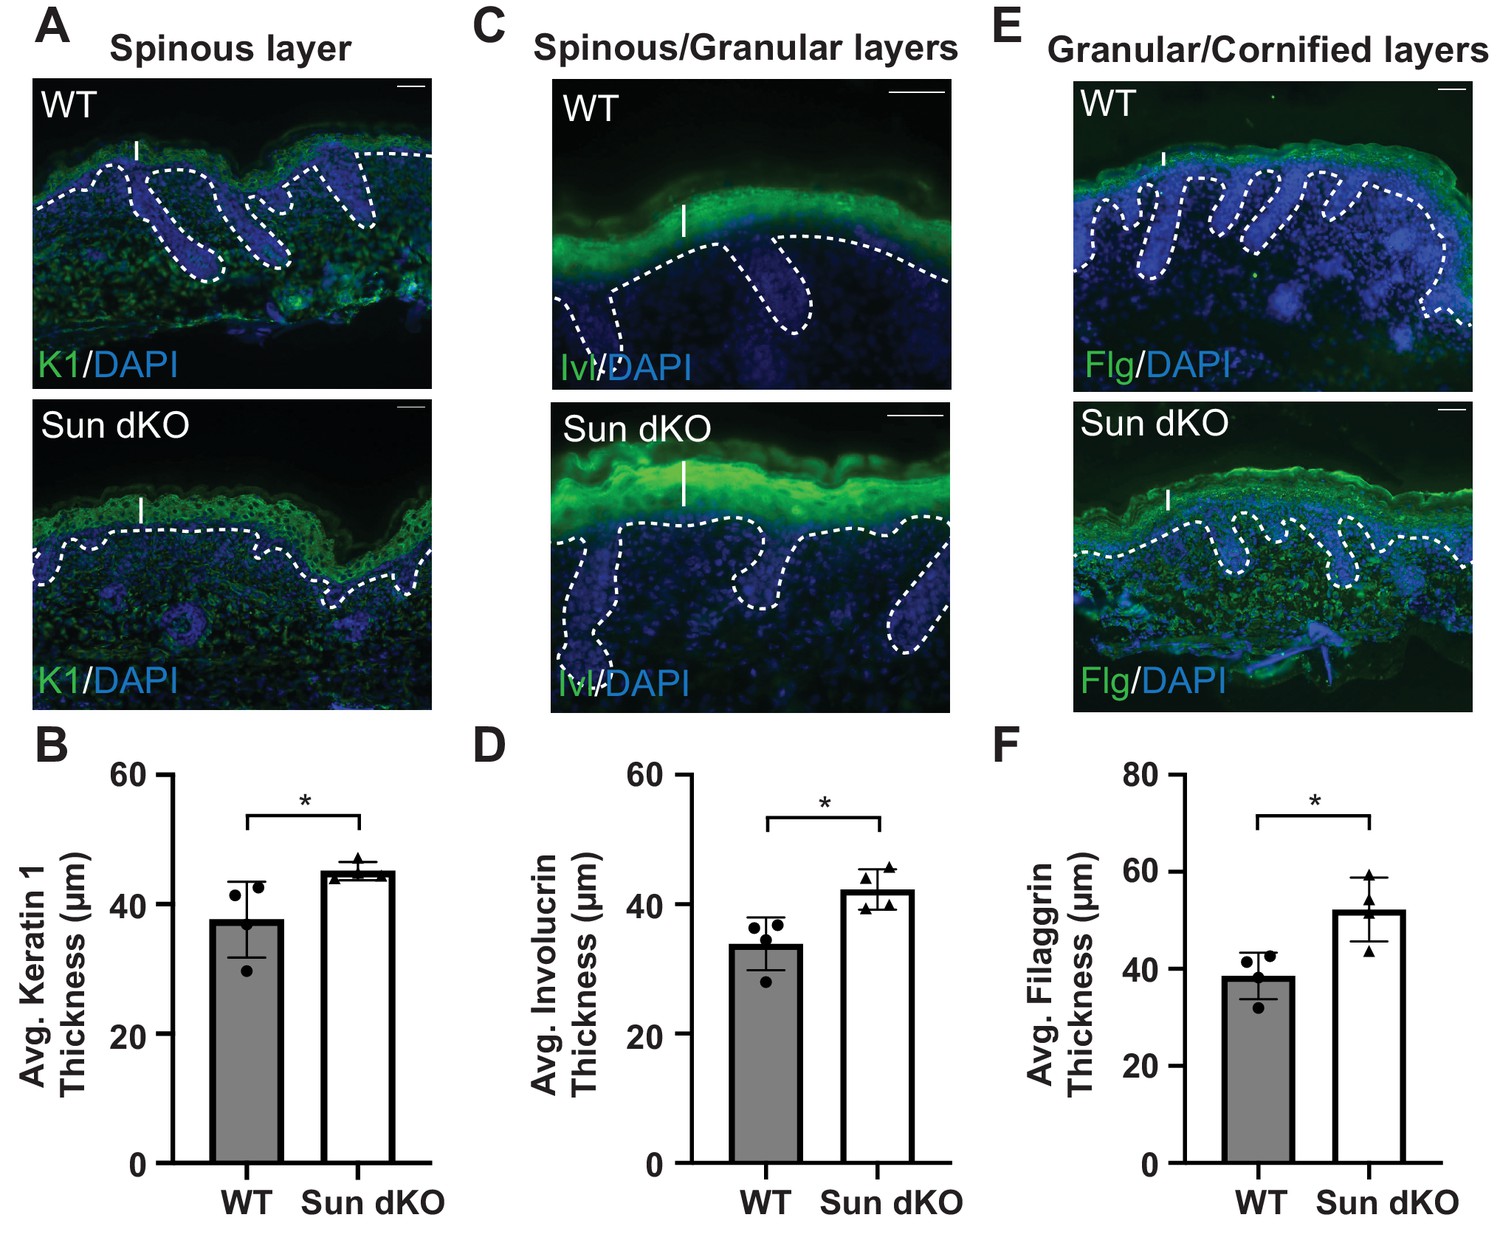
Thickening of the differentiated layers in the Sun dKO epidermis.
(A) Representative immunostaining for keratin 1 (K1), a marker of spinous keratinocytes, in WT and Sun dKO skin at age E15.5. Dotted line denotes dermal/epidermal junction. Vertical line denotes spinous layer thickness. Scale bar = 20 μm. Nuclei are stained with DAPI. (B) Quantitation of average spinous layer thickness as determined by immunostaining for K1 in WT and Sun dKO epidermis at E15.5. Unpaired t-test was used to determine statistical significance. **p<0.01. Error bars are SD. N = 4 biological replicates per genotype. (C) Representative immunostaining for involucrin (Ivl), a marker of spinous and granular keratinocyte layers, in WT and Sun dKO skin at age E15.5. Dotted line denotes dermal/epidermal junction. Vertical line denotes spinous layer thickness. Scale bar = 20 μm. Nuclei are stained with DAPI. (D) Quantitation of average spinous/granular layer thickness as determined by immunostaining for Ivl in WT and Sun dKO epidermis at E15.5. Unpaired t-test was used to determine statistical significance. **p<0.01. Error bars are SD. N = 4 biological replicates per genotype. (E) Representative immunostaining for filaggrin (Flg), a marker for granular and cornified keratinocyte layers, in WT and Sun dKO skin at age E15.5. Dotted line denotes dermal/epidermal junction. Vertical line denotes spinous layer thickness. Scale bar = 20 μm. Nuclei are stained with DAPI. (F) Quantitation of average granular/cornified layer thickness as determined by immunostaining for Flg in WT and Sun dKO epidermis at E15.5. Unpaired t-test was used to determine statistical significance. **p<0.01. Error bars are SD. N = 4 biological replicates per genotype.
Figure 4 with 2 supplements
Linker of nucleoskeleton and cytoskeleton complex ablation leads to precocious mouse keratinocyte (MKC) differentiation in vivo, which is associated with aberrant upregulation of differentiation markers at the colony periphery.
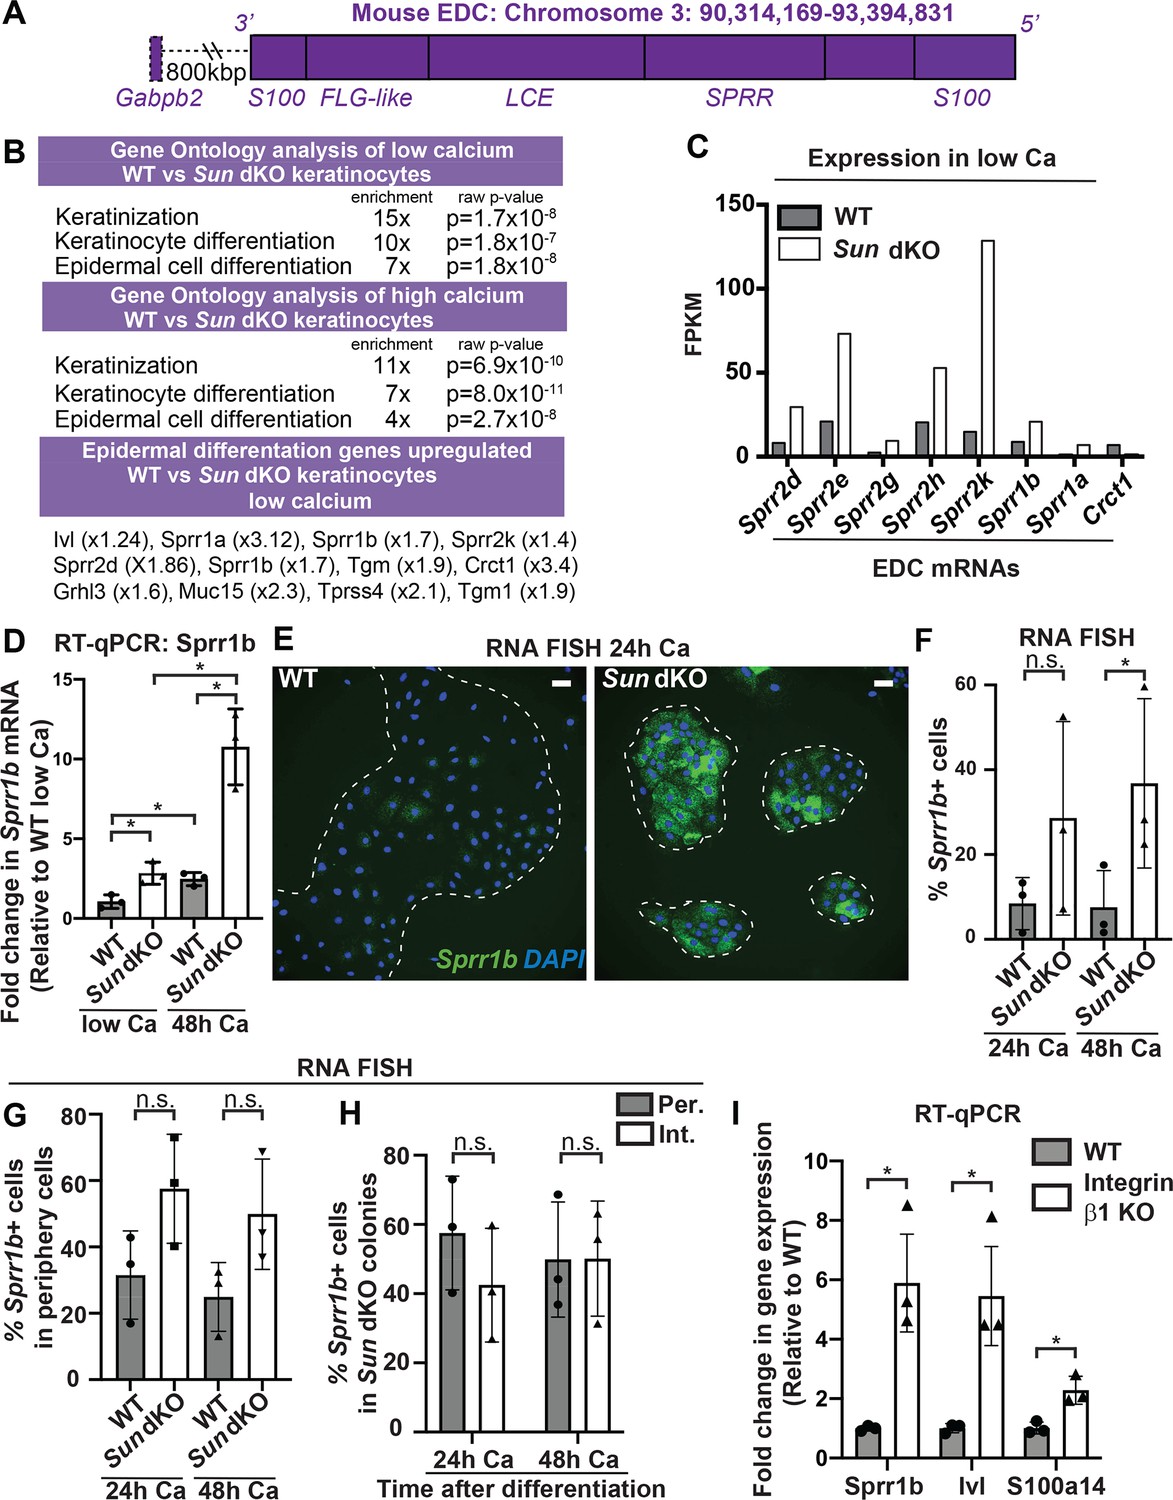
(A) Cartoon of the epidermal differentiation complex (EDC), a large genic region that is coordinately upregulated upon epidermal differentiation. (B) Comparative transcriptome analysis reveals that Sun dKO MKCs display precocious expression of epidermal differentiation genes when cultured in low calcium media and higher levels of expression of epidermal differentiation genes in high calcium media. See also Supplementary files 1 and 2. (C) Examples of EDC genes that are precociously expressed in Sun dKO MKCs cultured in low calcium media from the RNAseq data, expressed as fragments per kb of transcript per million reads. (D) Real-time qPCR analysis of Sprr1b in WT and Sun dKO MKCs in the presence and absence of calcium validates precocious Sprr1b expression in Sun dKO MKCs without calcium stimulation. Ct values were normalized to GAPDH. Fold change in expression was determined by calculating the 2ΔΔCt relative to the mean ΔCt of WT MKCs cultured in low calcium media. Statistical significance was determined by performing multiple t-tests. * p<0.05. The Holm–Sidak method was used to correct for multiple comparisons. Error bars are SD. N = 3 biological replicates. (E–G) Cohesive Sun dKO MKCs express elevated levels of differentiation markers and lose the relationship between position in the colony and EDC gene expression. (E) Representative images of RNA fluorescence in situ hybridization (FISH) for Sprr1b in WT and Sun dKO MKCs after 24 hr calcium treatment. Dotted lines are colony outline. Scale bar = 100 μm. (F) Quantitation of RNA FISH for Sprr1b in WT and Sun dKO MKCs after calcium treatment. Sprr1b-positive cells were counted and normalized to total cells in each field. 24h: 24 hr calcium treatment; 48h: 48 hr calcium treatment. Statistical significance was determined by performing unpaired t-test. *p<0.05. ns: not statistically significant. Error bars are SD. N = 3 biological replicates. (G) Quantitation of the percent of Sprr1b-positive cells that are located at the periphery of WT and Sun dKO MKC colonies normalized to the total Sprr1b-positive cells. 24 hr Ca: 24 hr calcium treatment; 48 hr Ca: 48 hr calcium treatment; ns: not statistically significant as determined by unpaired t-test. Error bars are SD. N = 3 biological replicates. (H) Quantitation of the percent of Sprr1b-positive cells that are located at the interior and periphery of Sun dKO MKC colonies normalized to the total Sprr1b-positive cells. 24h: 24 hr calcium treatment; 48h: 48 hr calcium treatment; ns: not statistically significant as determined by unpaired t-test. Error bars are SD. N = 3 biological replicates. (I) Real-time qPCR analysis of Sprr1b, involucrin (Ivl), and S100a14 demonstrate precocious differentiation in β1 integrin null (KO) MKCs. Ct values were normalized to GAPDH. Fold change in expression was determined by calculating the 2ΔΔCt relative to the mean of WT ΔCt. Statistical significance was determined by Student’s t-tests. *p<0.05. Error bars are SD. N = 3 biological replicates.
Figure 4—figure supplement 1
Additional evidence for precocious differentiation in Sun dKO mouse keratinocytes (MKCs).
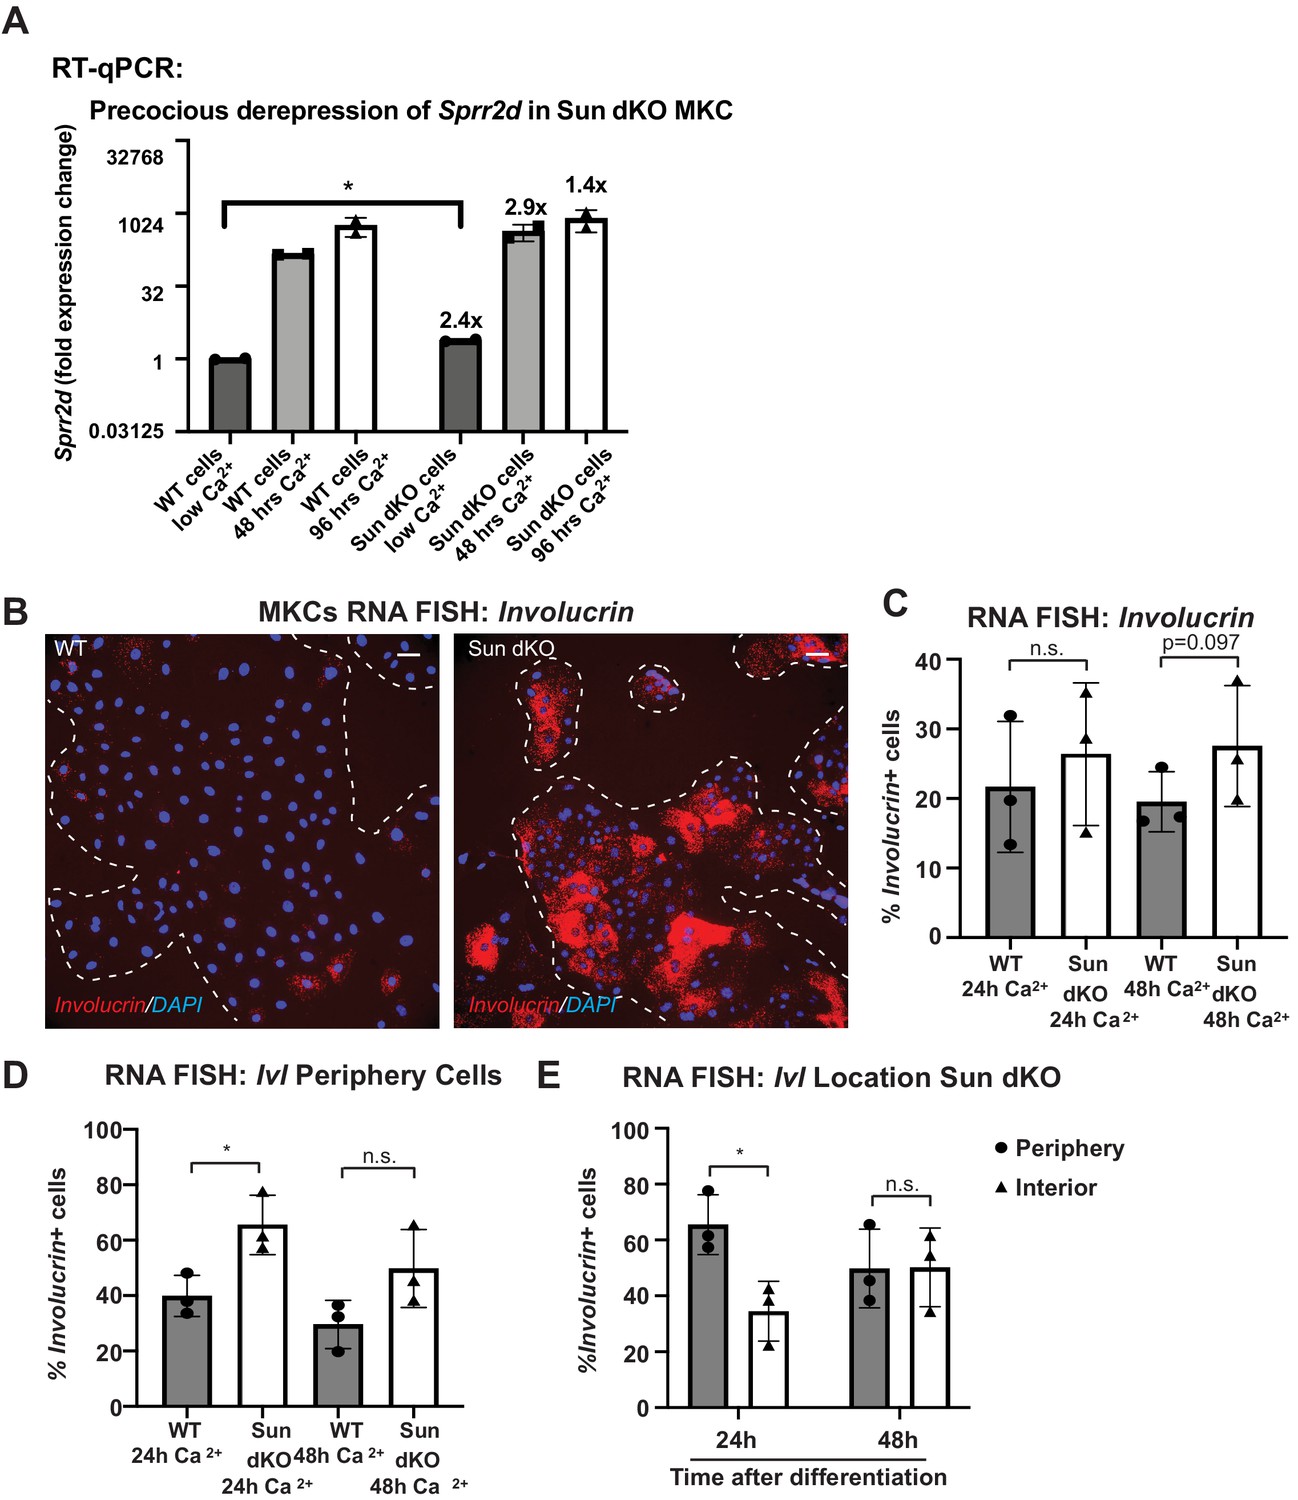
(A) Real-time qPCR demonstrating precocious expression of Sprr2b in Sun dKO MKCs. Fold change in expression was determined by calculating the 2ΔΔCt relative to the mean of WT no calcium ΔCt. n = 3 biological replicates for all conditions. Statistical significance was determined by performing multiple t-tests. *p<0.05. The Holm–Sidak method was used to correct for multiple comparisons. Error bars are SD. N = 2 biological replicates. (B) Representative images of RNA fluorescence in situ hybridization (FISH) for involucrin (Ivl) in WT and Sun dKO MKCs after 24 hr of calcium treatment. Dotted lines are colony outline. Scale bar = 100 μm. (C) Quantitation of RNA FISH for involucrin in WT and Sun dKO MKCs after calcium treatment. Involucrin-positive cells were counted and normalized to total cells in each field. 24h: 24 hr calcium treatment; 48h: 48 hr calcium treatment. Error bars are SD. N = 3 biological replicates. (D) Quantitation of the percent of involucrin-positive cells that are located at the periphery of WT and Sun dKO MKC colonies normalized to the total involucrin-positive cells. 24 hr Ca: 24 hr calcium treatment; 48 hr Ca: 48 hr calcium treatment. Error bars are SD. N = 3 biological replicates. (E) After 48 hr, Sun dKO MKCs fail to display a bias in involucrin expression toward the colony interior (as seen in WT MKCs; Figure 2—figure supplement 1B). Statistical significance was determined by paired t-test in (C–E).
Figure 4—figure supplement 2

Cohesive Sun dKO mouse keratinocyte (MKC) colonies have focal adhesions at the colony periphery.
Representative images of WT and Sun dKO MKCs cultured in calcium for 48 hr, fixed and stained with anti-paxillin antibodies. DNA was stained with Hoechst 33342. Scale bar = 25 μm.
Figure 5 with 2 supplements
Linker of nucleoskeleton and cytoskeleton complex ablation leads to an increase in chromatin accessibility of genes residing in the epidermal differentiation complex (EDC).
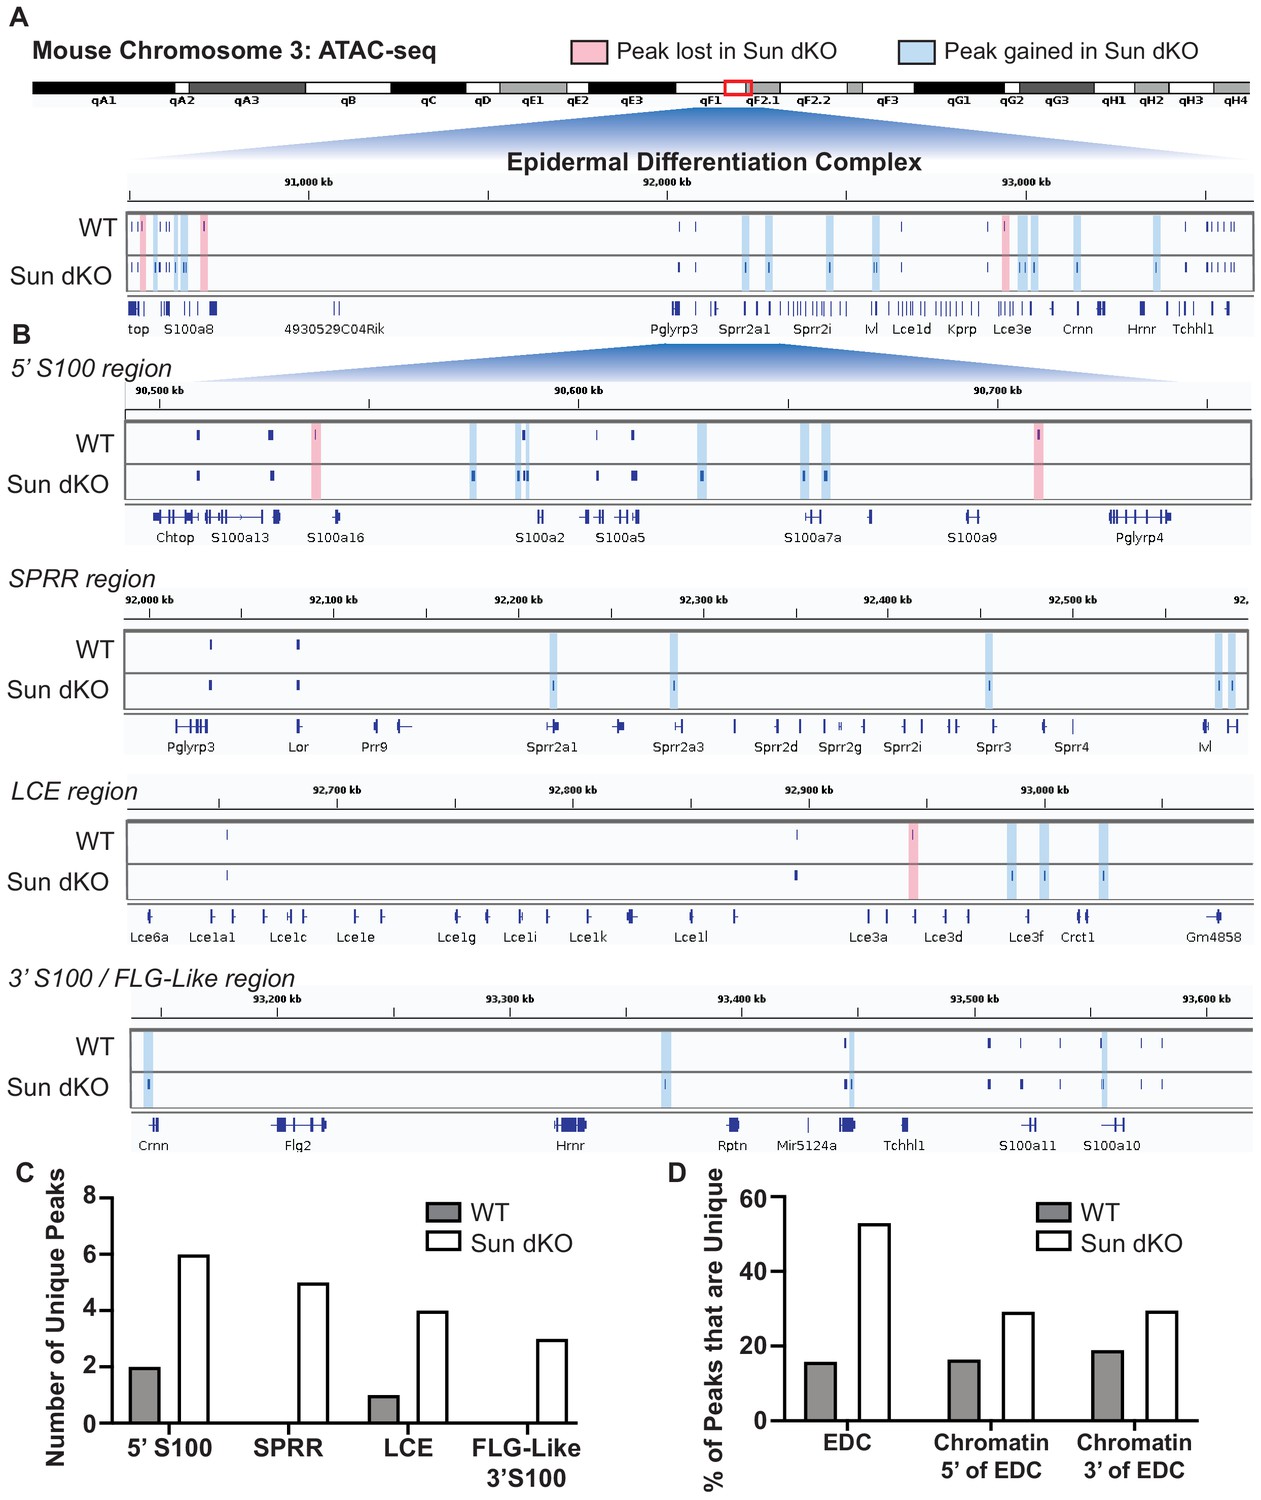
Assay for transposase-accessible chromatin using sequencing (ATAC-seq) tracks generated from either WT (top; N = 2) or Sun dKO (bottom; N = 2) mouse keratinocytes (MKCs) grown in low calcium media. (A) There is an increase in the number of accessible peaks (n = 38) within the EDC in Sun dKO MKCs compared to WT MKCs (n = 19). Peaks gained in Sun dKO MKCs are highlighted in blue, and peaks lost are highlighted in red. Unchanged peaks are not highlighted. (B) Expanded view of ATAC-seq peaks in each indicated region of the mouse EDC. Peaks gained in Sun dKO MKCs are highlighted in blue, and peaks lost are highlighted in red. Unchanged peaks are not highlighted. (C) Quantitation of novel ATAC-seq peaks in WT and Sun dKO MKCs. The number of unique peaks over the indicated regions is plotted for the two genotypes. (D) Quantitation of the percentage of total ATAC-seq peaks that are novel in WT and Sun dKO MKCs for the EDC and surrounding chromatin regions (ATAC-seq tracks in Figure 5—figure supplement 1). While a trend toward gains in ATAC-seq peaks is observed in Sun dKO MKCs, the gain of novel peaks at the EDC is more pronounced than in equivalently sized chromatin regions 5′ and 3′ to the EDC. See also Supplementary file 3.
Figure 5—figure supplement 1
Assay for transposase-accessible chromatin using sequencing (ATAC-seq) analysis of WT and Sun dKO mouse keratinocytes (MKCs).
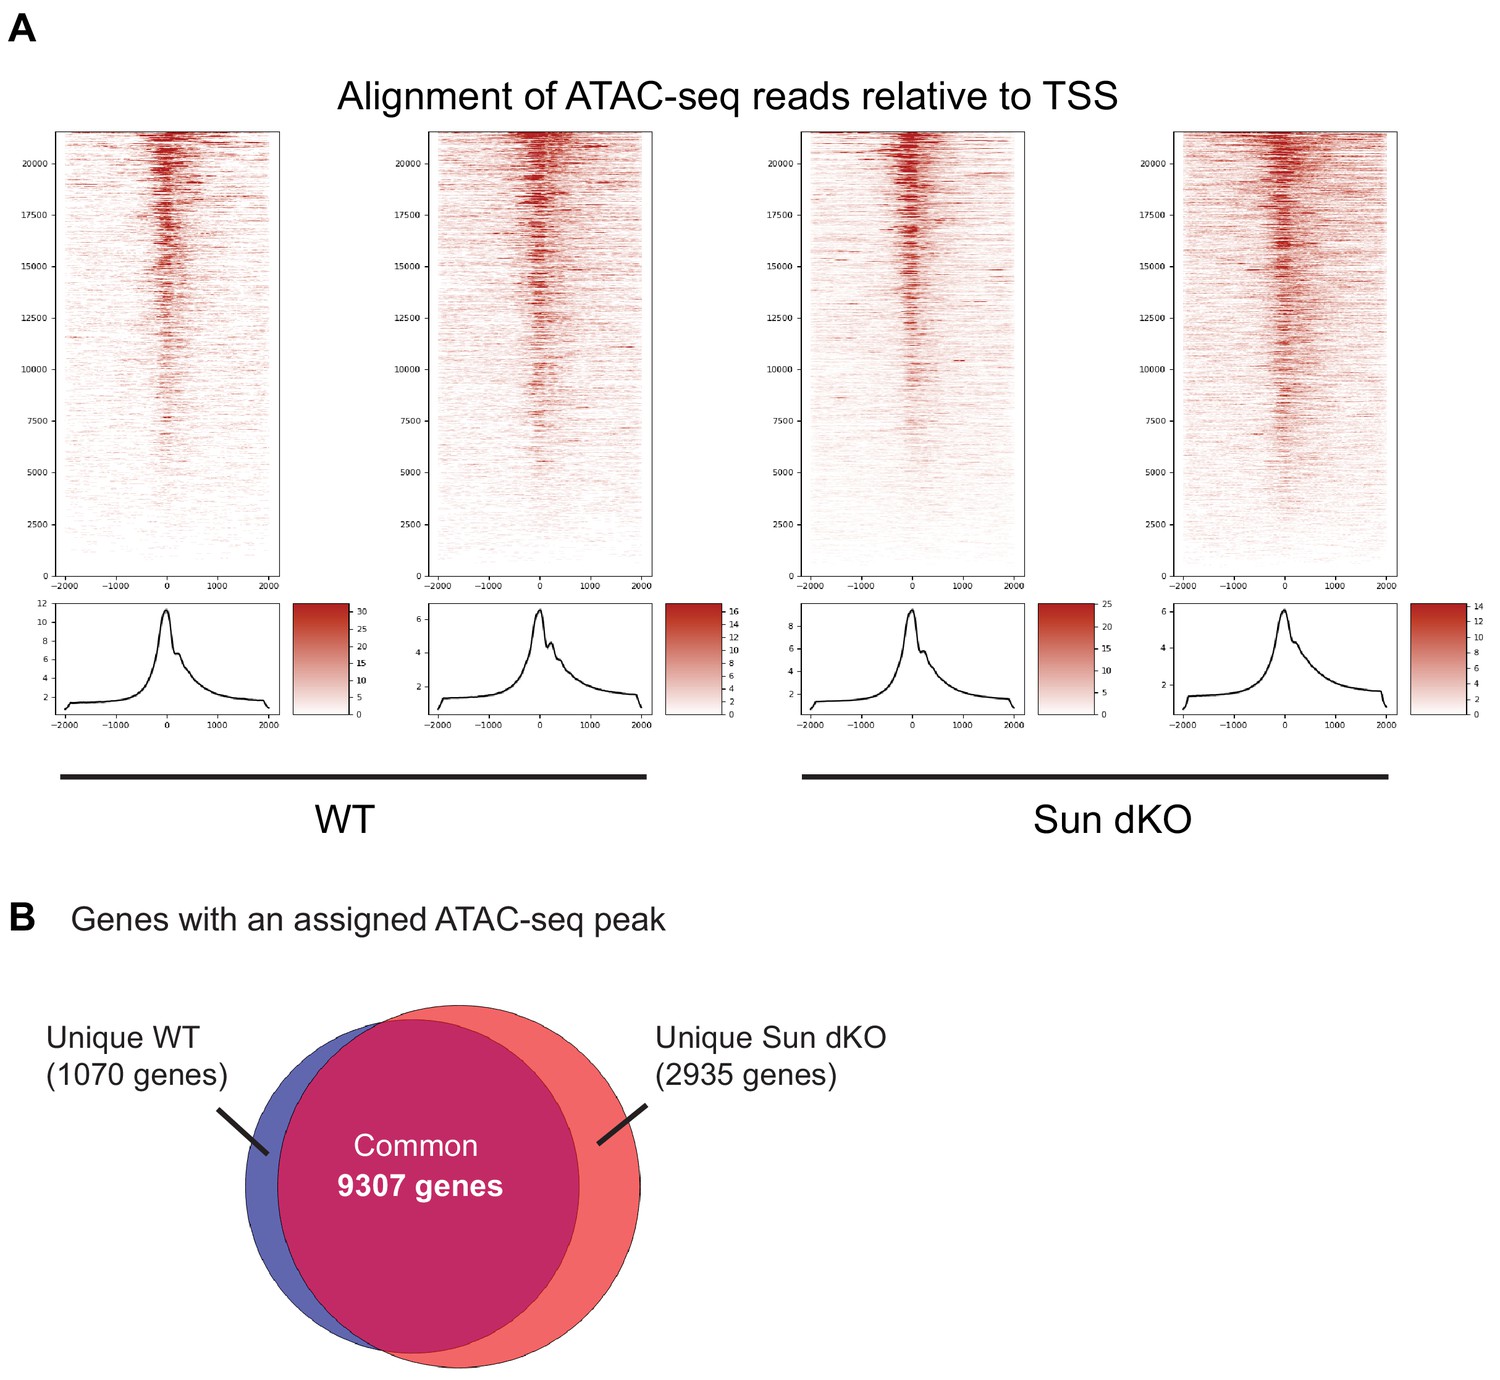
(A) Both replicates of WT and Sun dKO MKCs cultured in low calcium media demonstrate enrichment of ATAC-seq peaks with transcriptional start sites (TSSs) (greater than sixfold). See also Supplementary file 3. (B) Most ATAC-seq peaks (9307) are shared between WT and Sun dKO MKCs cultured in low calcium media, with a greater number of unique peaks in Sun dKO MKCs (2935) compared to unique peaks in WT MKCs (1070). See also Supplementary file 4.
Figure 5—figure supplement 2

Increased accessibility within the epidermal differentiation complex (EDC) is specific as assessed by the assay for transposase-accessible chromatin using sequencing (ATAC-seq) in Sun dKO mouse keratinocytes (MKCs) cultured in low calcium media.
(A) Tracks generated from either WT (top; n = 2) or Sun dKO (bottom; n = 2) MKCs cultured in low calcium media at equivalently EDC-sized genomic regions of chromatin directly 5′ (top) and 3′ (bottom) to the EDC. Peaks gained upon loss of SUN proteins are highlighted in blue, and peaks lost are highlighted in red. Unchanged peaks are not highlighted. (B) Example of a novel ATAC-seq peak within the promoter region of the Sprr2a3 gene in Sun dKO MKCs cultured in low calcium media, indicating increased chromatin accessibility of this region. (C) ATAC-seq revealed a closed chromatin state in both WT and Sun dKO MKCs cultured in low calcium media at most master transcription factors tied to other differentiation programs. Myod1 (muscle) and the HOX gene master transcription factors Hoxd10, Hoxb13, and Hoxa11 and at two of four neuronal master transcription factors (Olig2 and Neurog1) show no changes between WT and Sun dKO MKCs. Two additional neuronal master transcription factors (Olig3 and Neurog2) revealed a novel peak in Sun dKO cells.
Figure 6
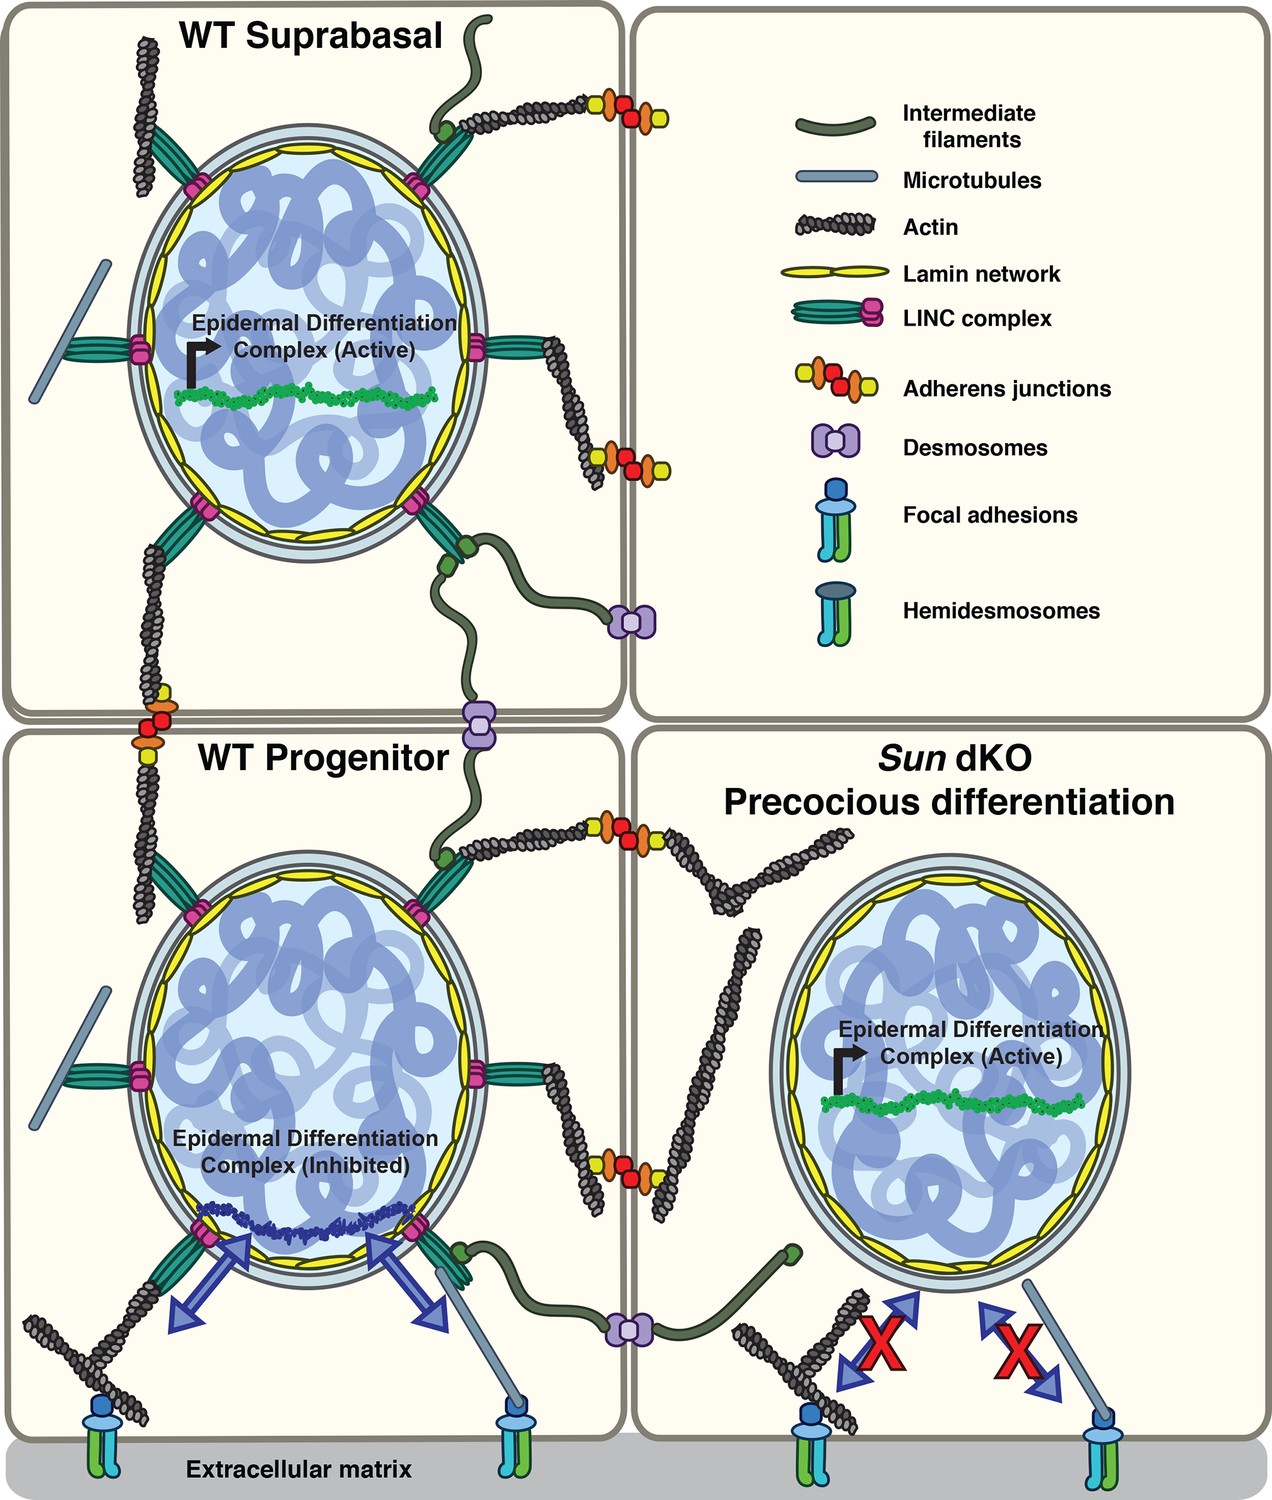
Model for the mechanism of precocious differentiation in the Sun dKO epidermis.
WT progenitor cells adhere to the basal lamina through integrins, leading to tension on linker of nucleoskeleton and cytoskeleton (LINC) complexes that is transmitted to the basal surface of the nuclear lamina to maintain repression of the epidermal differentiation complex (EDC). As cells move into the suprabasal layer, they lose integrin engagement. In suprabasal cells that only engage cell-cell junctions, LINC complexes and the nuclear lamina are relaxed, leading to upregulation of EDC gene expression. In the Sun dKO epidermis, tension from engaged integrins is not propagated to the nucleus in progenitor cells despite normal adhesion, leading to precocious expression of EDC genes.
Tables
Key resources table
| Reagent type (species) or resource | Designation | Source or reference | Identifiers | Additional information |
|---|---|---|---|---|
| Strain, strain background (Mus musculus) | WT C57Bl/6J | Jackson Laboratories, Bar Harbor, ME | Stock number 000664 | |
| Genetic reagent (M. musculus) | Sun1-/-/Sun2-/-(Sun dKO) | Jackson Laboratories, Bar Harbor, ME | B6;129S6-Sun1tm1Mhan/J Stock No: 012715 crossed to B6;129S6-Sun2tm1Mhan/J Stock No: 012716 | |
| Cell line (M. musculus) | Primary WT keratinocyte | This paper | Isolated from WT pups | |
| Cell line (M. musculus) | Primary Sun dKO keratinocyte | This paper | Isolated from Sun dKO pups | |
| Cell line (M. musculus) | Integrin β1 null keratinocyte | Bandyopadhyay et al., 2012 | ||
| Antibody | SUN1 antibody (rabbit monoclonal) | Abcam | ab124770 | IHC (1:1000) WB (1:100) |
| Antibody | SUN2 antibody (rabbit monoclonal) | Abcam | ab124916 | IHC (1:1000) WB (1:100) |
| Antibody | Keratin 10 antibody (rabbit polyclonal) | Gift from Julia Segre (Harmon et al., 2013) | IHC (1:500) | |
| Antibody | Keratin 1 antibody (chicken polyclonal) | Gift from Julia Segre Harmon et al., 2013 | IHC (1:500) | |
| Antibody | Involucrin antibody (rabbit polyclonal) | Gift from Julia Segre Harmon et al., 2013 | IHC (1:500) | |
| Antibody | Filaggrin antibody (chicken polyclonal) | Gift from Julia Segre Harmon et al., 2013 | IHC (1:500) | |
| Antibody | β-Actin antibody (mouse monoclonal) | Abcam | ab13772 | WB: 1:1000 |
| Antibody | Conformationally sensitive Lamin A/C antibody | Abcam | ab8984 | IF: 1:200 |
| Recombinant DNA reagent | N2G-JM-TSMod (plasmid) | This paper | Constructed from pEGFP-C1 containing mini-Nesprin-2G (Luxton et al., 2010) | |
| Recombinant DNA reagent | N2G-JM-TSMod Dark Venus (plasmid) | This paper | Mutation in Venus Y67L | |
| Recombinant DNA reagent | N2G-JM-TSMod Dark mTFP (plasmid) | This paper | Mutation in mTFP Y72L | |
| Recombinant DNA reagent | NoT_TSMod (Plasmid) | This paper | Constructed from pEGFP-C1 containing N2G-JM-TSMod | |
| Sequence-based reagent | Involucrin RNA FISH probe | Thermo Fisher | VB1-3030396-VC | |
| Sequence-based reagent | Sprr1b RNA FISH probe | Thermo Fisher | VB4-3117172-VC | |
| Sequence-based reagent | GAPDH_F | This paper | qPCR primer | AGGTCGGTGTGAACGGATTTG |
| Sequence-based reagent | GAPDH_R | This paper | qPCR primer | TGTAGACCATGTAGTTGAGGTCA |
| Sequence-based reagent | Sprr1b_F | This paper | qPCR primer | GATCCCAGCGACCACAC |
| Sequence-based reagent | Sprr1b_R | This paper | qPCR primer | GCTGATGTGAACTCATGCTTC |
| Sequence-based reagent | Sprr2d_F | This paper | qPCR primer | GTGGGCACACAGGTGGAG |
| Sequence-based reagent | Sprr2d_R | This paper | qPCR primer | GCCGAGACTACTTTGGAGAAC |
| Sequence-based reagent | Involucrin_F | This paper | qPCR primer | GCAGGAGAAGTAGATAGAG |
| Sequence-based reagent | Involucrin_R | This paper | qPCR primer | TTAAGGAAGTGTGGATGG |
| Sequence-based reagent | S100a14_F | This paper | qPCR primer | GGCAGGCTATAGGACA |
| Sequence-based reagent | S100a14_R | This paper | qPCR primer | CCTCAGCTCCGAGTAA |
| Peptide, recombinant protein | Fibronectin | Sigma-Aldrich | F4759 | 50 μg/mL |
| Peptide, recombinant protein | Poly-L-lysine | Sigma-Aldrich | P9155 | 50 μg/mL |
| Peptide, recombinant protein | Laminin | Thermo Fisher | CB-40232 | 50 μg/mL |
| Chemical compound, drug | Latrunculin A | Cayman Chemical Company | 10010630 | 0.5 μM |
| Commercial assay, kit | ViewRNA ISH Cell Assay kit | Thermo Fisher | QVC0001 | |
| Commercial assay, kit | Click-iTEdU Cell Proliferation Kit for Imaging | Invitrogen | C10337 | Alexa Fluor 488 dye |
| Commercial assay, kit | RNeasy Plus mini kit | QIAGEN | 74134 | |
| Commercial assay, kit | TruSeq RNA sample preparation kit | Illumina | RS-122-2001 | |
| Commercial assay, kit | iScript cDNA synthesis kit | Bio-Rad | 1708890 | |
| Commercial assay, kit | SYBR Green Supermix | Bio-Rad | 170-8882 | |
| Commercial assay, kit | Nextera Library Prep Kit | Illumina | 15028212 | |
| Commercial assay, kit | MinElute PCR Purification Kit | QIAGEN | 28004 | |
| Software, algorithm | ImageJ /Fiji | National Institutes of Health | Version 1.50e | |
| Software, algorithm | GraphPad Prism 8.0 | GraphPad | Version 8.0 | |
| Software, algorithm | PixFRET ImageJ Plugin | Feige et al., 2005 | ||
| Software, algorithm | Gaussian fit | This paper | https://github.com/LusKingLab/GaussianFit; Carley, 2021; copy archived at swh:1:rev:09e7545145b4dbbcb67d284a004d780176620130 | |
| Software, algorithm | BowTie/TopHat2 | Kim et al., 2013 | ||
| Software, algorithm | DESeq2 | Love et al., 2014 | ||
| Software, algorithm | ENCODE ATAC-seq pipeline | The ENCODE Project Consortium, 2013 Kundaje Lab | Version 1.8.0 | https://github.com/ENCODE-DCC/atac-seq-pipeline |
| Other | Prolong Gold with DAPI | Invitrogen | P36935 | |
| Other | Sera-Mag Select Beads | GE | 29343052 | |
| Other | CY 52–276 | Dow Corning | 52-276 | To make 3 kPa hydrogels |
| Other | Gil 2 Haematoxylin | Richard Allan Scientific | Cat # 72504 | |
| Other | Eosin-Y Alcoholic | Richard Allan Scientific | Cat # 71204 | |
| Other | JetPrime | Polyplus transfection | 114-07 | Transfection reagent |
Additional files
-
Supplementary file 1
Table of RNAseq (Tab 1) and GO Term analysis (Tab 2) for Sun dKO versus WT mouse keratinocytes grown in low calcium media (undifferentiated).
- https://cdn.elifesciences.org/articles/58541/elife-58541-supp1-v3.xlsx
-
Supplementary file 2
Table of RNAseq (Tab 1) and GO Term analysis (Tab 2) for Sun dKO versus WT mouse keratinocytes grown in high calcium media (differentiated).
- https://cdn.elifesciences.org/articles/58541/elife-58541-supp2-v3.xlsx
-
Supplementary file 3
Quality control metrics for assay for transposase-accessible chromatin using sequencing (ATAC-seq) experiments.
- https://cdn.elifesciences.org/articles/58541/elife-58541-supp3-v3.xlsx
-
Supplementary file 4
Annotated genes that demonstrate differential chromatin accessibility between WT and Sun dKO mouse keratinocytes (MKCs) as assessed by assay for transposase-accessible chromatin using sequencing (ATAC-seq).
Tab 1 lists genes for which ATAC-seq peaks are present in WT but absent in Sun dKO MKCs, and Tab 2 lists genes for which ATAC-seq peaks are present in Sun dKO but absent in WT MKCs.
- https://cdn.elifesciences.org/articles/58541/elife-58541-supp4-v3.xlsx
-
Supplementary file 5
Focused analysis of assay for transposase-accessible chromatin using sequencing (ATAC-seq) changes between WT and Sun dKO mouse keratinocytes for additional epidermal differentiation genes and genes tied to proliferation of keratinocyte progenitors.
- https://cdn.elifesciences.org/articles/58541/elife-58541-supp5-v3.xlsx
-
Transparent reporting form
- https://cdn.elifesciences.org/articles/58541/elife-58541-transrepform-v3.pdf
Download links
A two-part list of links to download the article, or parts of the article, in various formats.
Downloads (link to download the article as PDF)
Open citations (links to open the citations from this article in various online reference manager services)
Cite this article (links to download the citations from this article in formats compatible with various reference manager tools)
The LINC complex transmits integrin-dependent tension to the nuclear lamina and represses epidermal differentiation
eLife 10:e58541.
https://doi.org/10.7554/eLife.58541


