The leukocyte non-coding RNA landscape in critically ill patients with sepsis
- Amsterdam UMC, University of Amsterdam, Center for Experimental Molecular Medicine, Amsterdam Infection & Immunity, Netherlands
- Amsterdam UMC, University of Amsterdam, Department of Clinical Epidemiology, Biostatistics and Bioinformatics, Netherlands
- Cologne Center for Genomics, University of Cologne, Germany
- Center for Molecular Medicine Cologne, University of Cologne, Germany
- Amsterdam UMC, University of Amsterdam, Department of Intensive Care Medicine, Netherlands
- Department of Intensive Care, University Medical Center Utrecht, Netherlands
- Department of Medical Microbiology, University Medical Center Utrecht, Netherlands
- Julius Center for Health Sciences and Primary Care, University Medical Center Utrecht, Netherlands
- Amsterdam UMC, University of Amsterdam, Division of Infectious Diseases, Netherlands
Figures
Figure 1 with 1 supplement
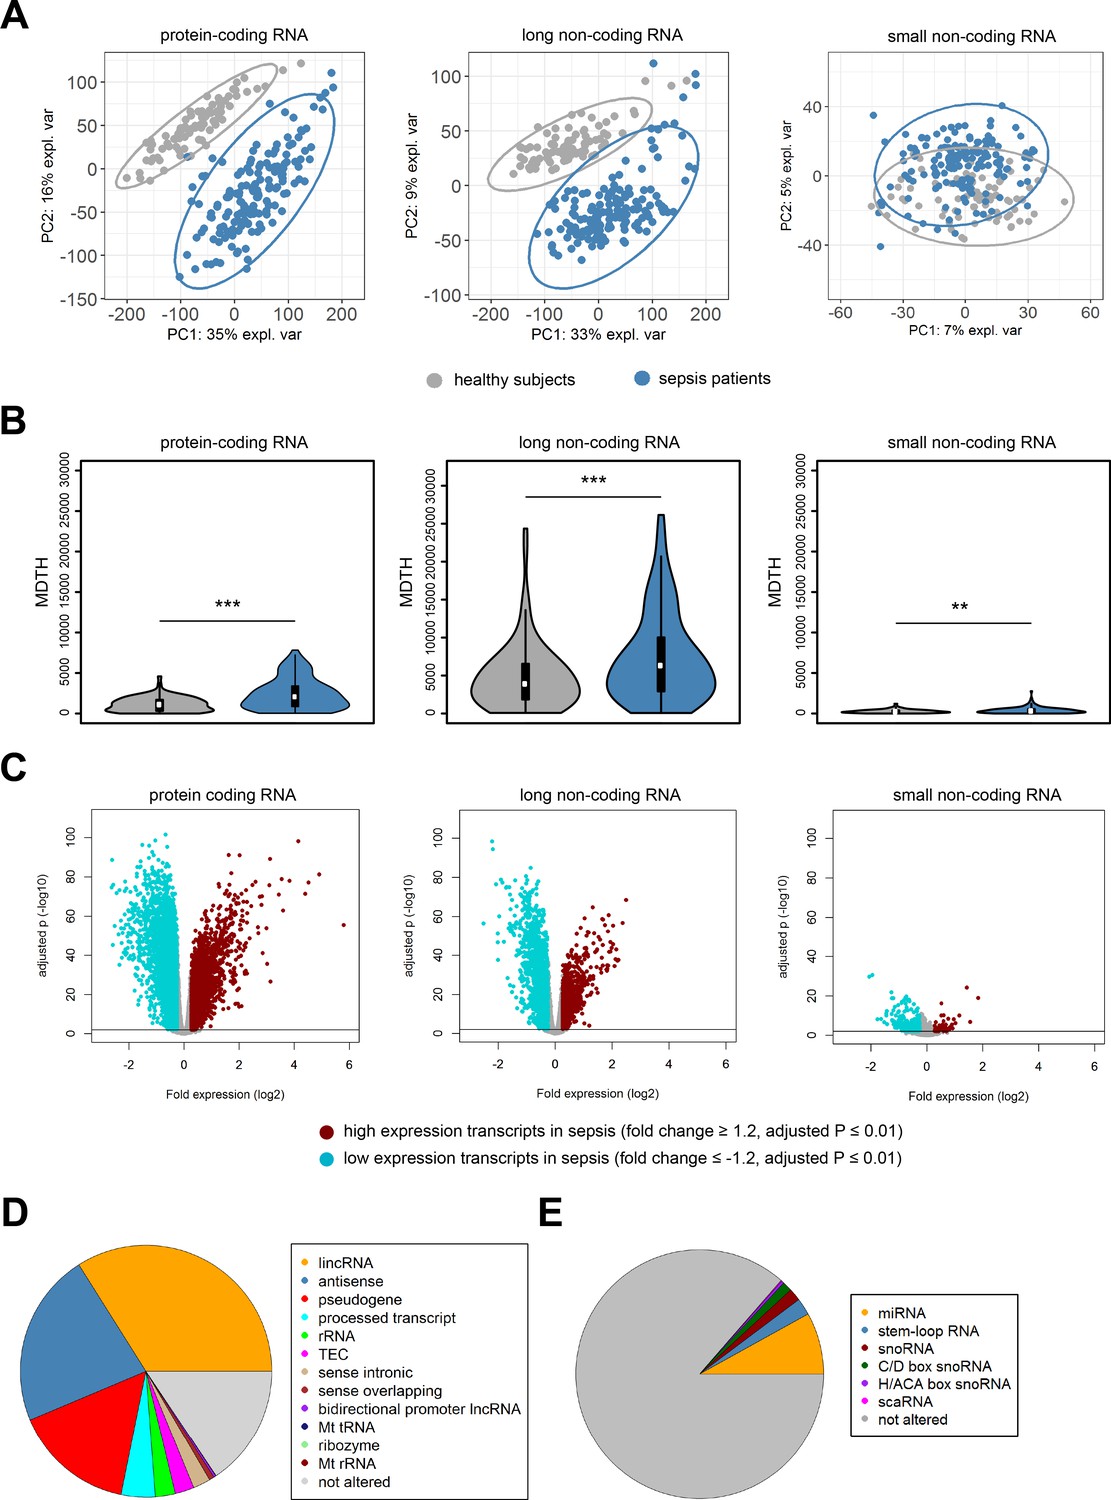
Coding and non-coding RNA expression in leukocytes of sepsis patients and healthy individuals.
(A) Principal component (PC) plot depicting PC1 and PC2, and (B) the molecular distance to health (MDTH) index of protein-coding (n = 18,063), long non-coding (n = 16,087), and small non-coding RNAs (n = 4949) in healthy subjects and sepsis patients. **p<0.01; ***p<0.001. (C) Volcano plot representation of differences in coding and non-coding RNA expression between sepsis patients and healthy subjects. Horizontal (black) line denotes −log10 transformed adjusted p-value of 0.01. (D) Pie chart showing the subclass distribution of significant long non-coding RNA (adjusted p<0.01). LincRNA, long intergenic non-coding RNA; rRNA, ribosomal RNA; TEC, to be experimentally confirmed; Mt tRNA, mitochondrial transfer RNA; Mt rRNA, mitochondrial ribosomal RNA. (E) Pie chart showing the subclass distribution of significant small non-coding RNA (adjusted p<0.01). miRNA, microRNA; snoRNA, small nucleolar RNA; C/D box snoRNA, C/D box small nucleolar RNA; H/ACA box snoRNA, H/ACA box small nucleolar RNA; scaRNA, small cajal body-specific RNA.
Figure 1—figure supplement 1
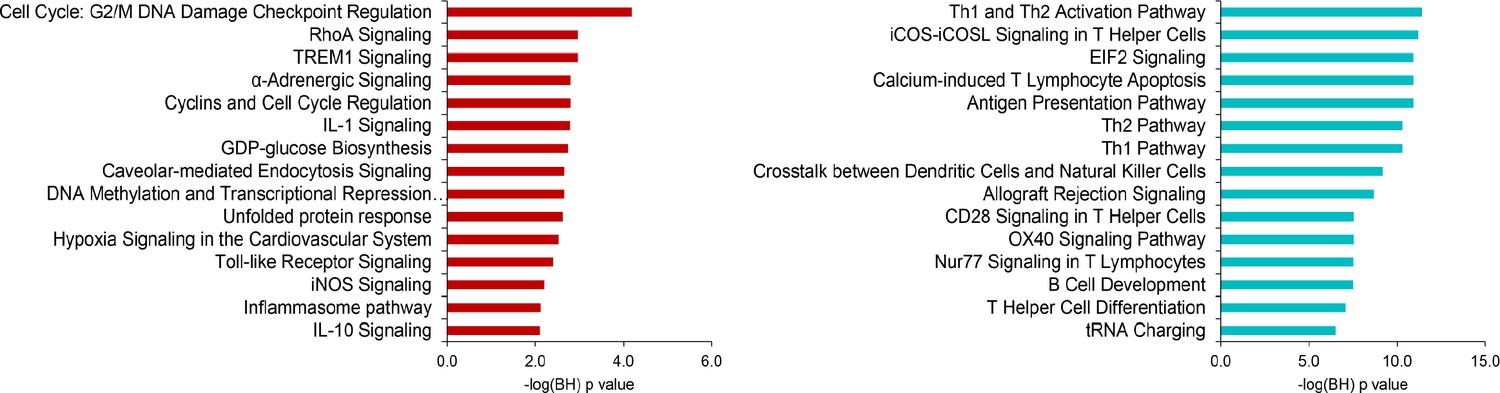
Ingenuity pathway analysis of significant protein-coding RNA in sepsis relative to health.
Red bars denote pathways harboring protein-coding RNA with elevated expression; turquoise bars denote pathways harboring protein-coding RNA with reduced expression. Significance was demarcated at Benjamini–Hochberg (BH) adjusted p<0.01. −log(BH) p, negative log-transformed BH p-value.
Figure 2 with 1 supplement
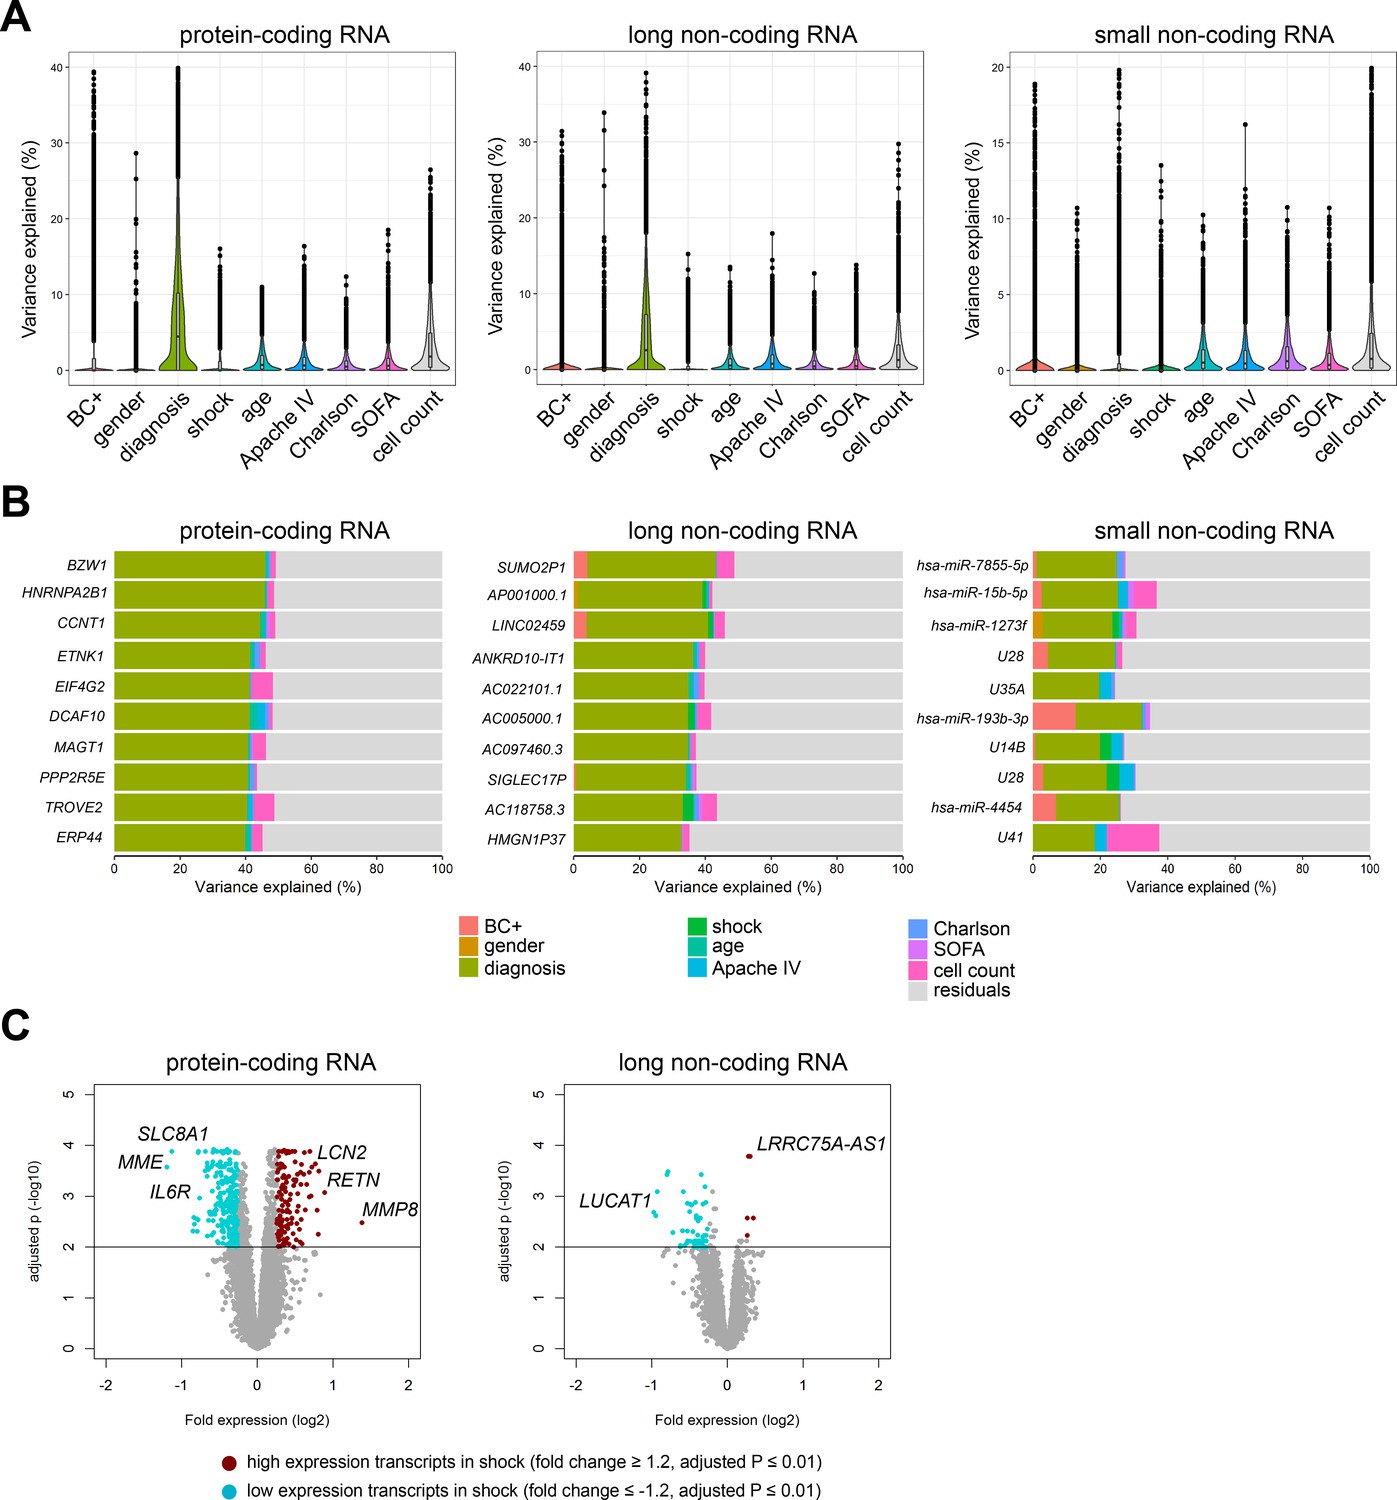
Variance in coding and non-coding RNA expression attributed to demographics and clinical characteristics of sepsis patients.
(A) Violin plots of percent variation in protein-coding, long non-coding, and small non-coding RNA expression explained by sepsis patient demographics and clinical variables. Black dots depict outlier RNA transcripts. (B) Percent variance of select protein-coding and long non-coding RNA partitioned into the segment attributable to each demographic and clinical variable ranked by percent variation (>20%) for primary diagnosis (site of infection and place of acquisition). (C) Volcano plots depicting the changes in protein-coding and long non-coding RNA in patients discordant for septic shock on ICU admission. Horizontal (black) line denotes the adjusted p-value threshold for significance (adjusted p≤0.01). Abbreviations: BC+, blood culture positive microbiology; diagnosis, infection site (lung or abdomen) and source (community or hospital); Charlson, Charlson comorbidity index; Apache IV, Acute Physiology and Chronic Health Evaluation; ICU, Intensive care unit; SOFA, Sequential Organ Failure Assessment.
Figure 2—figure supplement 1
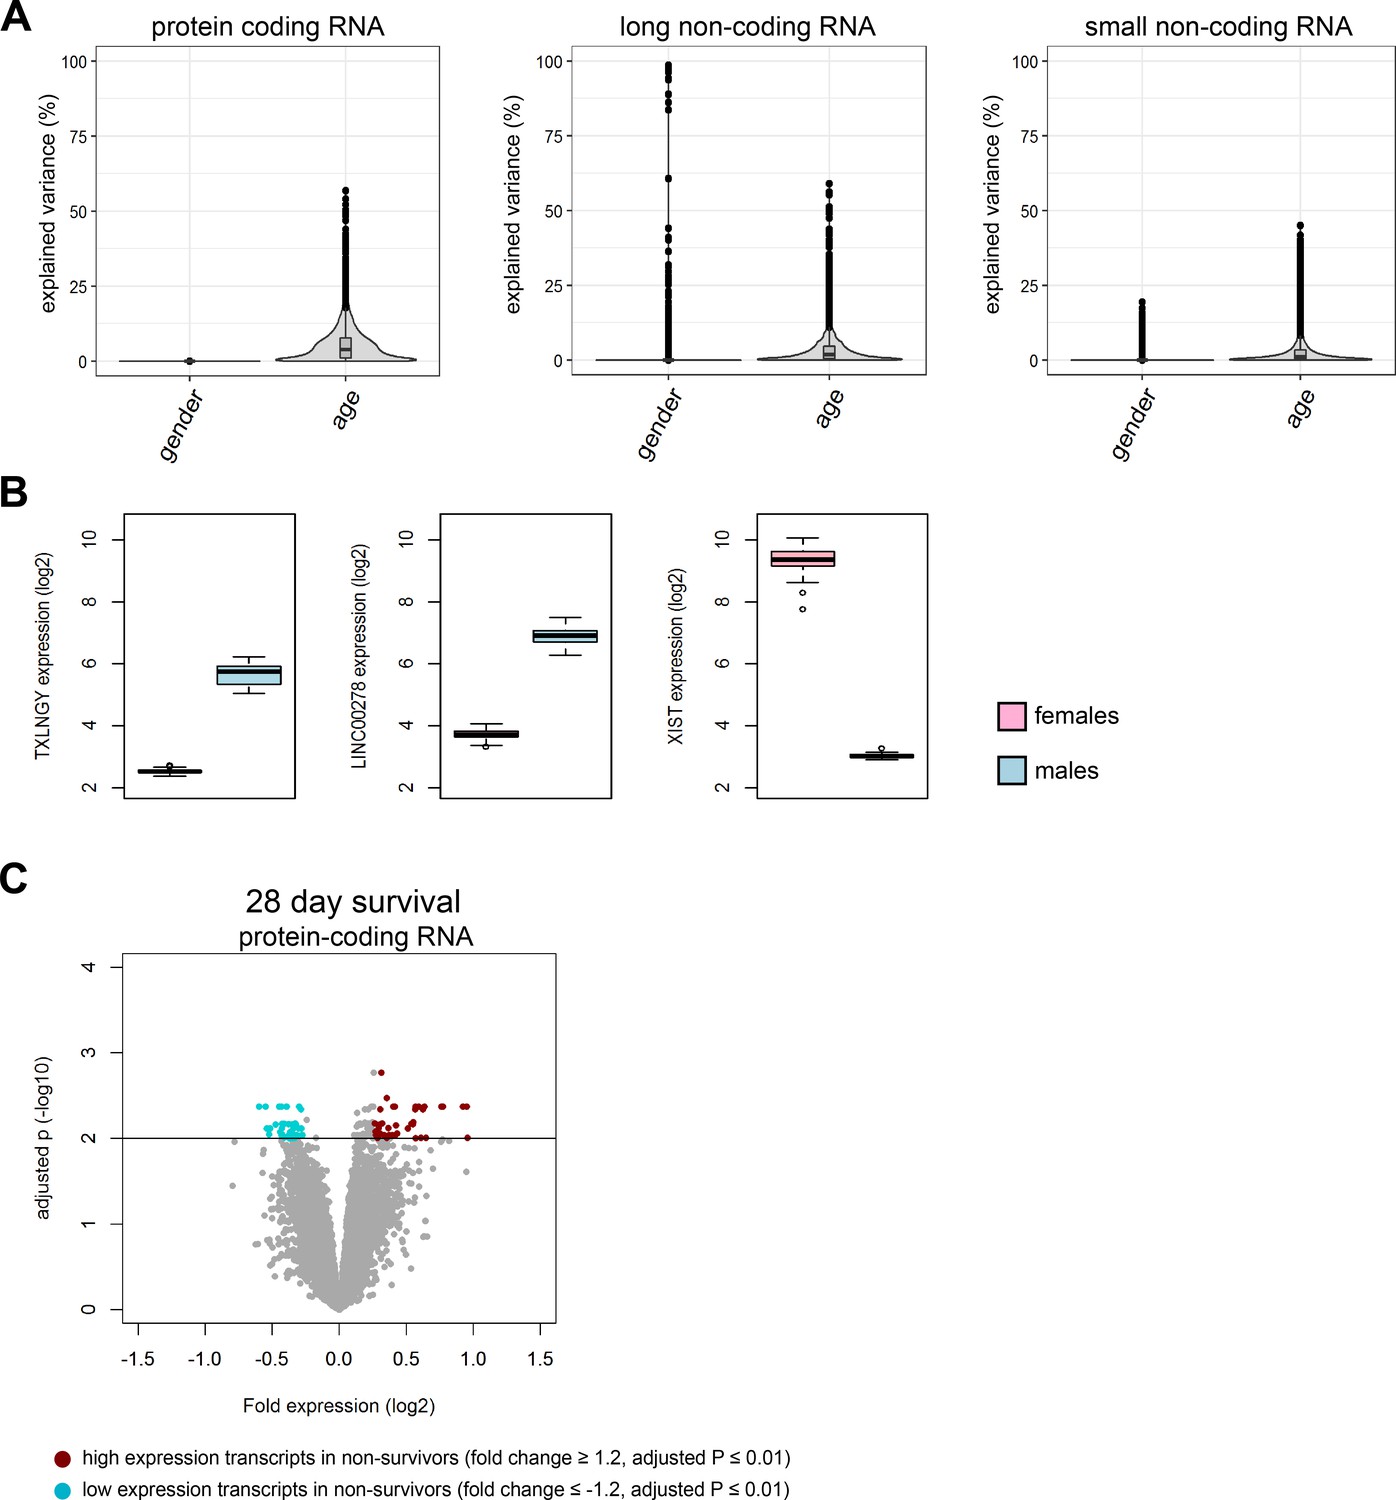
Variance partition of protein-coding and non-coding RNA expression in health and differential expression in sepsis non-survivors relative to survivors.
(A) Violin plots of percent variation in protein-coding, long non-coding, and small non-coding RNA expression explained by age in gender in healthy subjects (n = 82). Black dots depict outlier RNA. (B) Expression of long non-coding RNA TXLNGY, LINC00278, and XIST in healthy males and females. (C) Volcano plot of significantly altered protein-coding RNA in non-survivors relative to survivors after 28 days since ICU admission. Horizontal (black) line denotes −log10 transformed adjusted p-value thresholds.
Figure 3 with 2 supplements

Comparison of the coding and non-coding transcriptome in sepsis to human endotoxemia.
(A) Dot plots depicting the correlation between protein-coding RNA fold expression indices in sepsis (compared to health) and fold expression after 2, 4, 6, and 24 hr lipopolysaccharide (LPS) infusion relative to pre-LPS. (B) Pie chart illustrating the biotypes of significantly altered long non-coding RNA (adjusted p<0.01) across endotoxemia time points (2, 4, 6, and 24 hr after 2 ng/kg LPS). LincRNA, long intergenic non-coding RNA; rRNA, ribosomal RNA; TEC, to be experimentally confirmed; Mt tRNA, mitochondrial transfer RNA; Mt rRNA, mitochondrial ribosomal RNA. (C) Pie chart showing the biotypes of significantly altered small non-coding RNA (adjusted p<0.05) in human endotoxemia. miRNA, microRNA; snoRNA, small nucleolar RNA; C/D box snoRNA, C/D box small nucleolar RNA; H/ACA box snoRNA, H/ACA box small nucleolar RNA; scaRNA, small cajal body-specific RNA. (D) Dot plots illustrating the correlation between long non-coding RNA fold expression indices in sepsis (compared to health) and fold expression of 2, 4, 6, and 24 hr after LPS relative to pre-LPS. rho, Spearman’s coefficient. (E) Dot plots depicting the correlation between small non-coding RNA fold expression indices in sepsis (compared to health) and 2, 4, 6, and 24 hr after LPS relative to pre-LPS. rho, Spearman’s coefficient.
Figure 3—figure supplement 1

Comparing fold expression in sepsis (relative to health) to human endotoxemia.
(A) Volcano plot representation of significantly altered protein-coding RNA after 2, 4, 6, and 24 hr lipopolysaccharide (LPS) infusion relative to pre-LPS. Horizontal (black) line denotes −log10 transformed adjusted p-value threshold of 0.01. (B–D) Ingenuity pathway analysis of significant protein-coding RNA after 2, 4, and 6 hr human endotoxemia. Red bars denote pathways harboring protein-coding RNA with elevated expression; turquoise bars denote pathways harboring protein-coding RNA with reduced expression. Significance was demarcated at Benjamini–Hochberg (BH) adjusted p<0.01. Adjusted P, negative log-transformed BH p-value.
Figure 3—figure supplement 2
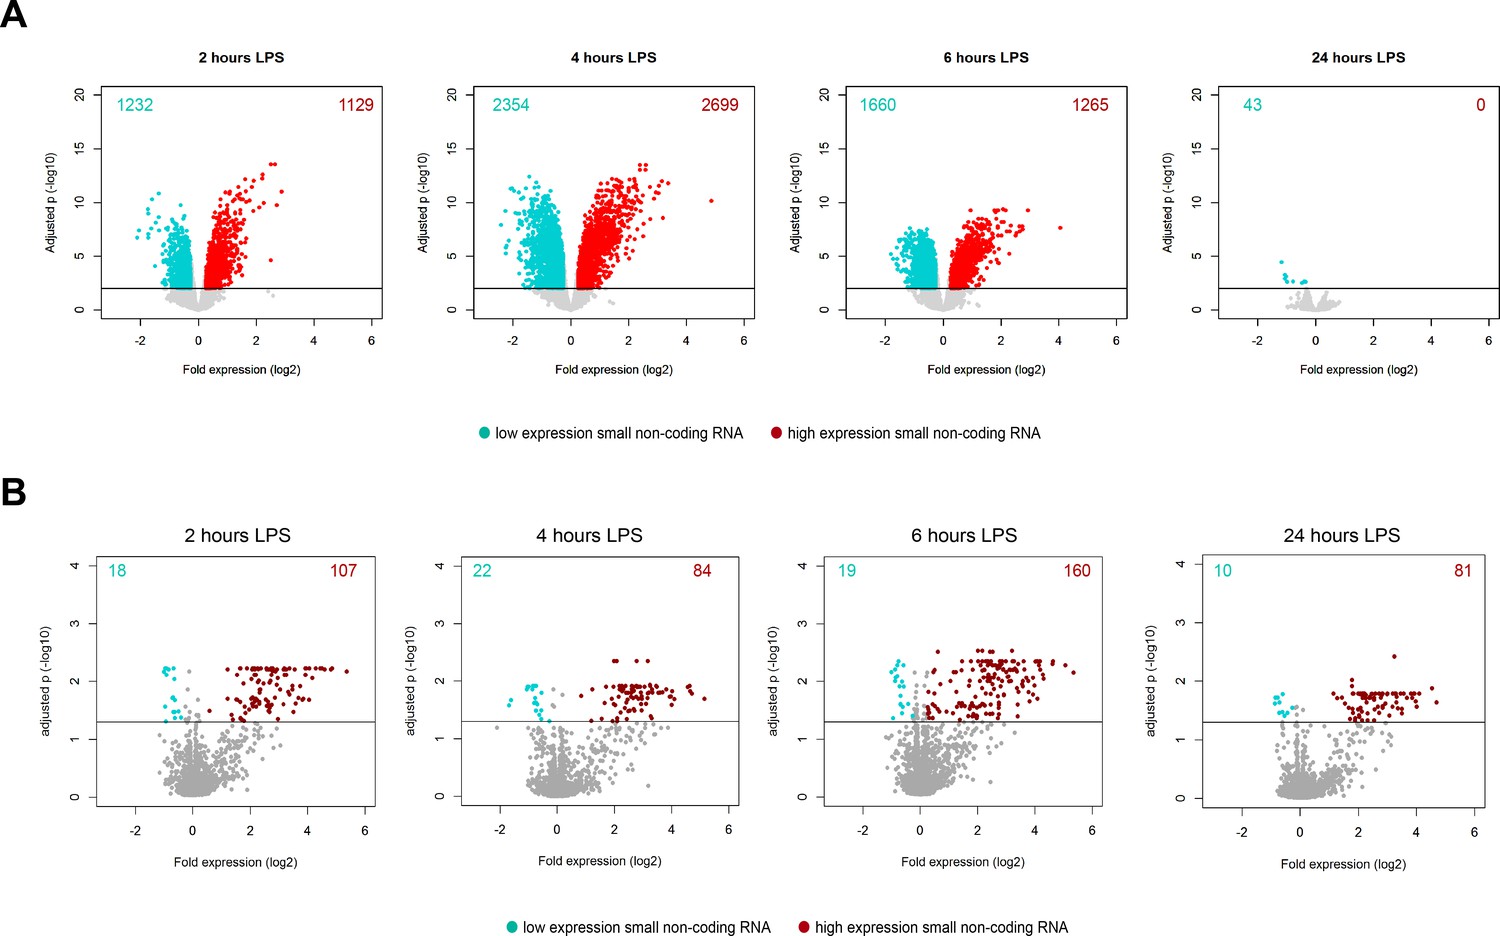
Volcano plot representations of significantly altered.
(A) Long non-coding RNA and (B) small non-coding RNA after 2, 4, 6, and 24 hr lipopolysaccharide (LPS) relative to pre-LPS. Horizontal (black) line denotes −log10 transformed adjusted p-value thresholds.
Figure 4 with 1 supplement
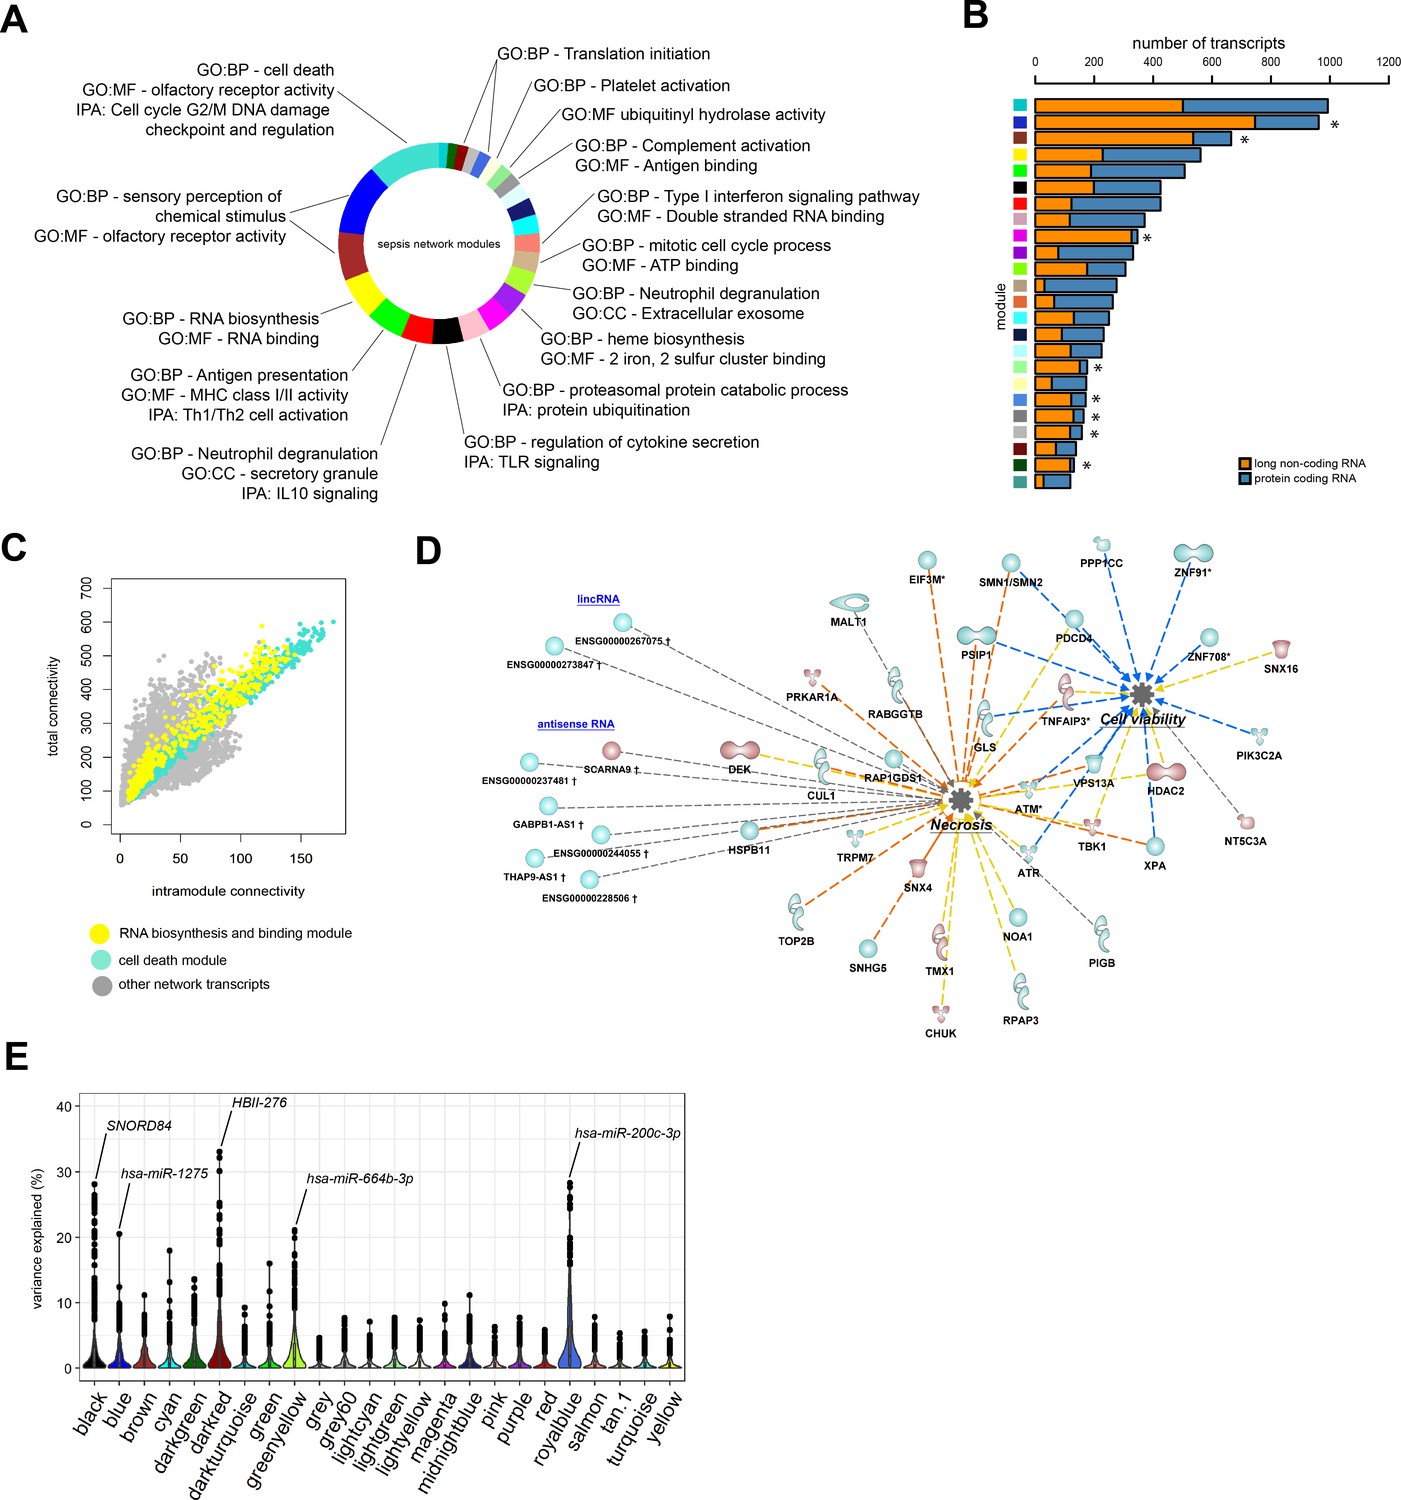
Network analysis of coding and non-coding RNA expression.
(A) Circular plot of protein-coding and long non-coding co-expression network modules characterized by significantly associated (Fisher’s adjusted p<0.01) gene ontologies and Ingenuity canonical signaling pathways. Seventeen modules were associated with specific ontologies or canonical signaling pathways. (B) Bar plot depicting the distribution of protein coding and long non-coding RNA in each network module. *Fisher’s Benjamini–Hochberg adjusted p<0.01. (C) Dot plot illustrating the correlation between intramodular and total connectivities of each RNA transcript in their respective network module. Yellow dots illustrate protein-coding and long non-coding RNA in the RNA biosynthesis/RNA binding module; Turquoise dots depict the cell death and olfactory receptor activity module. (D) Diagrammatic representation of Ingenuity’s biofunctions (z-score <2 or >2 and adjusted p<0.05) together with predicted long intergenic non-coding RNA (lincRNA) and antisense RNA in the cell death/olfactory receptor activity/cell-cycle G2/M DNA damage checkpoint and regulation module (turquoise). Blue, reduced expression; red, elevated expression in sepsis relative to health (fold change ≥1.2 or ≤−1.2; adjusted p-value<0.01). (E) Violin plots of network module eigengene (first principal component) percent variance attributable to small non-coding RNA.
Figure 4—figure supplement 1

Co-expression network analysis.
(A) Evaluation of scale free topology model fit and mean connectivities (y-axes) across various soft threshold powers (x-axis) with scale independence denoted at R2 > 0.85 (red horizontal line) for protein-coding and long non-coding RNA expression in sepsis patients (n = 8539). (B) Topological overlap plot of adjacencies calculated for 8539 protein-coding and long non-coding RNA expression and module colors. (C) Cytoscape plot (organic layout) of protein-coding and long non-coding RNA (nodes) and connectivities (edges; weight >0.2). Turquoise and yellow modules were visibly central to the co-expression network.
Figure 5

Relationship of protein-coding, non-coding RNA network modules to soluble mediators and clinical severity.
(A) Heatmap representation of Pearson correlation coefficients (adjusted p<0.05) calculated for each network module eigengene (first principal component) against soluble mediators of inflammation, endothelial function, coagulation, as well as clinical parameters of disease severity. APACHE IV, Acute Physiology and Chronic Health Evaluation; SOFA, Sequential Organ Failure Assessment. Red denotes direct correlations and blue denotes indirect correlations (B) Boxplot showing differences in neutrophil degranulation (red) module eigengene values in sepsis patients discordant for septic shock on intensive care unit admission. High module eigengene values mean overall elevated RNA expression; low module eigengene values mean reduced expression. (C) Diagrammatic representation of the neutrophil degranulation (secretory; red) module (Ingenuity’s biofunction z-score <2 or >2; adjusted p<0.05) together with predicted long intergenic non-coding RNA (lincRNA) and antisense RNA. Red or blue nodes denote high or low expression RNA transcripts in sepsis relative to health, respectively. ***Mann–Whitney p<0.001. (D and E) Dot plots of (D) MYOSLID expression and (E) LUCAT1 expression against soluble mediators of inflammation IL-6, IL-8, and IL-10, as well as the acute phase response protein CRP. Rho, Spearman’s coefficient.
Tables
Table 1
Baseline characteristics and outcomes of critically ill patients with sepsis.
| Parameter | Sepsis patients (n = 156) |
|---|---|
| Age, years | 62 (50 - 70) |
| Male sex | 98 (62.8) |
| White ethnicity | 140 (89.7) |
| Medical admission | 117 (75.0) |
| Immune suppression | 45 (28.8) |
| Cardiovascular insufficiency | 43 (27.6) |
| Malignancy | 45 (28.8) |
| Renal insufficiency | 18 (11.5) |
| Respiratory insufficiency | 37 (23.7) |
| Charlson comorbidity index | 4 (2 - 6) |
| APACHE IV score | 72 [58 - 92] |
| SOFA score | 7 (4 - 9) |
| Shock | 86 (55.1) |
| Mechanical ventilation | 128 (82.1) |
| Primary diagnosis | |
| Pneumonia | 99 (63.5) |
| Community-acquired | 68 (43.6) |
| Hospital-acquired | 31 (19.9) |
| Abdominal sepsis | 57 (36.5) |
| Outcome | |
| 28-day mortality | 48 (30.8) |
| 90-day mortality | 59 (37.8) |
| 1-year mortality | 77 (49.4) |
-
Data presented as median [Q1–Q3], or n (%).
Abbreviations: APACHE, Acute Physiology and Chronic Health Evaluation; ICU, Intensive care unit; GI, gastrointestinal; SOFA, Sequential Organ Failure Assessment.
-
Table 1—source data 1
Baseline characteristics and outcomes of critically ill patients with sepsis.
- https://cdn.elifesciences.org/articles/58597/elife-58597-table1-data1-v2.txt
Key resources table
| Reagent type (species) or resource | Designation | Source or reference | Identifiers | Additional information |
|---|---|---|---|---|
| Biological sample (Homo sapiens) | Total RNA | Leukocytes | ||
| Commercial assay or kit | PAXgene Blood miRNA kit | Qiagen | Cat no./ID: 763134 | |
| Commercial assay or kit | Human Transcriptome Array 2.0 | Affymetrix; Thermo Fisher | microarray | |
| Commercial assay or kit | miRNA 4.1 96-array plate | Affymetrix; Thermo Fisher | microarray | |
| Commercial assay or kit | FlexSet cytometric bead arrays | BD Biosciences | ||
| Commercial assay or kit | Immunoturbidimetric assay | Roche diagnostics | ||
| Commercial assay or kit | Luminex Flow Cytometry Analyzer | Luminex Corp. | RRID:SCR_018025 | |
| Commercial assay or kit | Sysmex CA-1500 System | Siemens Healthineers | ||
| Chemical compound, drug | Lipopolysaccharide- Escherichia coli, 100 ng/ml, Ultrapure | Invivogen | Cat#0111:B4 | |
| Software, algorithm | R Project for Statistical Computing, (version 3.5.0) | R Development Core Team | RRID:SCR_001905 | |
| Software, algorithm | Oligo (version 1.44) | Bioconductor (Carvalho and Irizarry, 2010) | RRID:SCR_015729 | |
| Software, algorithm | SVA (version 3.28) | Bioconductor (Leek and Storey, 2007) | RRID:SCR_012836 | |
| Software, algorithm | genefilter (version 1.62) | Bioconductor (Bourgon et al., 2010) | ||
| Software, algorithm | arrayQualityMetrics | Bioconductor (Kauffmann et al., 2009) | RRID:SCR_001335 | |
| Software, algorithm | Affymetrix Transcriptome Analysis Console | Affymetrix | RRID:SCR_018718 | |
| Software, algorithm | limma (version 3.36) | Bioconductor (Smyth, 2005) | RRID:SCR_010943 | |
| Software, algorithm | Ingenuity pathway analysis software | Qiagen | RRID:SCR_008653 | |
| Software, algorithm | WGCNA (version 1.64) | Bioconductor (Langfelder and Horvath, 2008) | RRID:SCR_003302 | |
| Software, algorithm | miR-Walk 2.0 | University of Heidelberg, Germany (Dweep et al., 2011) | ||
| Software, algorithm | variancePartition (version 1.10) | Bioconductor (Hoffman and Schadt, 2016) | ||
| Software, algorithm | mixOmics | Bioconductor (Rohart et al., 2017) | RRID:SCR_016889 | |
| Other | Deposited data super-series | Gene Expression Omnibus | GSE134364 |
Additional files
-
Supplementary file 1
Table of causative pathogens in critically ill patients with sepsis (n = 156).
Percentages depict the proportion of infections caused by the pathogen indicated. In total, 192 pathogens were assigned to 156 infections. In 40 (25.6%) infections, more than one pathogen was assigned as causative.
- https://cdn.elifesciences.org/articles/58597/elife-58597-supp1-v2.docx
-
Transparent reporting form
- https://cdn.elifesciences.org/articles/58597/elife-58597-transrepform-v2.pdf
Download links
A two-part list of links to download the article, or parts of the article, in various formats.
Downloads (link to download the article as PDF)
Open citations (links to open the citations from this article in various online reference manager services)
Cite this article (links to download the citations from this article in formats compatible with various reference manager tools)
The leukocyte non-coding RNA landscape in critically ill patients with sepsis
eLife 9:e58597.
https://doi.org/10.7554/eLife.58597


