The contribution of asymptomatic SARS-CoV-2 infections to transmission on the Diamond Princess cruise ship
- Centre for Mathematical Modelling of Infectious Diseases, Department of Infectious Disease Epidemiology, Faculty of Epidemiology and Population Health, London School of Hygiene and Tropical Medicine, United Kingdom
Figures
Figure 1 with 2 supplements
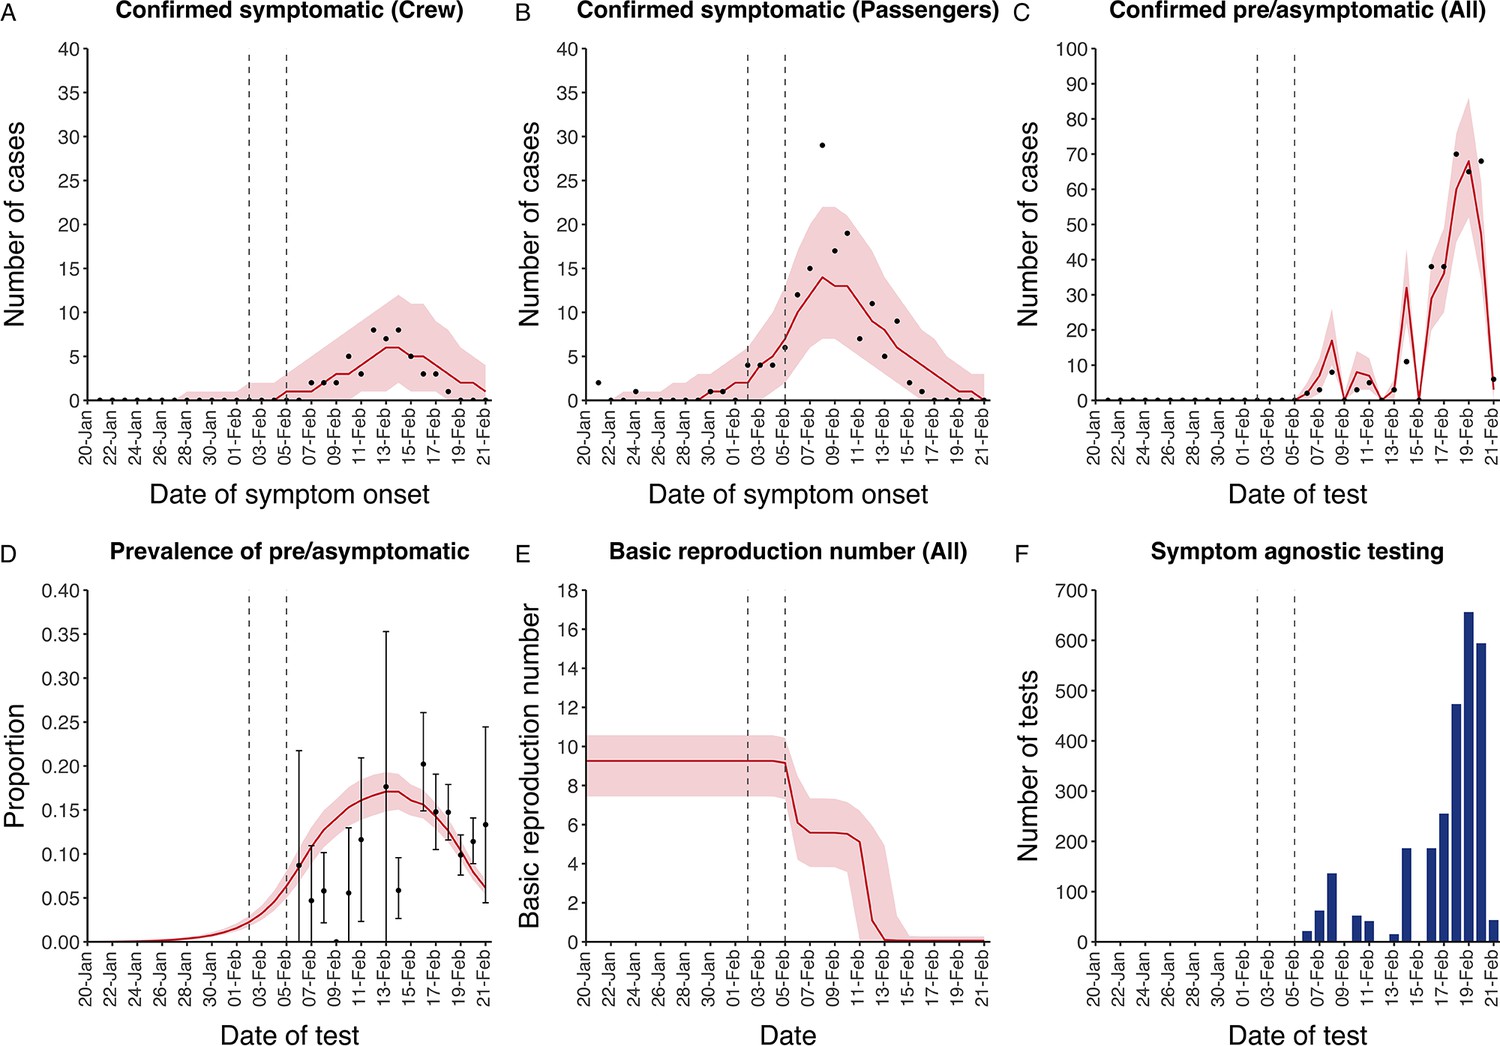
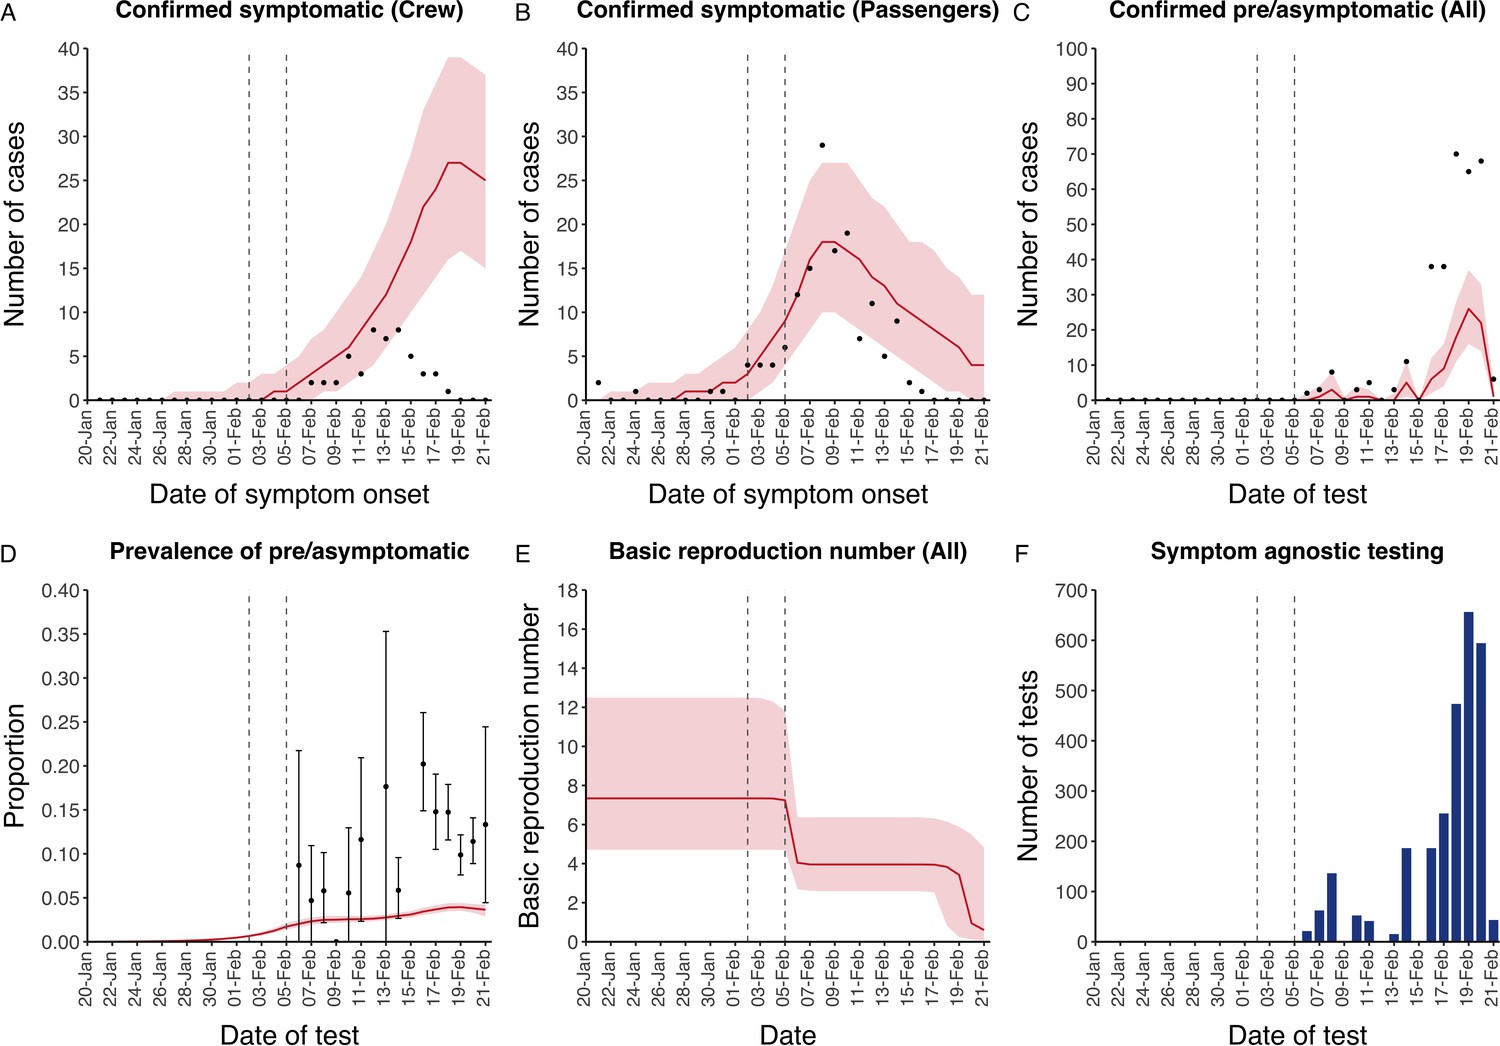
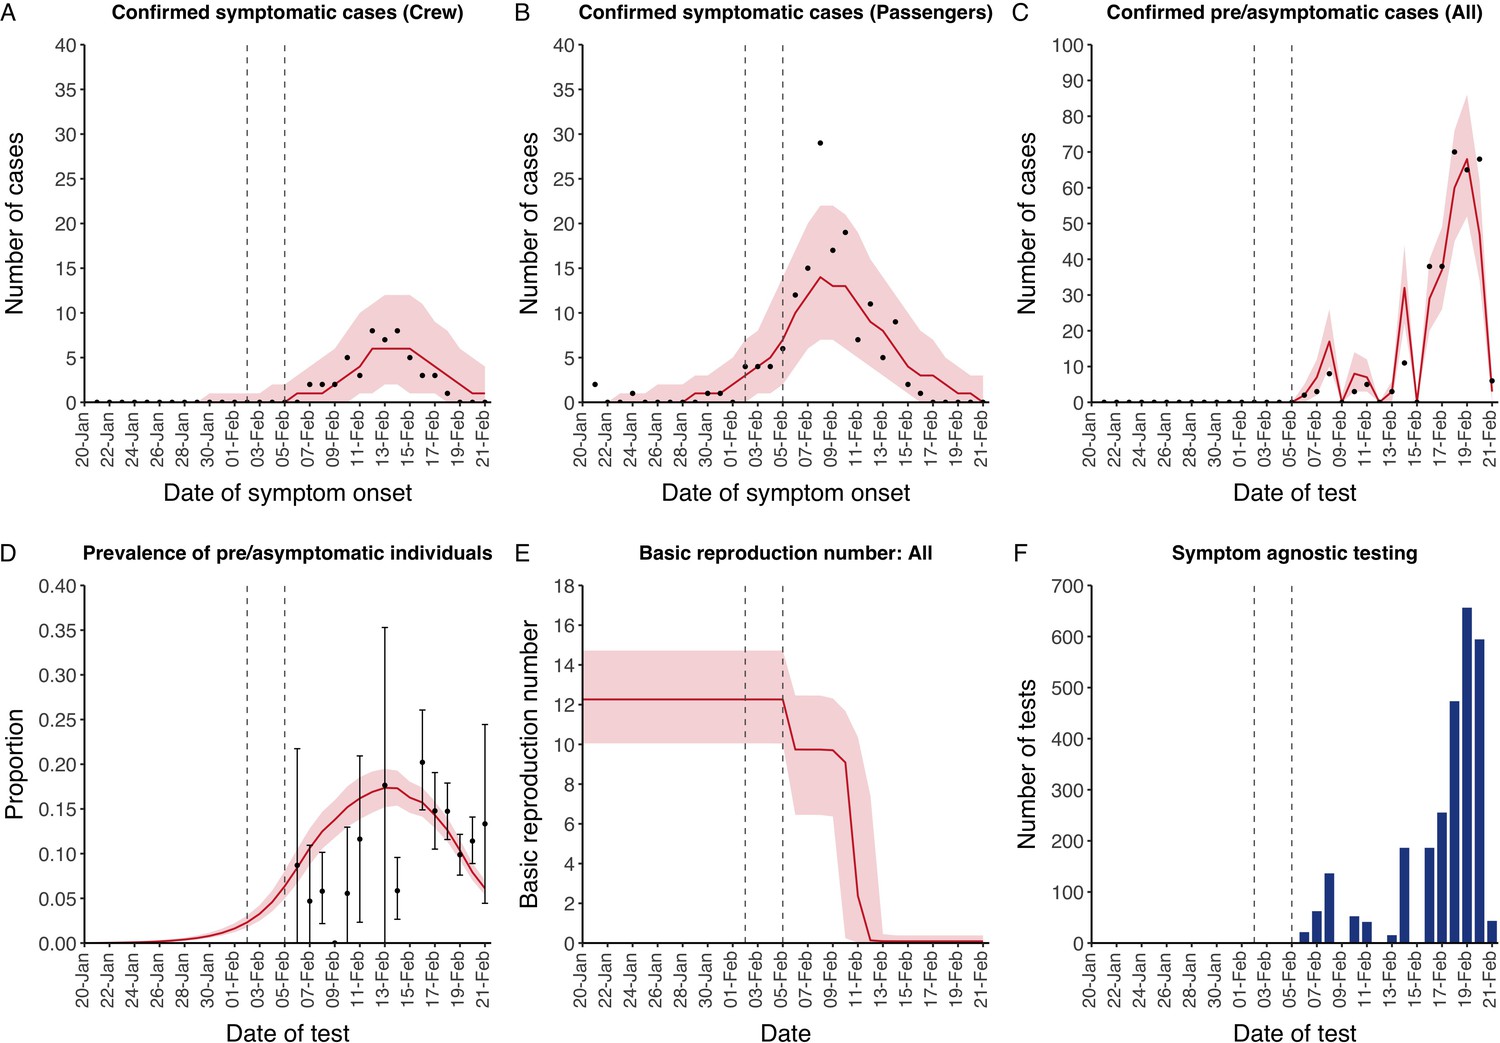
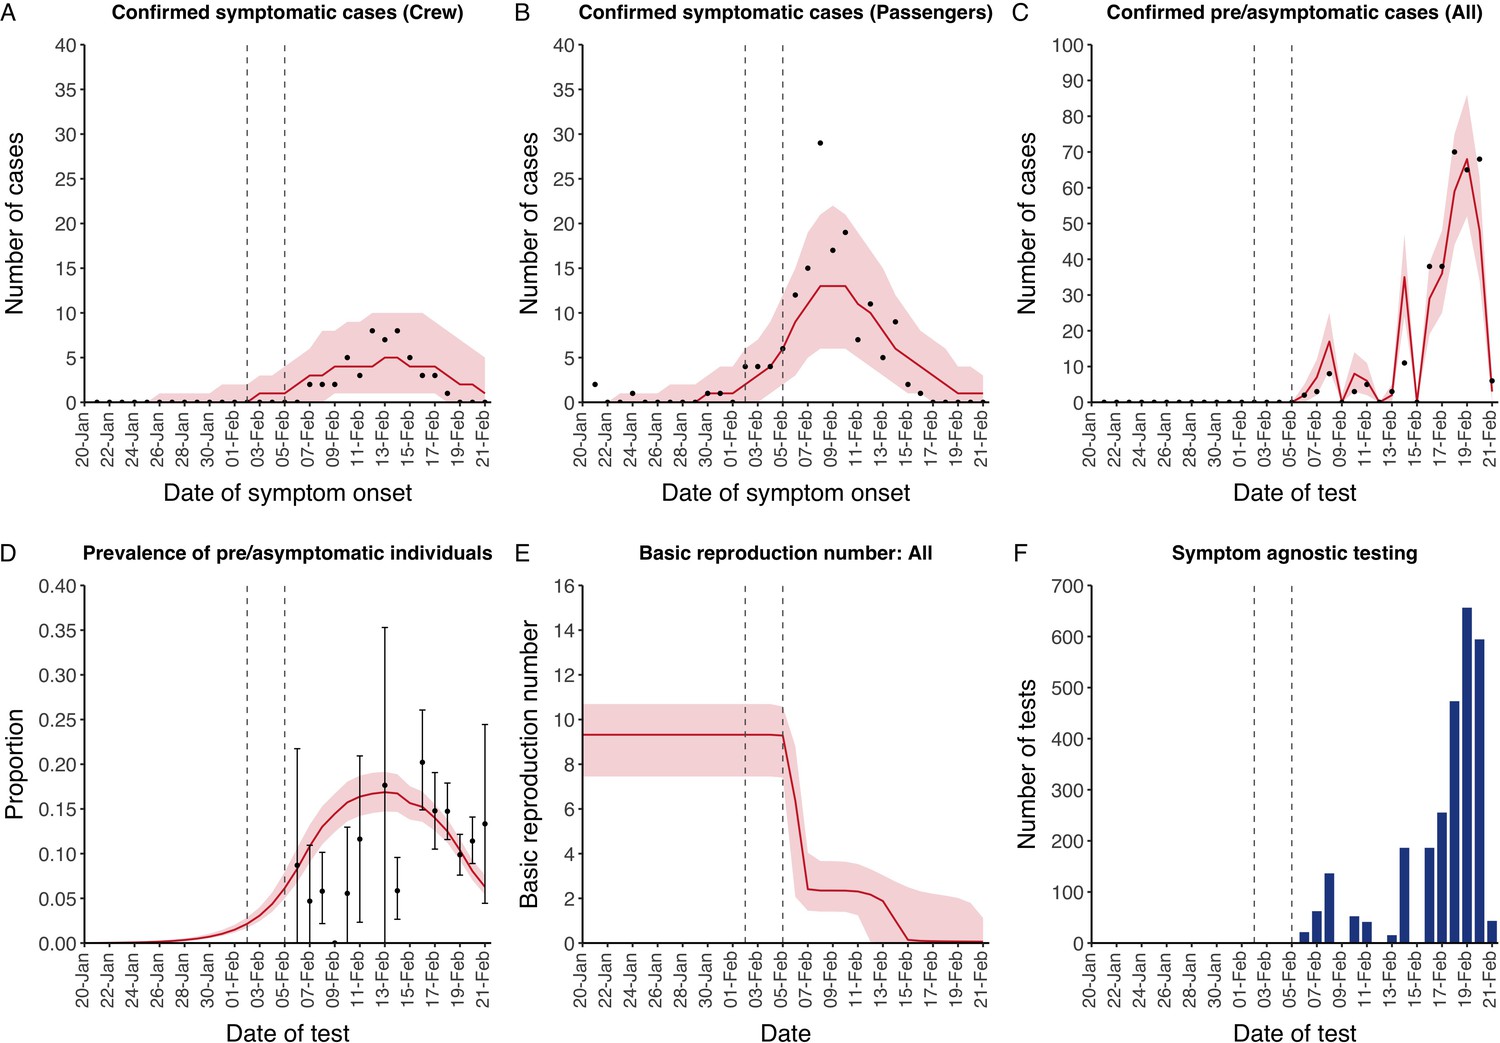
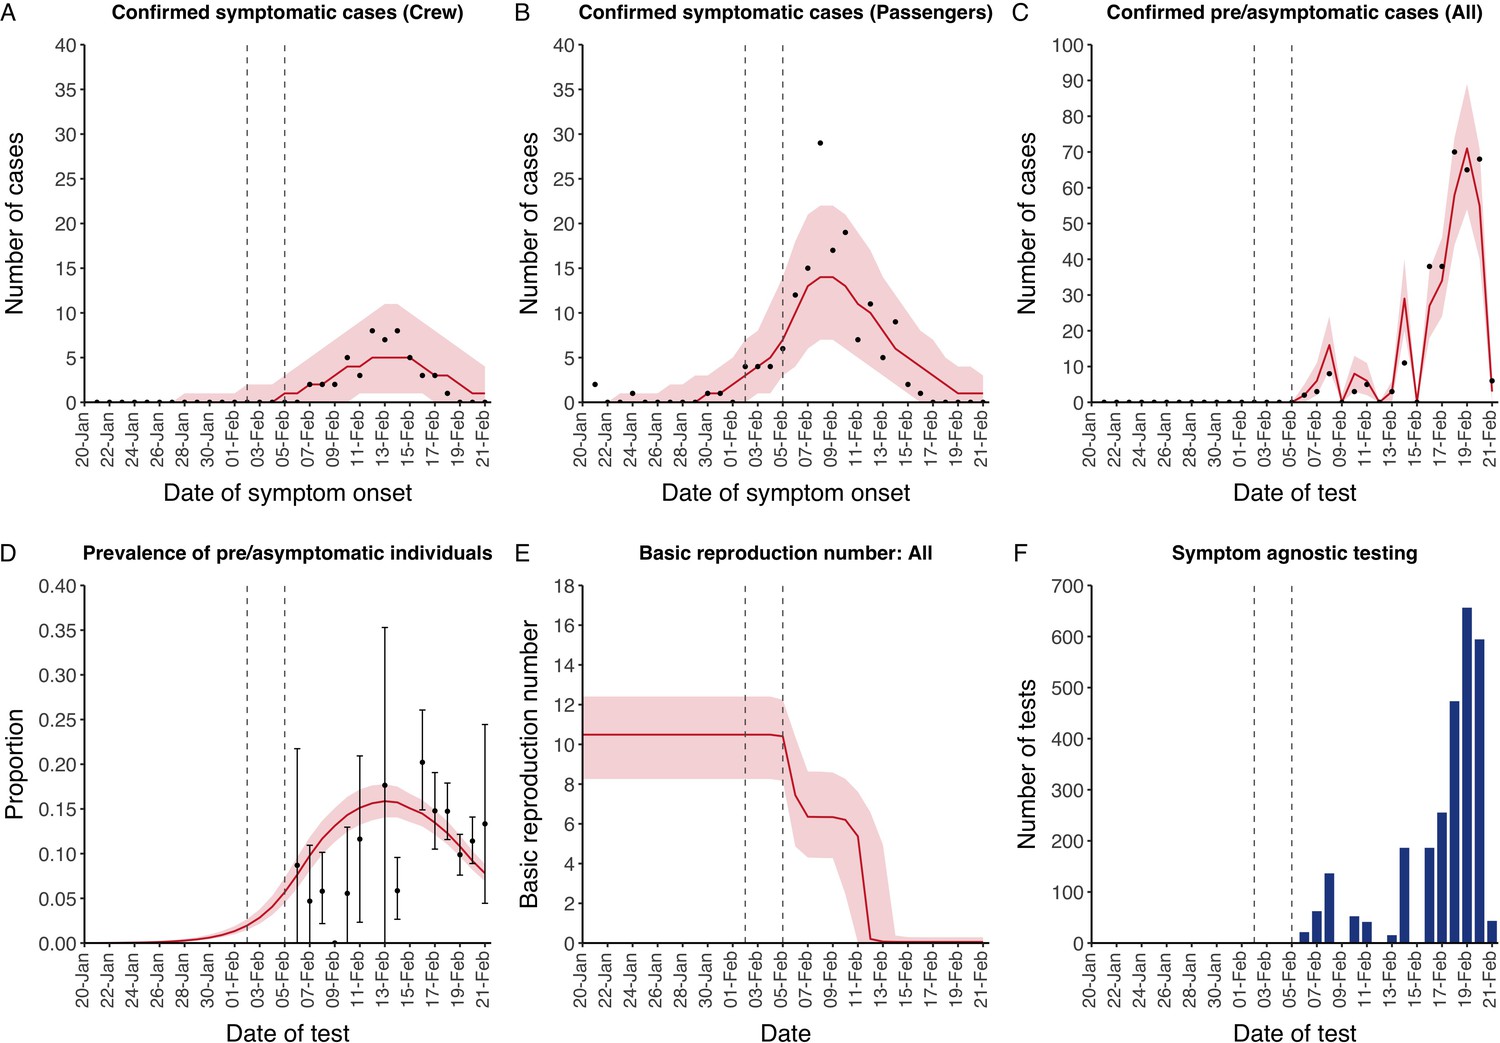
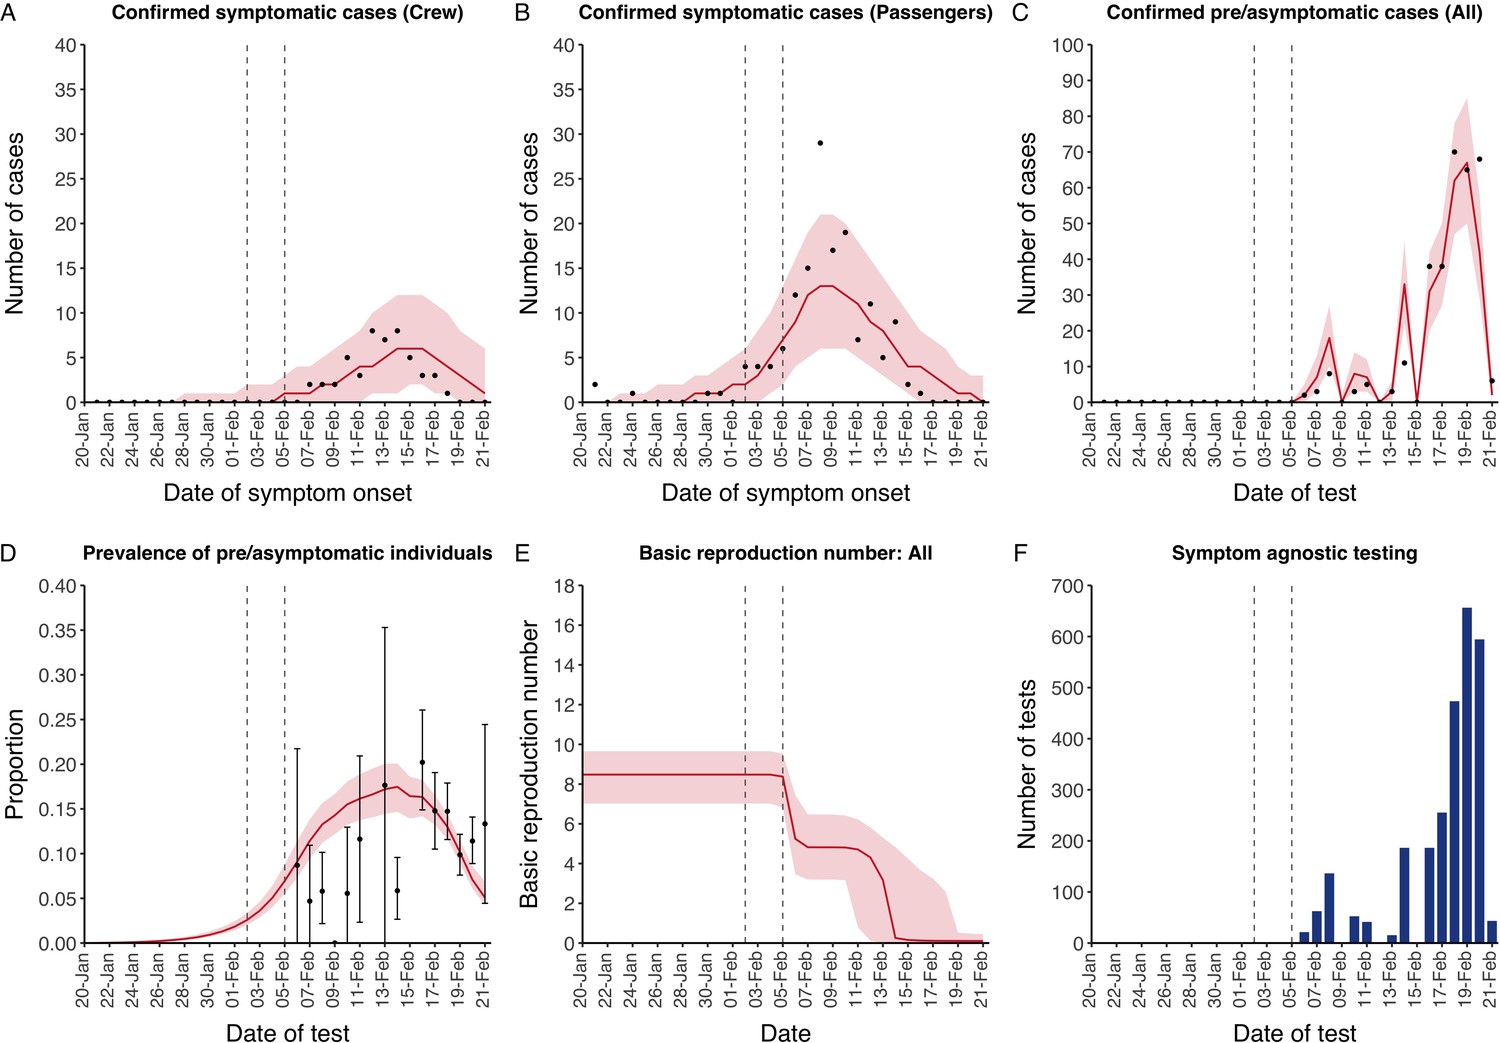
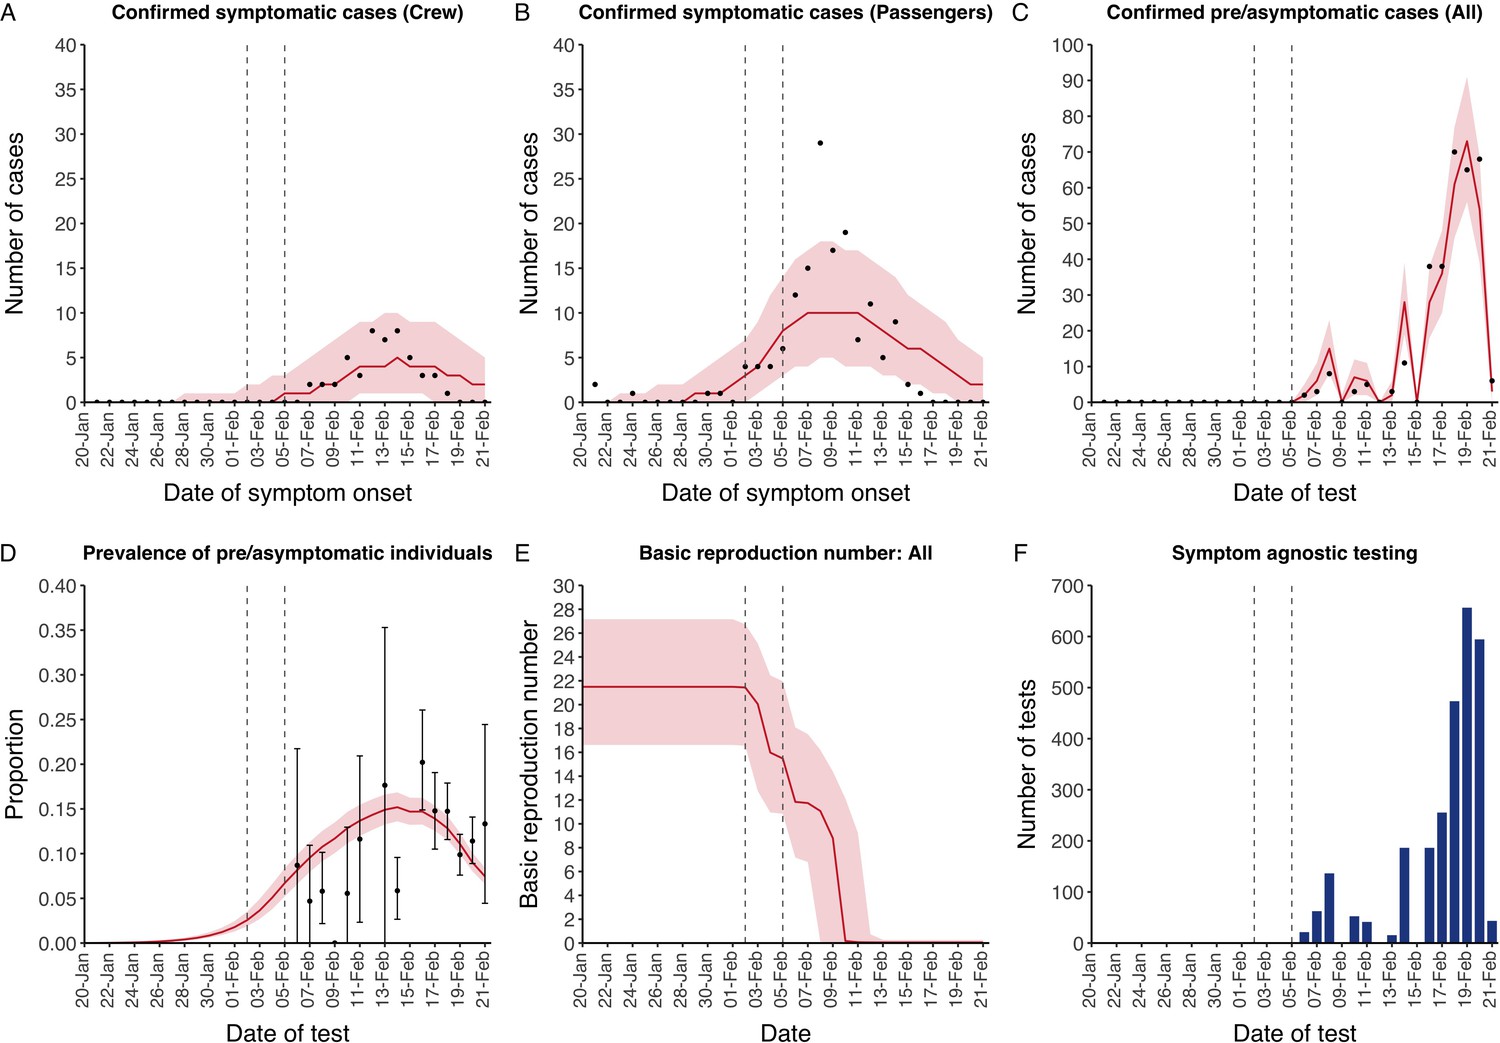
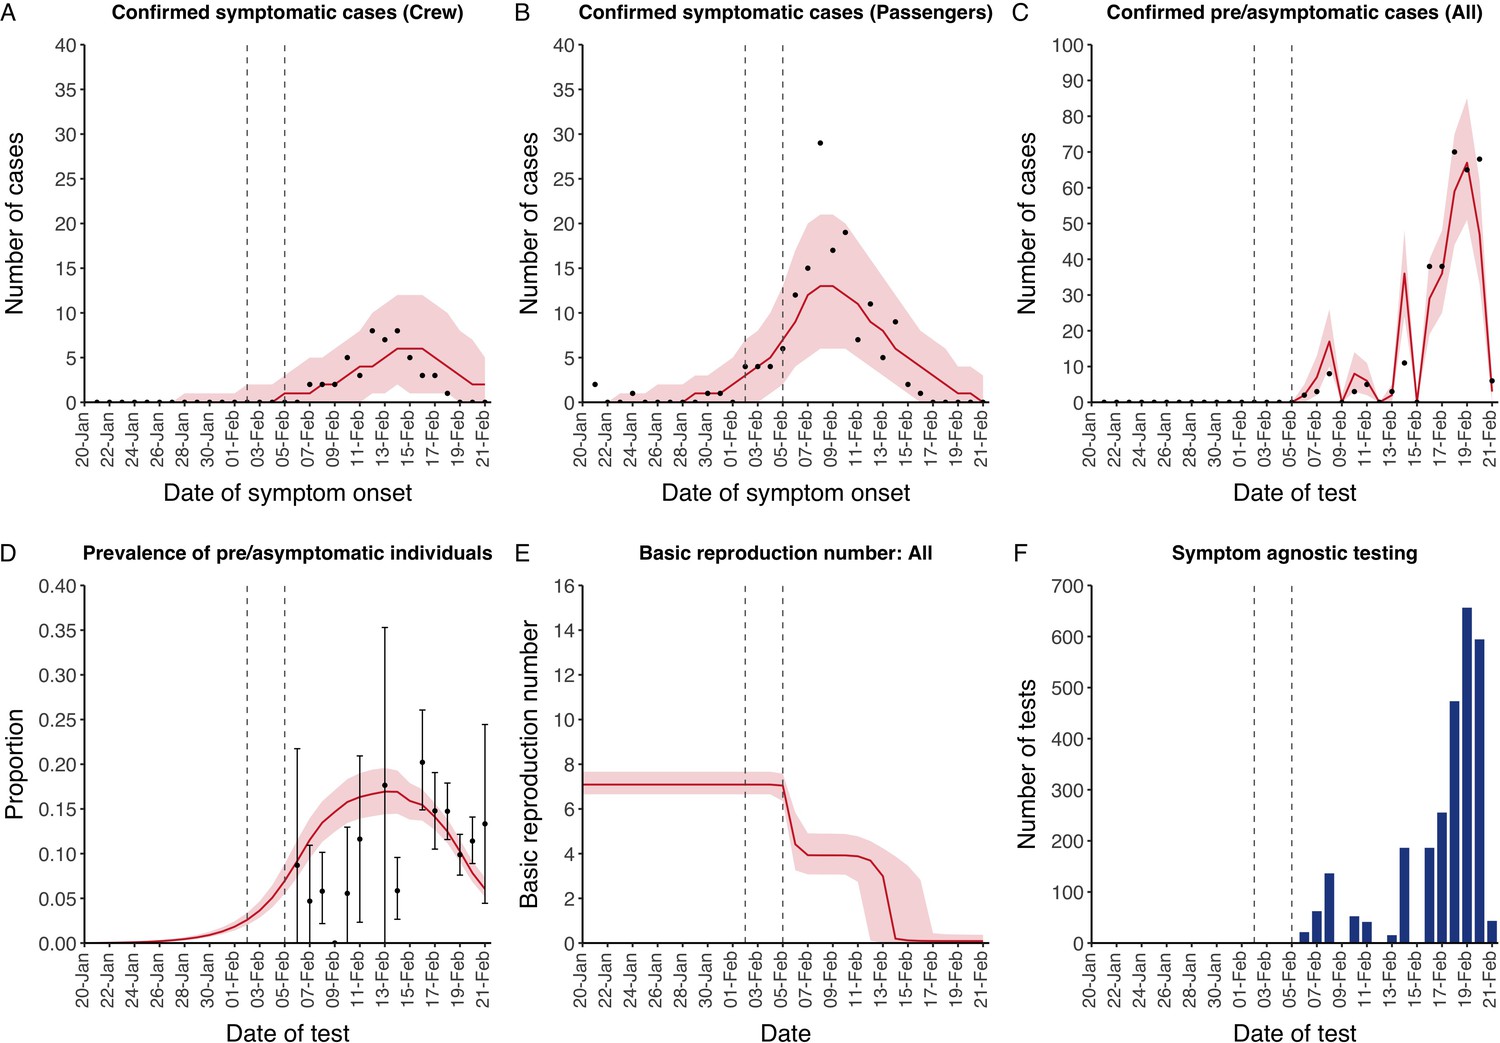
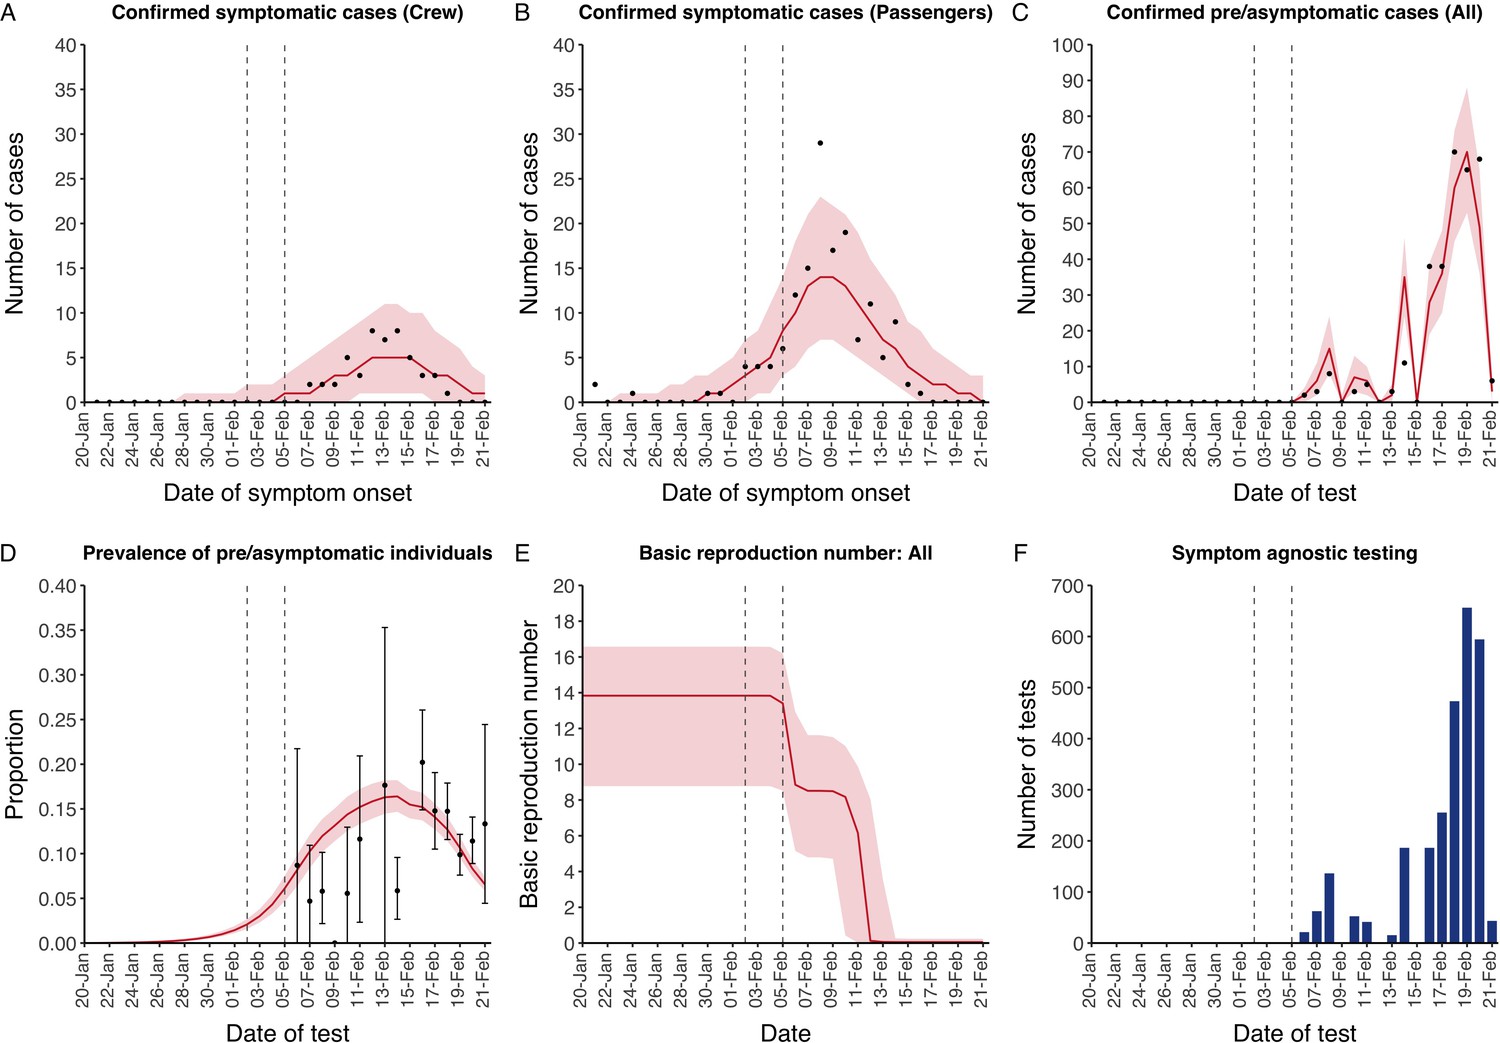
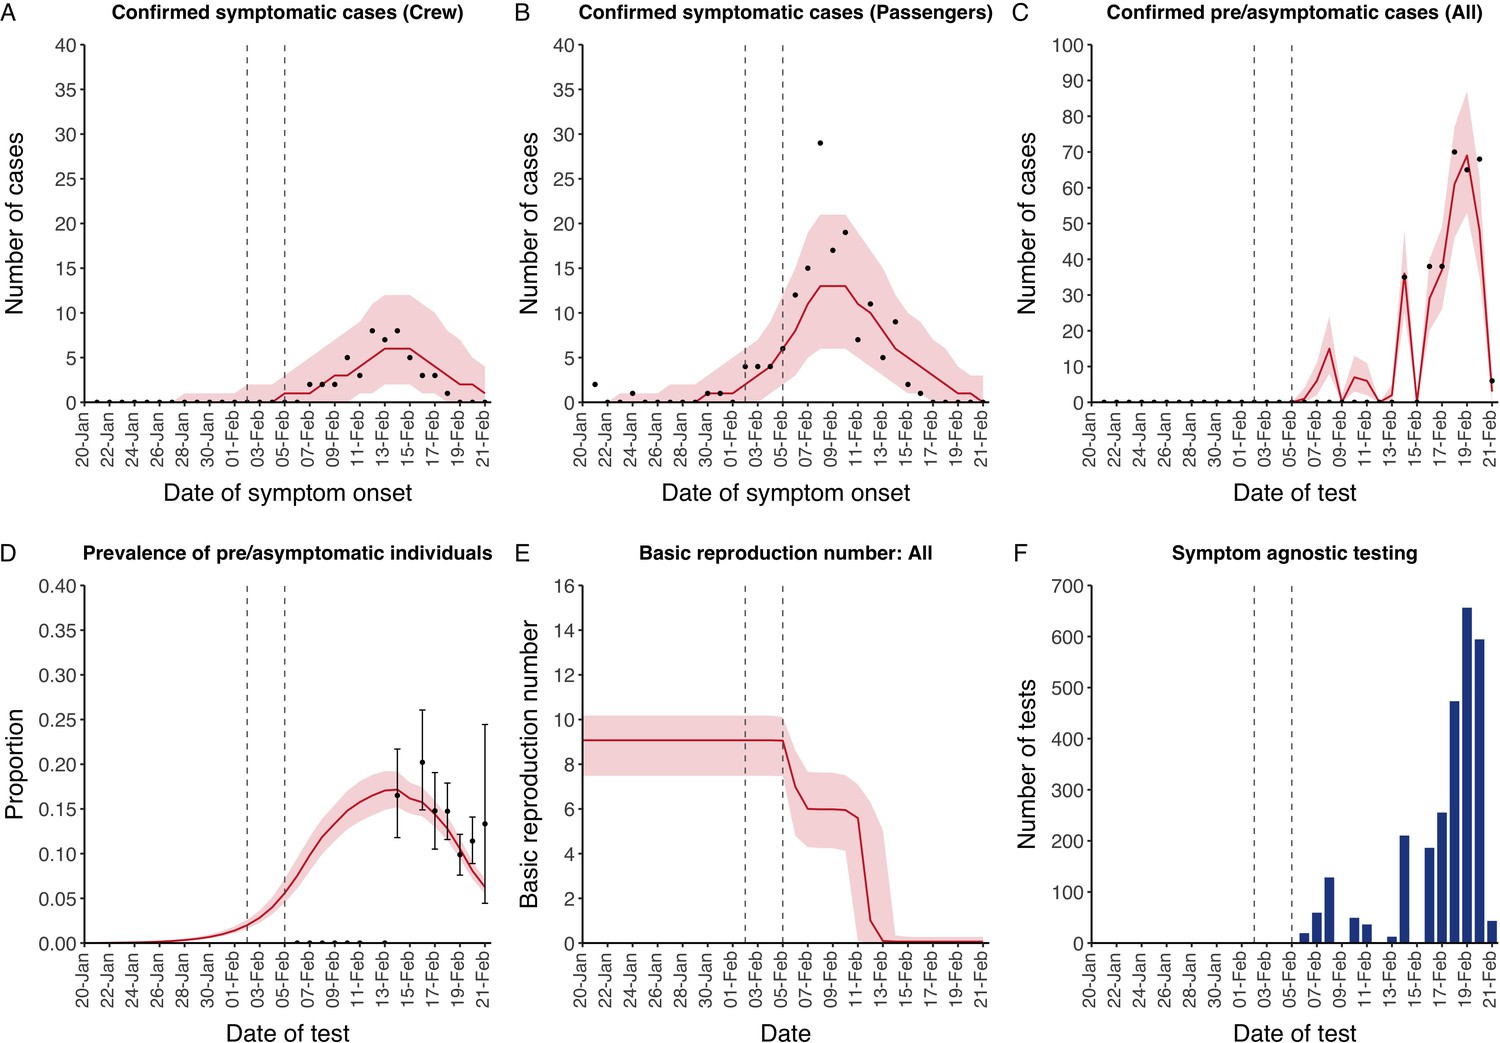
Data from the Diamond Princess and model calibration.
Figure shows data from the Diamond Princess (points (A-D) and bars (F)) and results from model calibration. Red lines = median, shading = 95% posterior plus observational interval (A-C) and 95% posterior interval only (D-E). Two vertical lines show the date of the first confirmed diagnosis (left) and the start of quarantine measures (right). (A-B) show confirmed symptomatic cases among crew (A) and passengers (B) with a reported date of onset; (C) shows confirmed pre- or asymptomatic individuals by test date; (D) shows the prevalence of pre/asymptomatic individuals by test date. Points and error bars show point estimates and 95% confidence intervals; (E) shows the basic reproduction number over time for the ship as a whole, reflecting the drop in contact rates (F) shows the number of tests administered irrespective of symptoms, by test date.
-
Figure 1—source data 1
Marginal posterior parameter values from model calibration.
Median and equal-tailed 95% marginal posterior parameter values estimated using 100,000 samples from the joint posterior distribution found during MCMC model calibration. See Table 2 for parameter definitions and descriptions.
- https://cdn.elifesciences.org/articles/58699/elife-58699-fig1-data1-v2.xlsx
Figure 1—figure supplement 1

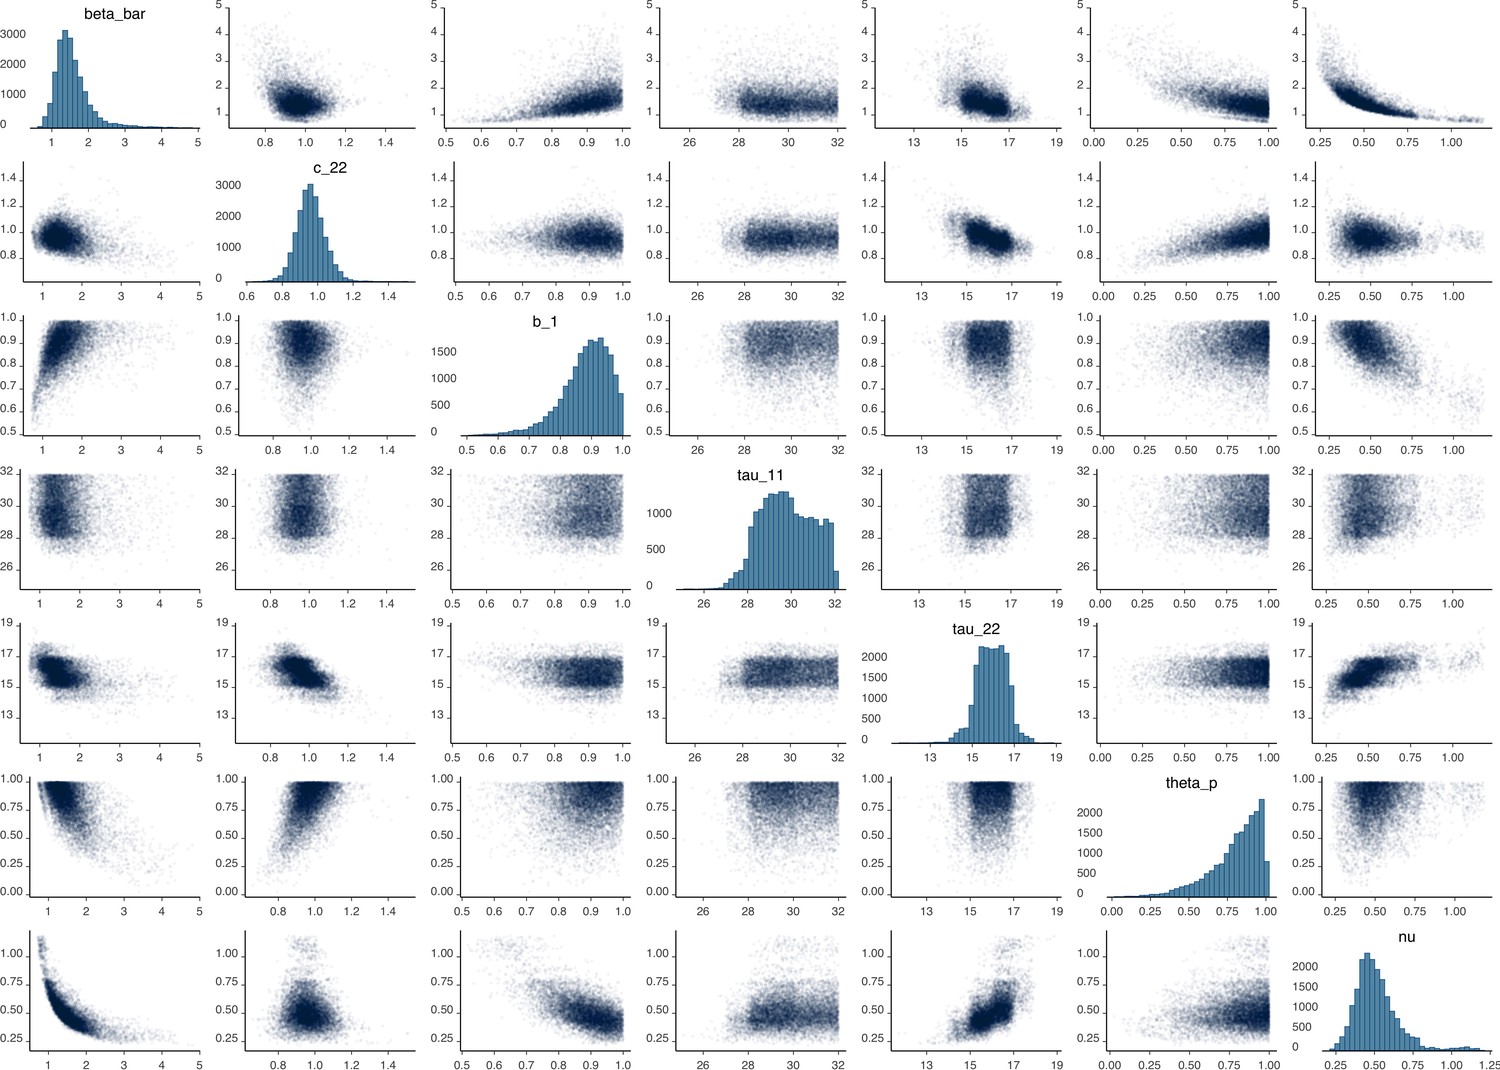
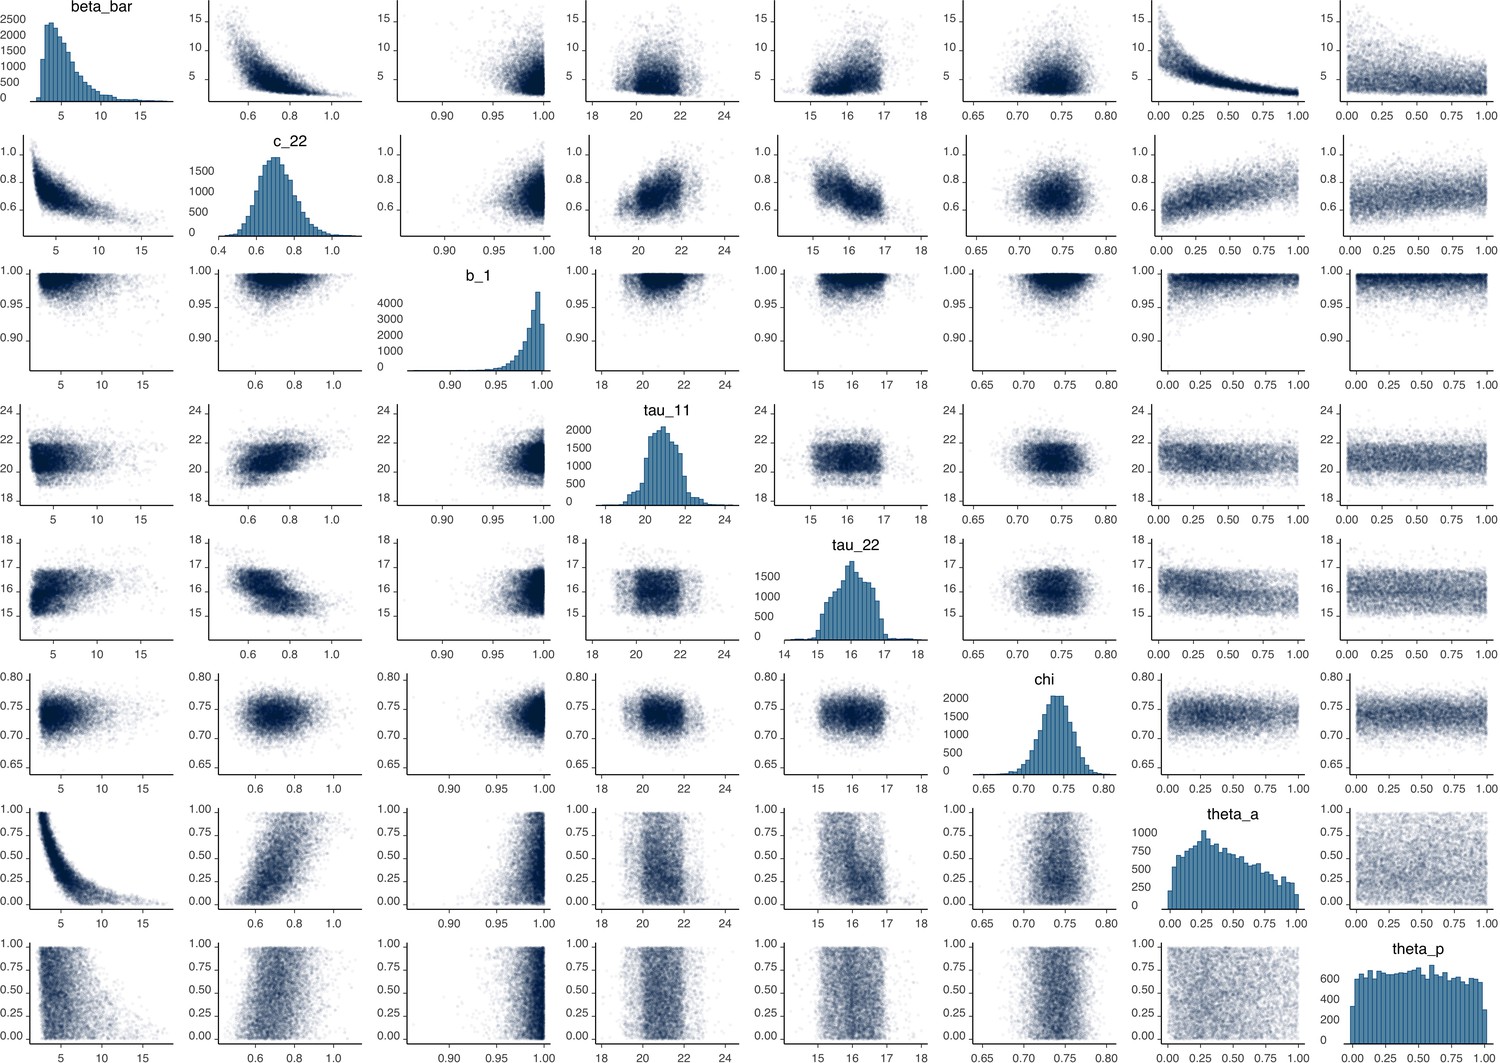
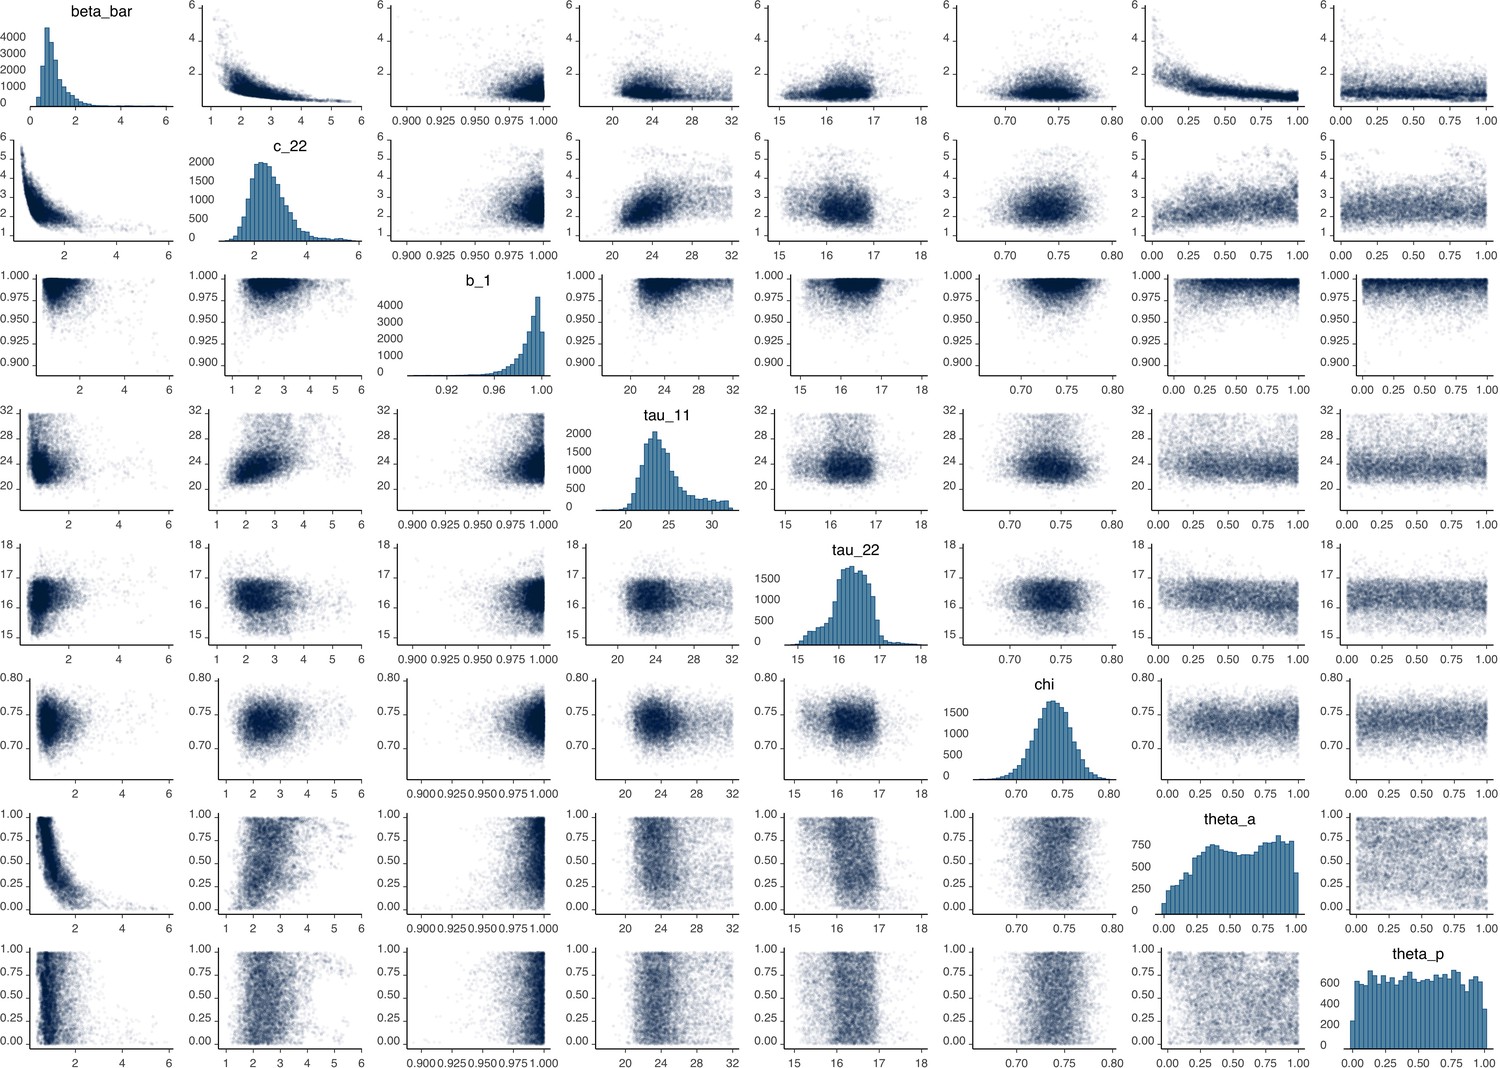
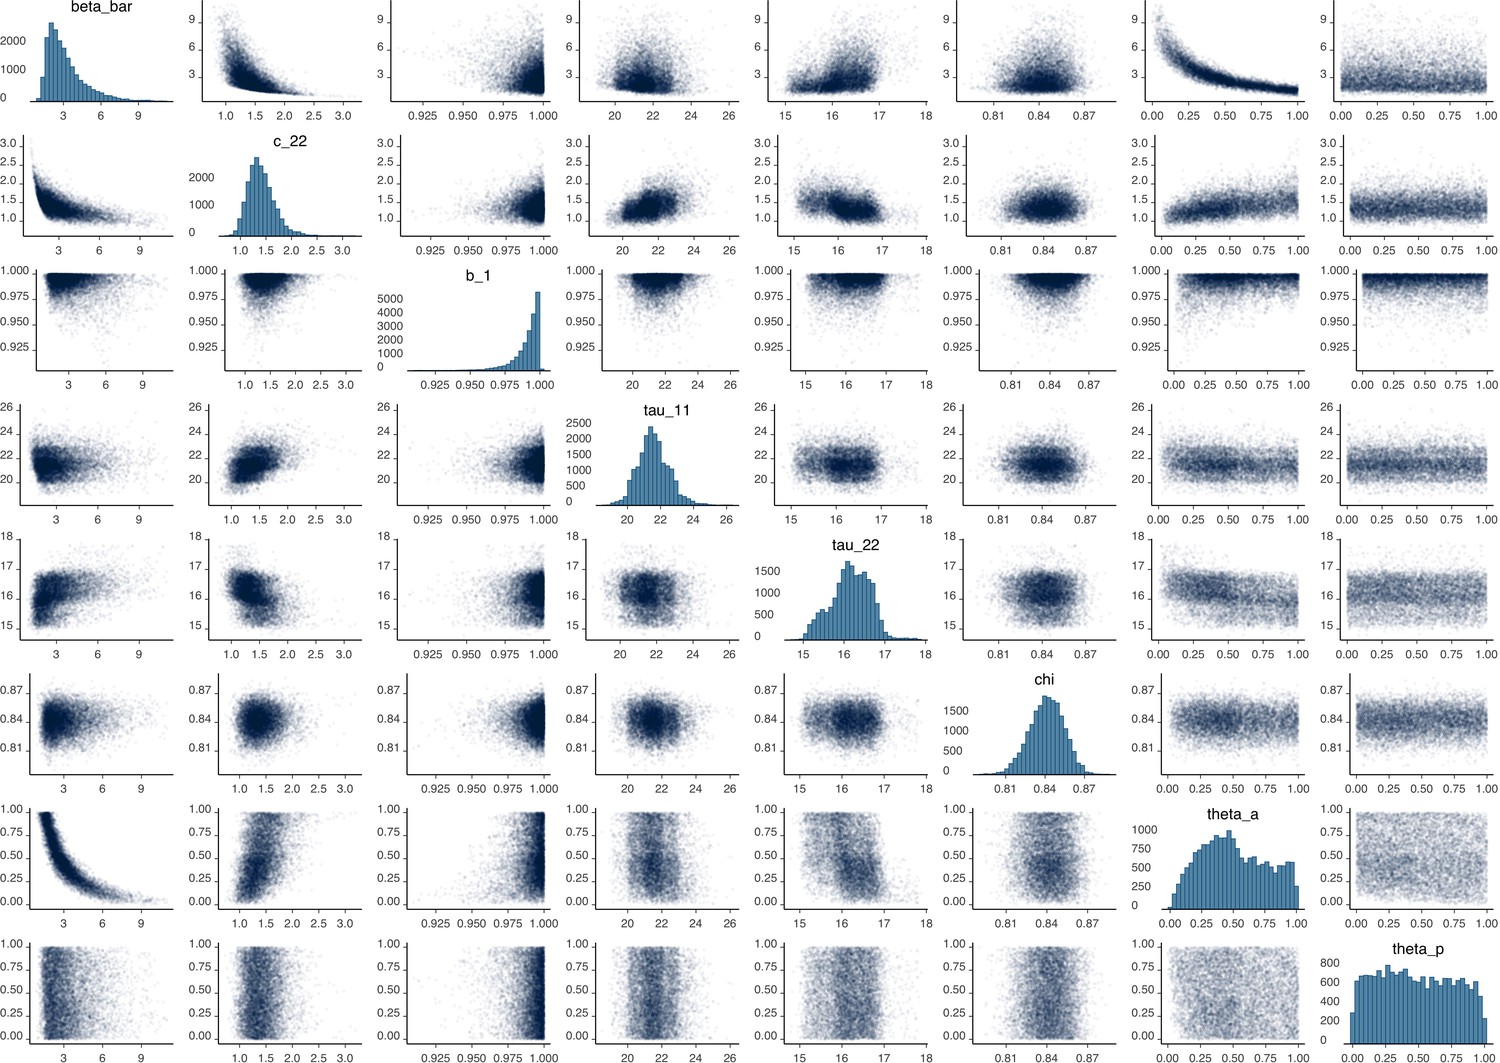
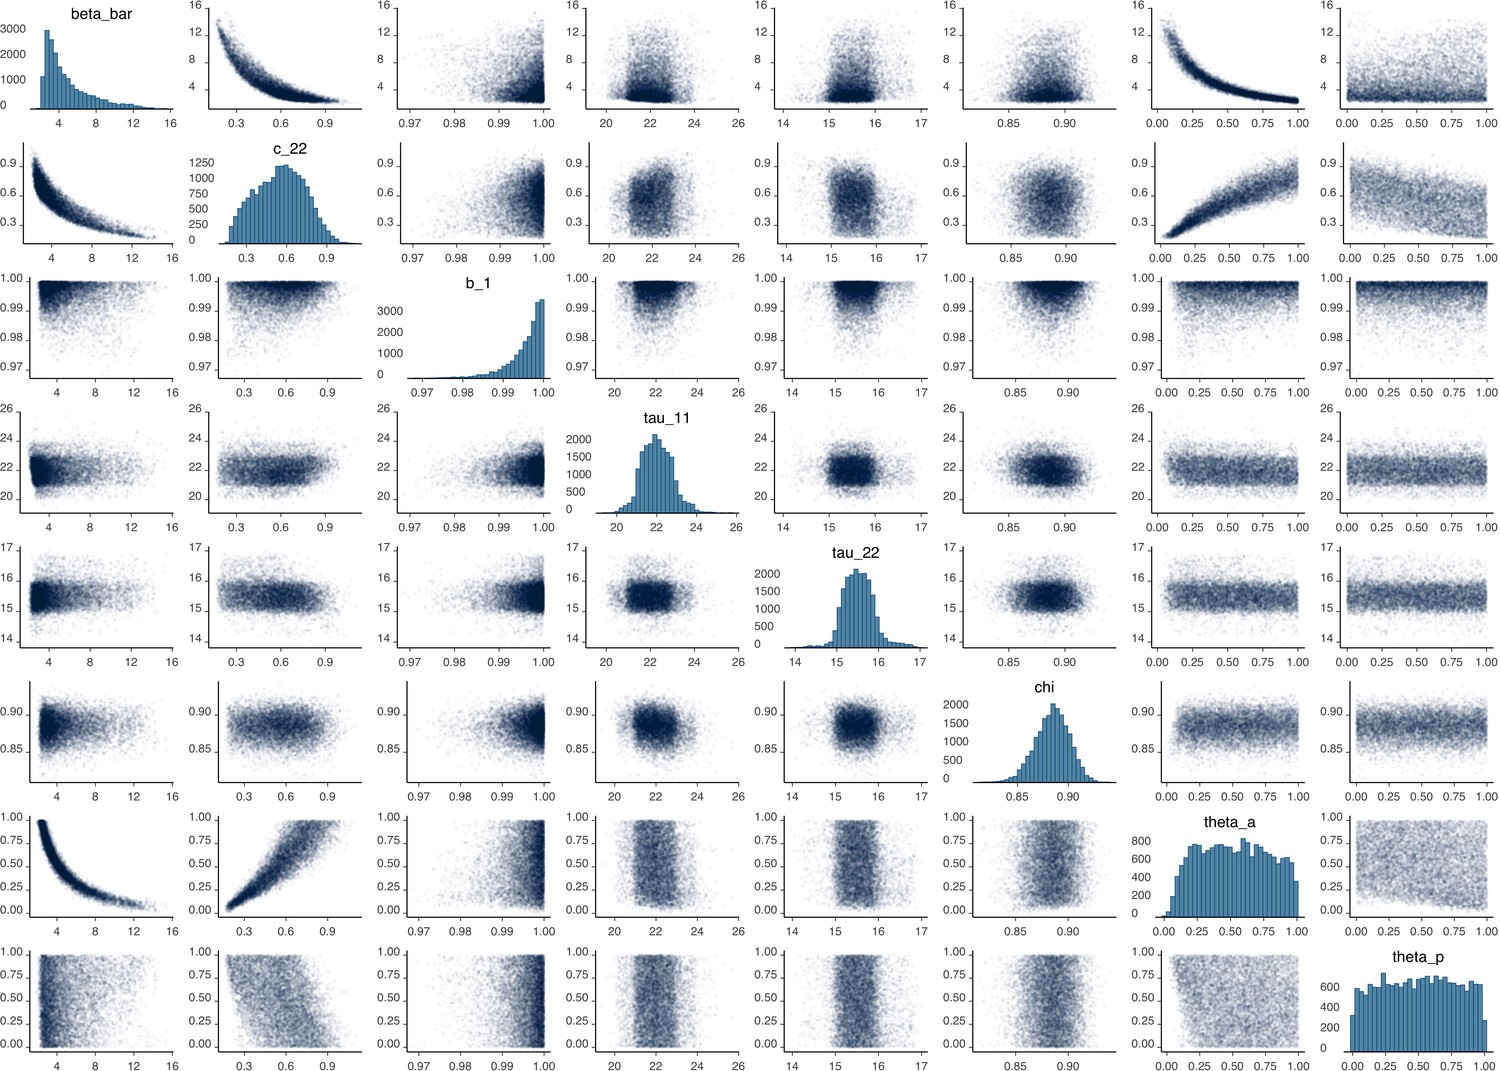
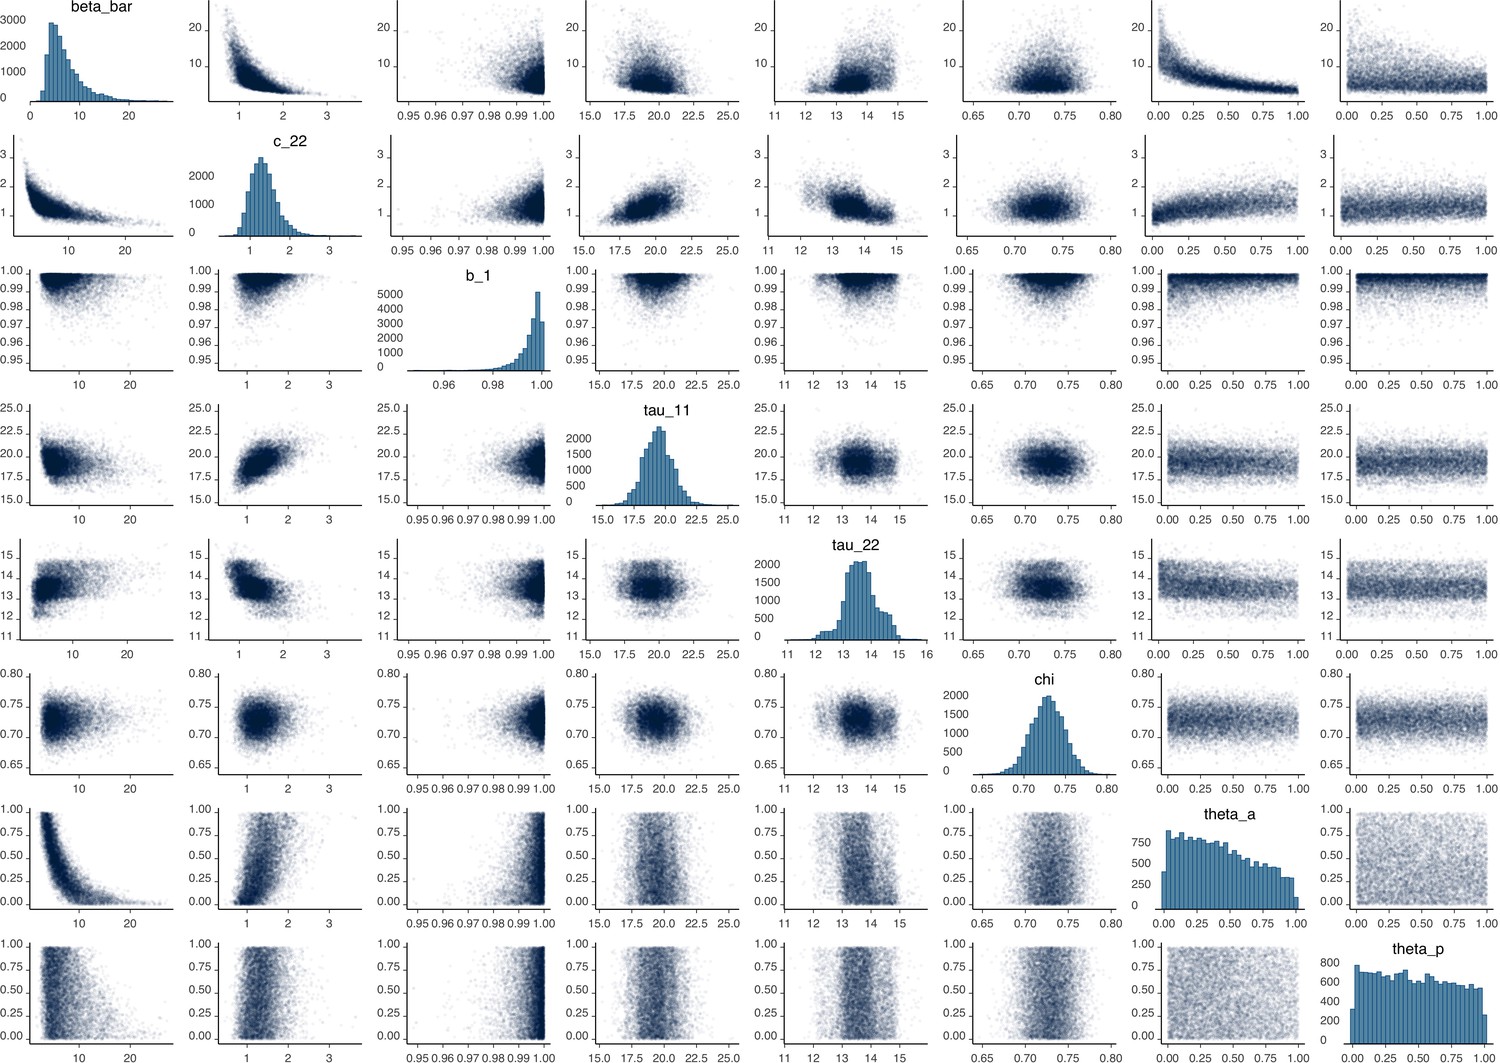
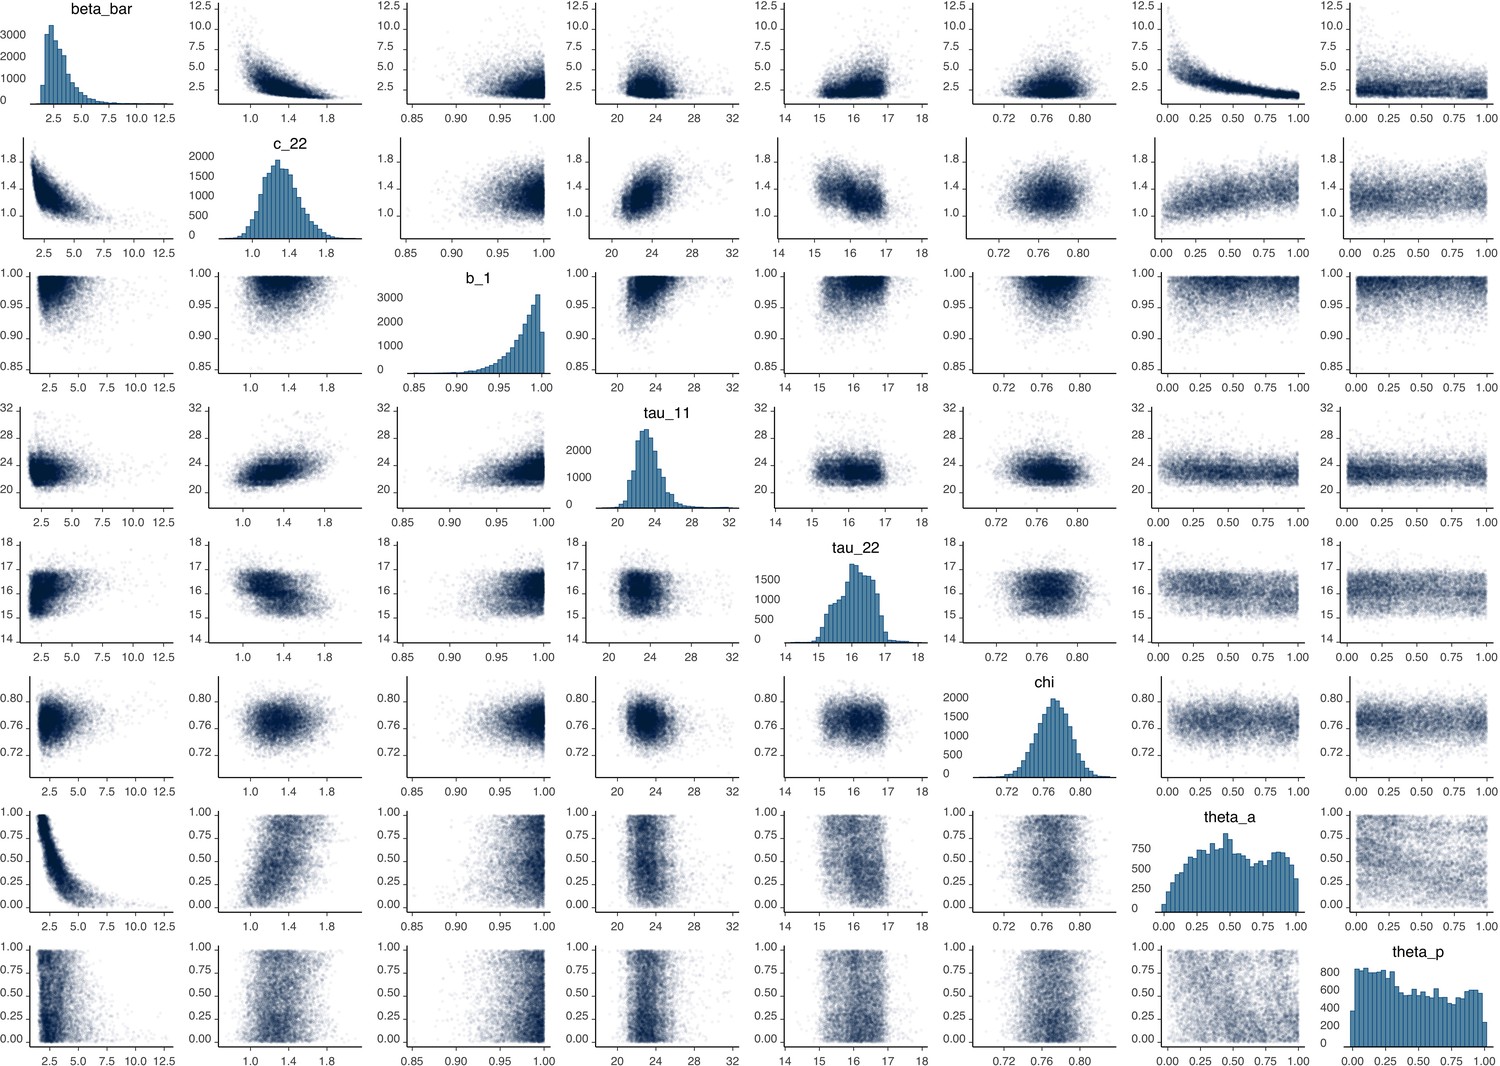
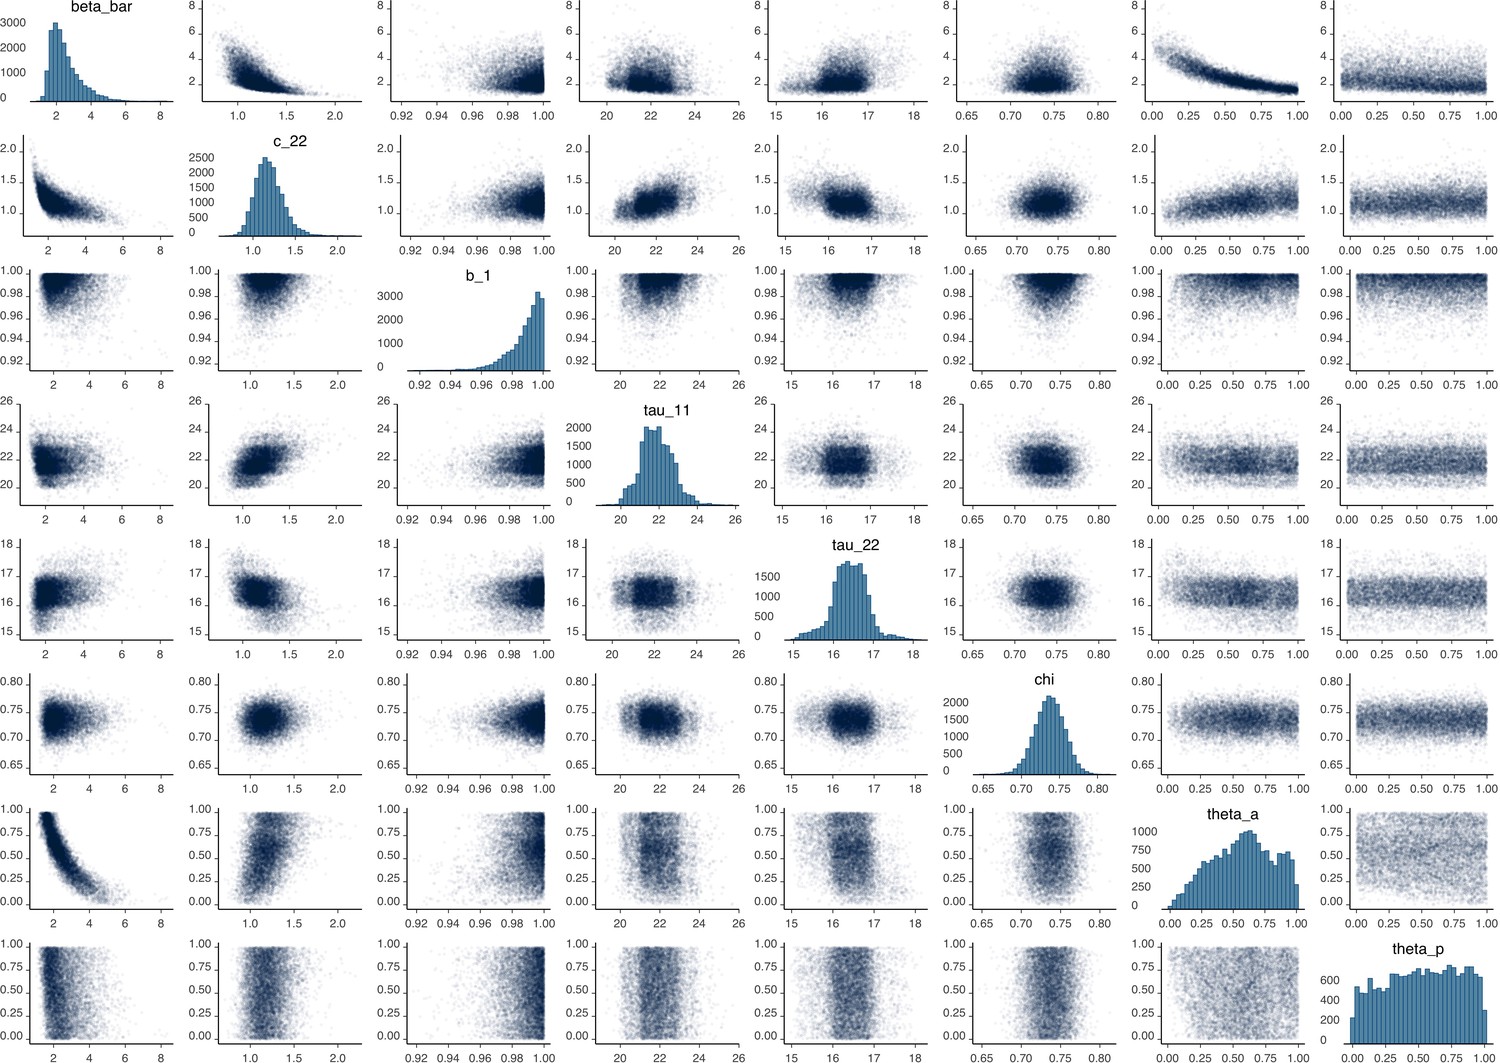
Parameter correlation plot from model calibration.
Parameter correlation plot containing parameter values from 10,000 samples of the joint posterior distribution found during MCMC model calibration. See Table 2 for parameter definitions and descriptions.
Figure 1—figure supplement 2
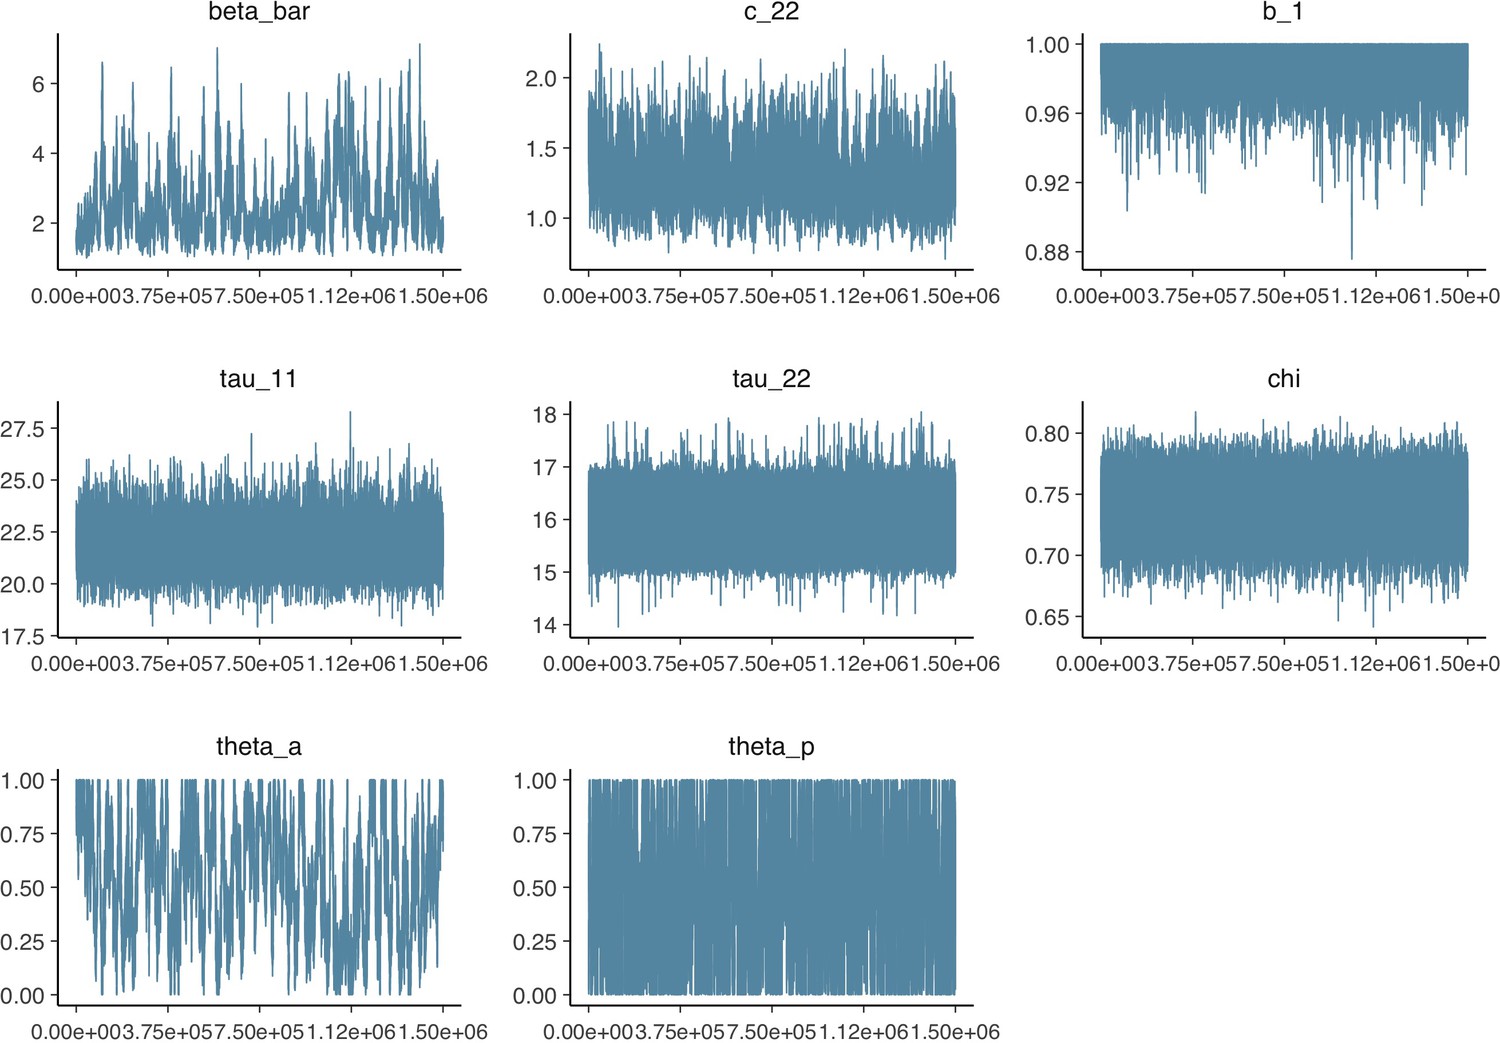
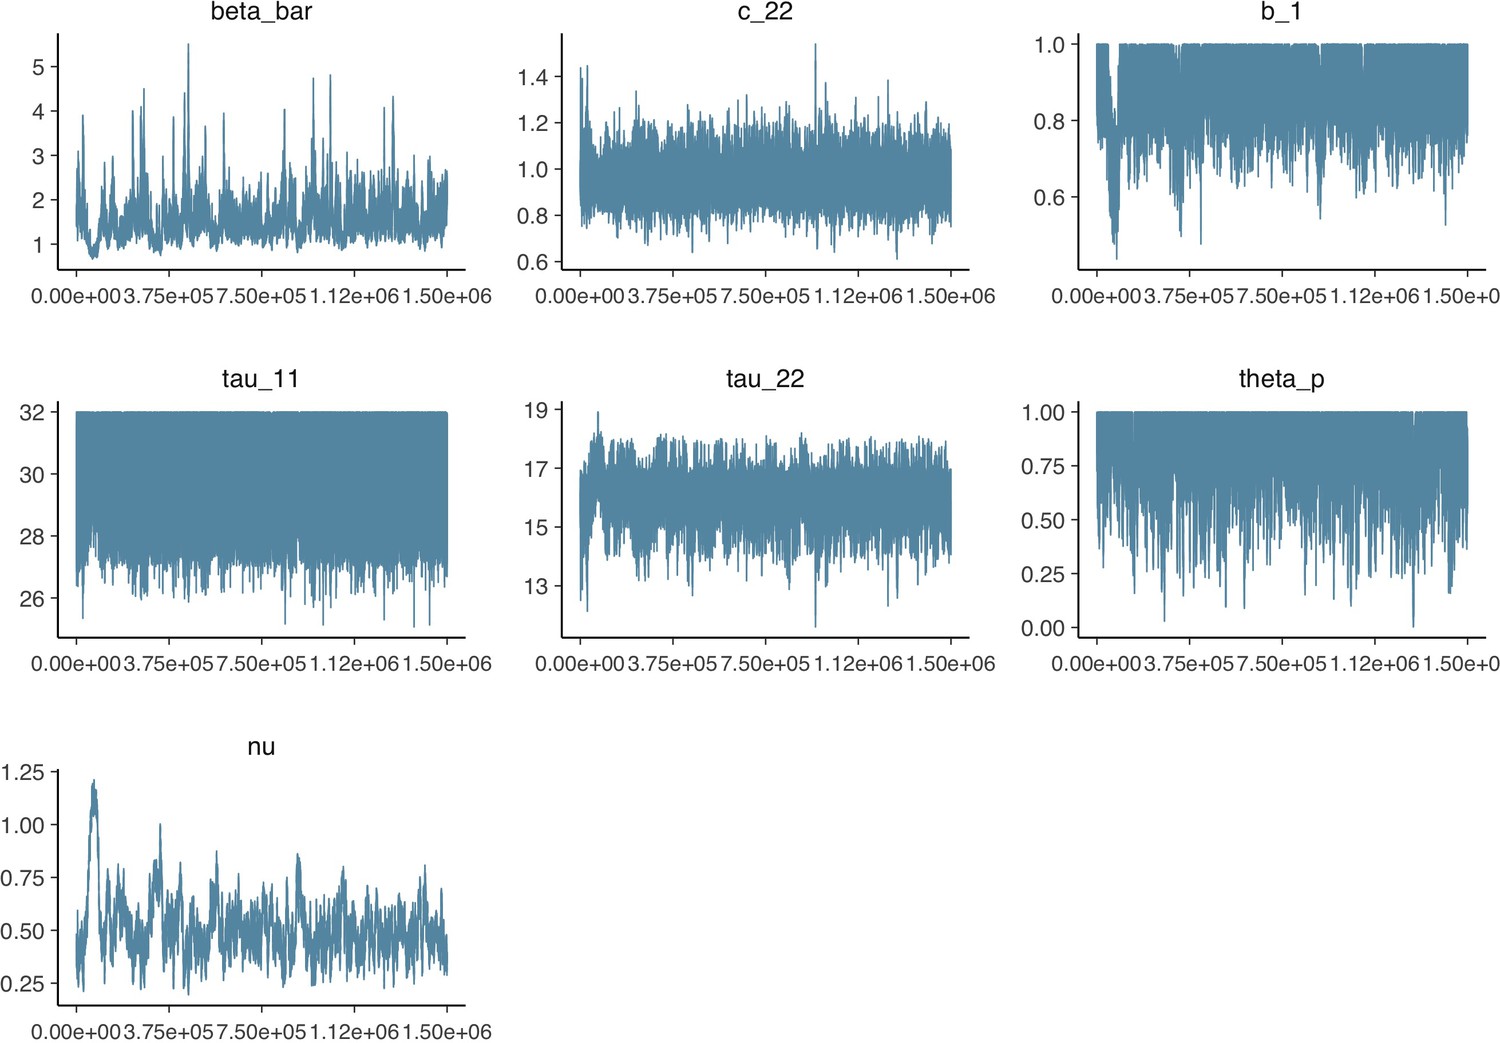
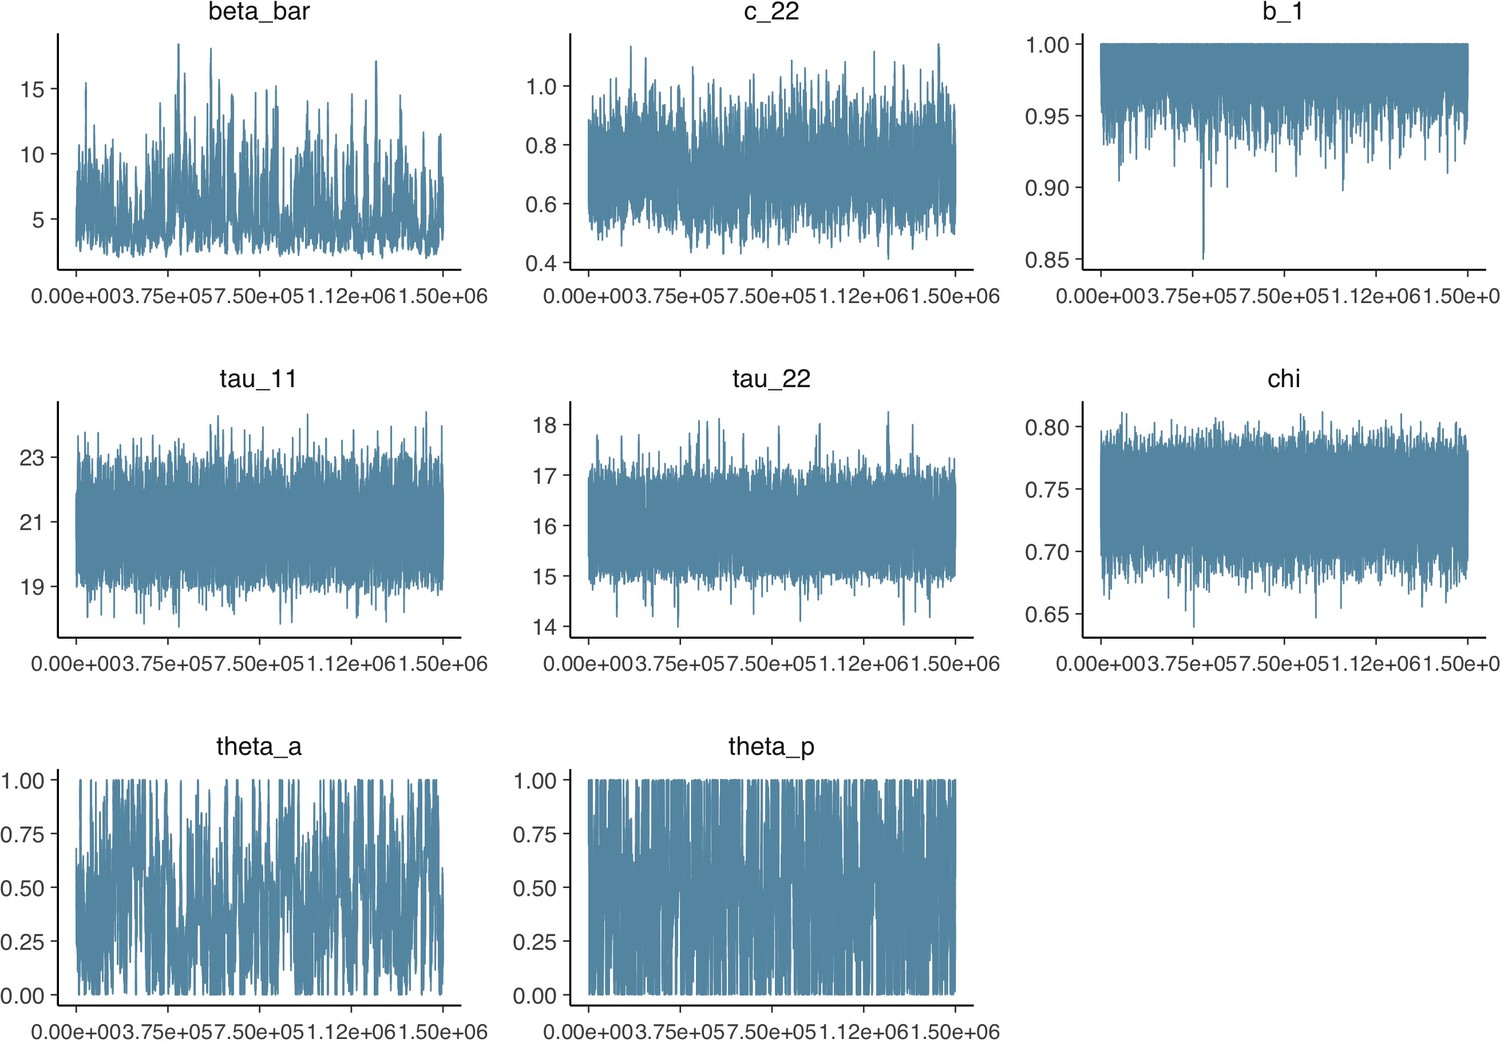
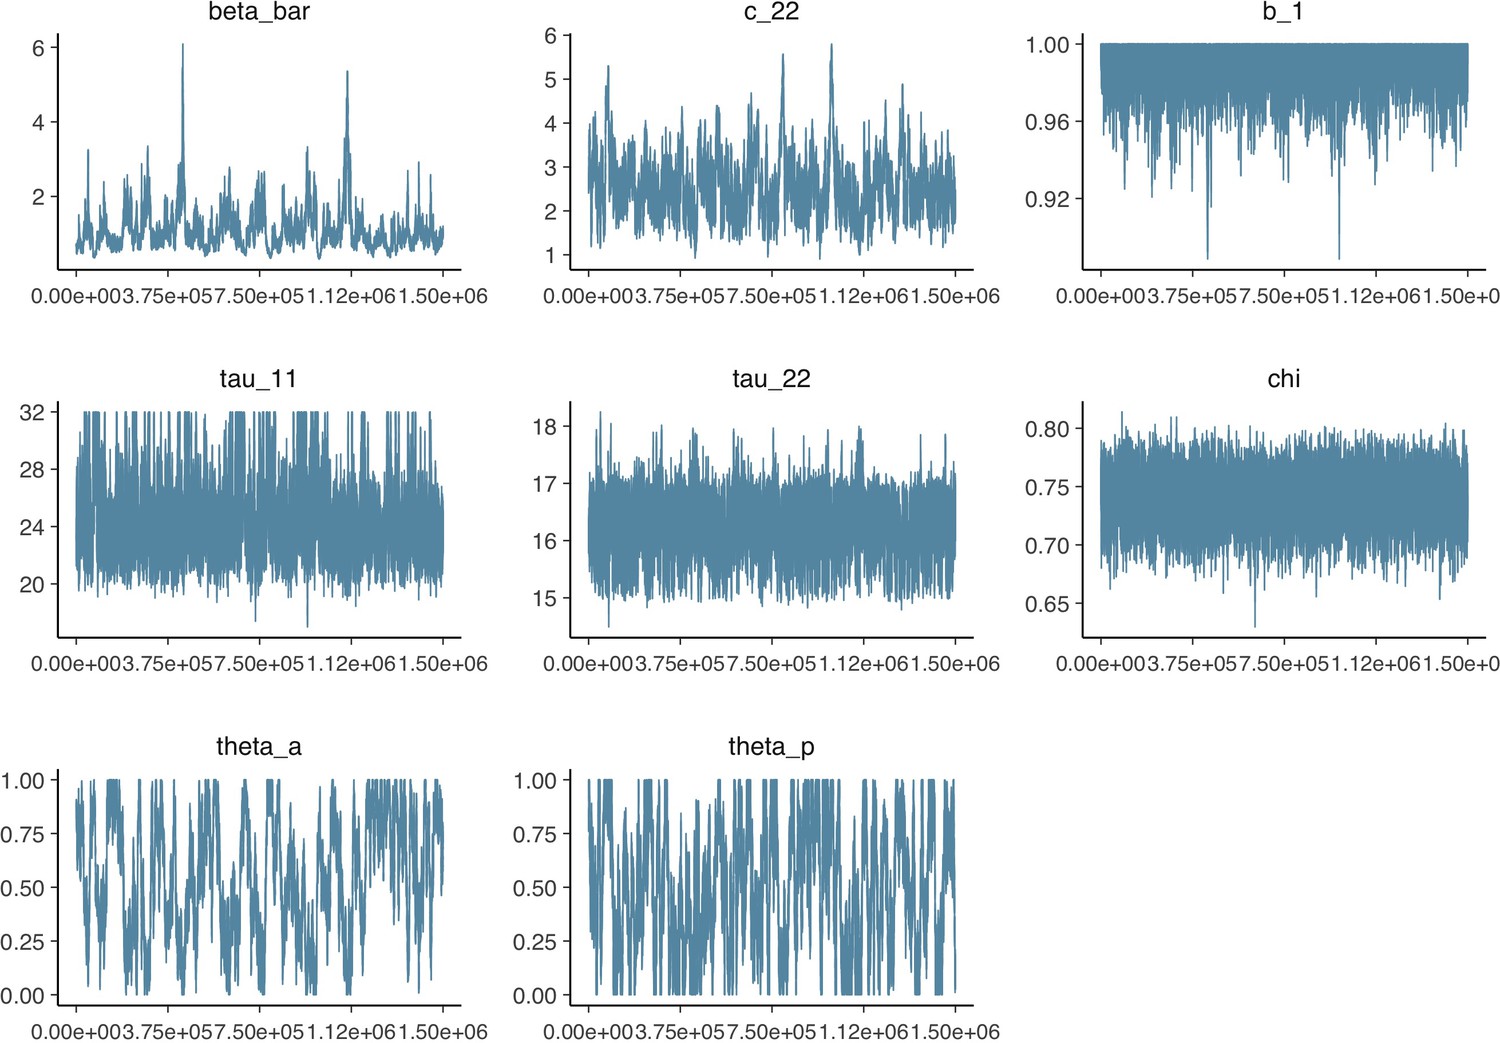
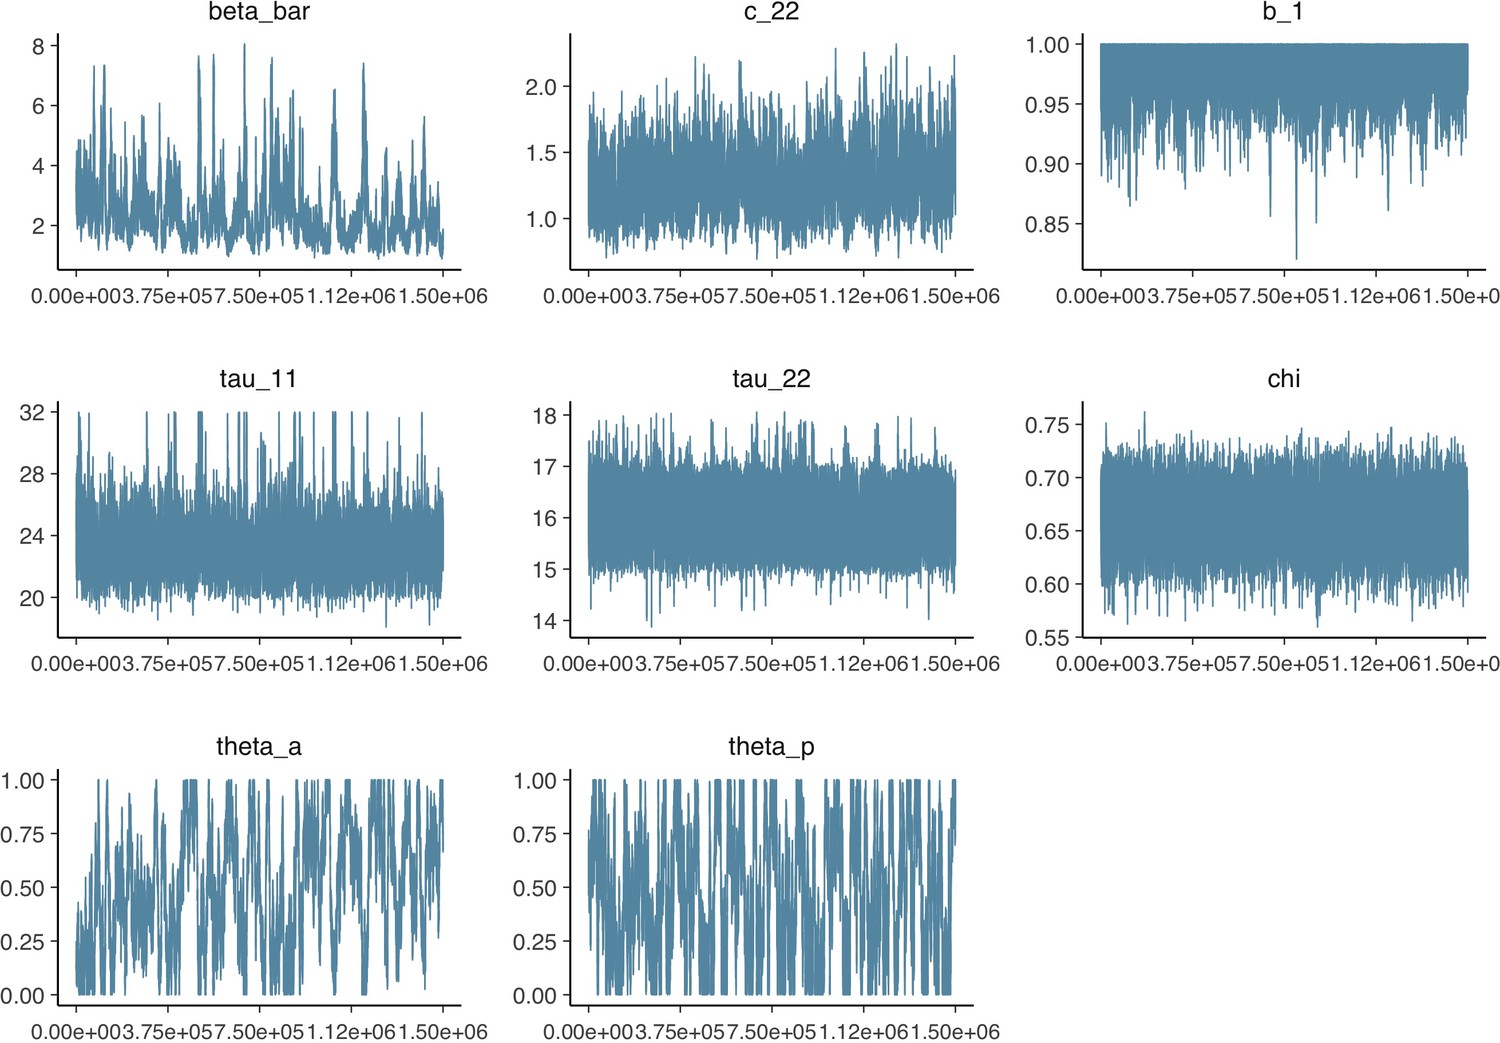
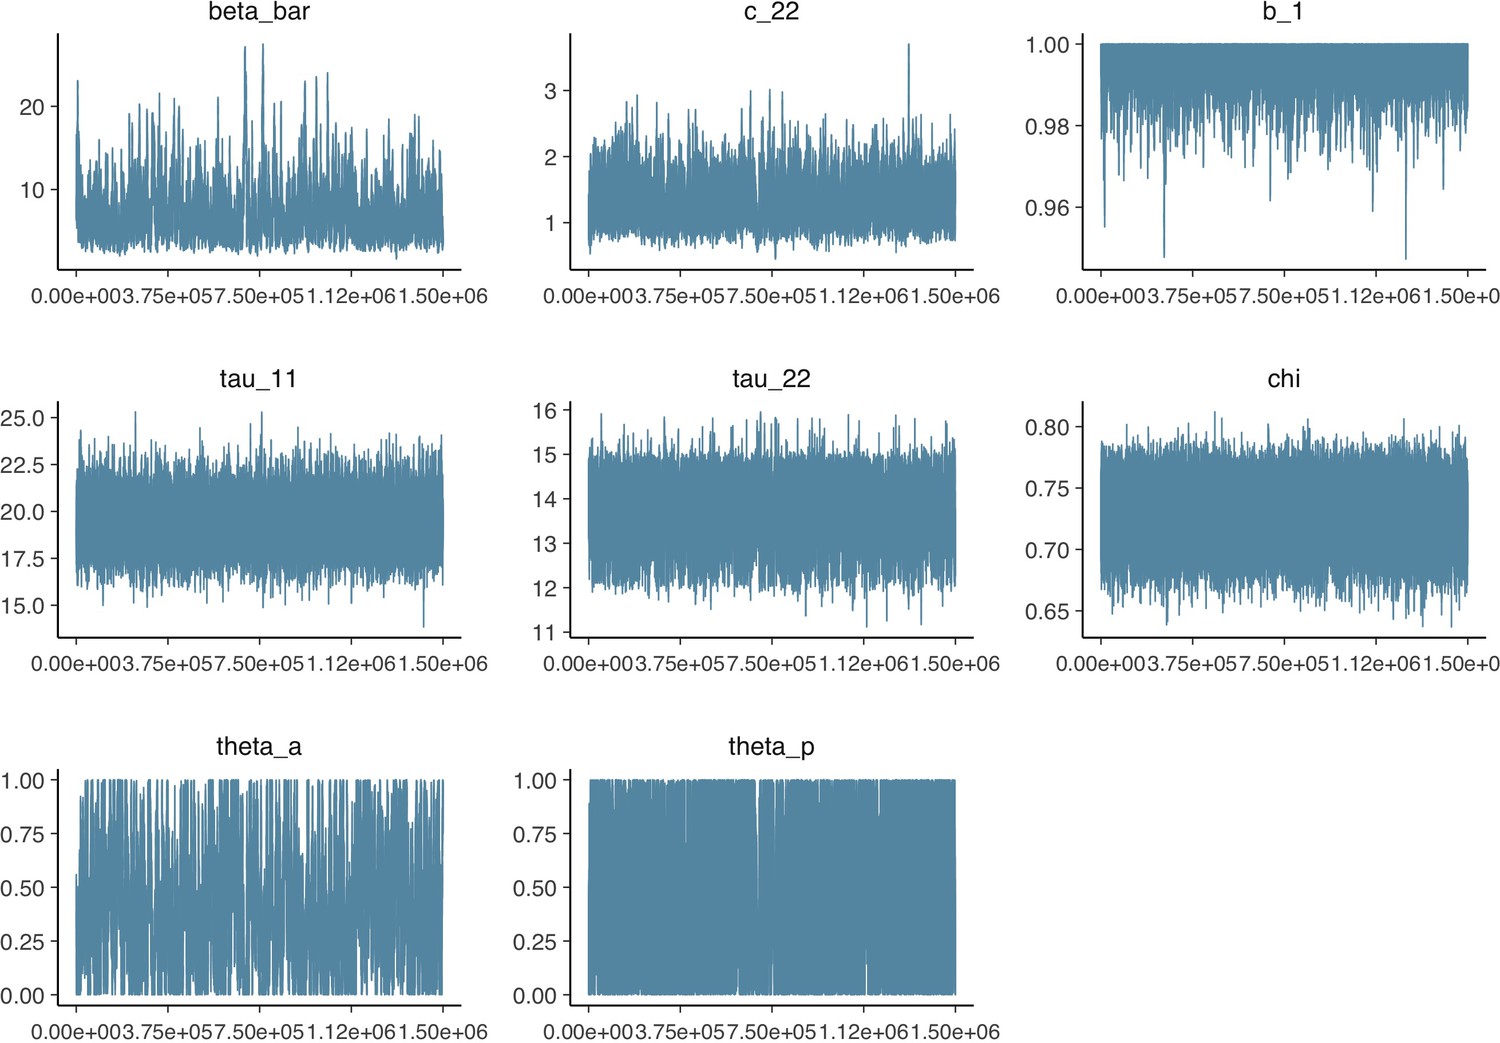
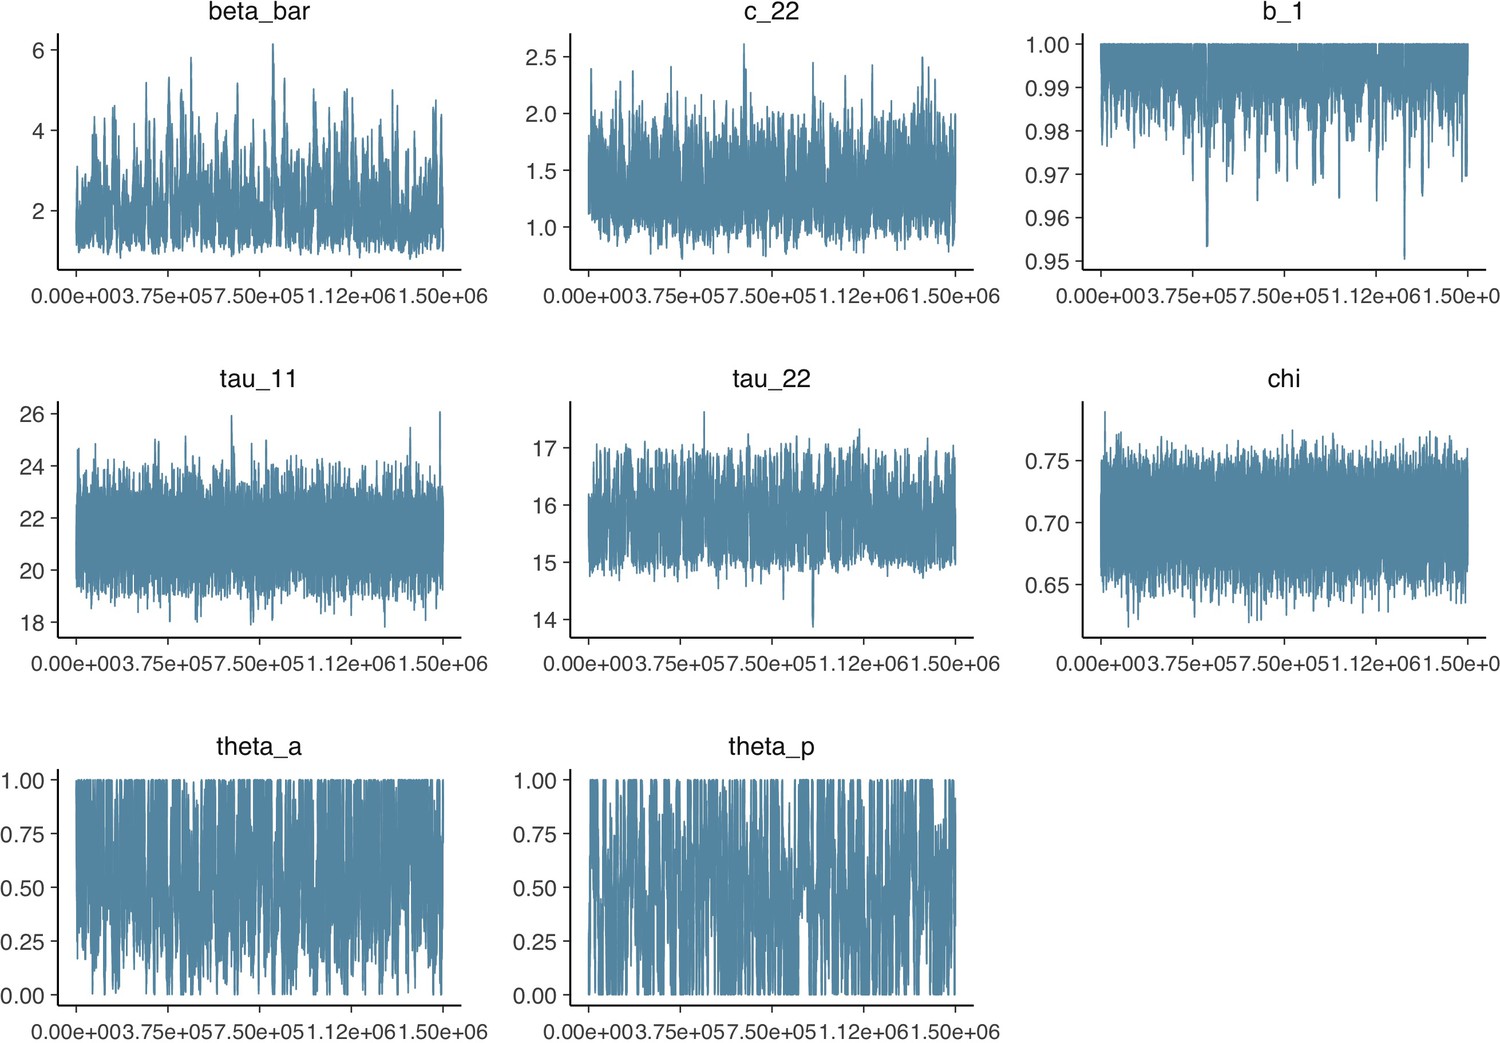
Parameter trace plot from model calibration.
Parameter trace plot showing all 1.5 million samples from the MCMC model calibration sequentially. See Table 2 for parameter definitions and descriptions.
Figure 2 with 1 supplement
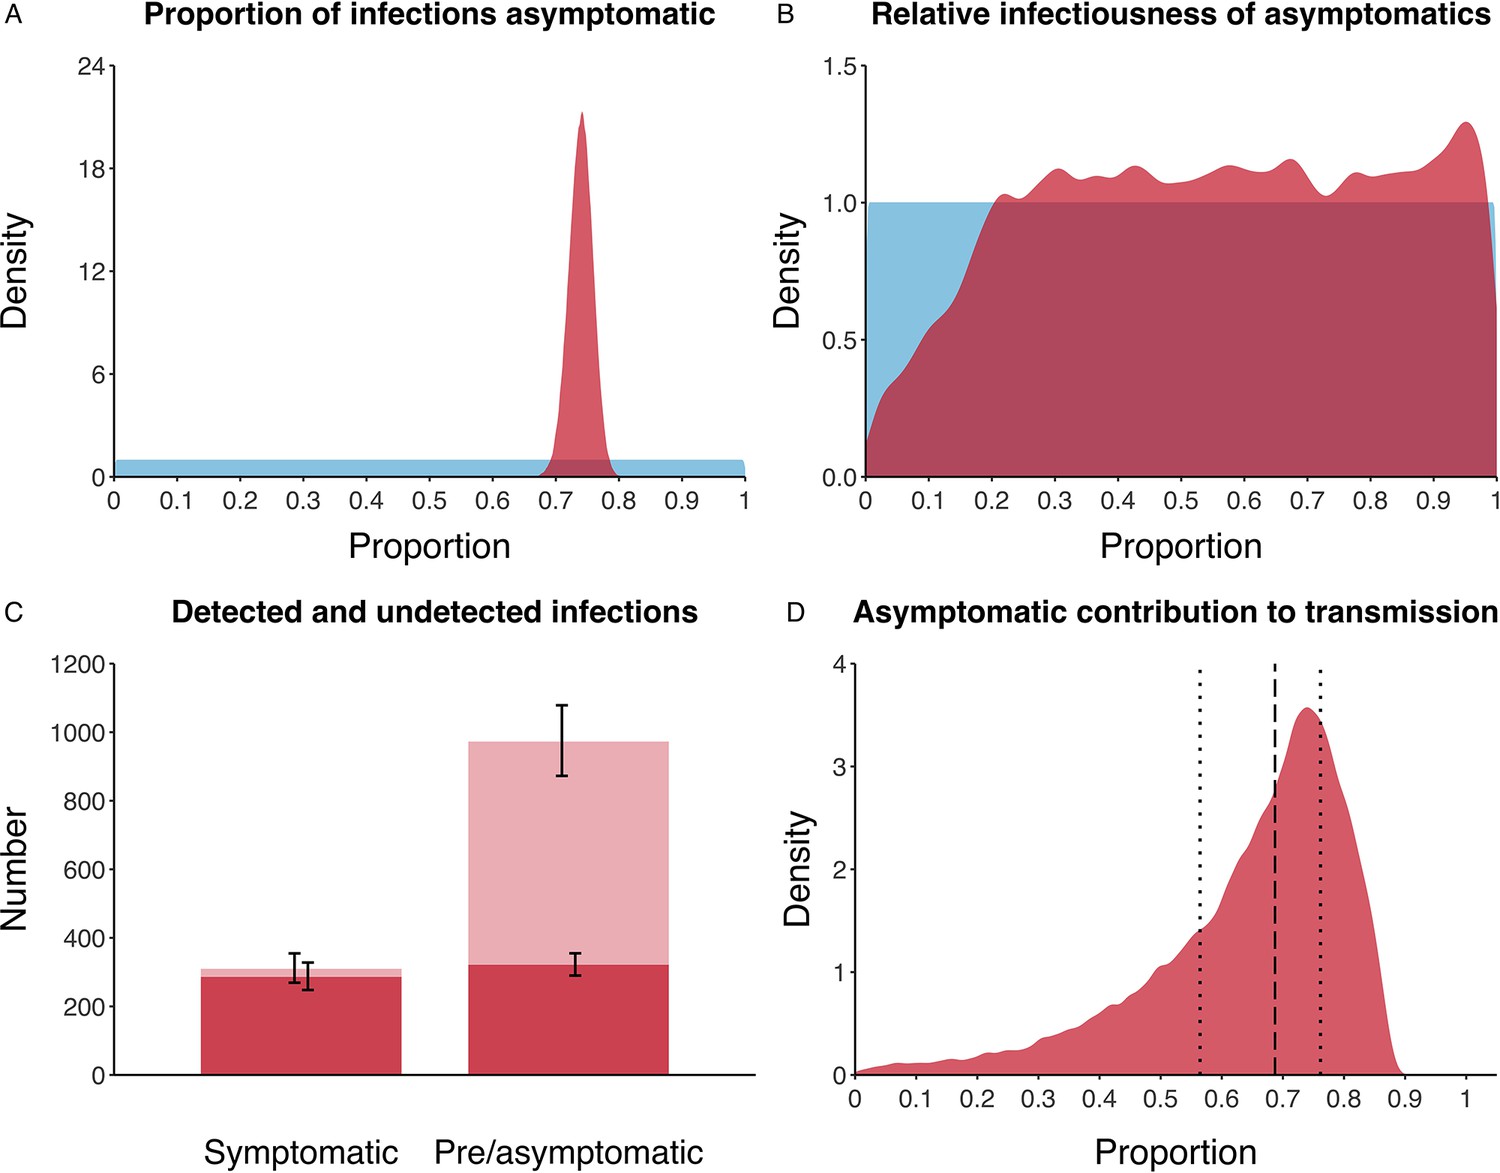
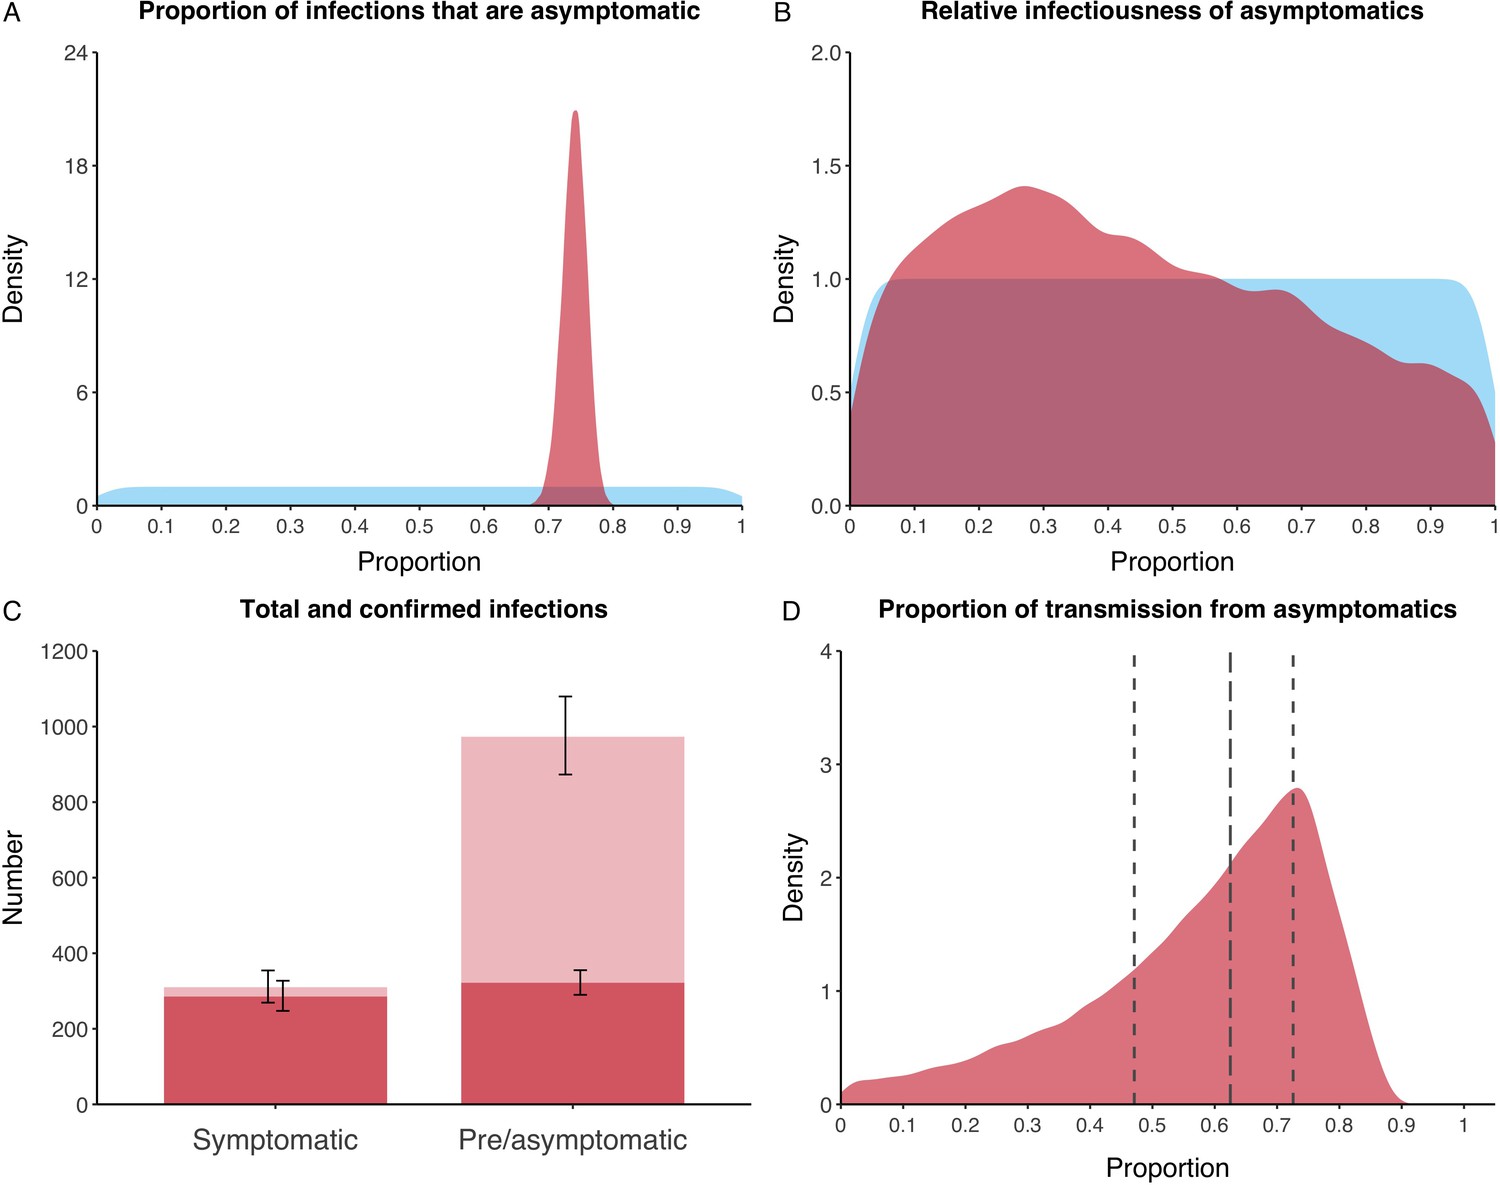
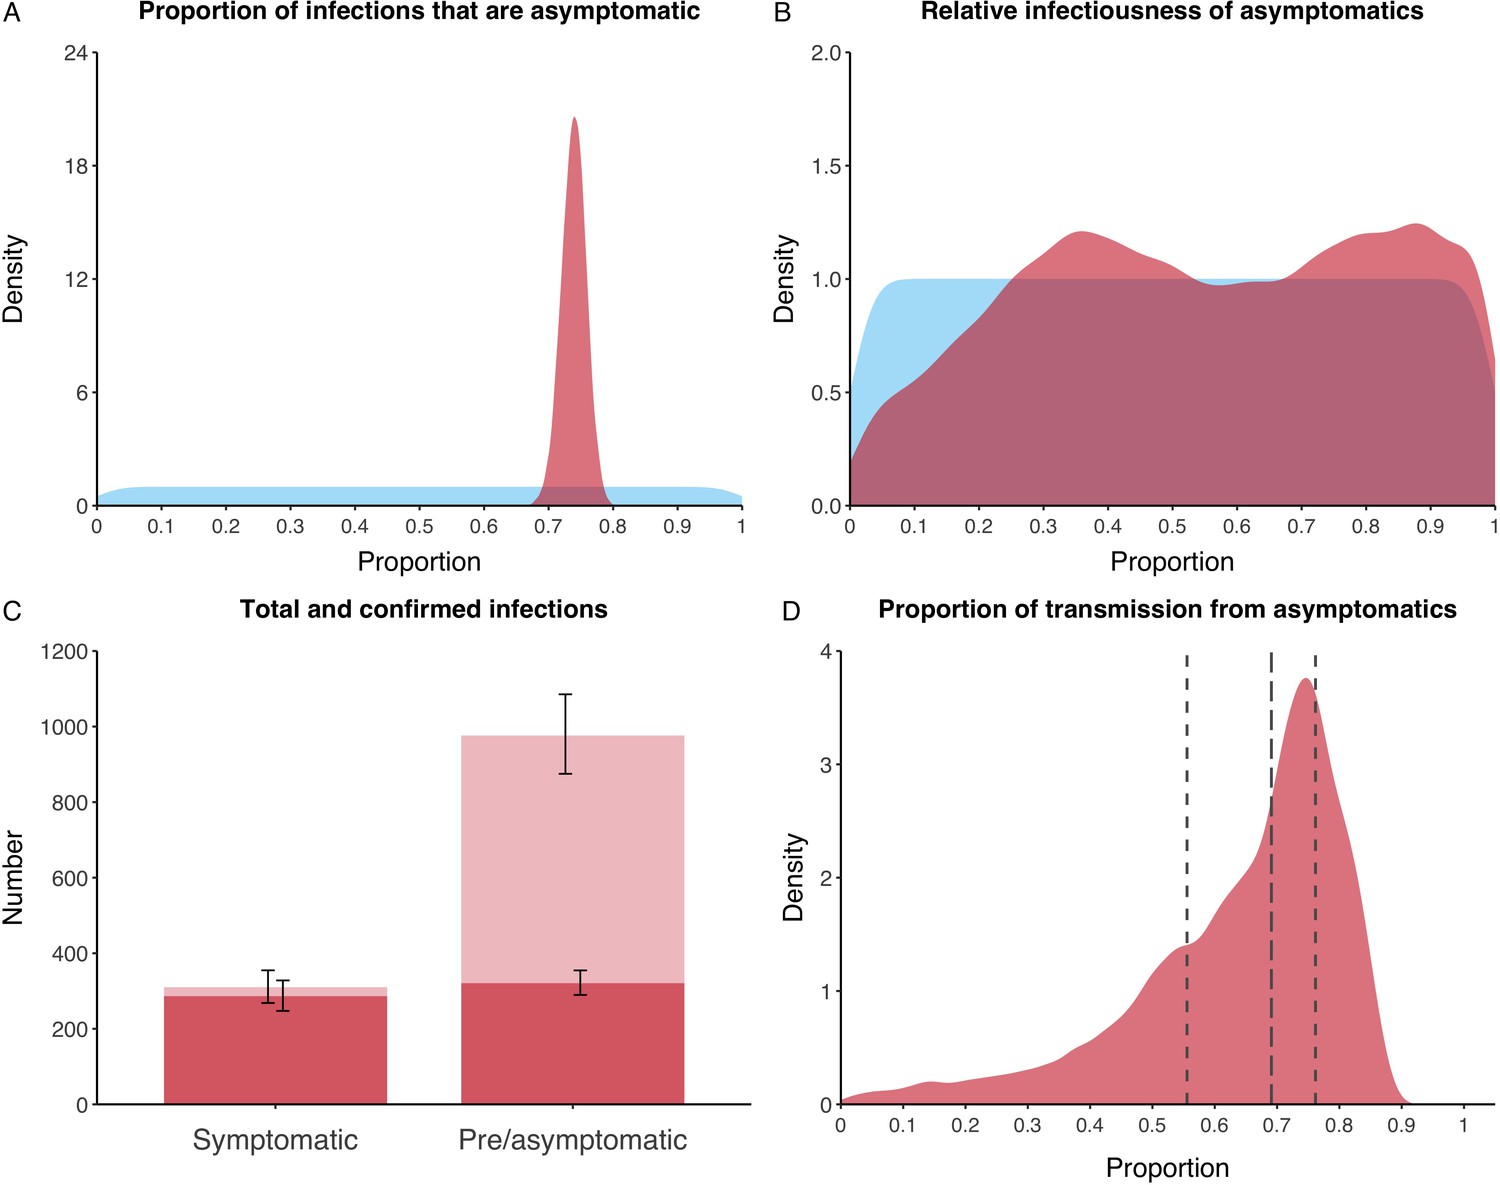
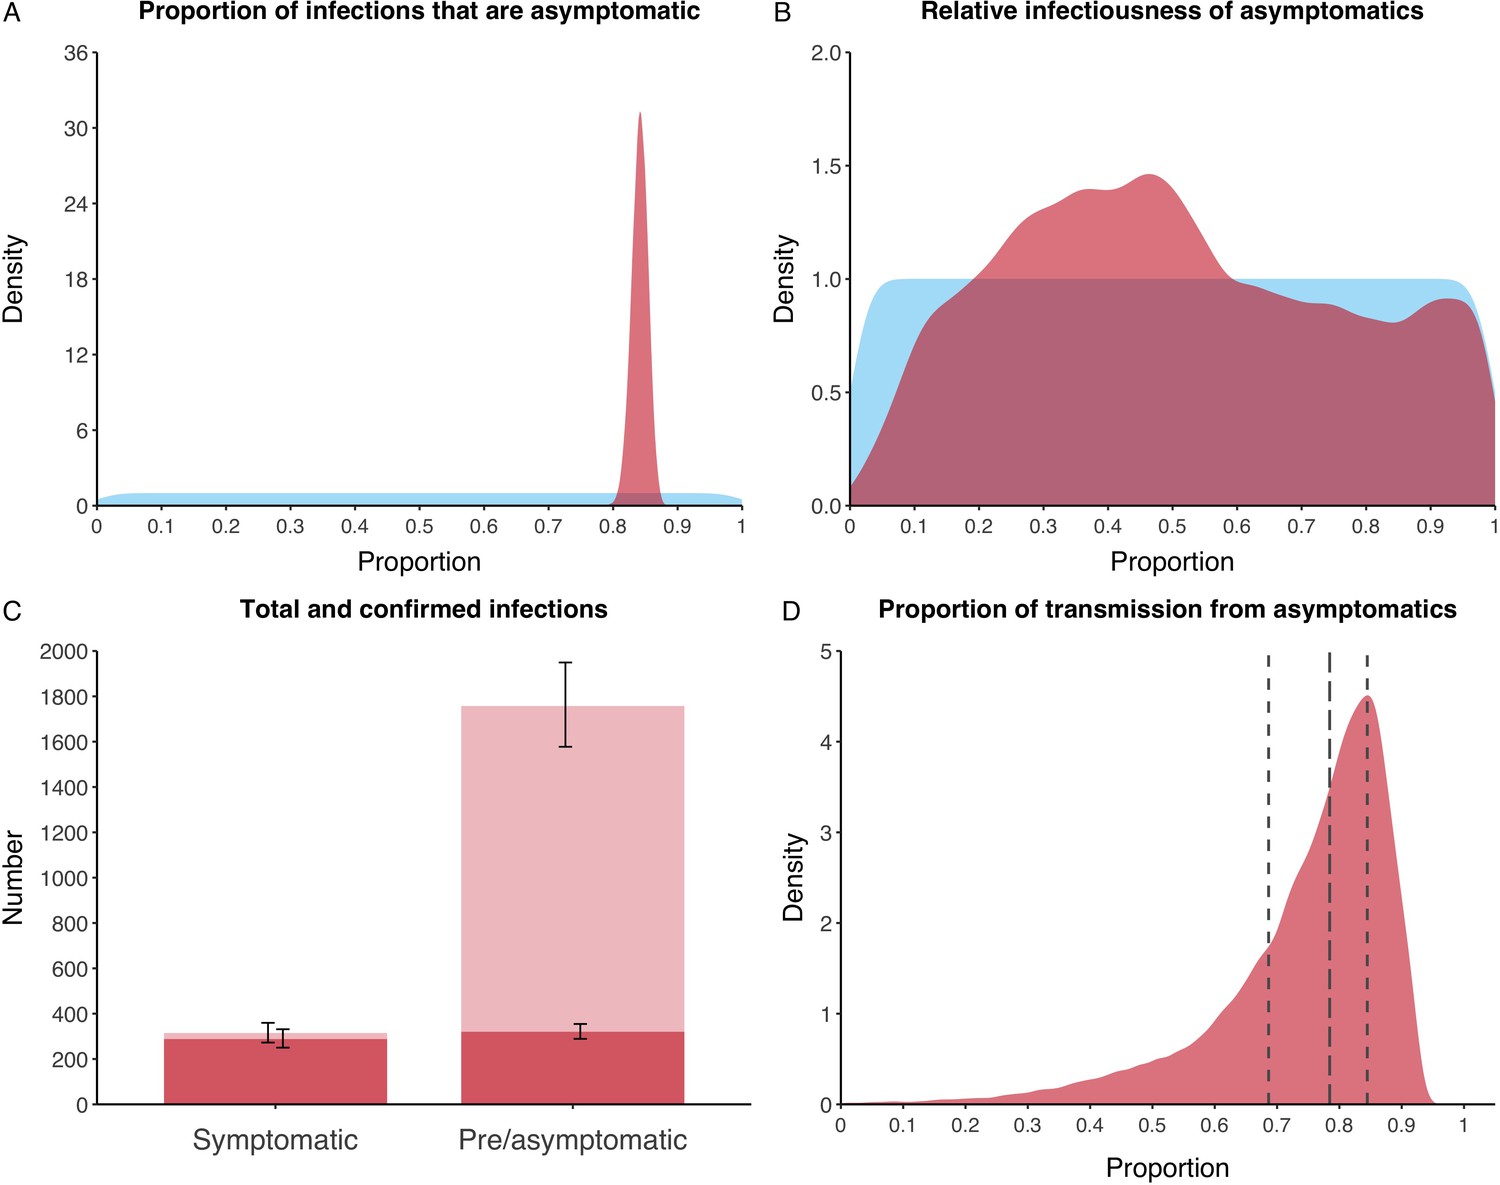
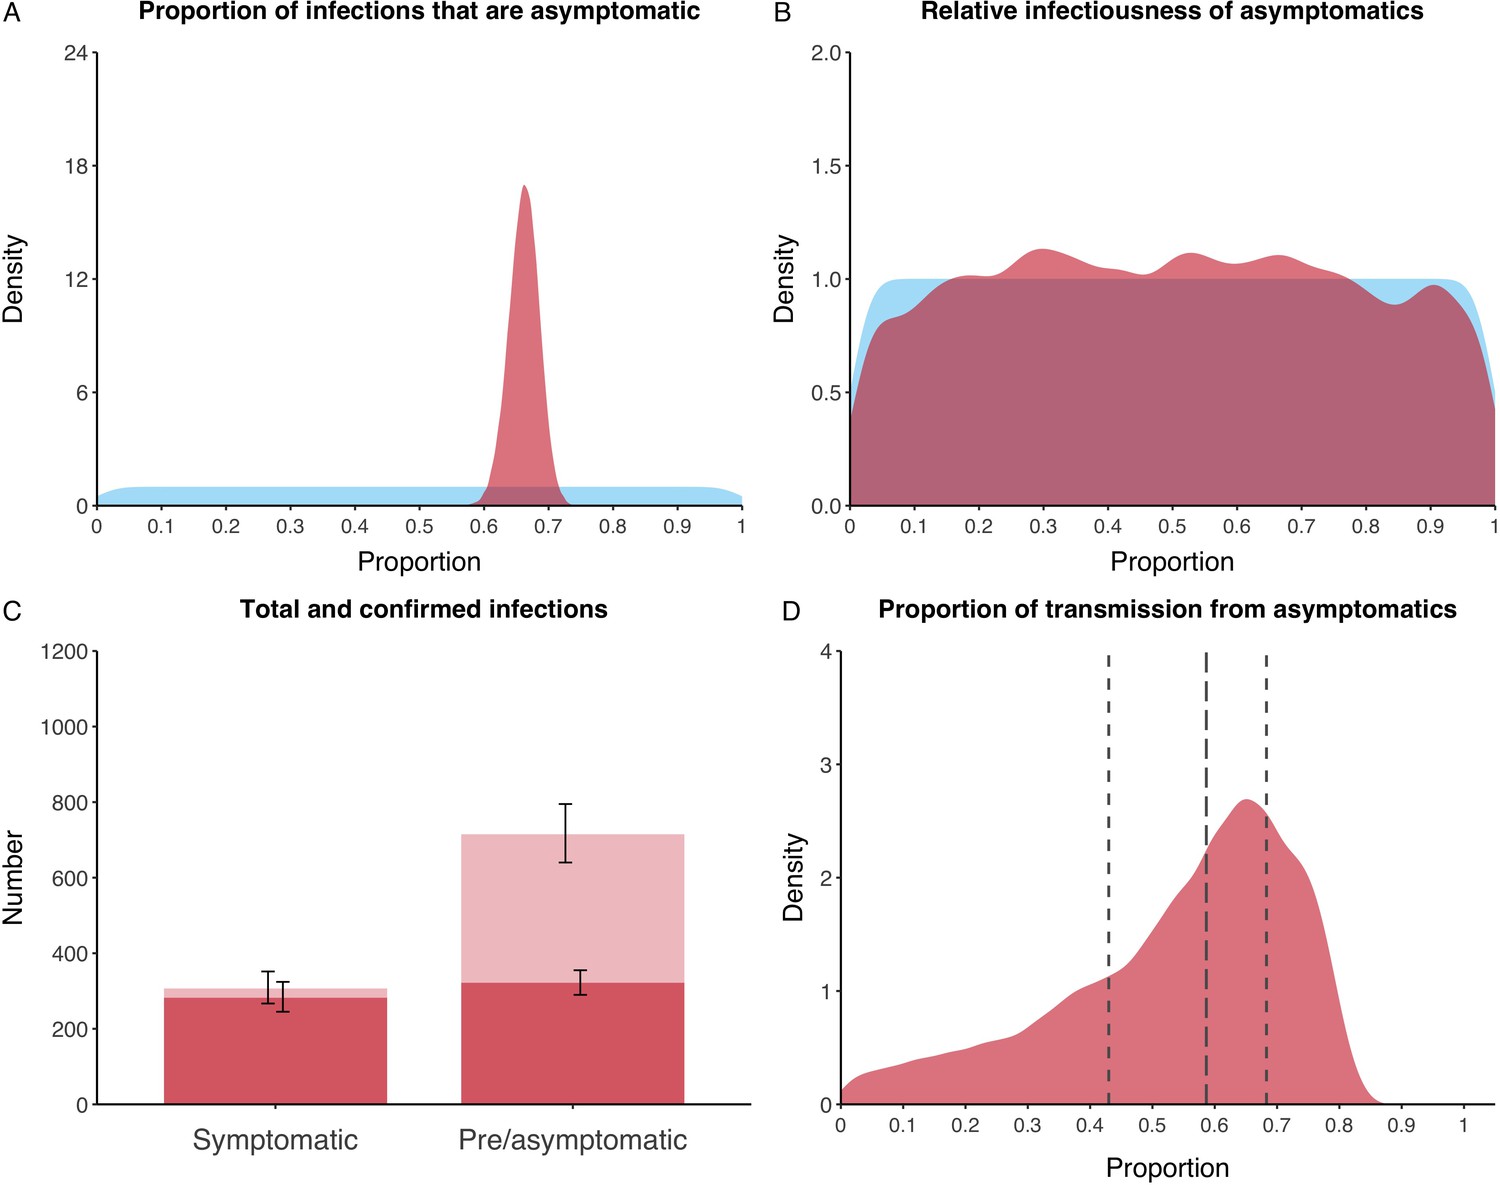
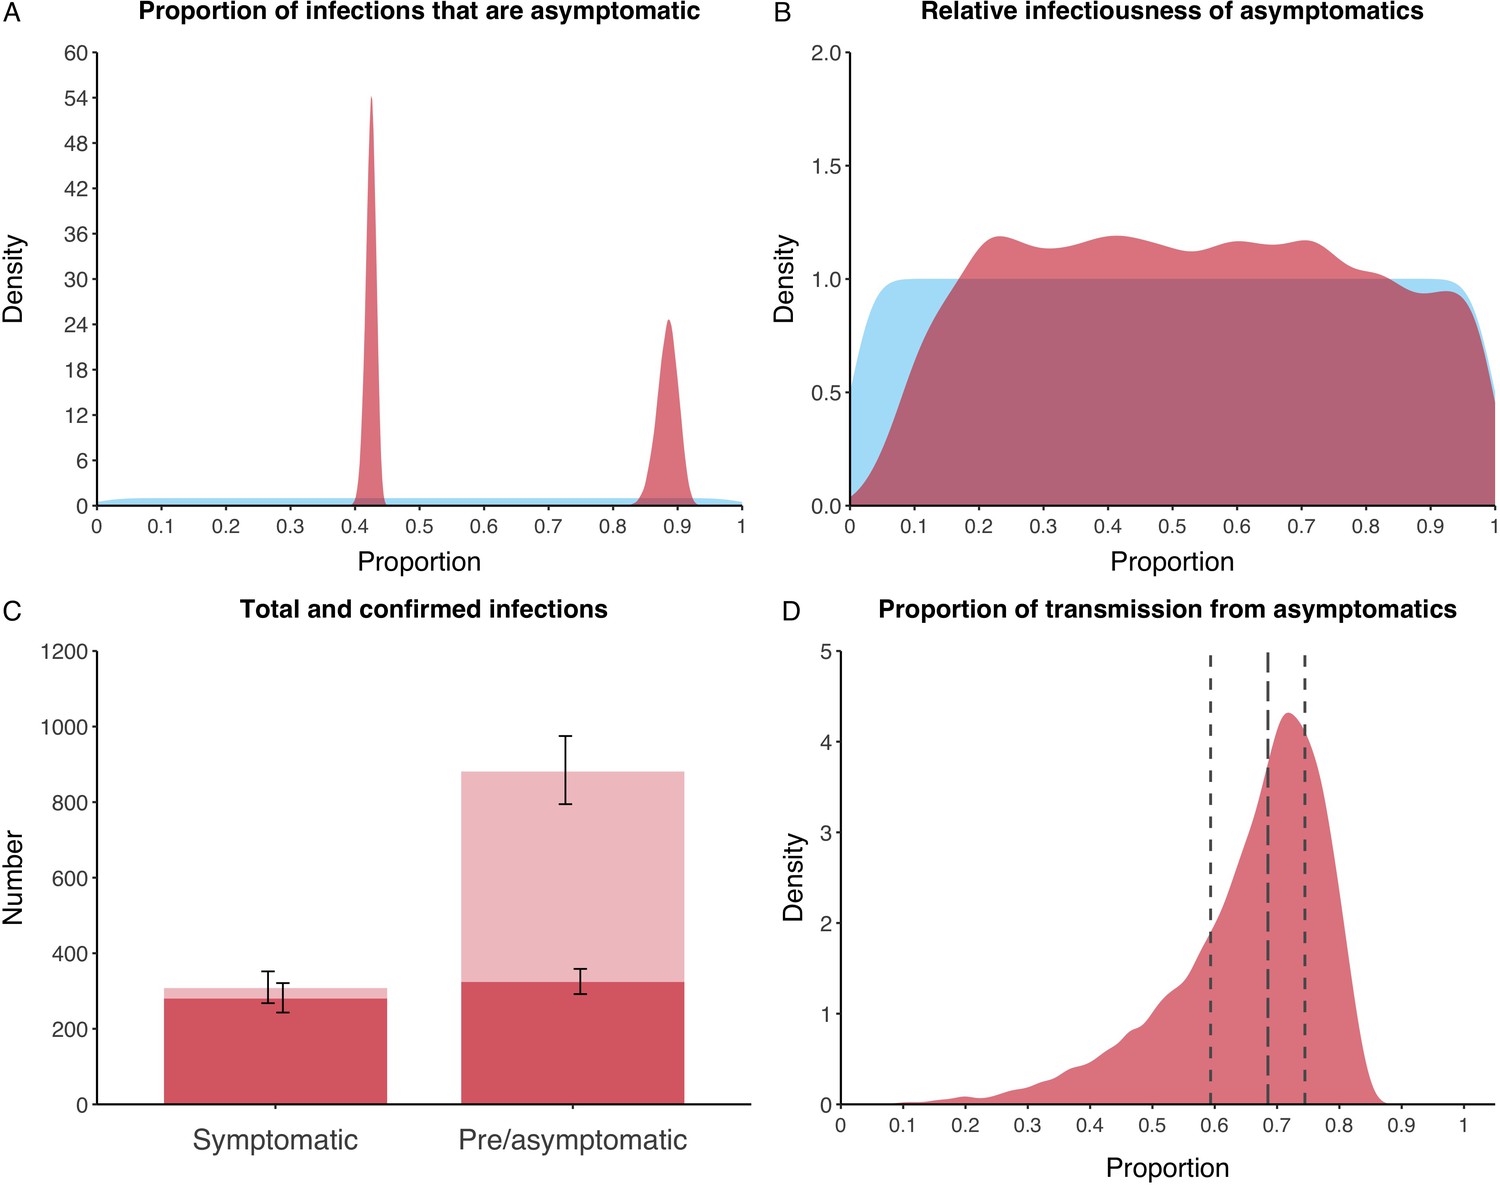
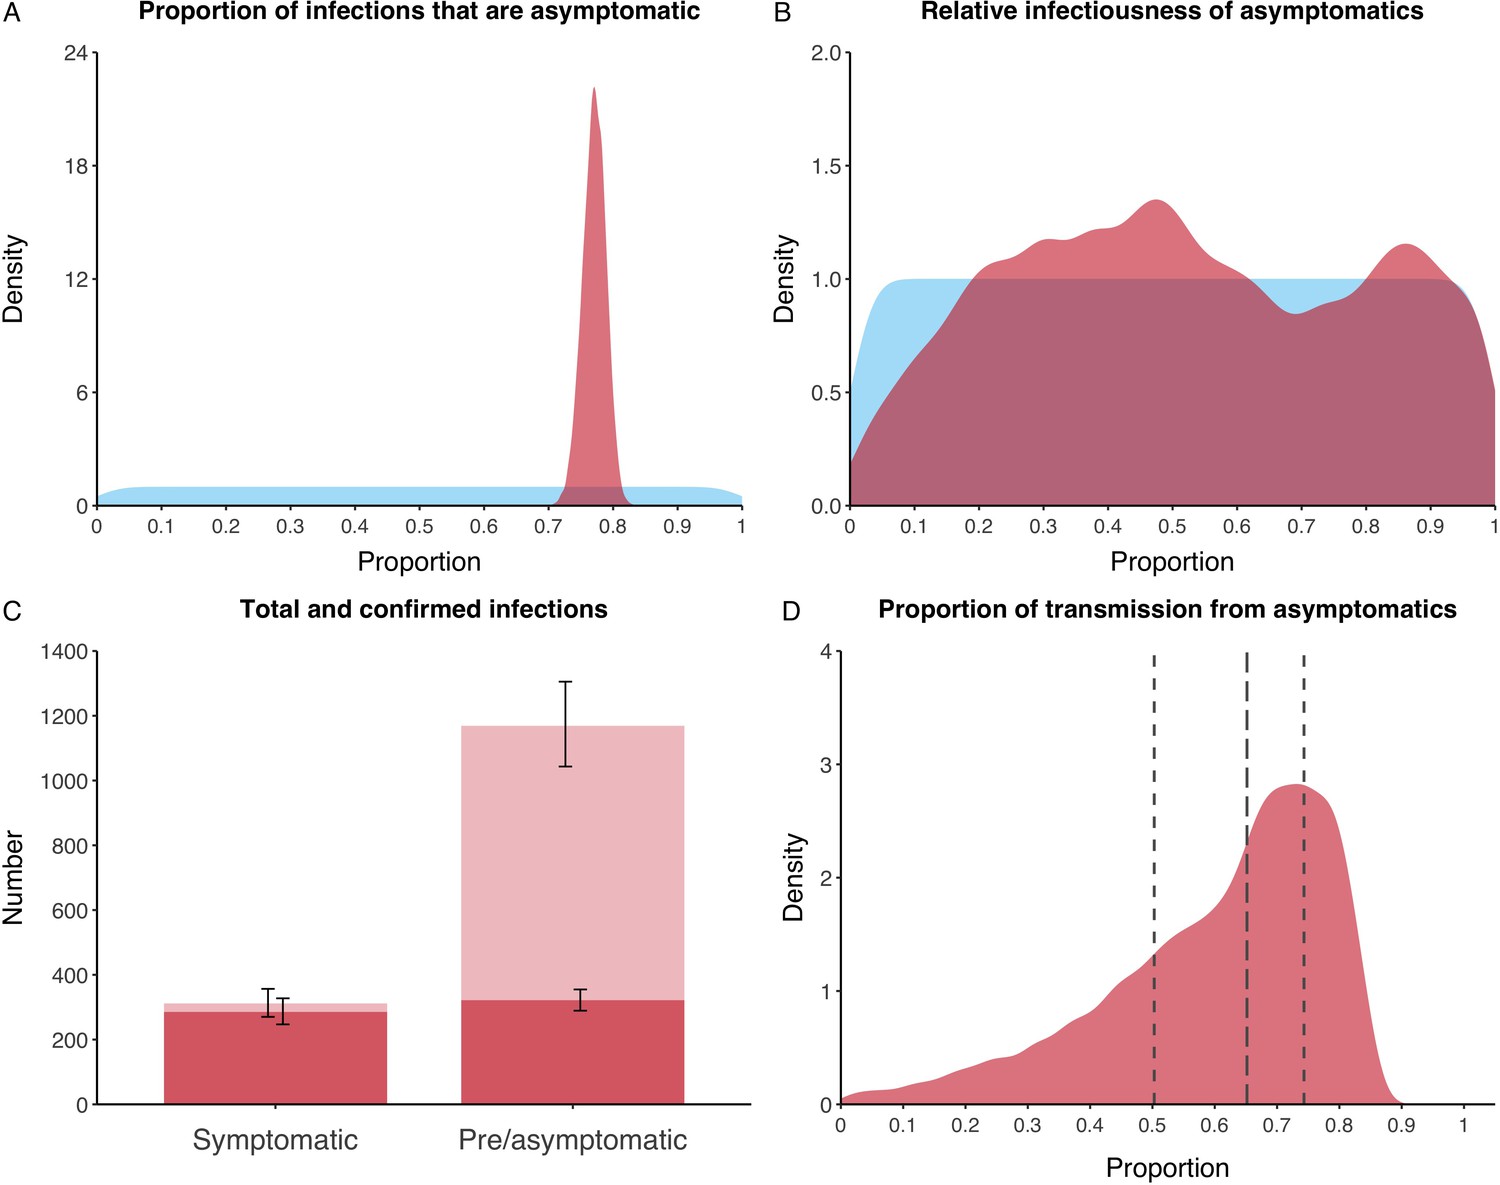
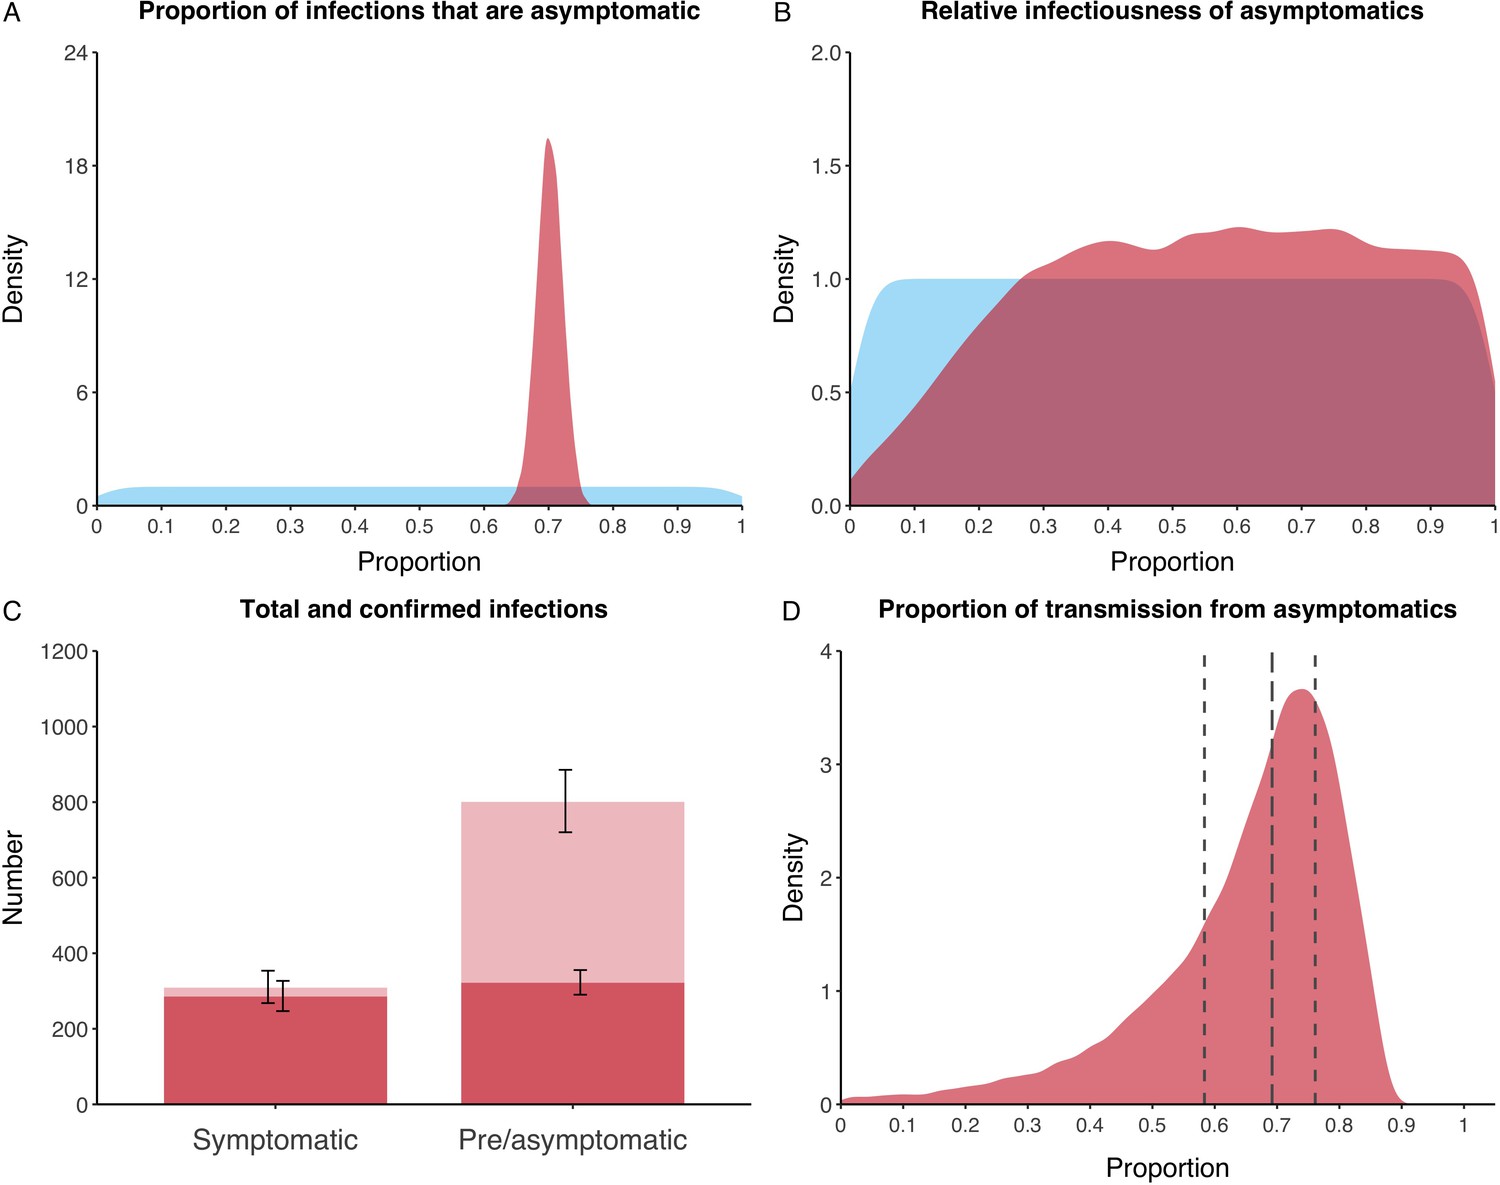
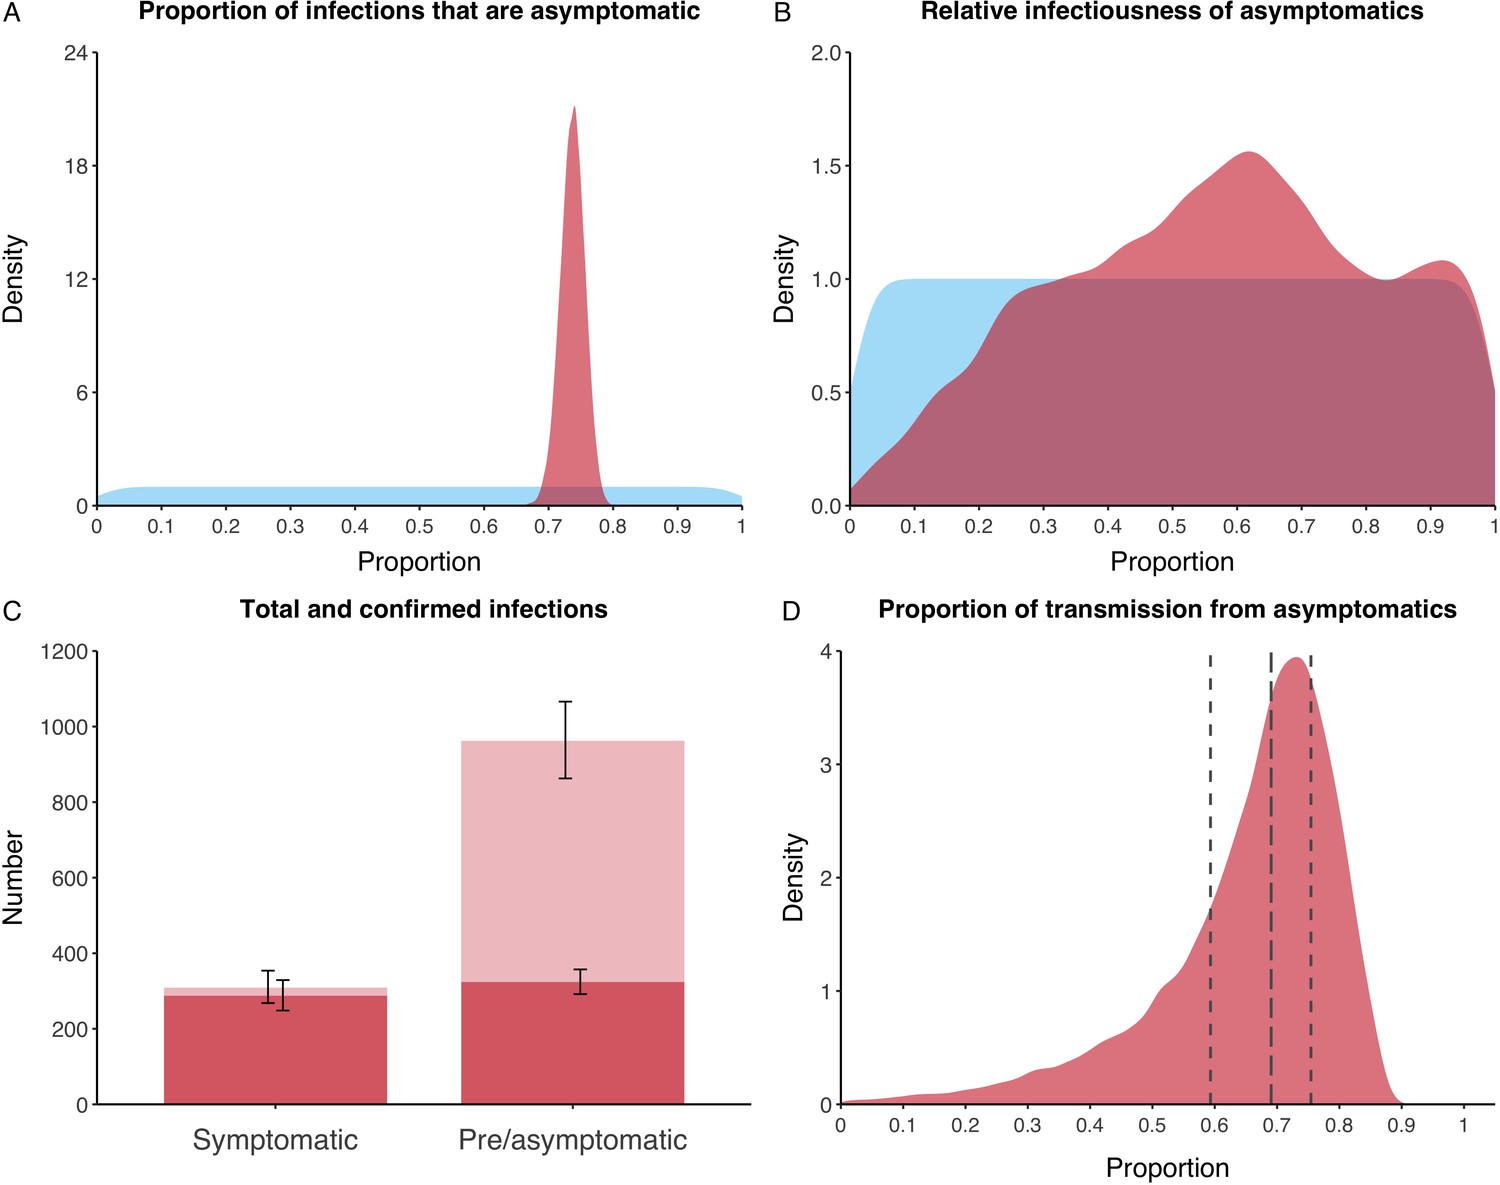
Proportion of infections that are asymptomatic and their contribution to transmission.
(A) Prior (blue) and posterior (red) probability distribution for the proportion progressing to asymptomatic infections. (B) Prior (blue) and posterior (red) probability distribution for the relative infectiousness of asymptomatic infections. (C) Number of pre- and asymptomatic infections and symptomatic cases detected (dark red) and not detected (light red) during the outbreak. Error bars indicate 95% posterior intervals. (D) Posterior probability distribution for proportion of transmission that is from asymptomatic individuals. Dashed and dotted lines show median and interquartile range, respectively.
Figure 2—figure supplement 1
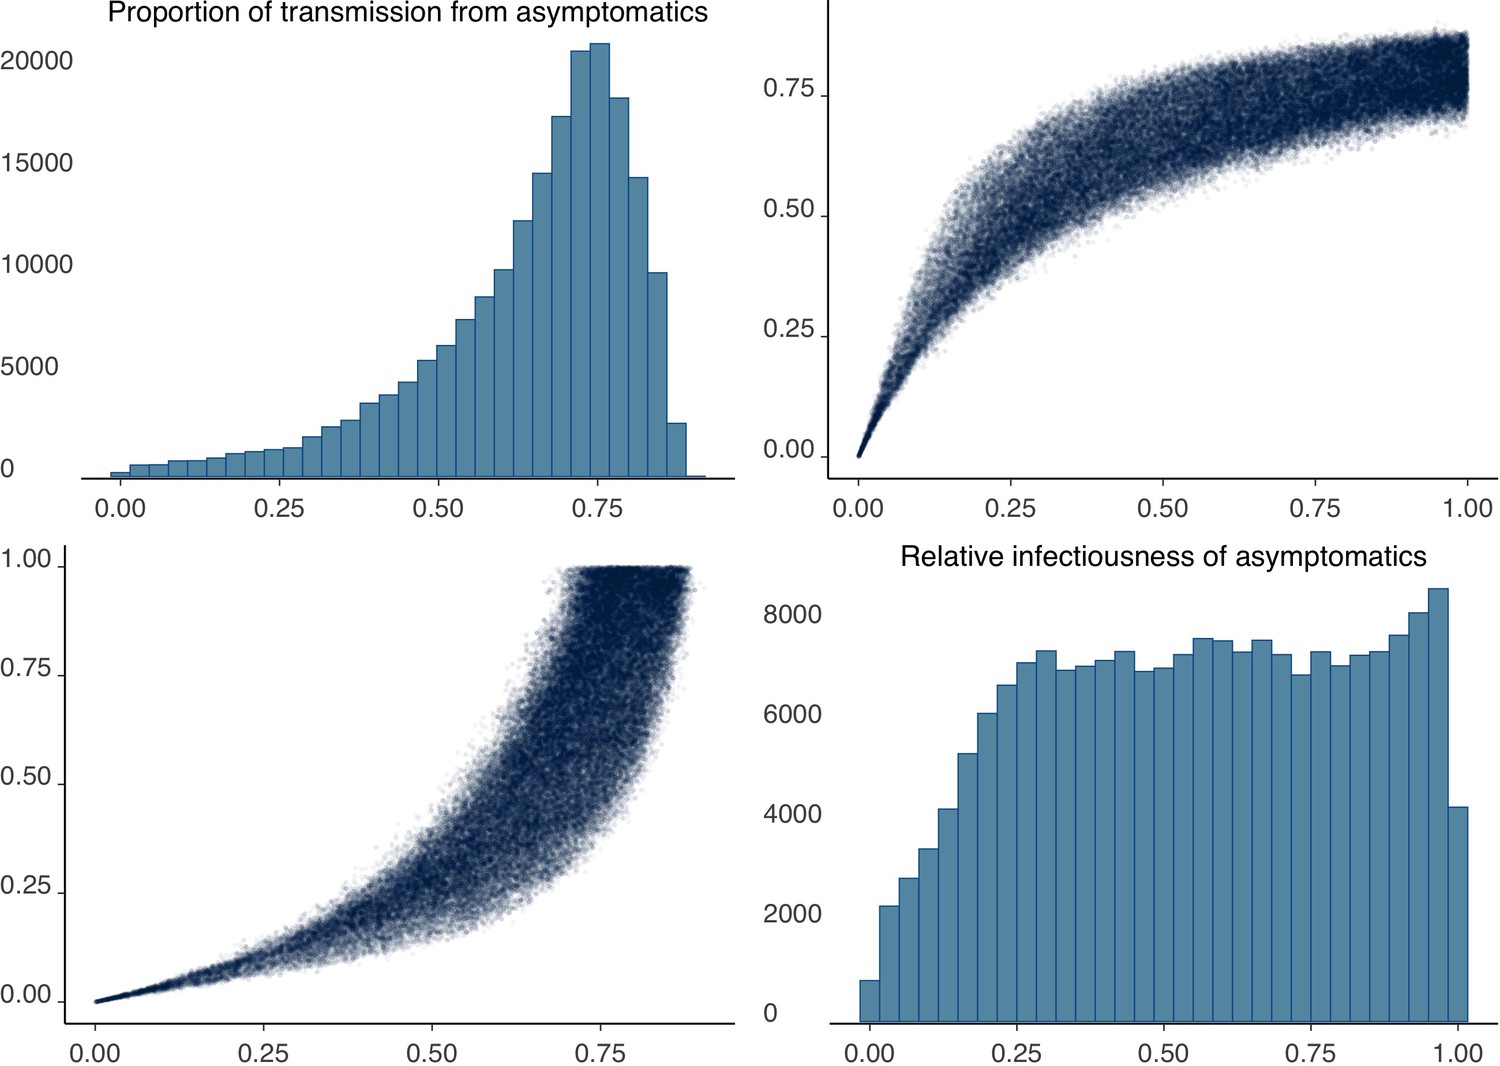
Non-linear correlation between relative infectiousness of asymptomatics and their contribution to transmission.
Correlation between the proportion of transmission from asymptomatics and their relative infectiousness, using 100,000 model runs sampled from the joint posterior distribution. The relationship is non-linear, such that a modest relative infectiousness can still lead to a significant contribution to transmission.
Figure 3
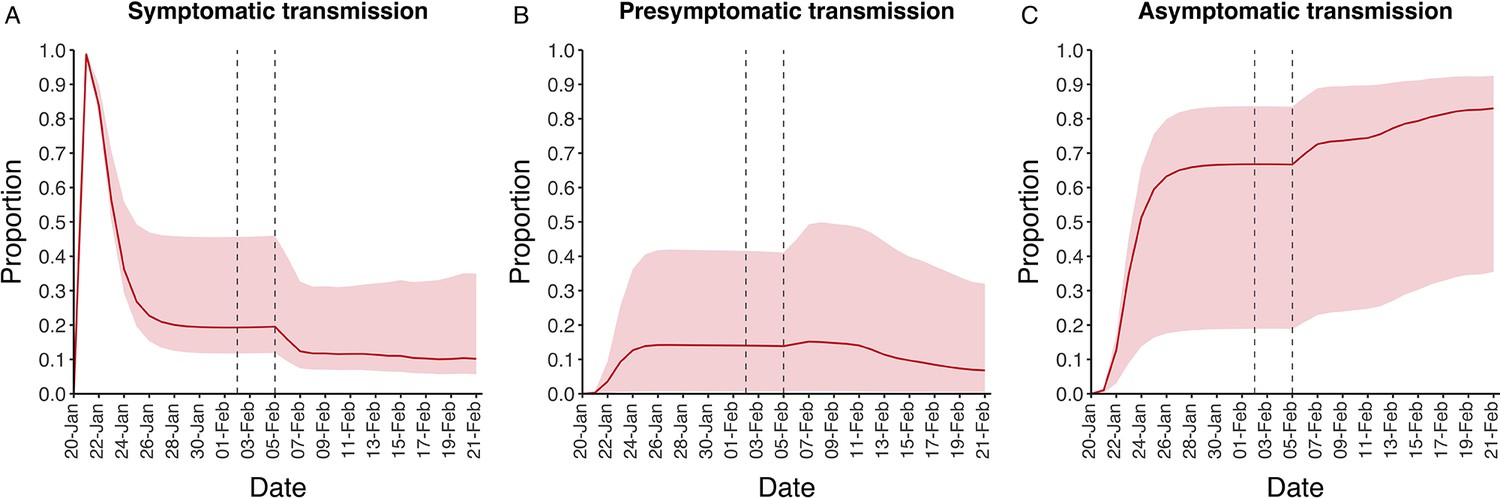
Instantaneous proportion of transmission from symptomatic, presymptomatic and asymptomatic individuals.
Instantaneous proportion of transmission from symptomatic (A), presymptomatic (B) and asymptomatic (C) individuals over the course of the epidemic, following the introduction of a single symptomatic individual on 20th Jan. Red lines = median, shading = 95% posterior interval. Two vertical lines show the date of the first confirmed diagnosis (left) and the start of quarantine measures (right).
Appendix 1—figure 1
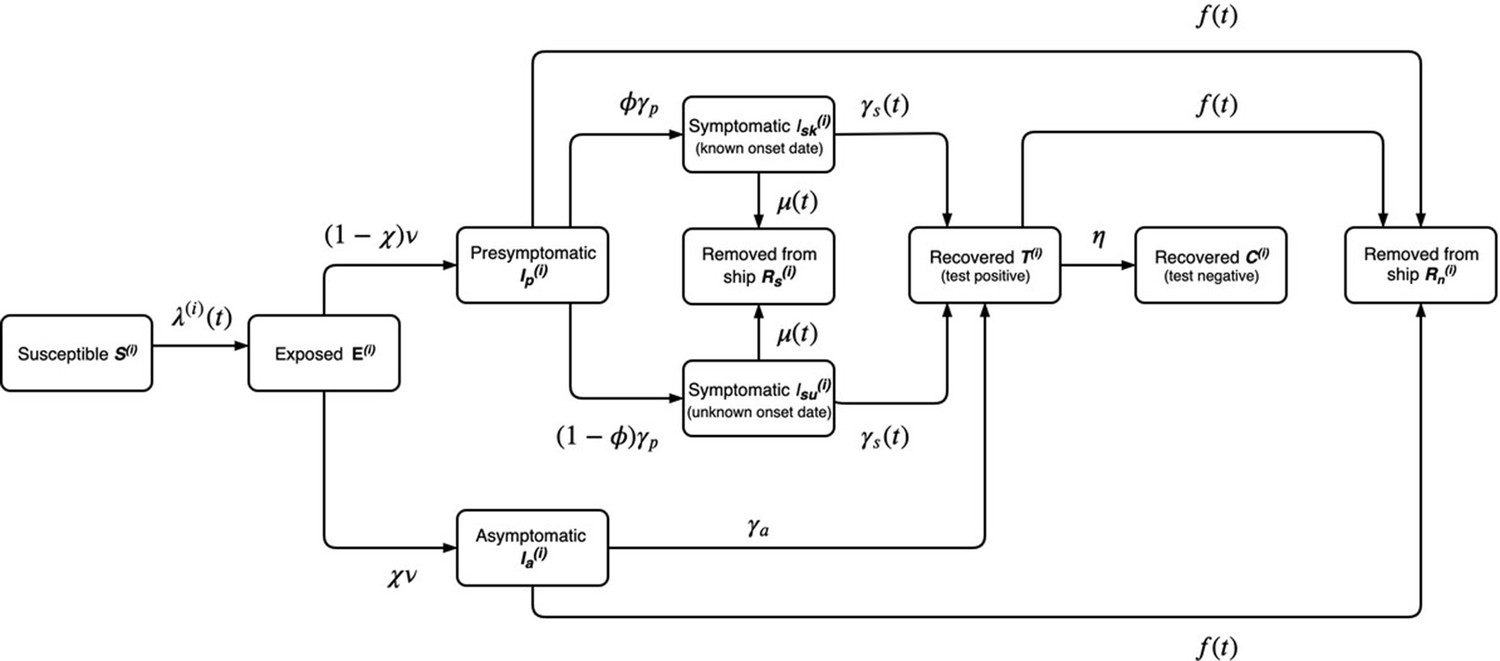
Model diagram for the outbreak onboard the Diamond Princess cruise ship described in the main paper.
The annotated transition parameters are defined in Table 2 in the main article and detailed further, below. The model is stratified by i = passengers or crew. The asymptomatic, presymptomatic and symptomatic states are all assumed to be infectious and individuals would test positive during symptom-based or symptom-agnostic testing. Individuals that recover are also assumed to test positive for an average of 1 week after they are no longer infectious.
Appendix 2—figure 1
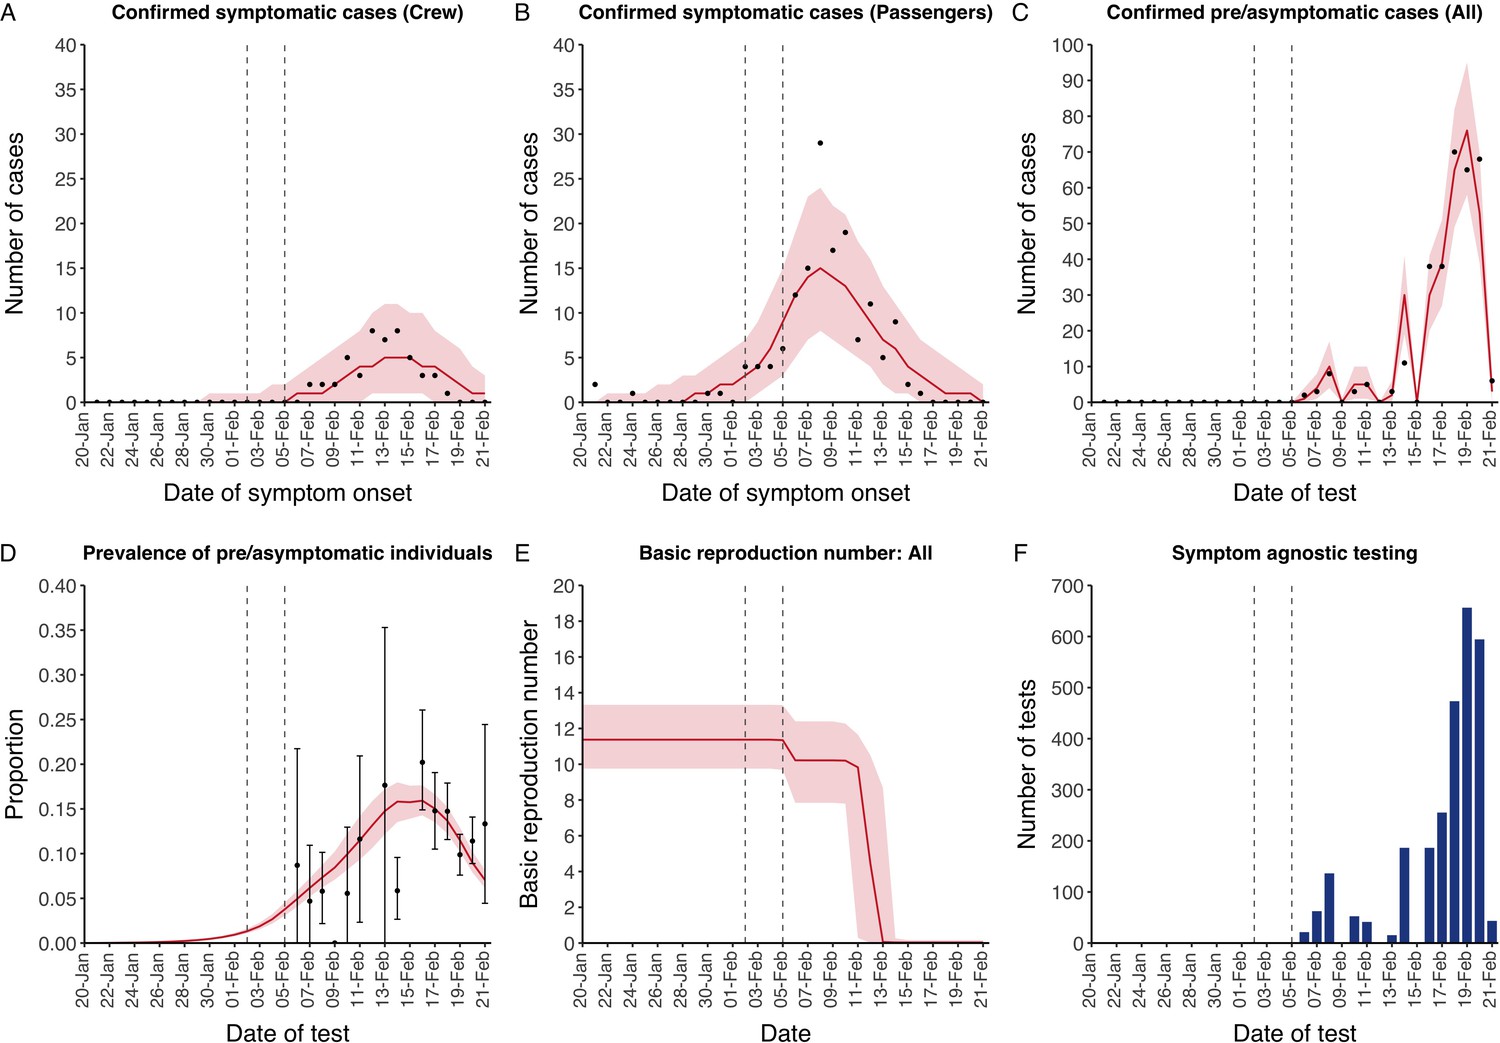
Data from the Diamond Princess and model calibration.
Figure shows data from the Diamond Princess (points (A–D) and bars (F)) and results from model calibration. Red lines = median, shading = 95% posterior plus observational interval (A–C) and 95% posterior interval only (D–E). Two vertical lines show the date of the first confirmed diagnosis (left) and the start of quarantine measures (right). (A–B) show confirmed symptomatic cases among crew (A) and passengers (B) with a reported date of onset; (C) shows confirmed pre- or asymptomatic individuals by test date; (D) shows the prevalence of pre/asymptomatic individuals by test date. Points and error bars show point estimates and 95% confidence intervals; (E) shows the basic reproduction number over time for the ship as a whole, reflecting the drop in contact rates (F) shows the number of tests administered irrespective of symptoms, by test date.
Appendix 2—figure 2
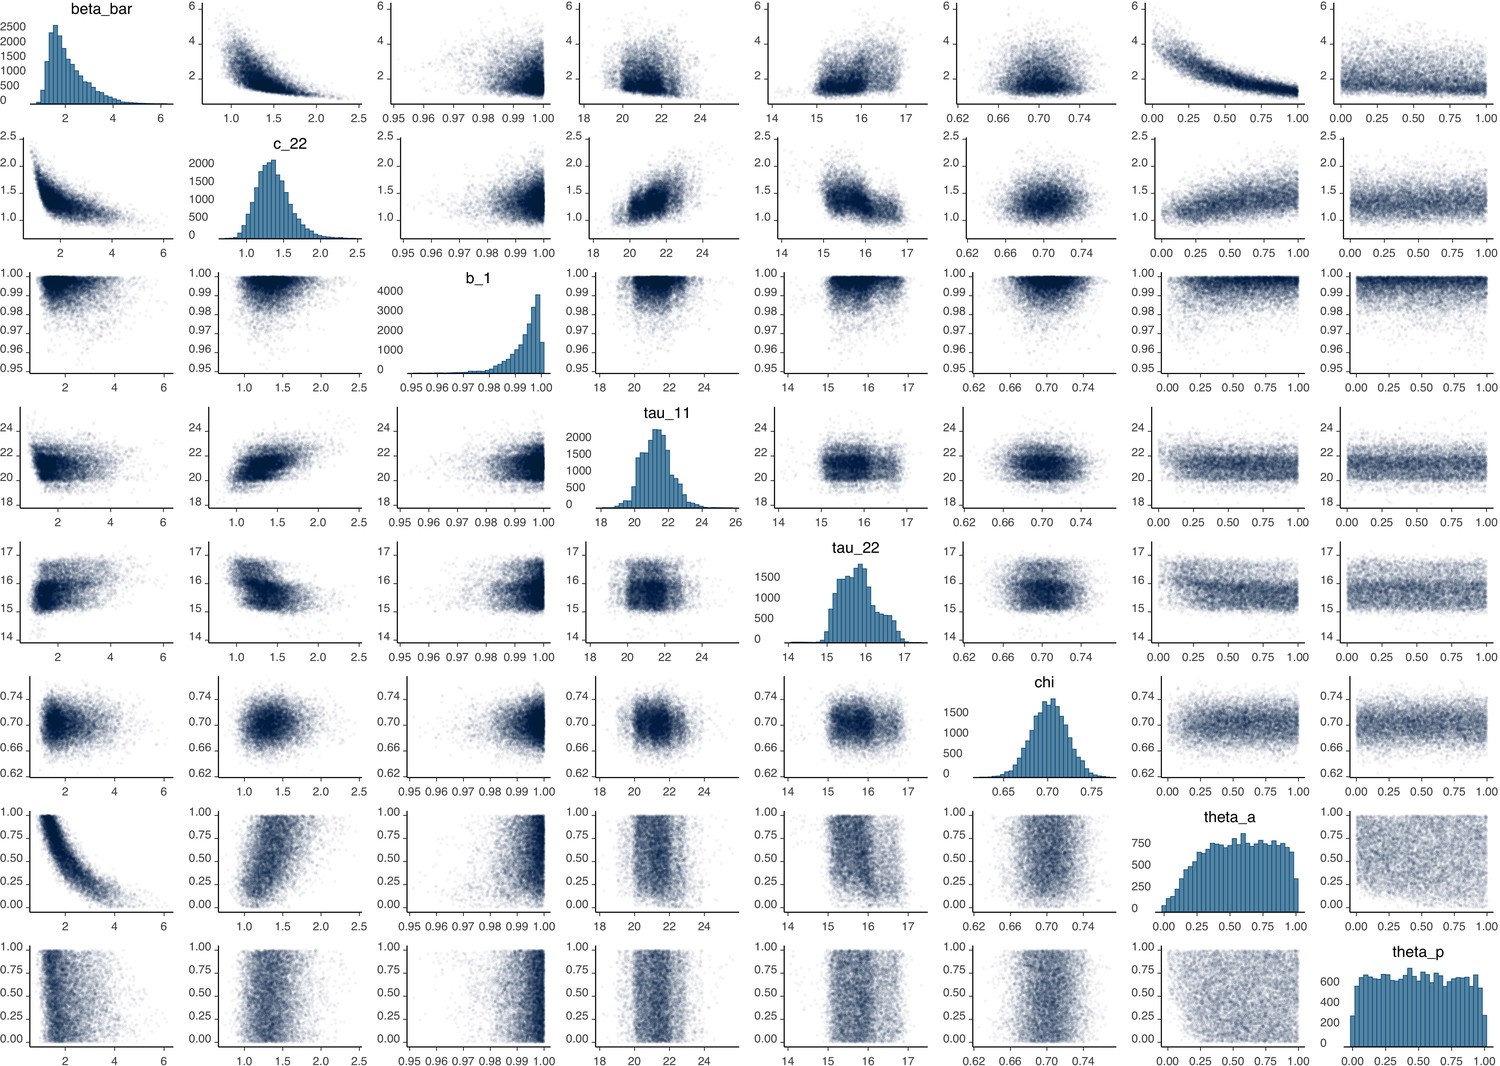
Parameter correlation plot containing parameter values from 10,000 samples of the joint posterior distribution found during MCMC model calibration.
See Table 2 in the main article for parameter definitions and descriptions.
Appendix 2—figure 3
Parameter trace plot showing all 1.5 million samples from the MCMC model calibration sequentially.
See Table 2 in the main article for parameter definitions and descriptions.
Appendix 2—figure 4
Data from the Diamond Princess and model calibration.
Figure shows data from the Diamond Princess (points (A–D) and bars (F)) and results from model calibration. Red lines = median, shading = 95% posterior plus observational interval (A–C) and 95% posterior interval only (D–E). Two vertical lines show the date of the first confirmed diagnosis (left) and the start of quarantine measures (right). (A–B) show confirmed symptomatic cases among crew (A) and passengers (B) with a reported date of onset; (C) shows confirmed pre- or asymptomatic individuals by test date; (D) shows the prevalence of pre/asymptomatic individuals by test date. Points and error bars show point estimates and 95% confidence intervals; (E) shows the basic reproduction number over time for the ship as a whole, reflecting the drop in contact rates (F) shows the number of tests administered irrespective of symptoms, by test date.
Appendix 2—figure 5
Proportion of infections that are asymptomatic and their contribution to transmission.
(A) Prior (blue) and posterior (red) probability distribution for the proportion progressing to asymptomatic infections. (B) Prior (blue) and posterior (red) probability distribution for the relative infectiousness of asymptomatic infections. (C) Number of pre- and asymptomatic infections and symptomatic cases detected (dark red) and not detected (light red) during the outbreak. Error bars indicate 95% posterior intervals. (D) Posterior probability distribution for proportion of transmission that is from asymptomatic individuals. Dashed and dotted lines show median and interquartile range respectively.
Appendix 2—figure 6
Parameter correlation plot containing parameter values from 10,000 samples of the joint posterior distribution found during MCMC model calibration.
See Table 2 in the main article for parameter definitions and descriptions.
Appendix 2—figure 7
Parameter trace plot showing all 1.5 million samples from the MCMC model calibration sequentially.
See Table 2 in the main article for parameter definitions and descriptions.
Appendix 2—figure 8
Data from the Diamond Princess and model calibration.
Figure shows data from the Diamond Princess (points (A–D) and bars (F)) and results from model calibration. Red lines = median, shading = 95% posterior plus observational interval (A–C) and 95% posterior interval only (D–E). Two vertical lines show the date of the first confirmed diagnosis (left) and the start of quarantine measures (right). (A–B) show confirmed symptomatic cases among crew (A) and passengers (B) with a reported date of onset; (C) shows confirmed pre- or asymptomatic individuals by test date; (D) shows the prevalence of pre/asymptomatic individuals by test date. Points and error bars show point estimates and 95% confidence intervals; (E) shows the basic reproduction number over time for the ship as a whole, reflecting the drop in contact rates (F) shows the number of tests administered irrespective of symptoms, by test date.
Appendix 2—figure 9
Proportion of infections that are asymptomatic and their contribution to transmission.
(A) Prior (blue) and posterior (red) probability distribution for the proportion progressing to asymptomatic infections. (B) Prior (blue) and posterior (red) probability distribution for the relative infectiousness of asymptomatic infections. (C) Number of pre- and asymptomatic infections and symptomatic cases detected (dark red) and not detected (light red) during the outbreak. Error bars indicate 95% posterior intervals. (D) Posterior probability distribution for proportion of transmission that is from asymptomatic individuals. Dashed and dotted lines show median and interquartile range respectively.
Appendix 2—figure 10
Parameter correlation plot containing parameter values from 10,000 samples of the joint posterior distribution found during MCMC model calibration.
See Table 2 in the main article for parameter definitions and descriptions.
Appendix 2—figure 11
Parameter trace plot showing all 1.5 million samples from the MCMC model calibration sequentially.
See Table 2 in the main article for parameter definitions and descriptions.
Appendix 2—figure 12
Data from the Diamond Princess and model calibration.
Figure shows data from the Diamond Princess (points (A–D) and bars (F)) and results from model calibration. Red lines = median, shading = 95% posterior plus observational interval (A–C) and 95% posterior interval only (D–E). Two vertical lines show the date of the first confirmed diagnosis (left) and the start of quarantine measures (right). (A–B) show confirmed symptomatic cases among crew (A) and passengers (B) with a reported date of onset; (C) shows confirmed pre- or asymptomatic individuals by test date; (D) shows the prevalence of pre/asymptomatic individuals by test date. Points and error bars show point estimates and 95% confidence intervals; (E) shows the basic reproduction number over time for the ship as a whole, reflecting the drop in contact rates (F) shows the number of tests administered irrespective of symptoms, by test date.
Appendix 2—figure 13
Proportion of infections that are asymptomatic and their contribution to transmission.
(A) Prior (blue) and posterior (red) probability distribution for the proportion progressing to asymptomatic infections. (B) Prior (blue) and posterior (red) probability distribution for the relative infectiousness of asymptomatic infections. (C) Number of pre- and asymptomatic infections and symptomatic cases detected (dark red) and not detected (light red) during the outbreak. Error bars indicate 95% posterior intervals. (D) Posterior probability distribution for proportion of transmission that is from asymptomatic individuals. Dashed and dotted lines show median and interquartile range respectively.
Appendix 2—figure 14
Parameter correlation plot containing parameter values from 10,000 samples of the joint posterior distribution found during MCMC model calibration.
See Table 2 in the main article for parameter definitions and descriptions.
Appendix 2—figure 15

Parameter trace plot showing all 1.5 million samples from the MCMC model calibration sequentially.
See Table 2 in the main article for parameter definitions and descriptions.
Appendix 2—figure 16
Data from the Diamond Princess and model calibration.
Figure shows data from the Diamond Princess (points (A–D) and bars (F)) and results from model calibration. Red lines = median, shading = 95% posterior plus observational interval (A–C) and 95% posterior interval only (D–E). Two vertical lines show the date of the first confirmed diagnosis (left) and the start of quarantine measures (right). (A–B) show confirmed symptomatic cases among crew (A) and passengers (B) with a reported date of onset; (C) shows confirmed pre- or asymptomatic individuals by test date; (D) shows the prevalence of pre/asymptomatic individuals by test date. Points and error bars show point estimates and 95% confidence intervals; (E) shows the basic reproduction number over time for the ship as a whole, reflecting the drop in contact rates (F) shows the number of tests administered irrespective of symptoms, by test date.
Appendix 2—figure 17
Proportion of infections that are asymptomatic and their contribution to transmission.
(A) Prior (blue) and posterior (red) probability distribution for the proportion progressing to asymptomatic infections. (B) Prior (blue) and posterior (red) probability distribution for the relative infectiousness of asymptomatic infections. (C) Number of pre- and asymptomatic infections and symptomatic cases detected (dark red) and not detected (light red) during the outbreak. Error bars indicate 95% posterior intervals. (D) Posterior probability distribution for proportion of transmission that is from asymptomatic individuals. Dashed and dotted lines show median and interquartile range respectively.
Appendix 2—figure 18

Parameter correlation plot containing parameter values from 10,000 samples of the joint posterior distribution found during MCMC model calibration.
See Table 2 in the main article for parameter definitions and descriptions.
Appendix 2—figure 19
Parameter trace plot showing all 1.5 million samples from the MCMC model calibration sequentially.
See Table 2 in the main article for parameter definitions and descriptions.
Appendix 2—figure 20
Data from the Diamond Princess and model calibration.
Figure shows data from the Diamond Princess (points (A–D) and bars (F)) and results from model calibration. Red lines = median, shading = 95% posterior plus observational interval (A–C) and 95% posterior interval only (D–E). Two vertical lines show the date of the first confirmed diagnosis (left) and the start of quarantine measures (right). (A–B) show confirmed symptomatic cases among crew (A) and passengers (B) with a reported date of onset; (C) shows confirmed pre- or asymptomatic individuals by test date; (D) shows the prevalence of pre/asymptomatic individuals by test date. Points and error bars show point estimates and 95% confidence intervals; (E) shows the basic reproduction number over time for the ship as a whole, reflecting the drop in contact rates (F) shows the number of tests administered irrespective of symptoms, by test date.
Appendix 2—figure 21
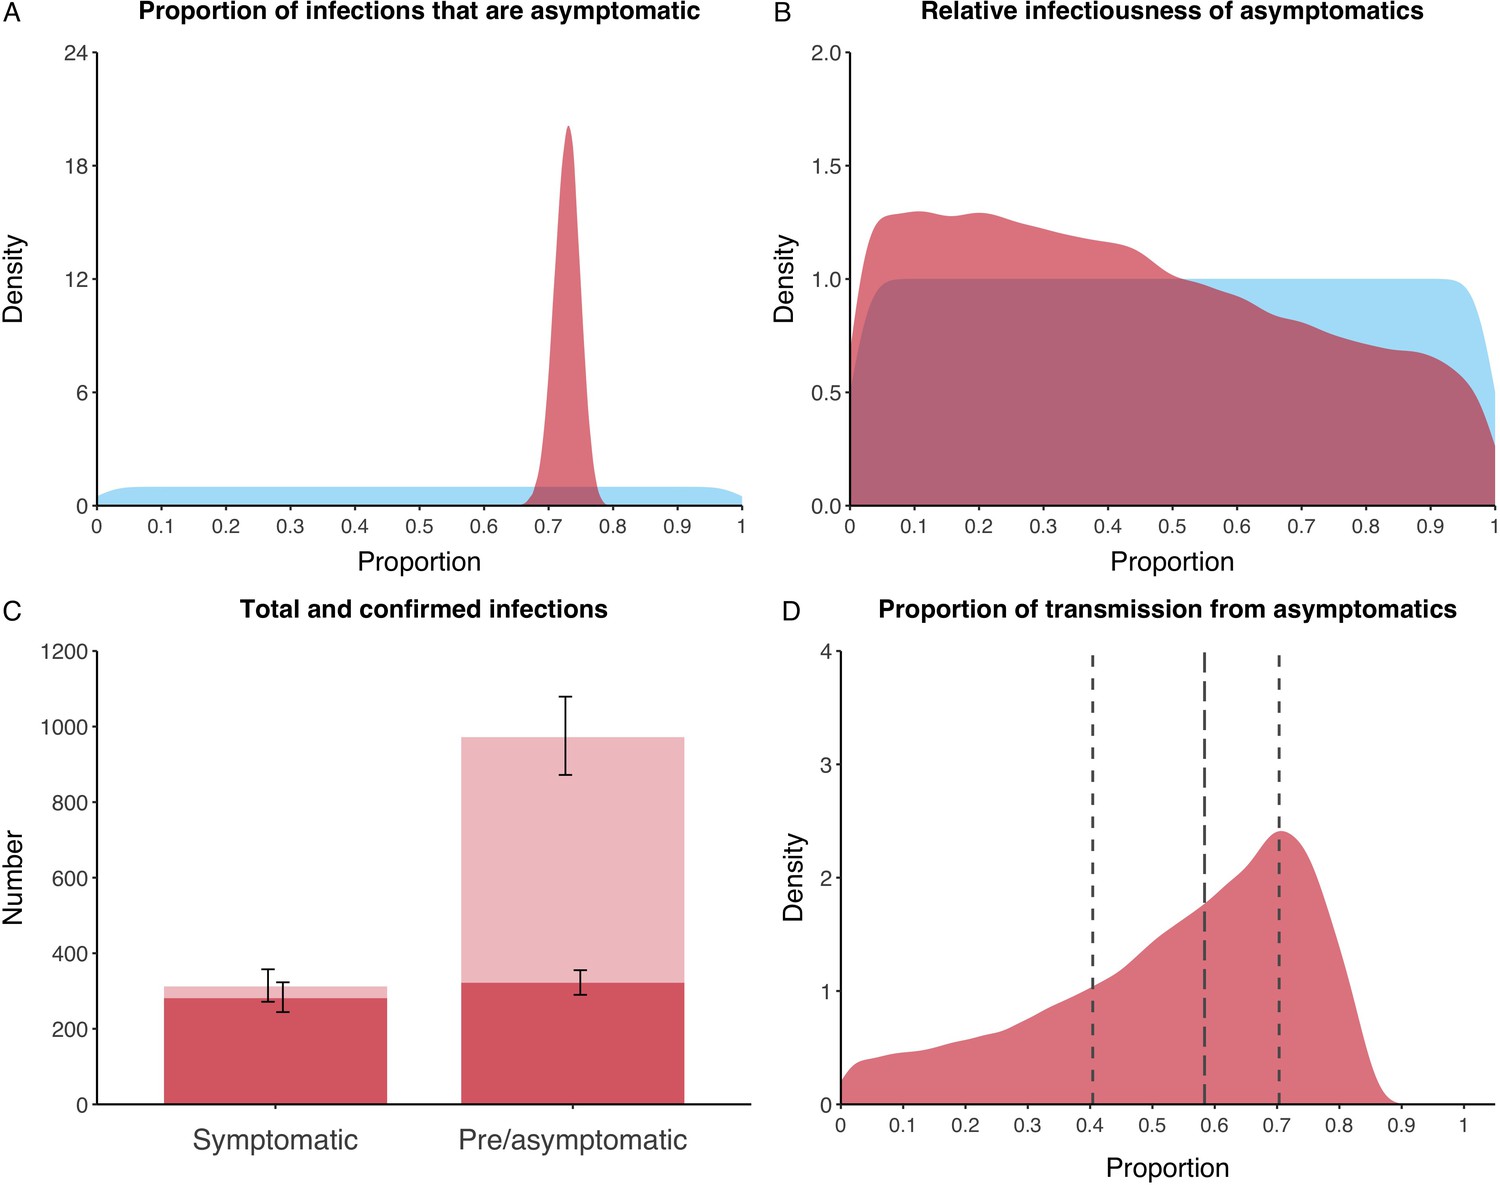
Proportion of infections that are asymptomatic and their contribution to transmission.
(A) Prior (blue) and posterior (red) probability distribution for the proportion progressing to asymptomatic infections. The left hand peak is for passengers, whilst the right hand peak is for crew. (B) Prior (blue) and posterior (red) probability distribution for the relative infectiousness of asymptomatic infections. (C) Number of pre- and asymptomatic infections and symptomatic cases detected (dark red) and not detected (light red) during the outbreak. Error bars indicate 95% posterior intervals. (D) Posterior probability distribution for proportion of transmission that is from asymptomatic individuals. Dashed and dotted lines show median and interquartile range respectively.
Appendix 2—figure 22
Parameter correlation plot containing parameter values from 10,000 samples of the joint posterior distribution found during MCMC model calibration.
See Table 2 in the main article for parameter definitions and descriptions.
Appendix 2—figure 23

Parameter trace plot showing all 1.5 million samples from the MCMC model calibration sequentially.
See Table 2 in the main article for parameter definitions and descriptions.
Appendix 2—figure 24
Data from the Diamond Princess and model calibration.
Figure shows data from the Diamond Princess (points (A–D) and bars (F)) and results from model calibration. Red lines = median, shading = 95% posterior plus observational interval (A–C) and 95% posterior interval only (D–E). Two vertical lines show the date of the first confirmed diagnosis (left) and the start of quarantine measures (right). (A–B) show confirmed symptomatic cases among crew (A) and passengers (B) with a reported date of onset; (C) shows confirmed pre- or asymptomatic individuals by test date; (D) shows the prevalence of pre/asymptomatic individuals by test date. Points and error bars show point estimates and 95% confidence intervals; (E) shows the basic reproduction number over time for the ship as a whole, reflecting the drop in contact rates (F) shows the number of tests administered irrespective of symptoms, by test date.
Appendix 2—figure 25
Proportion of infections that are asymptomatic and their contribution to transmission.
(A) Prior (blue) and posterior (red) probability distribution for the proportion progressing to asymptomatic infections. (B) Prior (blue) and posterior (red) probability distribution for the relative infectiousness of asymptomatic infections. (C) Number of pre- and asymptomatic infections and symptomatic cases detected (dark red) and not detected (light red) during the outbreak. Error bars indicate 95% posterior intervals. (D) Posterior probability distribution for proportion of transmission that is from asymptomatic individuals. Dashed and dotted lines show median and interquartile range respectively.
Appendix 2—figure 26
Parameter correlation plot containing parameter values from 10,000 samples of the joint posterior distribution found during MCMC model calibration.
See Table 2 in the main article for parameter definitions and descriptions.
Appendix 2—figure 27
Parameter trace plot showing all 1.5 million samples from the MCMC model calibration sequentially.
See Table 2 in the main article for parameter definitions and descriptions.
Appendix 2—figure 28
Data from the Diamond Princess and model calibration.
Figure shows data from the Diamond Princess (points (A–D) and bars (F)) and results from model calibration. Red lines = median, shading = 95% posterior plus observational interval (A–C) and 95% posterior interval only (D–E). Two vertical lines show the date of the first confirmed diagnosis (left) and the start of quarantine measures (right). (A–B) show confirmed symptomatic cases among crew (A) and passengers (B) with a reported date of onset; (C) shows confirmed pre- or asymptomatic individuals by test date; (D) shows the prevalence of pre/asymptomatic individuals by test date. Points and error bars show point estimates and 95% confidence intervals; (E) shows the basic reproduction number over time for the ship as a whole, reflecting the drop in contact rates (F) shows the number of tests administered irrespective of symptoms, by test date.
Appendix 2—figure 29
Proportion of infections that are asymptomatic and their contribution to transmission.
(A) Prior (blue) and posterior (red) probability distribution for the proportion progressing to asymptomatic infections. (B) Prior (blue) and posterior (red) probability distribution for the relative infectiousness of asymptomatic infections. (C) Number of pre- and asymptomatic infections and symptomatic cases detected (dark red) and not detected (light red) during the outbreak. Error bars indicate 95% posterior intervals. (D) Posterior probability distribution for proportion of transmission that is from asymptomatic individuals. Dashed and dotted lines show median and interquartile range respectively.
Appendix 2—figure 30
Parameter correlation plot containing parameter values from 10,000 samples of the joint posterior distribution found during MCMC model calibration.
See Table 2 in the main article for parameter definitions and descriptions.
Appendix 2—figure 31

Parameter trace plot showing all 1.5 million samples from the MCMC model calibration sequentially.
See Table 2 in the main article for parameter definitions and descriptions.
Appendix 2—figure 32
Data from the Diamond Princess and model calibration.
Figure shows data from the Diamond Princess (points (A–D) and bars (F)) and results from model calibration. Red lines = median, shading = 95% posterior plus observational interval (A–C) and 95% posterior interval only (D–E). Two vertical lines show the date of the first confirmed diagnosis (left) and the start of quarantine measures (right). (A–B) show confirmed symptomatic cases among crew (A) and passengers (B) with a reported date of onset; (C) shows confirmed pre- or asymptomatic individuals by test date; (D) shows the prevalence of pre/asymptomatic individuals by test date. Points and error bars show point estimates and 95% confidence intervals; (E) shows the basic reproduction number over time for the ship as a whole, reflecting the drop in contact rates (F) shows the number of tests administered irrespective of symptoms, by test date.
Appendix 2—figure 33
Proportion of infections that are asymptomatic and their contribution to transmission.
(A) Prior (blue) and posterior (red) probability distribution for the proportion progressing to asymptomatic infections. (B) Prior (blue) and posterior (red) probability distribution for the relative infectiousness of asymptomatic infections. (C) Number of pre- and asymptomatic infections and symptomatic cases detected (dark red) and not detected (light red) during the outbreak. Error bars indicate 95% posterior intervals. (D) Posterior probability distribution for proportion of transmission that is from asymptomatic individuals. Dashed and dotted lines show median and interquartile range respectively.
Appendix 2—figure 34
Parameter correlation plot containing parameter values from 10,000 samples of the joint posterior distribution found during MCMC model calibration.
See Table 2 in the main article for parameter definitions and descriptions.
Appendix 2—figure 35
Parameter trace plot showing all 1.5 million samples from the MCMC model calibration sequentially.
See Table 2 in the main article for parameter definitions and descriptions.
Appendix 2—figure 36
Data from the Diamond Princess and model calibration.
Figure shows data from the Diamond Princess (points (A–D) and bars (F)) and results from model calibration. Red lines = median, shading = 95% posterior plus observational interval (A–C) and 95% posterior interval only (D–E). Two vertical lines show the date of the first confirmed diagnosis (left) and the start of quarantine measures (right). (A–B) show confirmed symptomatic cases among crew (A) and passengers (B) with a reported date of onset; (C) shows confirmed pre- or asymptomatic individuals by test date; (D) shows the prevalence of pre/asymptomatic individuals by test date. Points and error bars show point estimates and 95% confidence intervals; (E) shows the basic reproduction number over time for the ship as a whole, reflecting the drop in contact rates (F) shows the number of tests administered irrespective of symptoms, by test date.
Appendix 2—figure 37
Proportion of infections that are asymptomatic and their contribution to transmission.
(A) Prior (blue) and posterior (red) probability distribution for the proportion progressing to asymptomatic infections. (B) Prior (blue) and posterior (red) probability distribution for the relative infectiousness of asymptomatic infections. (C) Number of pre- and asymptomatic infections and symptomatic cases detected (dark red) and not detected (light red) during the outbreak. Error bars indicate 95% posterior intervals. (D) Posterior probability distribution for proportion of transmission that is from asymptomatic individuals. Dashed and dotted lines show median and interquartile range respectively.
Appendix 2—figure 38
Parameter correlation plot containing parameter values from 10,000 samples of the joint posterior distribution found during MCMC model calibration.
See Table 2 in the main article for parameter definitions and descriptions.
Appendix 2—figure 39

Parameter trace plot showing all 1.5 million samples from the MCMC model calibration sequentially.
See Table 2 in the main article for parameter definitions and descriptions.
Tables
Table 1
Model outputs by relative infectiousness of asymptomatic individuals.
Relative infectiousness expressed as proportion compared to symptomatic individuals. All values are 95% posterior ranges from model scenarios. Net reproduction number represents the typical number of infections generated by a single infected individual during their presymptomatic and symptomatic stages.
| Range of relative infectiousness of asymptomatic individual | Model output | ||
|---|---|---|---|
| Transmission from asymptomatic individuals (%) | Net reproduction number for presymptomatic passengers | Basic reproduction number | |
| 0–1% | 0–3 | 22.7–29.1 | 6.7–7.6 |
| 1–25% | 7–58 | 15.5–25.5 | 7.0–8.8 |
| 25–50% | 44–75 | 11.1–17.6 | 8.0–9.6 |
| 50–75% | 60–82 | 8.7–13.6 | 8.7–10.2 |
| 75–99% | 68–86 | 7.2–11.4 | 9.3–10.8 |
| 99–100% | 72–87 | 6.7–10.2 | 9.5–10.9 |
-
Relative infectiousness expressed as proportion compared to symptomatic individuals. All values are 95% posterior ranges from model scenarios. Net reproduction number represents the typical number of infections generated by a single infected individual during their presymptomatic and symptomatic stages.
Table 2
Model parameters and priors/values.
| Parameter | Description | Prior/value | Source/Notes |
|---|---|---|---|
| Overall contact rate (1/days) | Estimated: Uniform(0,100) | ||
| Relative initial contact rate between crew/crew | Fixed: 1 | ||
| Relative initial contact rate between passengers/passengers | Estimated: Uniform(0,100) | ||
| Relative initial contact rate between passengers/crew | Fixed relative to | ||
| X | Ratio: | Fixed: 0.1 | Assumed. Varied in sensitivity analyses |
| b1 | Percentage reduction in all initial contact rates (%) | Estimated: Uniform(0,100) | |
| b2 | Rate of change of all contact rates (1/days) | Fixed: 10 | Assumed. Transitions completed over approximately one day |
| Time of transition for contacts between passengers/passengers and passengers/crew (days) | Estimated: Uniform(0,32) | Assumed to be equal to each other | |
| Time of transition for contacts between crew/crew (days) | Estimated: Uniform(0,32) | ||
| Relative infectiousness of presymptomatic state | Estimated: Uniform(0,1) | Relative to symptomatic state | |
| Relative infectiousness of asymptomatic state | Estimated: Uniform(0,1) | Relative to symptomatic state | |
| Proportion of infections that proceed to asymptomatic state | Estimated: Uniform(0,1) | ||
| Latent period (days) | Fixed: 4.3 | Derived from Backer et al., 2020 | |
| Mean duration in asymptomatic state (days) | Fixed: 5.0 | Assumed. Sum of mean durations in presymptomatic and symptomatic states. Varied in sensitivity analyses. | |
| Mean duration in presymptomatic state (days) | Fixed: 2.1 | Derived from Backer et al., 2020 | |
| Mean duration in infectious symptomatic state (days). | Fixed: 2.9 | From Liu et al., 2020b Applicable only until quarantine starts on 5th Feb | |
| Mean delay between onset of symptomatic disease and symptom-based testing and removal (days). | Fixed: 1 | Assumed. Applicable only after quarantine starts on 5th Feb. | |
| Mean duration of test positivity following recovery (days) | Fixed: 7 | From Woelfel et al., 2020 | |
| Proportion of symptomatic cases with a reported onset date | Fixed: 0.661 (199/314) | From Mizumoto et al., 2020; Nishiura, 2020 | |
| Rate of symptom-agnostic testing and removal (1/days) | Fixed: Calculated | From Mizumoto et al., 2020 Calculated using the number of tests administered per day amongst individuals not reporting symptoms (see Appendix 1) | |
| Total number of passengers on the ship as at start of quarantine on 5th Feb | Fixed: 2666 | From NIID, 2020 | |
| Total number of crew on the ship as at start of quarantine on 5th Feb | Fixed: 1045 | From NIID, 2020 |
Appendix 1—table 1
Confirmed symptomatic cases (n = 199) by date of symptom onset for passengers and crew separately, extracted from Nishiura, 2020.
A further n = 115 confirmed symptomatic cases without symptom onset dates are not included in the table.
| Date of symptom onset | Confirmed symptomatic cases | ||
|---|---|---|---|
| Passengers | Crew | Total | |
| 20-Jan | 2 | 0 | 2 |
| 21-Jan | 0 | 0 | 0 |
| 22-Jan | 0 | 0 | 0 |
| 23-Jan | 1 | 0 | 1 |
| 24-Jan | 0 | 0 | 0 |
| 25-Jan | 0 | 0 | 0 |
| 26-Jan | 0 | 0 | 0 |
| 27-Jan | 0 | 0 | 0 |
| 28-Jan | 0 | 0 | 0 |
| 29-Jan | 1 | 0 | 1 |
| 30-Jan | 1 | 0 | 1 |
| 31-Jan | 0 | 0 | 0 |
| 01-Feb | 4 | 0 | 4 |
| 02-Feb | 4 | 0 | 4 |
| 03-Feb | 4 | 0 | 4 |
| 04-Feb | 6 | 0 | 6 |
| 05-Feb | 12 | 0 | 12 |
| 06-Feb | 15 | 2 | 17 |
| 07-Feb | 29 | 2 | 31 |
| 08-Feb | 17 | 2 | 19 |
| 09-Feb | 19 | 5 | 24 |
| 10-Feb | 7 | 3 | 10 |
| 11-Feb | 11 | 8 | 19 |
| 12-Feb | 5 | 7 | 12 |
| 13-Feb | 9 | 8 | 17 |
| 14-Feb | 2 | 5 | 7 |
| 15-Feb | 1 | 3 | 4 |
| 16-Feb | 0 | 3 | 3 |
| 17-Feb | 0 | 1 | 1 |
| 18-Feb | 0 | 0 | 0 |
| 19-Feb | 0 | 0 | 0 |
| 20-Feb | 0 | 0 | 0 |
| Total | 150 | 49 | 199 |
Appendix 1—table 2
Confirmed pre/asymptomatic cases (n = 320) and symptom-agnostic tests (n = 2749) by date of test for passengers and crew combined, extracted from Mizumoto et al., 2020.
+Test dates were not available for n = 35 confirmed pre/asymptomatic cases between 5th-14th Feb. These were distributed proportional to the total number of tests (symptom-based and symptom-agnostic) on those days.
| Date of test | Number of symptom agnostic tests | Number of confirmed pre/asymptomatic cases |
|---|---|---|
| 20-Jan | 0 | 0 |
| 21-Jan | 0 | 0 |
| 22-Jan | 0 | 0 |
| 23-Jan | 0 | 0 |
| 24-Jan | 0 | 0 |
| 25-Jan | 0 | 0 |
| 26-Jan | 0 | 0 |
| 27-Jan | 0 | 0 |
| 28-Jan | 0 | 0 |
| 29-Jan | 0 | 0 |
| 30-Jan | 0 | 0 |
| 31-Jan | 0 | 0 |
| 01-Feb | 0 | 0 |
| 02-Feb | 0 | 0 |
| 03-Feb | 0 | 0 |
| 04-Feb | 0 | 0 |
| 05-Feb+ | 23 | 2 |
| 06-Feb+ | 64 | 3 |
| 07-Feb+ | 138 | 8 |
| 08-Feb+ | 3 | 0 |
| 09-Feb+ | 54 | 3 |
| 10-Feb+ | 43 | 5 |
| 11-Feb+ | 0 | 0 |
| 12-Feb+ | 17 | 3 |
| 13-Feb+ | 188 | 11 |
| 14-Feb+ | 0 | 0 |
| 15-Feb | 188 | 38 |
| 16-Feb | 257 | 38 |
| 17-Feb | 475 | 70 |
| 18-Feb | 658 | 65 |
| 19-Feb | 596 | 68 |
| 20-Feb | 45 | 6 |
| Total | 2749 | 320 |
Additional files
Download links
A two-part list of links to download the article, or parts of the article, in various formats.
Downloads (link to download the article as PDF)
Open citations (links to open the citations from this article in various online reference manager services)
Cite this article (links to download the citations from this article in formats compatible with various reference manager tools)
The contribution of asymptomatic SARS-CoV-2 infections to transmission on the Diamond Princess cruise ship
eLife 9:e58699.
https://doi.org/10.7554/eLife.58699


