NAIP–NLRC4-deficient mice are susceptible to shigellosis
- Division of Immunology & Pathogenesis, Department of Molecular & Cell Biology, University of California, Berkeley, United States
- Department of Microbiology, Harvard Medical School, United States
- Broad Institute of Harvard and MIT, United States
- Department of Medicine, Division of Infectious Diseases, Massachusetts General Hospital, United States
- Cancer Research Laboratory, University of California, Berkeley, United States
- Department of Molecular Microbiology and Immunology, Oregon Health and Science University, United States
- Immunotherapeutics and Vaccine Research Initiative, University of California, Berkeley, United States
- Howard Hughes Medical Institute, University of California, Berkeley, United States
Figures
Figure 1
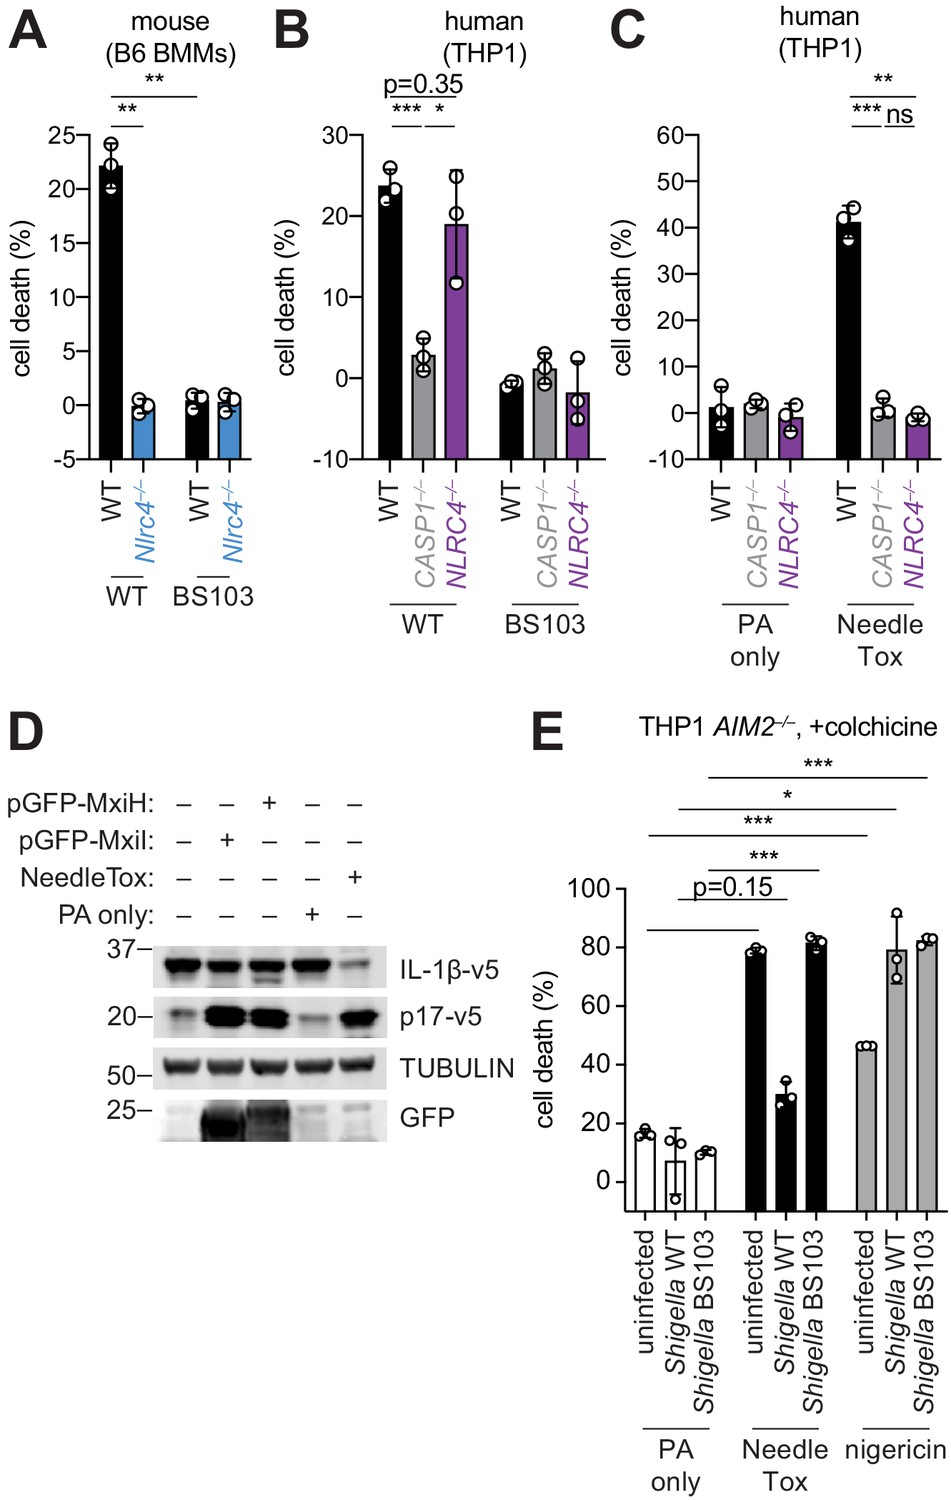
Shigella infection appears to suppress the NAIP–NLRC4 inflammasome.
(A) Shigella infection (MOI 10) of C57BL/6 WT or Nlrc4–/– bone-marrow-derived macrophages (BMMs). Cell death was measured 30 min post-infection (after spinfection, invasion, and washes) by propidium iodide uptake and reported as percent death relative to 100% killing by treatment with Triton X-100. (B) Cell death of Shigella infected THP1 WT, CASP1–/– or NLRC4–/– cells as in (A). Cell death was measured 30 min post-infection. (C) Cell death of THP1 WT, CASP1–/– or NLRC4–/– cells treated with 10 μg/mL PA alone or in combination with 10 μg/mL LFn-MxiH ('NeedleTox'). Cell death was measured 4 hr post-challenge. (D) Human NAIP–NLRC4 inflammasome reconstitution in 293T cells. Inflammasome activation was measured by CASP1-dependent processing of pro-IL-1β to p17 by co-transfection of an empty vector, pGFP-MxiH or pGFP-MxiI, or by treatment with 10 μg/mL PA alone or in combination with 10 μg/mL LFn-MxiH. (E) Colchicine (1 μM)-treated AIM2–/– THP1 cells were either left uninfected or infected for 1 hour (after spinfection, invasion, and washes) with WT or BS103 Shigella (MOI 10), and then treated with 10 μg/mL PA alone, PA + 1.0 μg/mL LFn-MxiH ('NeedleTox'), or 10 μM nigericin. Cell death was measured by PI staining and is reported as cell death relative to TX-100-treated controls per infection type. Data are representative of at least three independent experiments. Mean ± SD is shown, unpaired t-test with Welch’s correction: *p < 0.01, **p < 0.001, ***p < 0.0001, ns = not significant (p > 0.05).
Figure 2 with 2 supplements
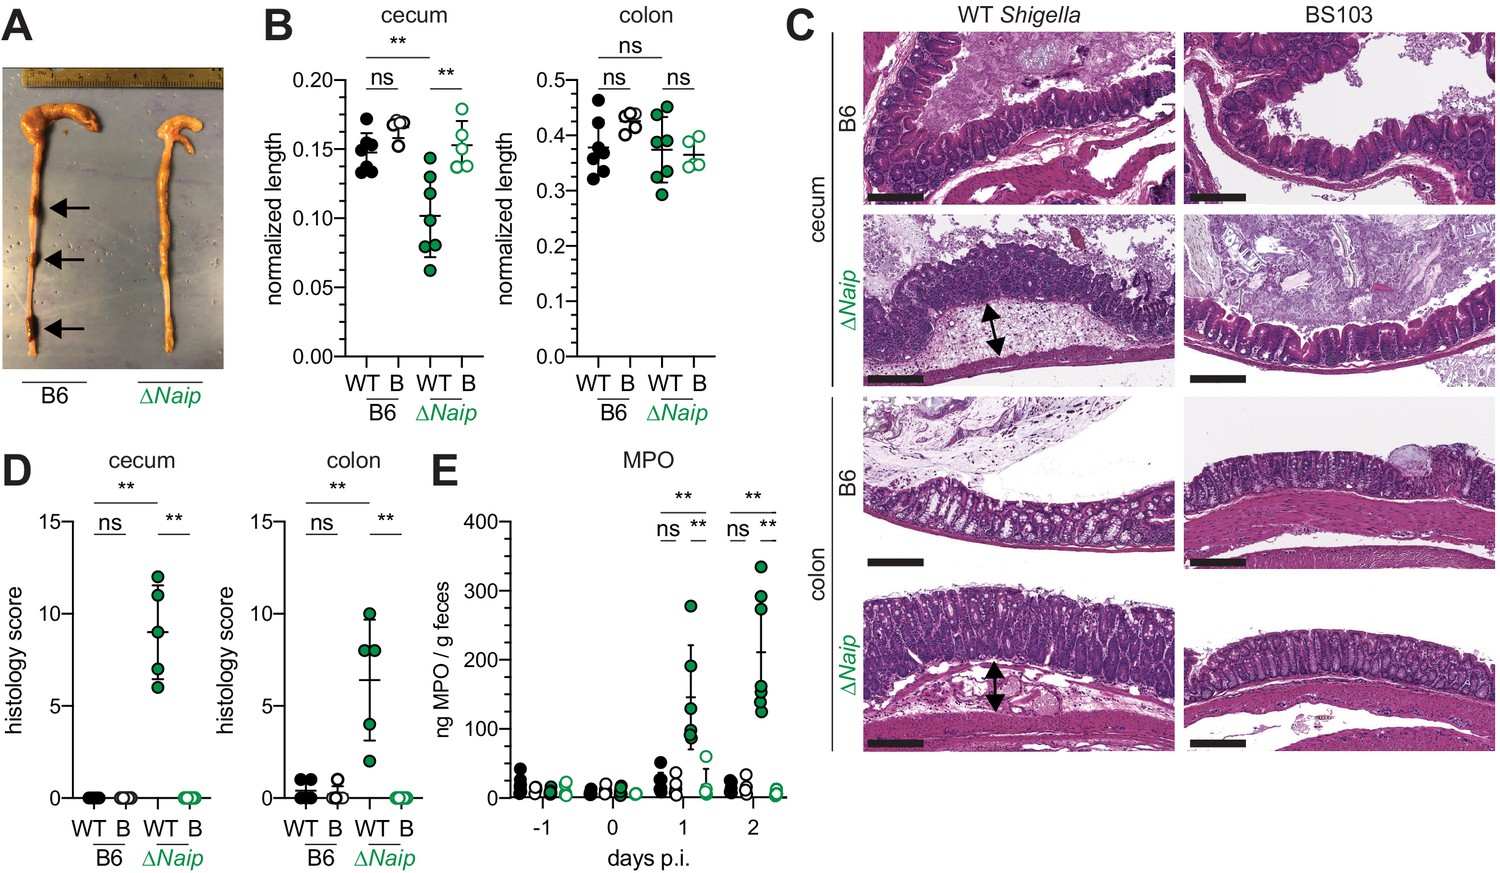
Shigella-infected B6.∆Naip mice exhibit intestinal inflammation.
(A–E) B6.WT and B6.∆Naip (green) mice (lacking expression of all Naip genes) treated orally with 25 mg streptomycin sulfate were orally challenged the next day with 5x10⁷ CFU of WT or BS103 ('B', non-invasive) Shigella. Endpoint harvests were performed at 48 hr post-infection (p.i.). (A) Representative images of the cecum and colon dissected from B6.WT and B6.∆Naip mice. Note cecum tissue thickening (size reduction), macroscopic edema, and loose stool (absence of arrows). (B) Quantification of cecum and colon lengths. Values were normalized to mouse weight prior to infection; cecum length (cm) / mouse weight (g). WT, wild-type Shigella (filled symbols); B, BS103 (open symbols). (C) Representative images of H&E stained cecum and colon tissue from infected mice. Scale bar, 200 μm. (D) Blinded quantification of histology score (cumulative) for tissues in (C). Edema, hyperplasia, inflammatory infiltrate, and epithelial cell death were scored from 0 to 4. The final score is the sum of individual scores from each category. (E) MPO levels measured by ELISA from feces of B6.WT and B6.∆Naip mice collected -1 through 2 days p.i. (B, D, E) Each symbol represents one mouse. Filled symbols, WT Shigella; open symbols, BS103. Data are representative of two independent experiments. Mean ± SD is shown in (B,D,E), Mann-Whitney test, *p < 0.05, **p <0.01, ***p < 0.001, ns = not significant (p > 0.05).
Figure 2—figure supplement 1

Antibiotic pre-treatment followed by oral route Shigella infection permits substantial lumenal colonization.
CFU determination per gram (g) feces of B6 WT mice that were treated orally with 25 mg streptomycin sulfate (yellow) or water (black) and orally challenged the next day with 5 × 10⁷ CFU of WT Shigella. Feces were collected 1 and 2 days post-infection (p.i.). Data are representative of three experiments. Each symbol represents one mouse. Mann-Whitney test, *p < 0.05.
Figure 2—figure supplement 2

B6.Casp1/11–/– mice are resistant to oral Shigella challenge.
(A–D) B6.WT (black) and B6.Casp1/11–/– (peach) mice were treated orally with 25 mg streptomycin sulfate and were orally challenged the next day with 5 × 10⁷ CFU of either WT or BS103 (avirulent) Shigella. (A) Representative images of the cecum and colon dissected at 2 days post-infection (p.i.). (B) Mouse weights. (C) Quantification of cecum and colon lengths. Values were normalized to mouse weight prior to infection; cecum length (cm)/mouse wt. (D) MPO levels measured by ELISA from feces of B6.WT and B6.Casp1/11–/– mice collected −1 through 2 days p.i. Each symbol represents one mouse. Data are representative of three independent experiments. Mean ± SD is shown in (B,C,D), Mann-Whitney test, *p < 0.05, ns = not significant (p > 0.05).
Figure 3 with 1 supplement
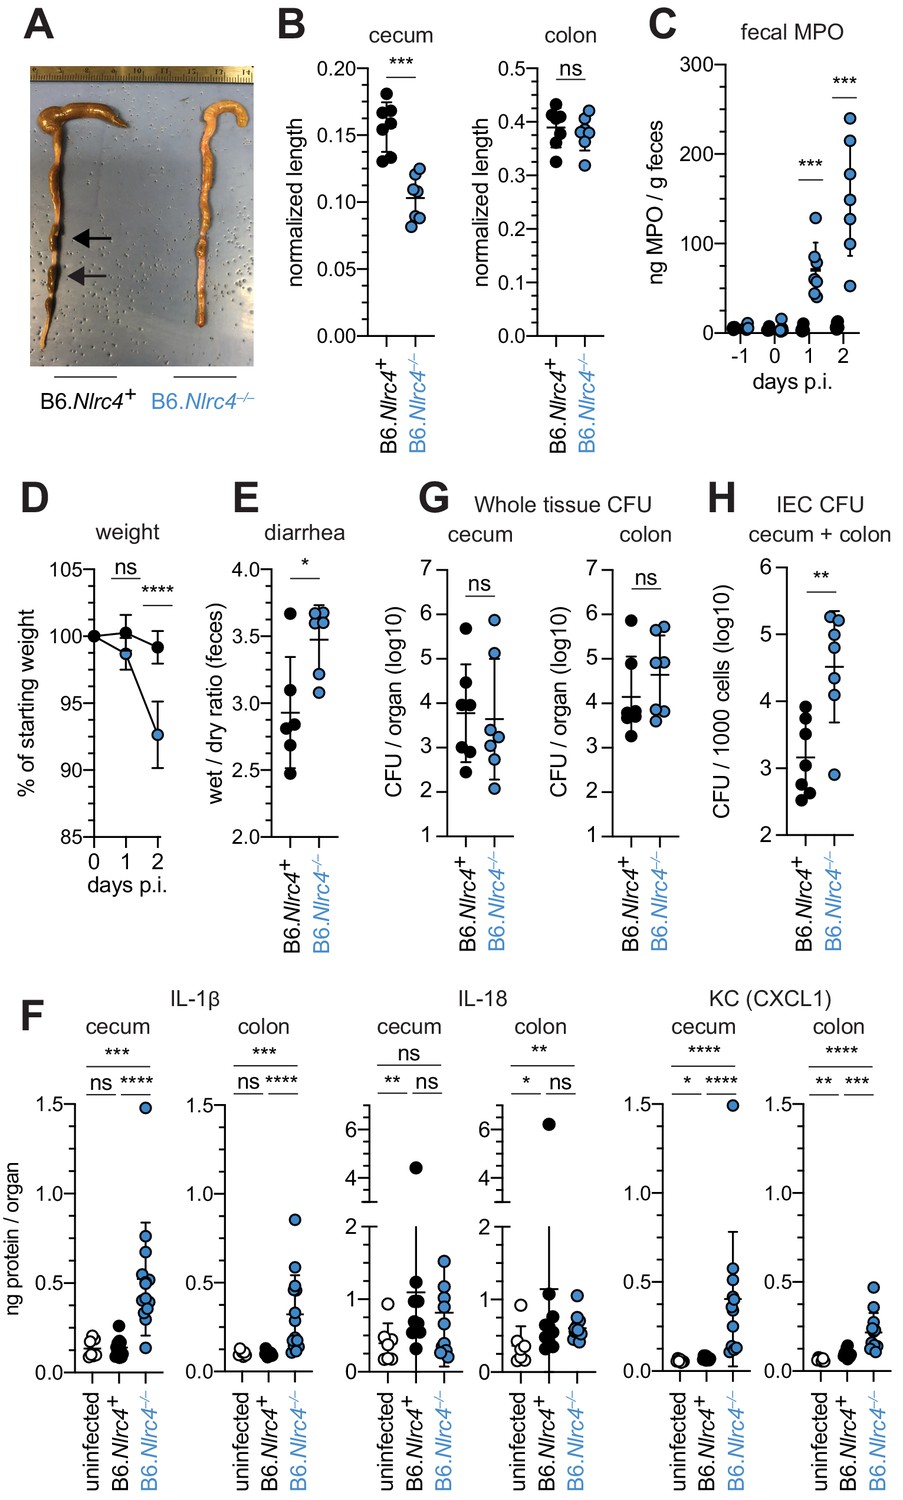
Shigella-infected B6.Nlrc4–/– mice exhibit intestinal inflammation and bacterial colonization of IECs.
(A–E) B6.Nlrc4+/– and B6.Nlrc4–/– littermates were cohoused with B6.WT mice for a minimum of three weeks. Mice were infected with only WT Shigella as described for Figure 2. Endpoint harvests were performed 48 hr post-infection (p.i.). B6.Nlrc4+/– and B6.WT mice are collectively referred to as B6.Nlrc4+. (A) Representative images of the cecum and colon dissected from B6.Nlrc4+ and B6.Nlrc4–/– mice. Note the cecum tissue thickening (size reduction), macroscopic edema, and loose stool (absence of arrows). (B) Quantification of cecum and colon lengths. Values were normalized to mouse weight prior to infection; cecum length (cm) / mouse weight (g). (C) MPO levels measured by ELISA from feces of B6.Nlrc4+ and B6.Nlrc4–/– mice collected -1 through 2 days p.i. (D) Mouse weights from 0 through 2 days p.i. Each symbol represents the mean for all mice of the indicated condition. (E) Quantification of feces weights before and after dehydration at 2 days p.i. A larger ratio indicates diarrhea. (F) IL-1β, IL-18, and KC levels measured by ELISA from tissue of B6.Nlrc4+ and B6.Nlrc4–/– mice collected 2 days p.i. (G) CFU determination from gentamicin-treated whole tissue homogenates from the cecum or colon of infected mice. (H) CFU determination from the IEC enriched fraction of gentamicin-treated cecum and colon tissue (combined). (B,C,E–H) Each symbol represents one mouse. Data are representative of three independent experiments. Mean ± SD is shown in (B-F). Geometric mean ± SD is shown in (F, G). Mann-Whitney test, *p < 0.05, **p < 0.01, ***p < 0.001, ns = not significant (p > 0.05).
Figure 3—figure supplement 1

Lumenal colonization by Shigella is similar between WT and NAIP–NLRC4-deficient mice.
(A) CFU determination per gram (g) feces from B6 and B6.Nlrc4–/– Shigella infected mice 2 days post-infection. (B) CFU determination per gram (g) feces from 129 and 129.Nlrc4–/– Shigella infected mice 2 days post-infection. Each symbol represents one mouse. Mann-Whitney test, *p < 0.05.
Figure 4 with 1 supplement
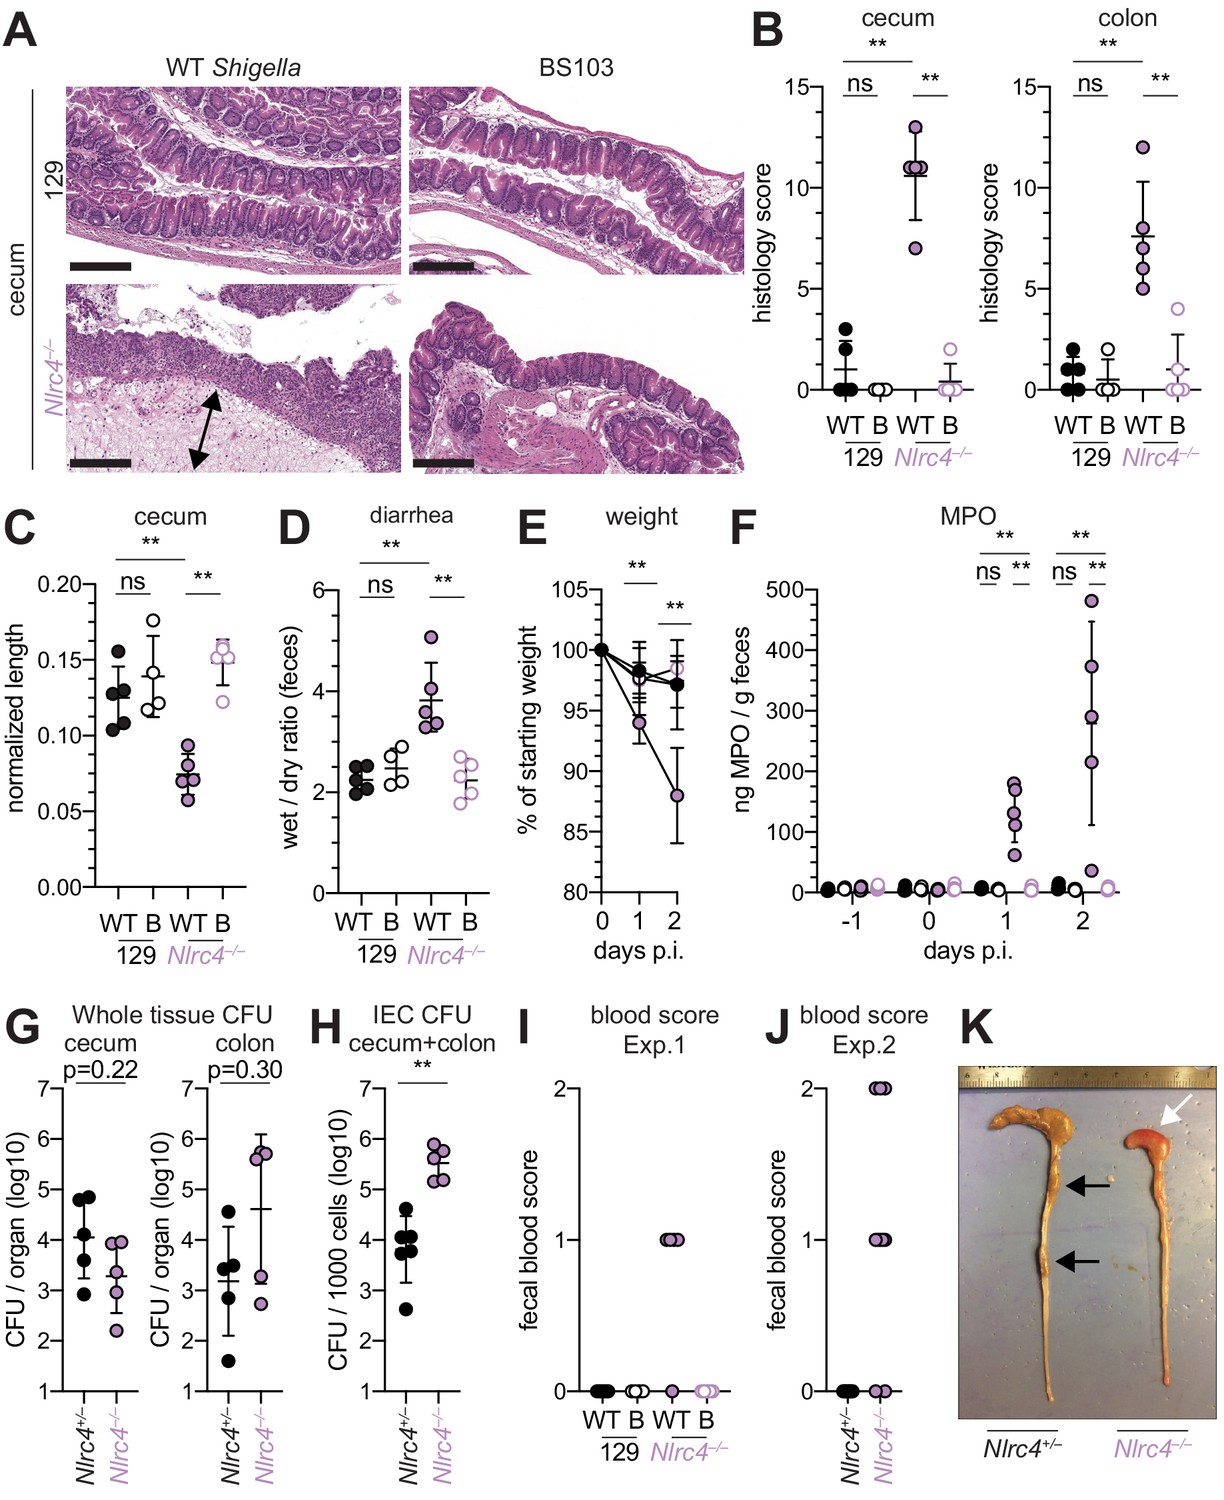
Shigella-infected 129.Nlrc4–/– mice exhibit hallmarks of severe human shigellosis.
(A–H) 129.Nlrc4+/– and 129.Nlrc4–/– littermates were infected as described for Figure 2. Endpoint harvests were performed at 48 hr post-infection (p.i.). (A) Representative images of H&E stained cecum and colon tissue from infected mice. Scale bar, 200 μm. (B) Blinded quantification of histology score (cumulative) for tissues in (A). Edema, hyperplasia, inflammatory infiltrate, and epithelial cell death were scored from 0 to 4. The final score is the sum of individual scores from each category. (C) Quantification of cecum and colon lengths. Values were normalized to mouse weight prior to infection; cecum length (cm) / mouse weight (g). (D) Quantification of feces weights before and after dehydration at 2 days p.i. A larger ratio indicates diarrhea. (E) Mouse weights at 0 through 2 days p.i. Each symbol represents the mean for all mice of the indicated condition. Statistics refer to both WT Shigella-infected 129.Nlrc4+/– and 129.Nlrc4–/– mice and WT versus BS103 Shigella-infected 129.Nlrc4–/– mice at both 1 and 2 days p.i. All other comparisons were non-significant. (F) MPO levels measured by ELISA from feces of 129.Nlrc4+/– and 129.Nlrc4–/– mice collected -1 through 2 days p.i. (G) CFU determination from gentamicin-treated whole tissue homogenates from the cecum or colon (H) CFU determination from the IEC enriched fraction of gentamicin-treated cecum and colon tissue (combined). (I,J) Fecal blood scores from feces at two days p.i. 1 = occult blood, 2 = macroscopic blood. (I and J) show scores from two representative experiments. (K) Representative images of the cecum and colon dissected from 129.Nlrc4+/– and 129.Nlrc4–/– mice. Note the cecum tissue thickening (size reduction), macroscopic edema, and loose stool (absence of arrows), and vascular lesions and bleeding. (B–D,F–J) Each symbol represents one mouse. Filled symbols, WT Shigella; open symbols, BS103. Data are representative of three independent experiments. Mean ± SD is shown in (B, C, D, E, F). Geometric mean ± SD is shown in (G and H). Mann-Whitney test, *p < 0.05, **p < 0.01, ***p < 0.001, ns = not significant (p > 0.05).
Figure 4—figure supplement 1
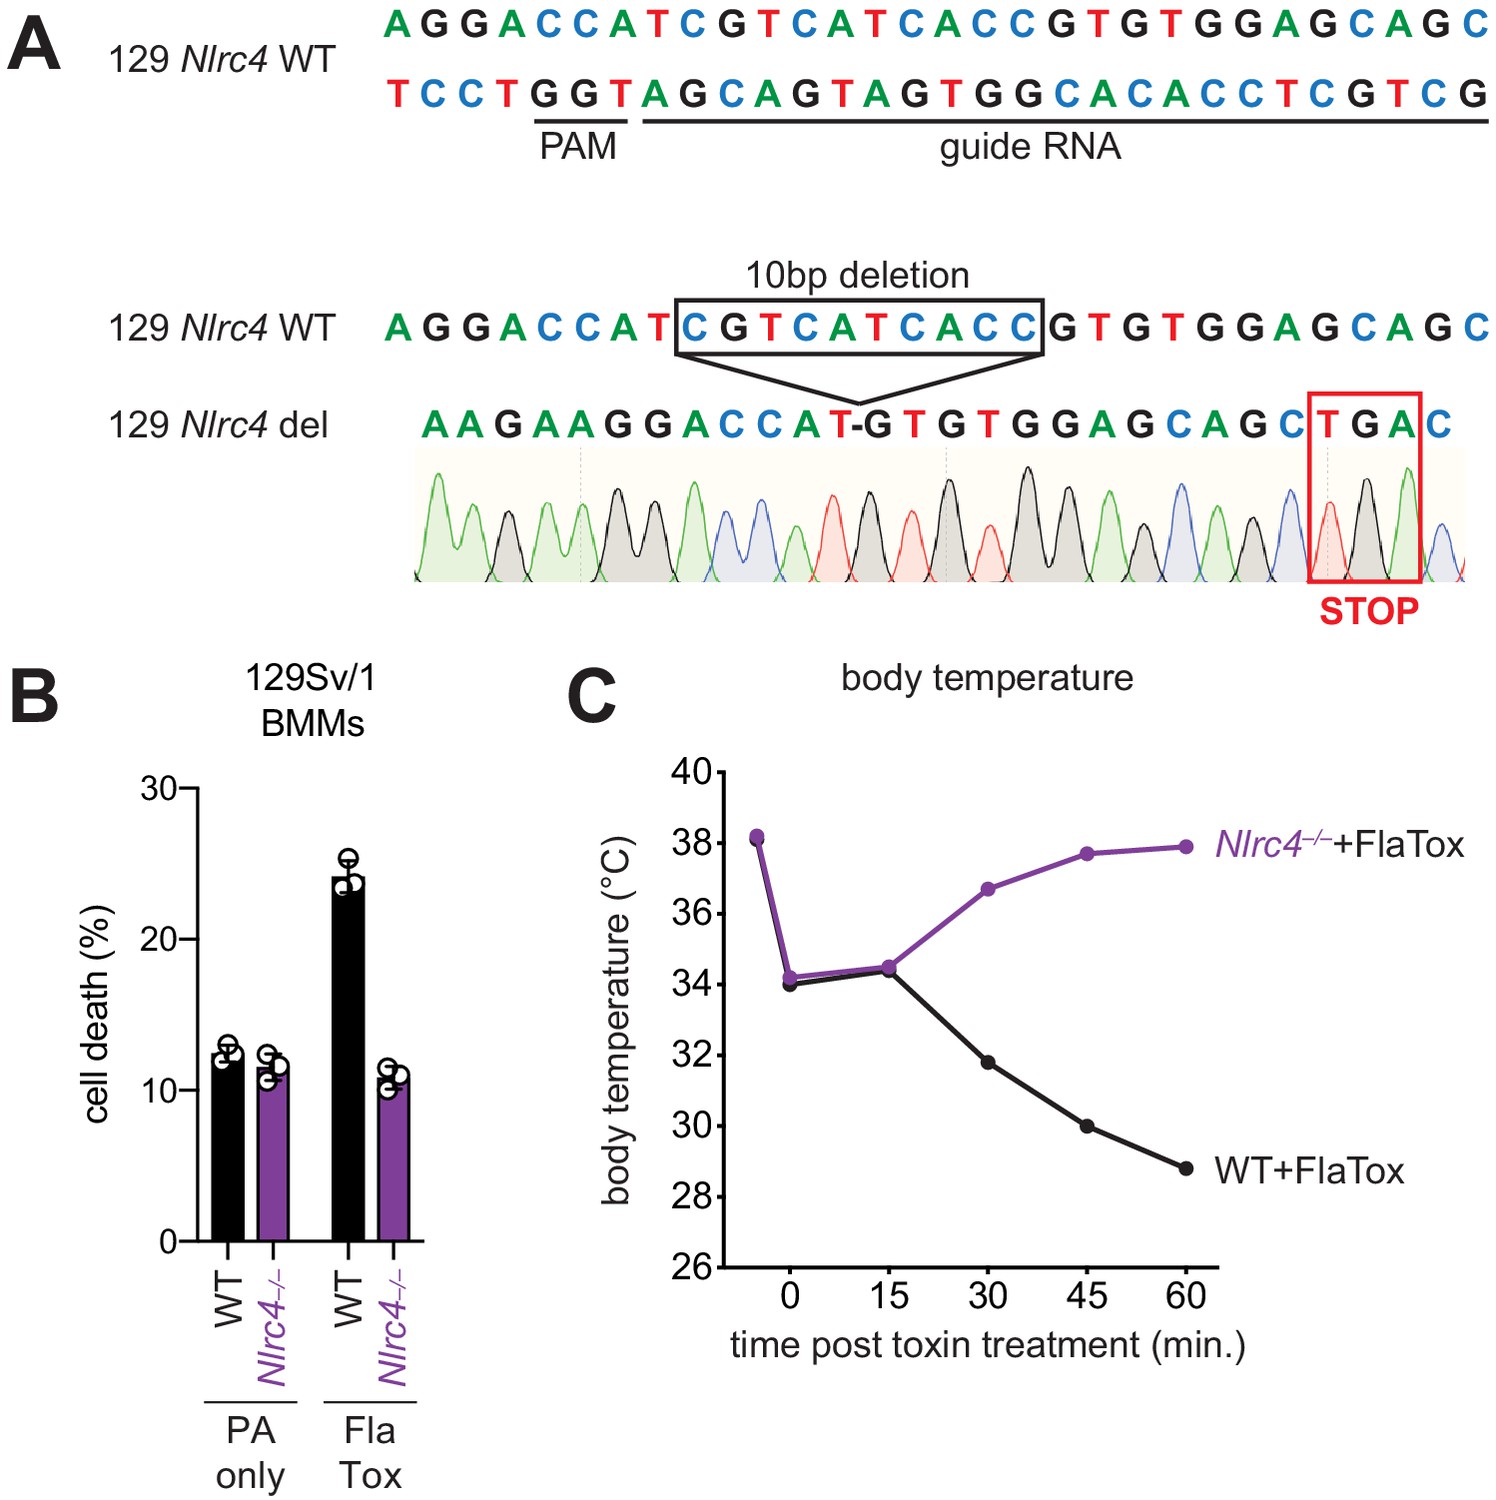
Construction and functional characterization of Nlrc4 knockout mice on the 129S1/SvImJ genetic background.
(A) The targeted wild-type Nlrc4 sequence (chromosome 17, NC_000083.6, exon 5) aligned to the Nlrc4 guide RNA. The protospacer adjacent motif (PAM) is indicated. Below is a schematic of the Sanger sequencing verified product of CRISPR/Cas9-editing (129 Nlrc4 del), which results in a 10 base pair deletion and an in-frame early TGA stop codon in exon 5 of Nlrc4. (B) Quantification of cell death in 129 WT or Nlrc4–/– bone-marrow-derived macrophages (BMMs) treated with 10 µg/mL PA alone or PA + 10 µg/mL LFn-FlaA (LFn fused to Legionella pneumophila flagellin, ‘FlaTox’). Cell death was measured 30 min post-infection by propidium iodide uptake and reported as percent death relative to 100% killing by treatment with Triton X-100. (C) WT or 129.Nlrc4–/– mice were injected intravenously with 0.2 µg/g body weight PA + 0.1 µg/g body weight LFn-FlaA and body temperature was monitored for the indicated times (minutes) post-treatment. The initial temperature decrease in all mice is due to isoflurane treatment.
Figure 5
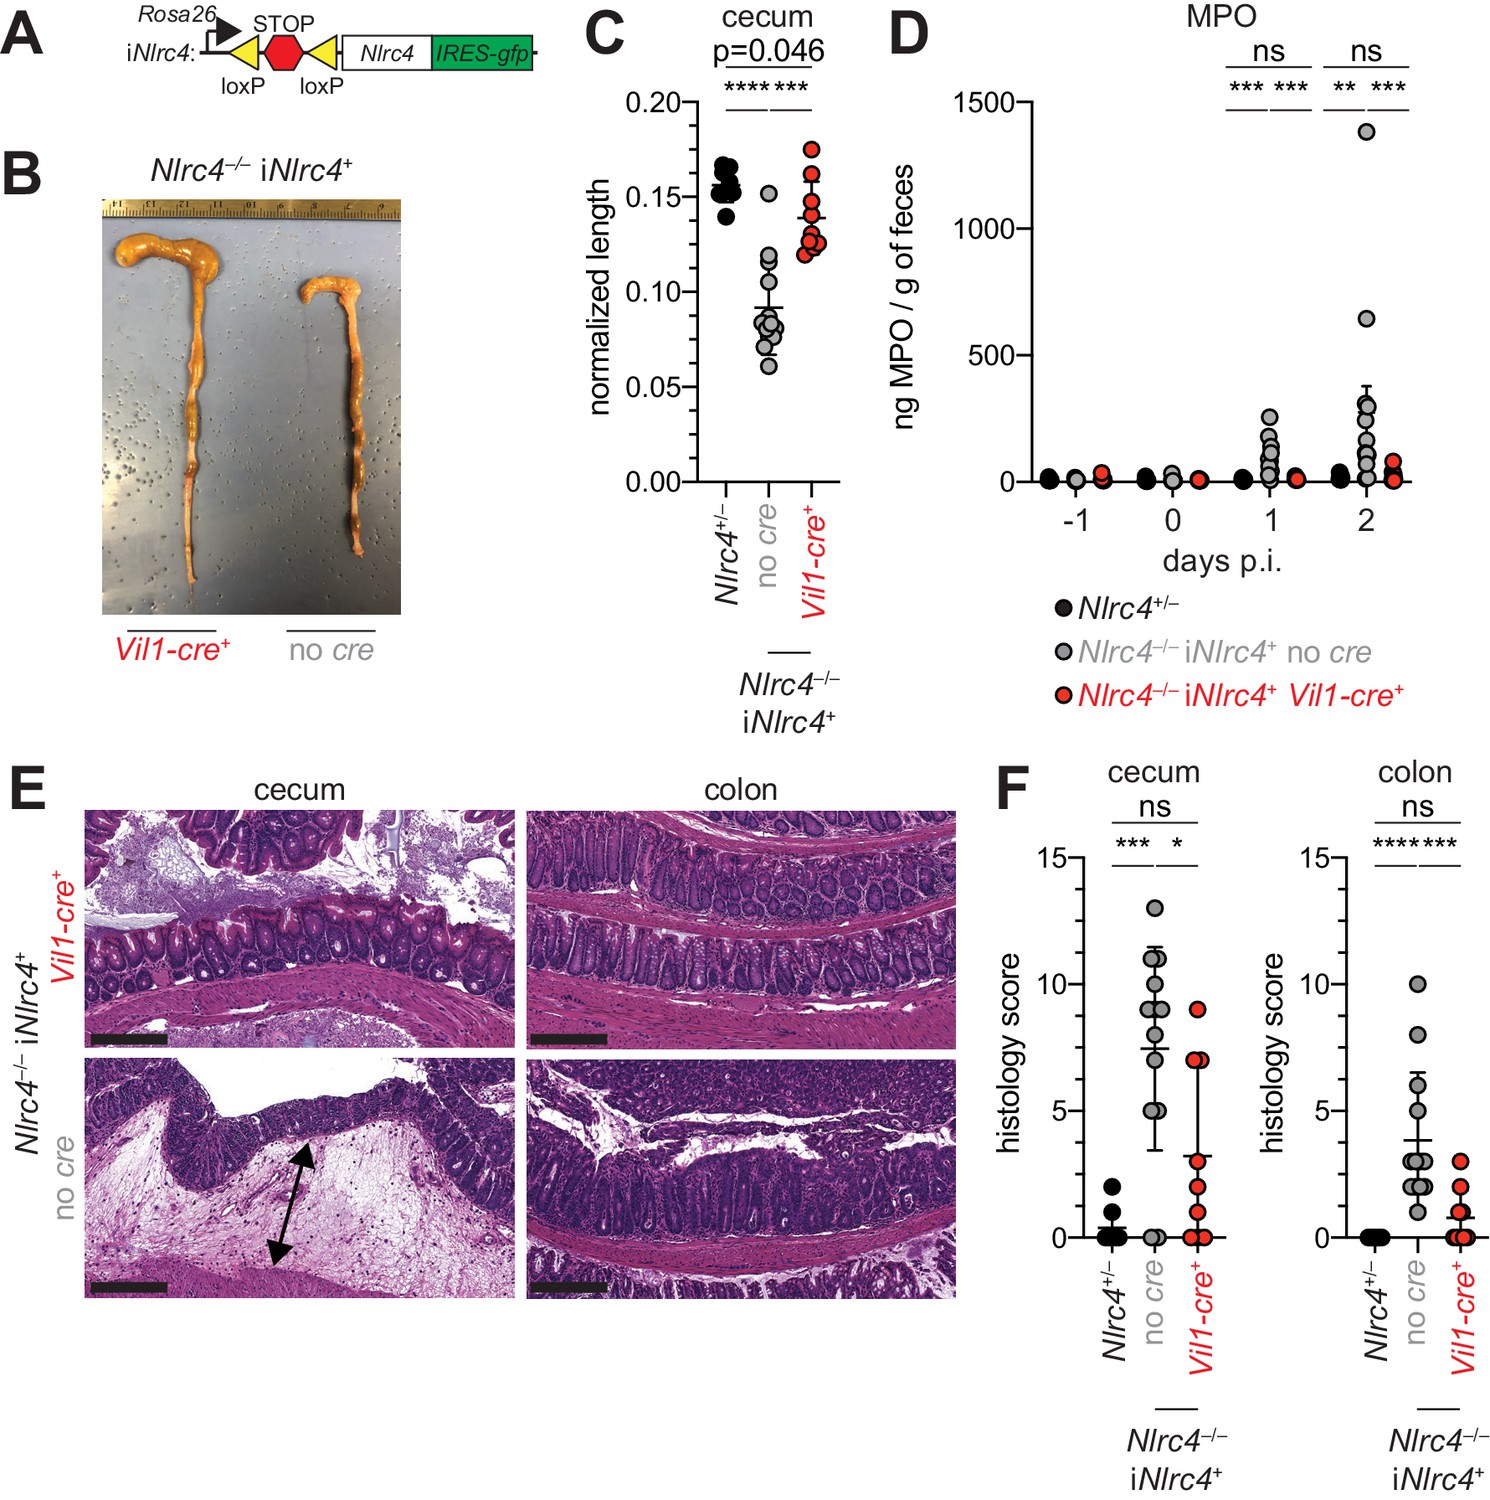
NLRC4 expression in IECs is sufficient to prevent shigellosis.
(A) Schematic of the B6 Rosa26 locus containing the iNlrc4 cassette, as described previously (Rauch et al., 2017). (B–F) Vil1-cre positive (+) or negative Nlrc4–/– iNlrc4 littermates, or iNlrc4+/– mice were orally infected with 5x10⁷ CFU of WT Shigella 24 hr after oral streptomycin treatment. Endpoint harvests were done 48 hr post-infection (p.i.). (B) Representative images of the cecum and colon dissected from iNlrc4 Nlrc4–/–Vil1-cre positive or negative mice. (C) Quantification of cecum length reduction normalized to the weight of the animal prior to infection; cecum length (cm) / mouse weight (g). (D) MPO levels measured by ELISA of feces collected -1 through 2 days p.i. (E) Representative images of H&E stained cecum and colon tissue from infected mice. Scale bar, 200 μm. (F) Blinded quantification of histology score (cumulative) for cecum and colon tissue. Data are representative of two independent experiments. Mean ± SD is shown in (C, D, F), Mann-Whitney test, *p < 0.05, **p < 0.01, ***p < 0.001, ns = not significant (p > 0.05). (C,D,F) Each symbol represents one mouse.
Figure 6
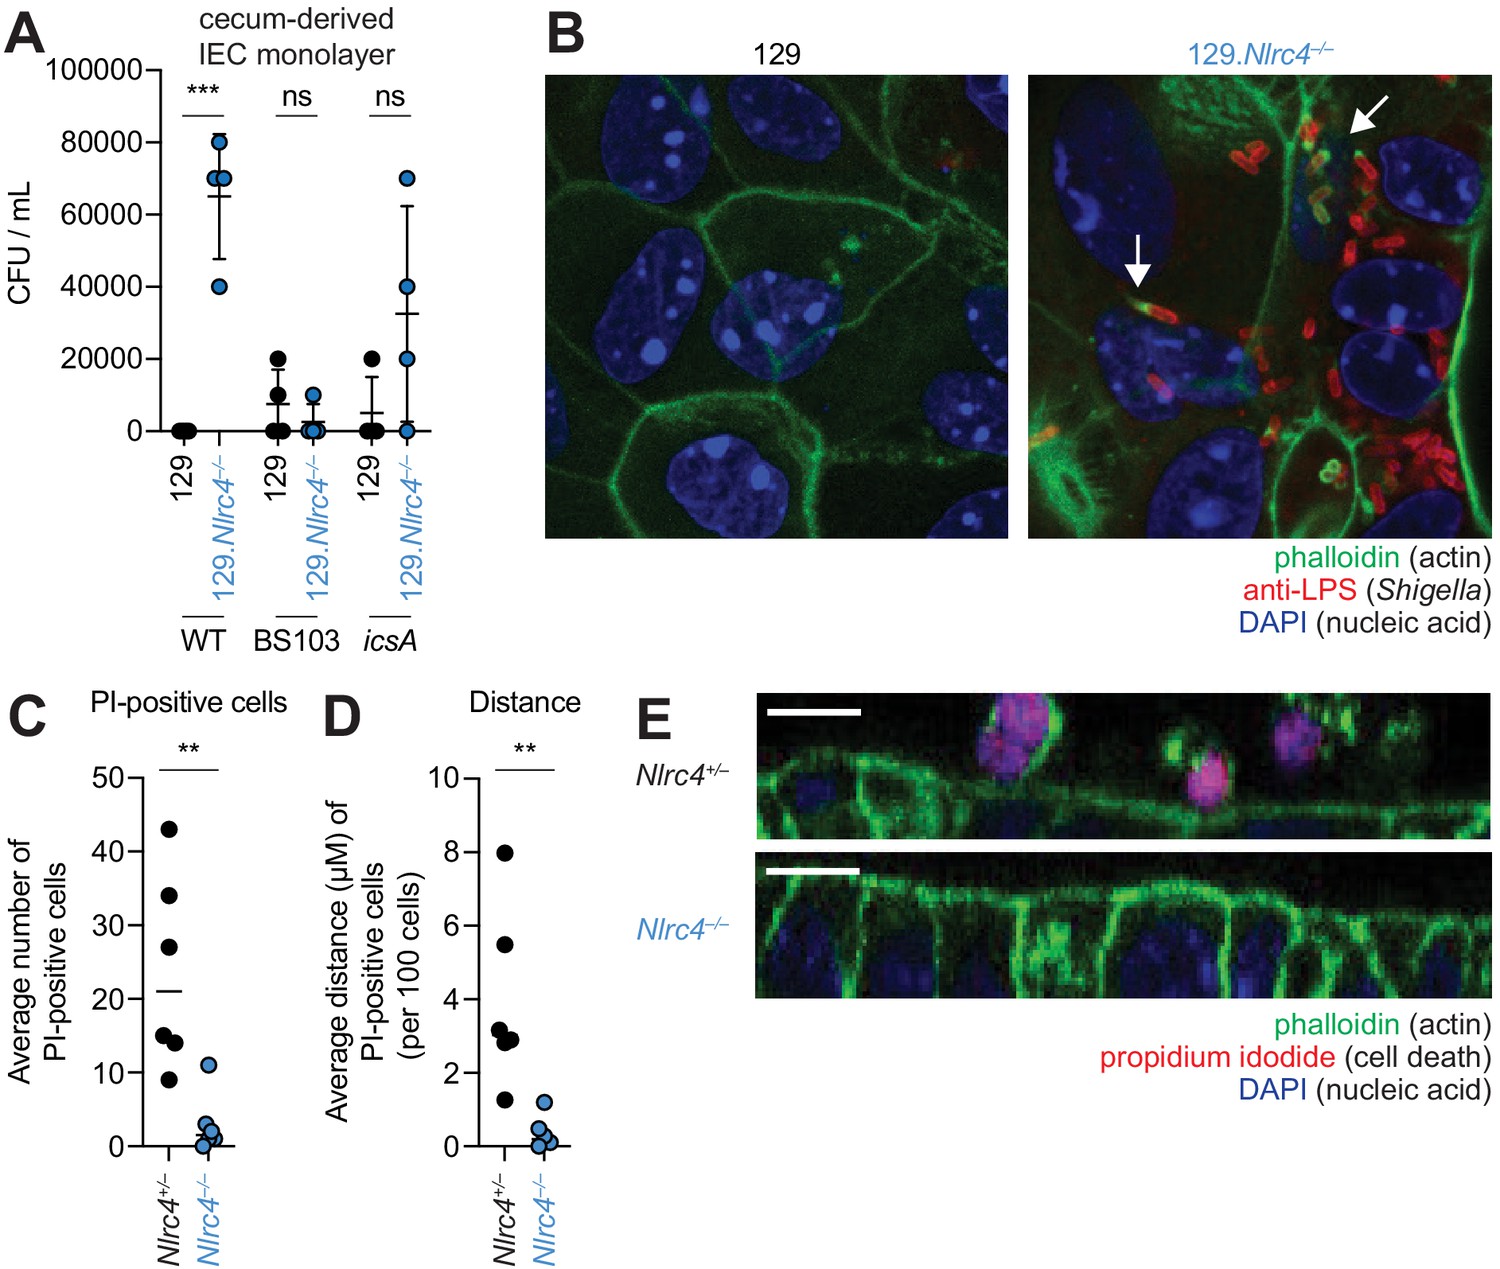
NLRC4 prevents Shigella colonization and cell expulsion in IEC monolayer cultures.
(A) Shigella (WT, BS103, or icsA) CFU from transwell culture of WT or 129.Nlrc4–/– cecum-derived IEC monolayers. CFU was determined 8 hr p.i. Each symbol represents one infected monolayer. (B) Immunofluorescent staining of WT Shigella-infected transwell cultures of WT or 129.Nlrc4–/– cecum-derived IEC monolayers: green, fluorescent phalloidin (actin); red, anti-Shigella LPS, blue, DAPI (nucleic acid). (C,D) Quantification of the number and position of propidium iodide (PI)-positive cells in Shigella-infected 129.Nlrc4+/– or 129.Nlrc4–/– cecum-derived IEC monolayers. In (C), each symbol represents the average number of PI-positive cells within an imaged field. In (D), each symbol represents the average distance of PI-positive cells from the lower boundary of the z-stack, per 100 cells. Two fields were counted for three independent slides. (E) A representative XZ-projection of Shigella-infected transwell cultures of 129.Nlrc4+/– or 129.Nlrc4–/– cecum-derived IEC monolayers showing expulsed PI+ cells above the monolayer. Green, fluorescent phalloidin (actin); red, PI (cell death); blue, DAPI (nucleic acid). Mann-Whitney test, **p < 0.01, ***p < 0.001, ns = not significant (p > 0.05).
Figure 7
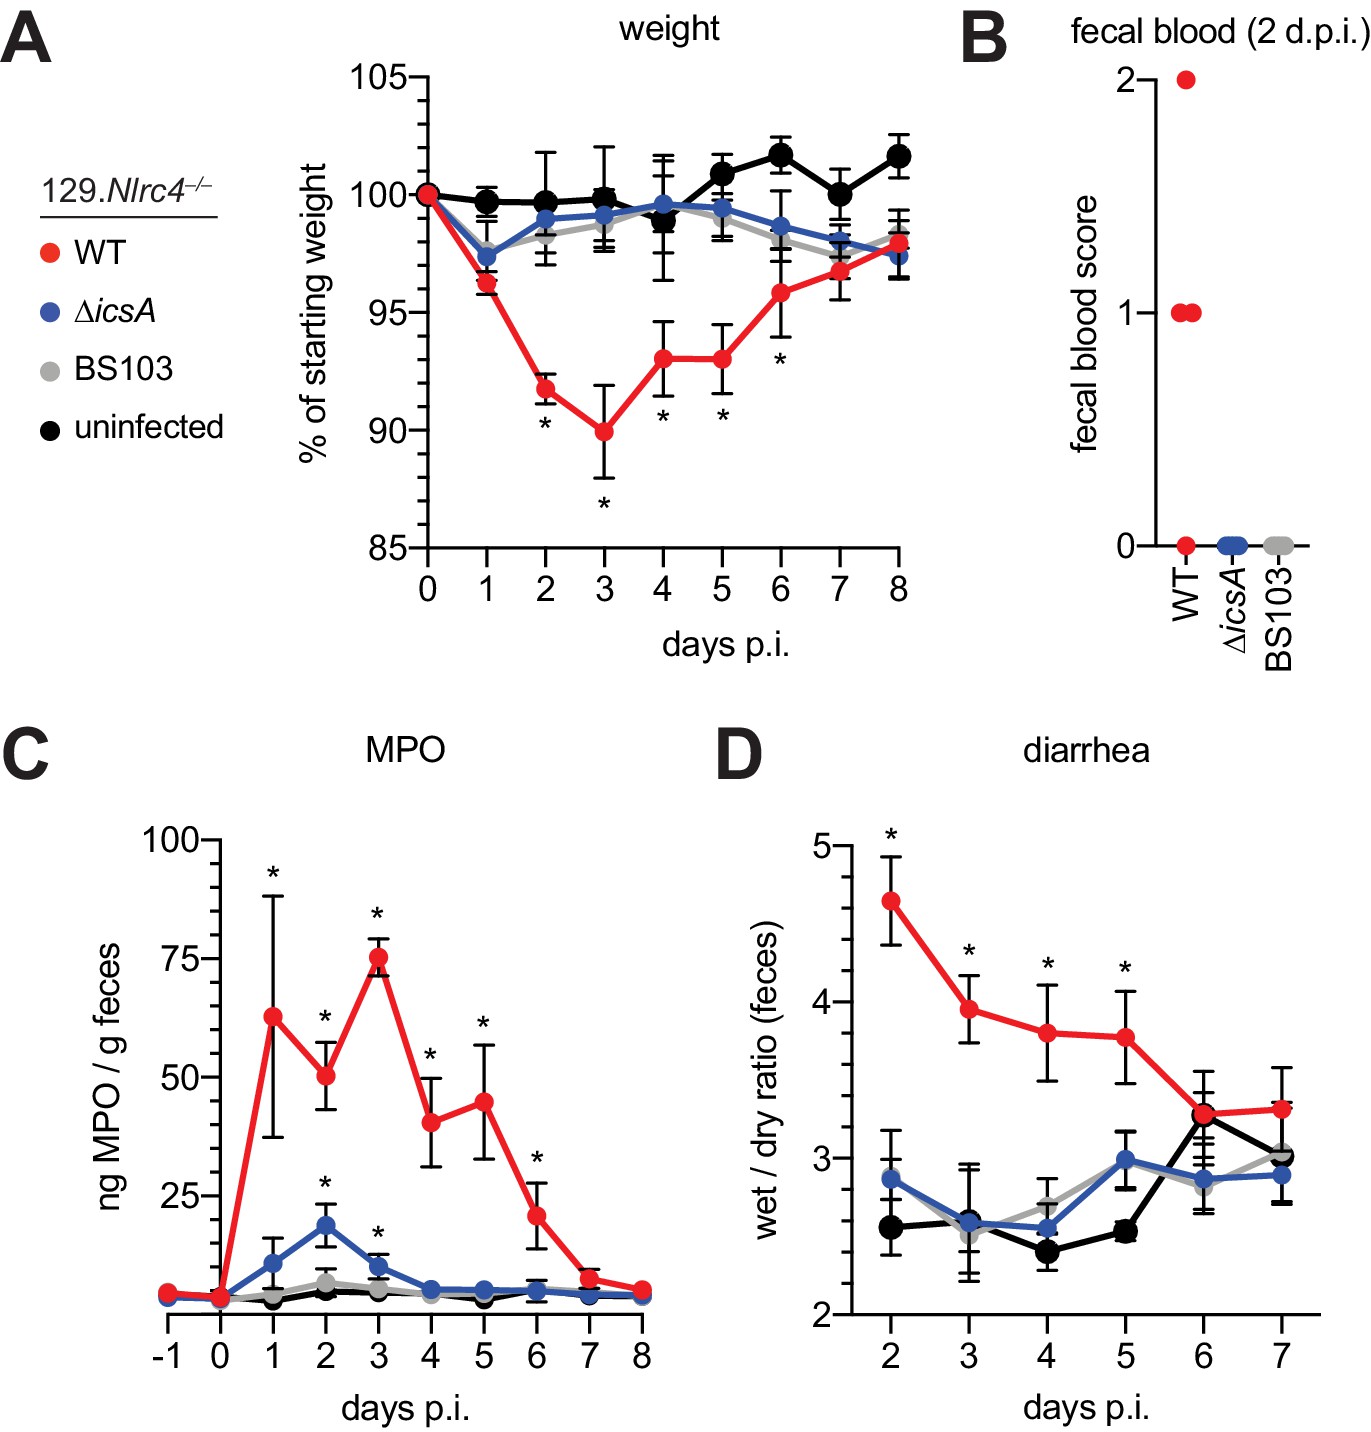
129.Nlrc4–/– mice are resistant to attenuated Shigella strains.
(A–D) 129.Nlrc4–/– littermates were uninfected (black) or inoculated orally with 5x10⁷ CFU of WT (red), icsA mutant (blue), or BS103 (grey) Shigella 24 hours after oral streptomycin treatment and monitored for 8 days post-infection (p.i.). (A) Mouse weights. (B) Fecal blood scores from feces at 2 days post-infection (d.p.i.). 1 = occult blood, 2 = macroscopic blood. Each symbol represents feces from one mouse. (C) MPO levels measured by ELISA from feces collected -1 through 8 days p.i. (D) Quantification of diarrhea comparing weight of feces before and after dehydration. A larger ratio indicates diarrhea. (A–C) Each symbol represents the mean at a specific time point for four individual mice per infection condition. Data are representative of two independent experiments. Mean ± SEM is shown in (A–C) Mann-Whitney test, *p < 0.05. In (A,B) significance was determined by independently comparing to Day 0 and to BS103 + uninfected at the same day. In (C), significance was determined by comparing to BS103 and uninfected at the same day.
Figure 8
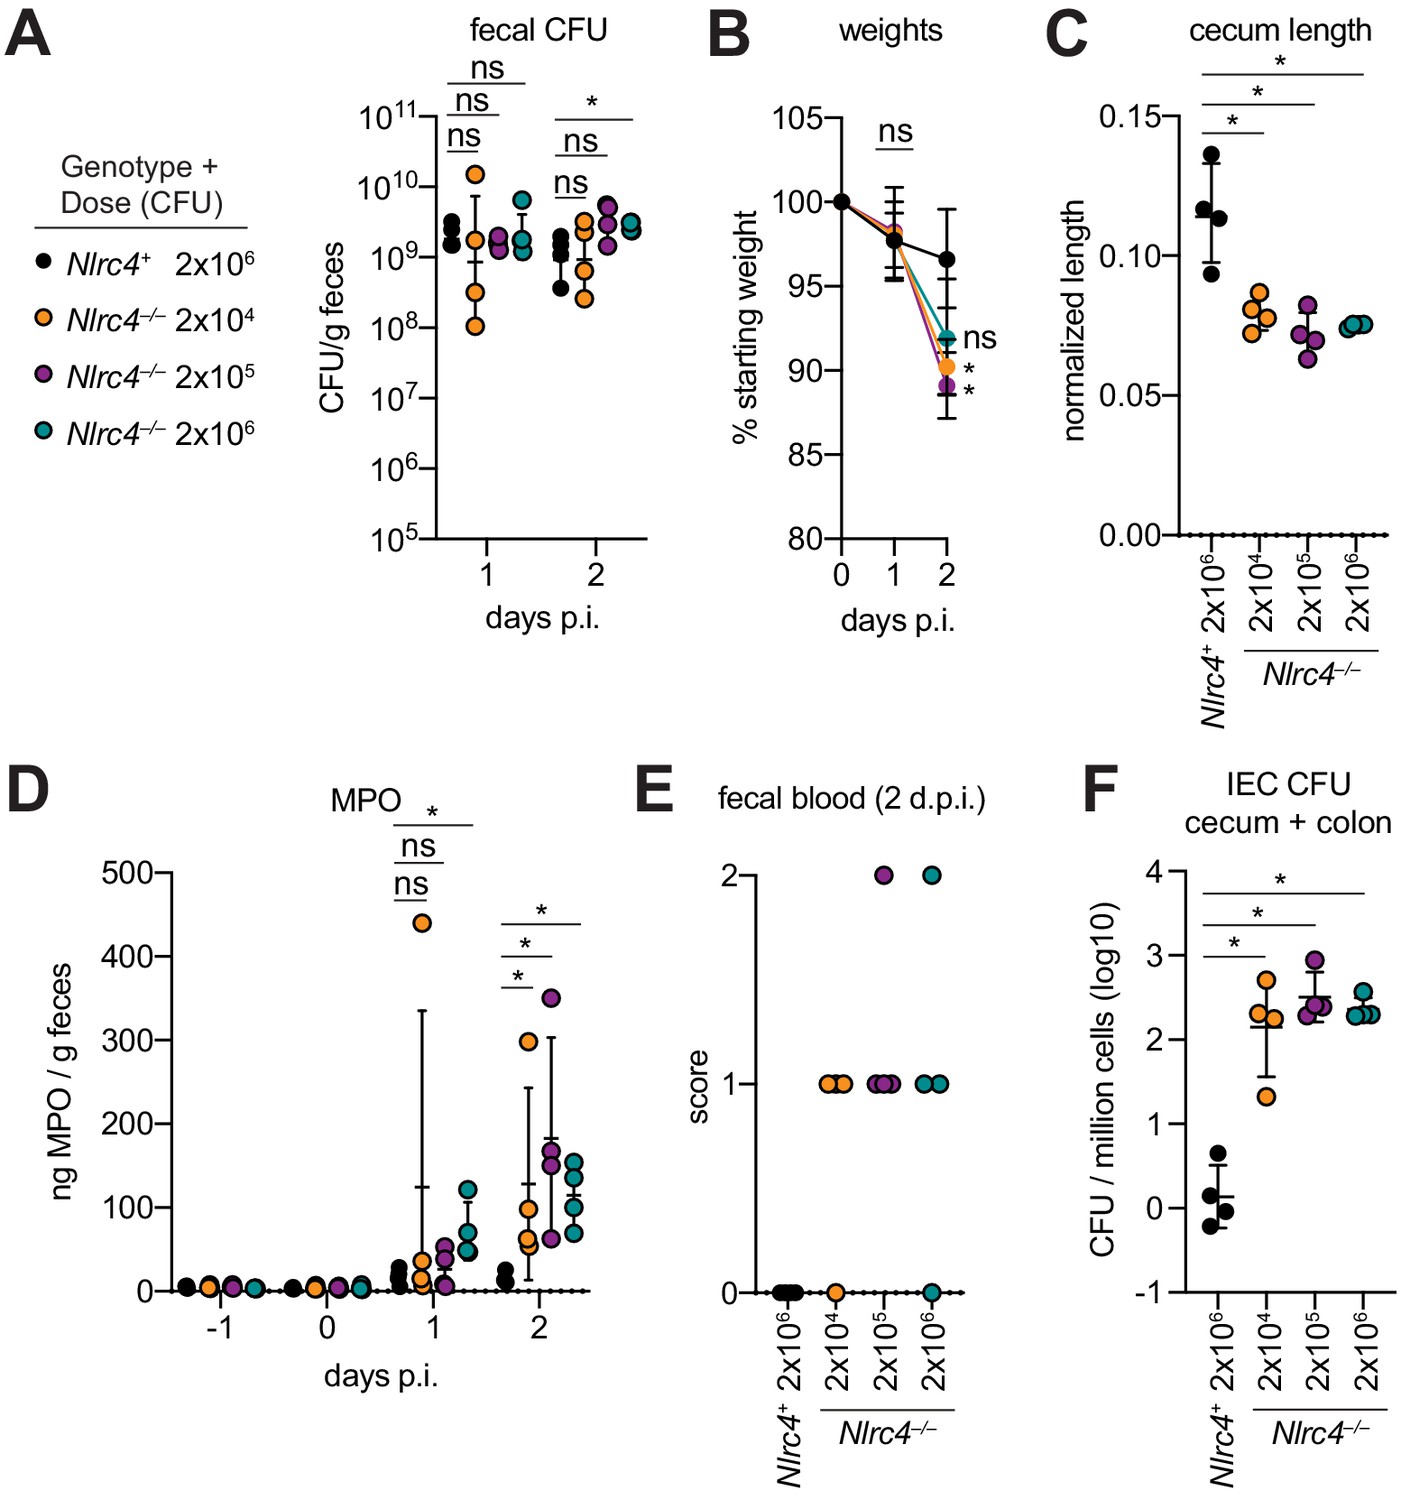
Antibiotic treated Nlrc4–/– mice are susceptible to modest infectious doses of Shigella.
(A–F) 129.Nlrc4+ mice were inoculated orally with 2x10⁶ (black) and 129.Nlrc4–/– littermates were inoculated with 2x10⁶ (teal), 2x10⁵ (purple), or 2x10⁴ (orange) CFU of WT Shigella 24 hr after oral streptomycin treatment. Endpoint harvests were done 48 hr post-infection (p.i.). (A) CFU determination from feces. (B) Mouse weights. Each symbol represents the mean at that time point. (C) Quantification of cecum length reduction normalized to the weight of the animal prior to infection; cecum length (cm) / mouse weight (g). (D) MPO levels measured by ELISA from feces collected -1 through 2 days p.i. (E) Fecal blood scores from feces at 2 days post-infection (d.p.i.). 1 = occult blood, 2 = macroscopic blood. (F) CFU determination from the IEC enriched fraction of gentamicin-treated cecum and colon tissue (combined). (A, C–F) Each symbol represents one mouse. Data are representative of two independent experiments. Mean ± SD is shown in (A–D). Geometric mean ± SD is show in (F). Figure Mann-Whitney 8 test, *p < 0.05, ns = not significant (p > 0.05).
Author response image 1
Tables
Key resources table
| Reagent type (species) or resource | Designation | Source or reference | Identifiers | Additional information |
|---|---|---|---|---|
| Strain, strain background (Mus musculus, C57BL/6J) | WT | Jax and Vance Lab colony, Jax stock No. 000664 | Source of BMDMs | |
| Strain, strain background (Mus musculus, C57BL/6J) | Nlrc4–/– | Vance Lab colony, (Tenthorey et al., 2020) | Source of BMDMs | |
| Strain, strain background (Mus musculus, C57BL/6J) | ∆Naip mice (also called Naip1-6∆/∆) | Vance Lab colony (Rauch et al., 2016) | ||
| Strain, strain background (Mus musculus, C57BL/6J) | Casp1/11–/– | Vance Lab colony (Li et al., 1995) | ||
| Strain, strain background (Mus musculus, C57BL/6J and C57BL/6N mixed) | iNlrc4 | Vance Lab colony (Rauch et al., 2017) | These mice encode a Cre-inducible Nlrc4 gene in theRosa26 locus. | |
| Strain, strain background (Mus musculus, C57BL/6J) | Vil1-Cre | Vance Lab colony, Jax stock No. 004586 | ||
| Strain, strain background (Mus musculus, 129S1/SvImJ) | WT | Jax and Vance Lab colony, Jax stock No. 002448 | Source of BMDMs, IECs | |
| Strain, strain background (Mus musculus, 129S1/SvImJ) | Nlrc4–/– | Vance Lab colony; this paper | Source of BMDMs, IECs; see Materials and methods,‘Animal Procedures’ | |
| Cell line (Homo-sapiens) | THP-1, monocyte-like (WT) | Gift from Hornung Lab | ||
| Cell line (Homo-sapiens) | THP-1, monocyte-like (Nlrc4–/–) | Gift from Hornung Lab | ||
| Cell line (Homo-sapiens) | 293T, embryonic kidney | Berkeley Cell Culture Facility | ||
| Antibody | Polyclonal Goat anti human IL-1β | R and D | AF-201-NA | (1:1000) |
| Antibody | Monoclonal mouse anti Aequorea victoria GFP | Clontech | JL-8 | (1:1000) |
| Antibody | Monoclonal mouse anti rat b-TUBULIN | Sigma | clone TUB 2.1 | (1:1000) |
| Antibody | Rabbit polyclonal anti Shigella | Abcam | ab65282 | (1:100) |
| peptide, recombinant protein | 488-phalloidin | Cytoskeleton Inc | PHDG1-A | (1:500) |
| Antibody | anti-IL-1β capture and detection | R and D | DY401 | (concentration not indicated by manufacturer) |
| Antibody | Anti-MPO capture and detection | R and D | DY3667 | (concentration not indicated by manufacturer) |
| Antibody | Anti-KC capture and detection | R and D | DY453 | (concentration not indicated by manufacturer) |
| Antibody | Capture: moncloncal rat anti mouse IL-18 | BD Biosciences and eBioscience | catalog # D047-3, clone 74 | 1:1000 |
| Antibody | Detection: moncloncal rat anti mouse IL-18 | BD Biosciences and eBioscience | catalog # D048-6, clone 93–10 c | 1:2000 |
| Chemical compound, drug | Rock inhibitor Y27632 | Stem Cell | 72304 | |
| Chemical compound, drug | TGF-Smad inhibitor SB431542 | Stem Cell | 72234 | |
| Peptide, recombinant protein | Mouse TRANCE (RANKL) (carrier-free) | BioLegend | 577102 | |
| Chemical compound, drug | Basement Membrane Matrix (Matrigel) | Fisher | CB-40234A | |
| Peptide, recombinant protein | LFn-PA | This paper | see Materials and methods, ‘Toxins’ | |
| Peptide, recombinant protein | LFn-MxiH | This paper | see Materials and methods, ‘Toxins’ | |
| Peptide, recombinant protein | LFn-FlaA | Rauch et al., 2017 | ||
| Strain, strain background (Shigella flexneri serovar 2a) | WT 2457T | |||
| Strain, strain background (Shigella flexneri serovar 2a) | BS103 | Maurelli et al., 1984 | ||
| Strain, strain background (Shigella flexneri serovar 2a) | icsA | Goldberg and Theriot, 1995 |
Additional files
Download links
A two-part list of links to download the article, or parts of the article, in various formats.
Downloads (link to download the article as PDF)
Open citations (links to open the citations from this article in various online reference manager services)
Cite this article (links to download the citations from this article in formats compatible with various reference manager tools)
NAIP–NLRC4-deficient mice are susceptible to shigellosis
eLife 9:e59022.
https://doi.org/10.7554/eLife.59022


