Dual midbrain and forebrain origins of thalamic inhibitory interneurons
- Department of Basic and Clinical Neuroscience, Institute of Psychiatry, Psychology and Neuroscience, King’s College London, United Kingdom
- Department of Bioengineering, Imperial College London, United Kingdom
- Department of Life Sciences and Centre for Neurotechnology, Imperial College London, United Kingdom
- Department of Physics and Astronomy, University College London, United Kingdom
- RIKEN, Center for Brain Science (CBS), Japan
- The Solomon H. Snyder Department of Neuroscience, School of Medicine, Johns Hopkins University, United States
Figures
Figure 1

Automated total counts of GFP+ cells in the thalamus of the Sox14GFP/+ mouse.
(A) Autofluorescence (Autofl.) from serial two-photon imaging of Sox14GFP/+ mice (n = 3) at 0.54 × 0.54 × 10 μm voxel resolution was registered to the Allen Institute CCF3 atlas using Elastix (left; scale bar 1 mm). This permits delineation and identification of all anatomical structures according to the Allen Institute hierarchical taxonomy (right; scale bar 100 μm). (B) Automated cell detection was done using a U-Net trained on 219 manually segmented images (512 × 512 pixels) augmented to a total sample size of 12,264, split 75% for training and 25% validation. Images containing GFP fluorescence were passed into the trained U-Net (left) for cell prediction based on learned features during training (right; scale bar 100 μm). Oversampling in the z-axis was corrected for by grouping and averaging detected cell positions which colocalised within a defined cell radius. (C) Example illustration of automatically detected cells in the LGd and VB complex projected onto a representative coronal section of the thalamus. (D) Quantification of GFP+ cells in the LGd at 1234 ± 82 (mean ± SD) validated against stereological study by Evangelio et al., 2018 of 1255 ± 195 (mean ± SD) interneurons in the LGd. Other counts are shown for LP, VB complex [VPM, parvicellular part of the ventral posteromedial nucleus (VPMpc), VPL, parvicellular part of the ventral posterolateral nucleus (VPLpc), VAL, VM], MGv, MGd, and PO.
Figure 2 with 1 supplement
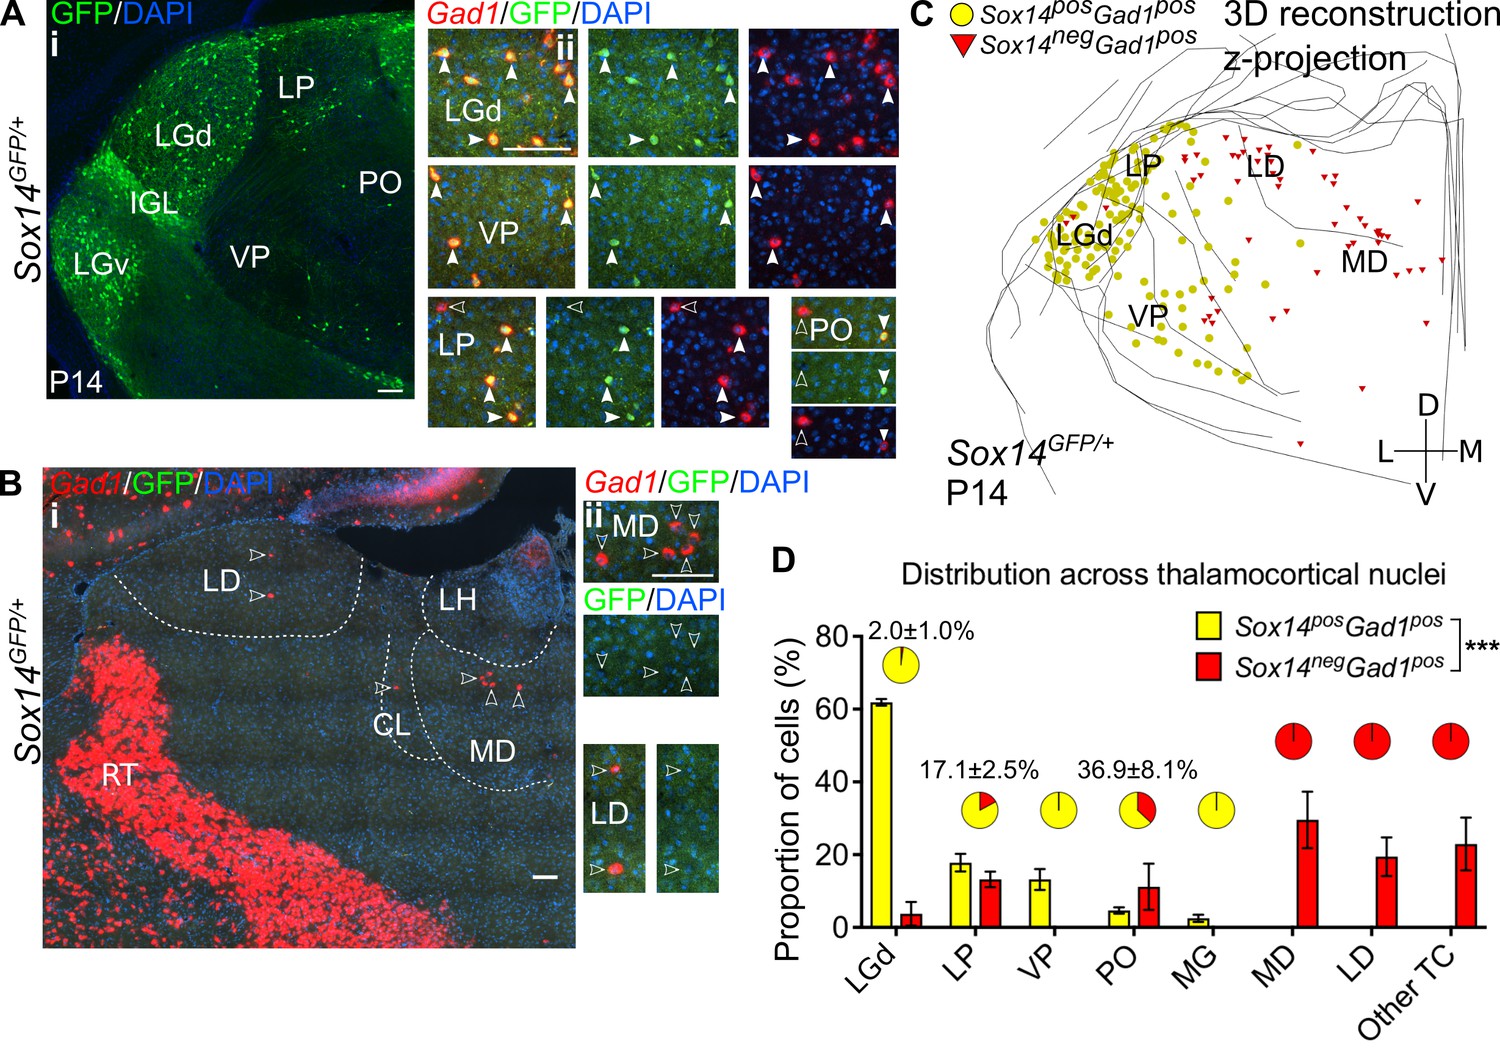
Diversity and distribution of GABAergic cells in the mouse thalamocortical nuclei.
(A) (i) Representative coronal section of P14 Sox14GFP/+ thalamus with Sox14+ cells in the LGd, VP, LP, and PO. (ii) Sox14+ cells in TC regions co-express Gad1, but not all Gad1+ cells co-express Sox14 in the LP and PO. Filled arrows mark Sox14+Gad1+ and empty arrows Sox14-Gad1+ cells. Scale bars, 100 μm. (B) (i) Representative rostral coronal section of P14 Sox14GFP/+ thalamus with Gad1+ cells in the MD, CL, and LD, which contain no Sox14+ cells. (ii) Gad1+ cells in these nuclei do not co-express Sox14. Scale bars, 100 μm. (C) 3D reconstruction of a representative P14 Sox14GFP/+ thalamus from tracing every tenth 20-µm-thick coronal section, displayed as a z-projection and showing distribution of Sox14+Gad1+ (yellow) and Sox14-Gad1+ cells (red). One dot represents one neuron. (D) Distribution of Sox14+Gad1+ and Sox14-Gad1+ cells across TC nuclei in the Sox14GFP/+ brains at P14, plotted as proportion of all the cells within each interneuron group (mean ± SEM; n = 3 brains). The category ‘other TC’ refers to regions where nuclear boundaries cannot be defined precisely and that contain VAL, VM, CL, IMD, PF, RE, RH, SPF, SPA, CM, and AM. Sox14+Gad1+ and Sox14-Gad1+ populations have distinct distributions (p<10-3 chi-squared test). Pie charts show the proportion (mean ± SEM) of the two interneuron classes within each nucleus.
Figure 2—figure supplement 1
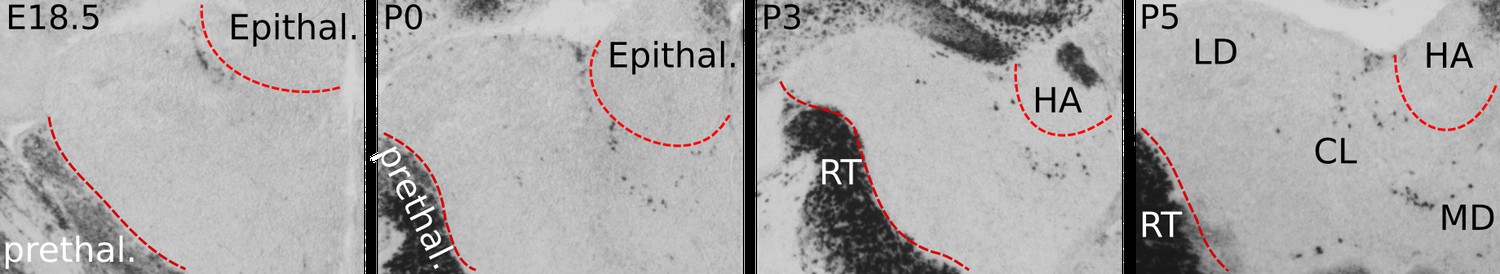
Perinatal distribution of Gad1+ cells in the anterior thalamus.
Before birth, Gad1+ cells are not present within rostral thalamic tissue that harbours HO nuclei including the LD, CL, and MD. By E18.5, a cluster of Gad1+ cells is present at the outer edge of the thalamus, bordering the epithalamus. From this location, Gad1+ cells appear to spread medially first, following the contour of the ventral edge of the habenula (HA), part of the epithalamus. At P0 and during the following 4 days, Gad1+ cells appear to penetrate thalamic tissue and to scatter in the LD, CL, and MD.
Figure 3 with 1 supplement
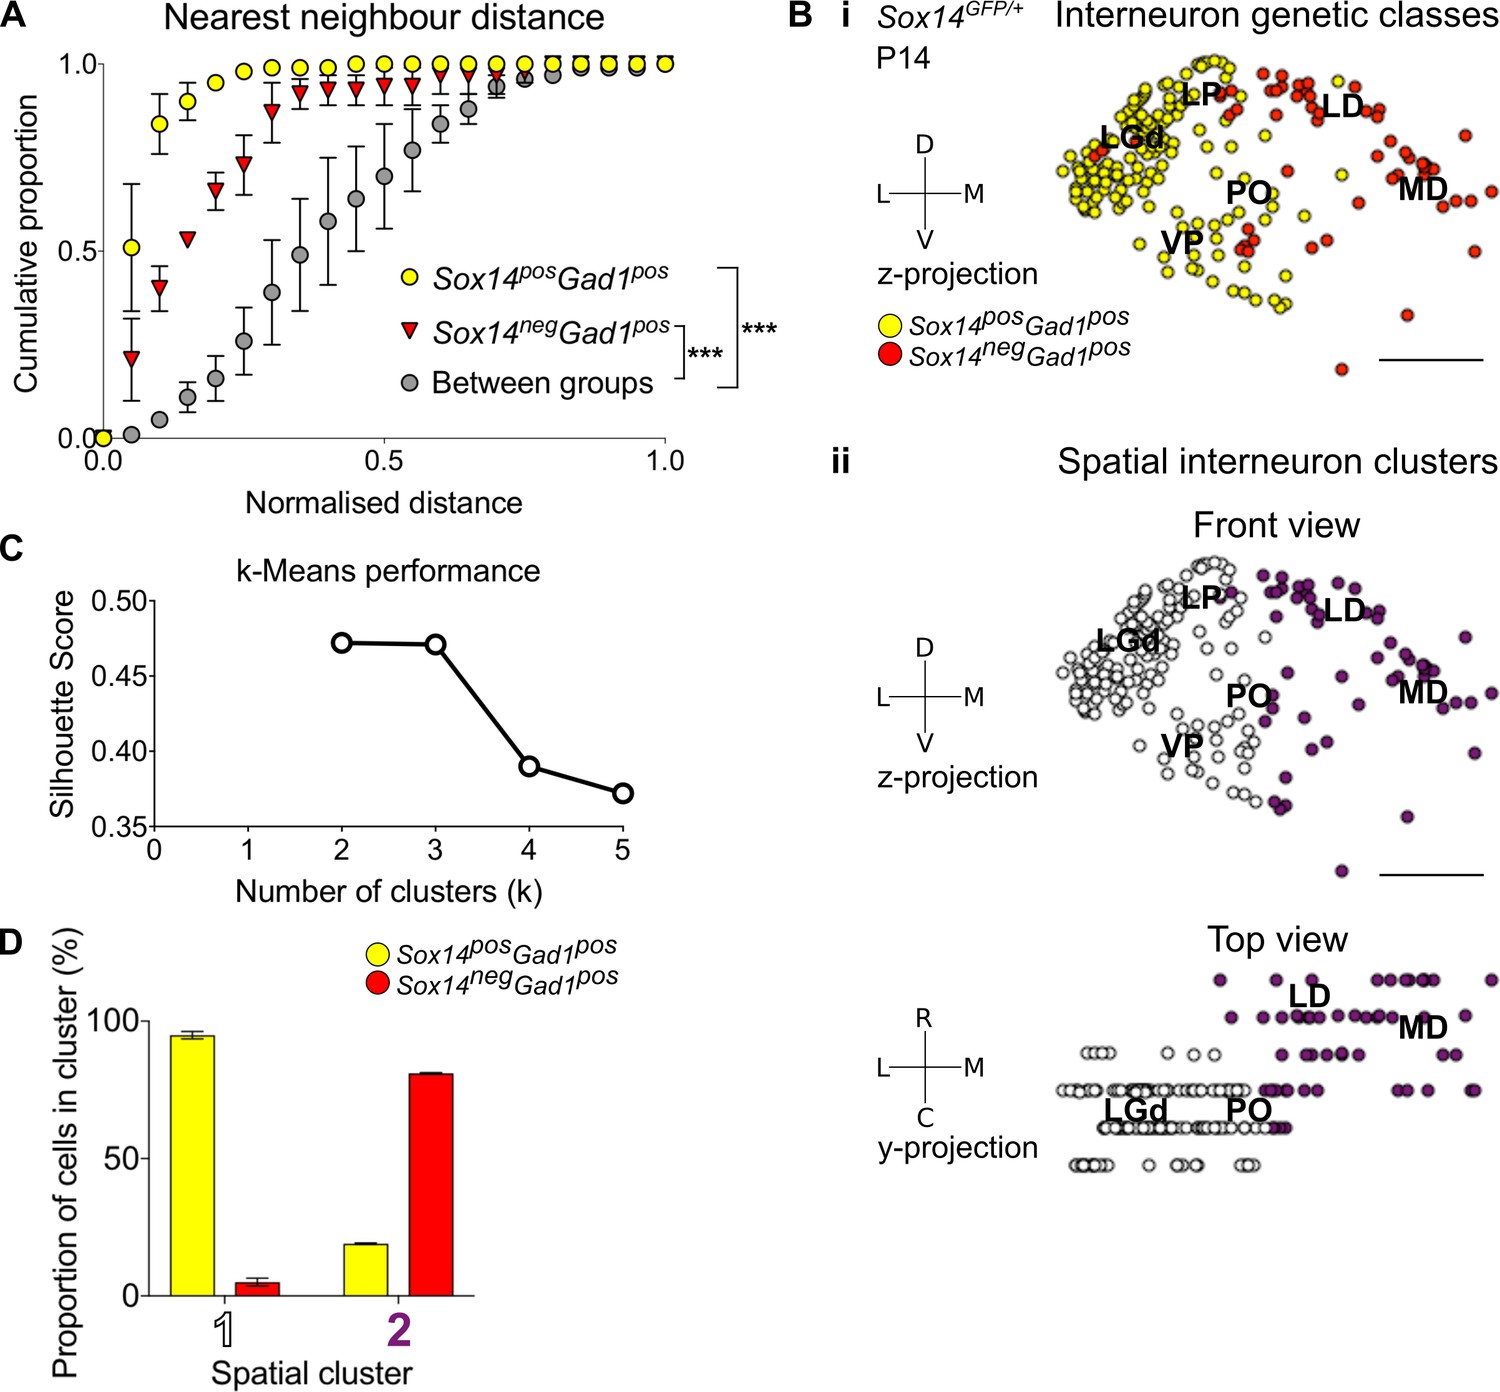
Spatial organisation of thalamic GABAergic cells.
(A) Normalised nearest neighbour distance (NND) for Sox14+Gad1+ and Sox14-Gad1+ populations and between the two groups from P14 Sox14GFP/+ data (Figure 2), plotted as cumulative proportion of all cells within a given set. The NND distribution is significantly shifted to larger distances between groups than within each of the groups (p<1.4 × 10⁻³⁰, two-sample Kolmogorov–Smirnov test, n = 3 brains). (B) Representative z-projections of interneuron distribution amongst TC nuclei, from P14 Sox14GFP/+ data (Figure 2). One dot represents one neuron and they are colour coded by (i) their genetic identity or (ii) spatial cluster. For the spatial clusters a y-projection is also shown. Scale bars, 500 µm. (C) Performance of unsupervised k-means algorithm in identifying thalamic interneuron spatial clusters from the P14 Sox14GFP/+ data (n = 3 brains, see also Figure 2) as measured by the silhouette score, which varies with number of clusters (k). We choose k = 2 as this point has the highest score. (D) Proportion of Sox14+ and Sox14- GABAergic cells in each spatial cluster, averaged over three brains (mean ± SEM).
Figure 3—figure supplement 1
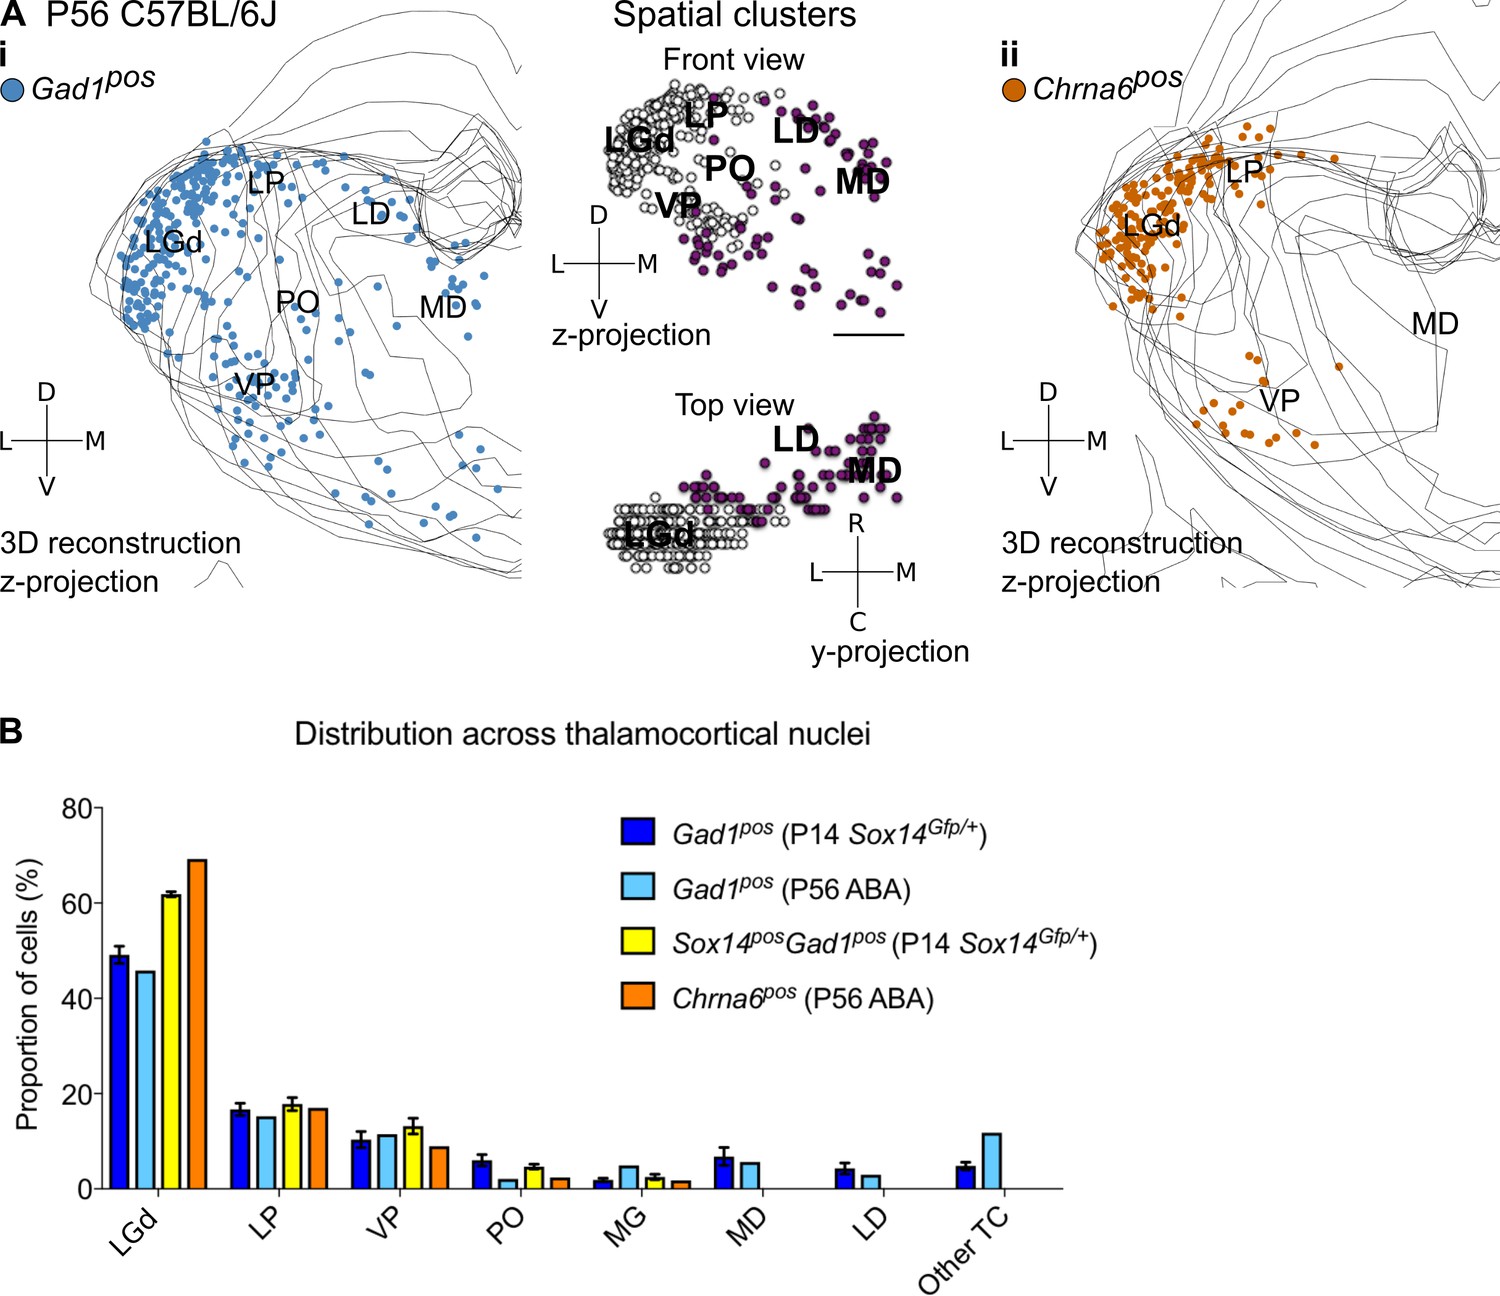
Spatial organisation of Gad1+ and Chrna6+ cells in the adult mouse thalamus.
(A) 3D reconstruction of a representative P56 mouse thalamus from tracing every eight 25-µm-thick coronal section, displayed as a z-projection and showing distribution of (i) Gad1+ and (ii) Chrna6+ cells. In (i), k-means clustering was applied to the data using k = 2 (highest silhouette score, 0.512); the resulting spatial clusters are shown as a z- and y-projection and colour coded. One dot represents one neuron. ISH data was downloaded from the Allen Mouse Brain Atlas (2004 Allen Institute for Brain Science. Allen Mouse Brain Atlas. Available from: mouse.brain-map.org; Lein et al., 2007). (B) Distribution of Gad1+ and Chrna6+ cells across TC nuclei (n = 1 brain/marker) is compared to all Gad1+ and Sox14+Gad1+ cells from P14 Sox14GFP/+ thalamus (n = 3 brains; see also Figure 2).
Figure 4

SOX14+GAD1+ interneurons dominate TC regions of the non-human primate marmoset.
Representative coronal sections of the thalamus of a new-born marmoset illustrating the distribution of cells expressing the SOX14 (green) and GAD1 (red) mRNAs. (A) Caudal plane containing subdivisions of the pulvinar complex, the PO, and the auditory MG. Also visible are parafascicular (PaF) nuclei. Fr, fasciculus retroflexus; 3V, third ventricle. (Ai–iii) Magnifications of indicative areas of the medial (MPul) and anterior pulvinar (APul), the lateral pulvinar (LPul), and inferior pulvinar (IPul). (Aiv). Magnification of a region of the PO. (Av and vi). Magnifications of representative regions of the ventral (MGv) and dorsal (MGd) subdivisions of the auditory thalamus. (B) Middle plane section containing the sensory TC nuclei LGd, VPM, VPL, and other non-TC structures (ZI, RT, and SubG). (Bi–iii). Magnifications illustrating the dominant presence of SOX14+GAD1+ interneurons in the sensory FO nuclei. (C) Anterior plane containing the VAL, centromedial (CM), anteroventral (AV), LD, and MD. The prethalamic RT is recognisable as an entirely SOX14-GAD1+ structure. (Ci). Magnification of an area of the LD containing comparable densities of SOX14+ and SOX14- interneurons. (Cii). Magnification of an area of the MD containing SOX14+ and SOX14- interneurons. (D) Fraction of SOX14+GAD1+ (yellow) and SOX14-GAD1+ (red) interneurons in selected TC nuclei. Above each bar the total cell counts from nine regions of interest (ROI) measuring 263 μm by 263 μm per each TC nucleus in three age-matched brains (three ROI per TC nucleus per brain). The average fraction of SOX14-GAD1+ interneurons deviates significantly from background level in the MD and LD. Scale bars: low magnification; overviews: ~1 mm; magnified areas:~0.2 mm.
Figure 5
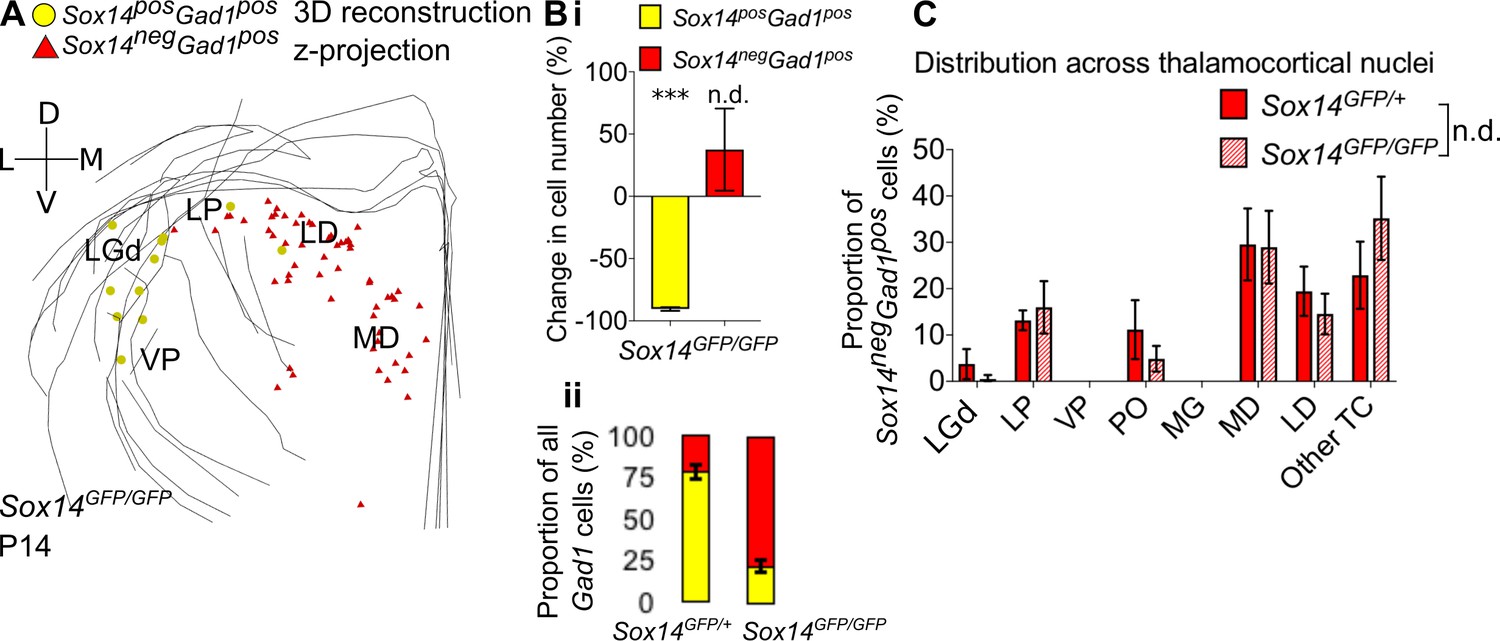
Differential requirement for Sox14 highlights two distinct developmental classes.
(A) Differential requirement for Sox14 highlights two distinct developmental classes. 3D reconstruction of a representative P14 Sox14GFP/GFP thalamus from tracing every tenth 20-µm-thick coronal section, displayed as a z-projection and showing distribution of Sox14+Gad1+ (yellow) and Sox14-Gad1+ cells (red). (B) (i) Relative change in the number of GFP+Gad1+ and GFP-Gad1+ cells across TC regions in P14 Sox14GFP/GFP relative to P14 Sox14GFP/+ data (mean ± SEM, n = 3 brains/genotype). There is a significant reduction in the GFP+Gad1+ population (p=2.7 × 10⁻⁴, two-sample two-tailed t-test), but no statistically significant difference in the size of the GFP-Gad1+ group (p=0.4, two-sample two-tailed t-test). (ii) Proportion of GFP+Gad1+ cells within the total GABAergic population is decreased in the Sox14GFP/GFP (mean ± SEM, n = 3 brains/genotype). (C) Distribution of GFP-Gad1+ cells across TC nuclei in the Sox14GFP/+ and Sox14GFP/GFP brains at P14 (mean ± SEM; n = 3 brains/genotype). GFP-Gad1+ distribution is unaltered in the Sox14 KO (p>0.05, chi-squared test).
Figure 6
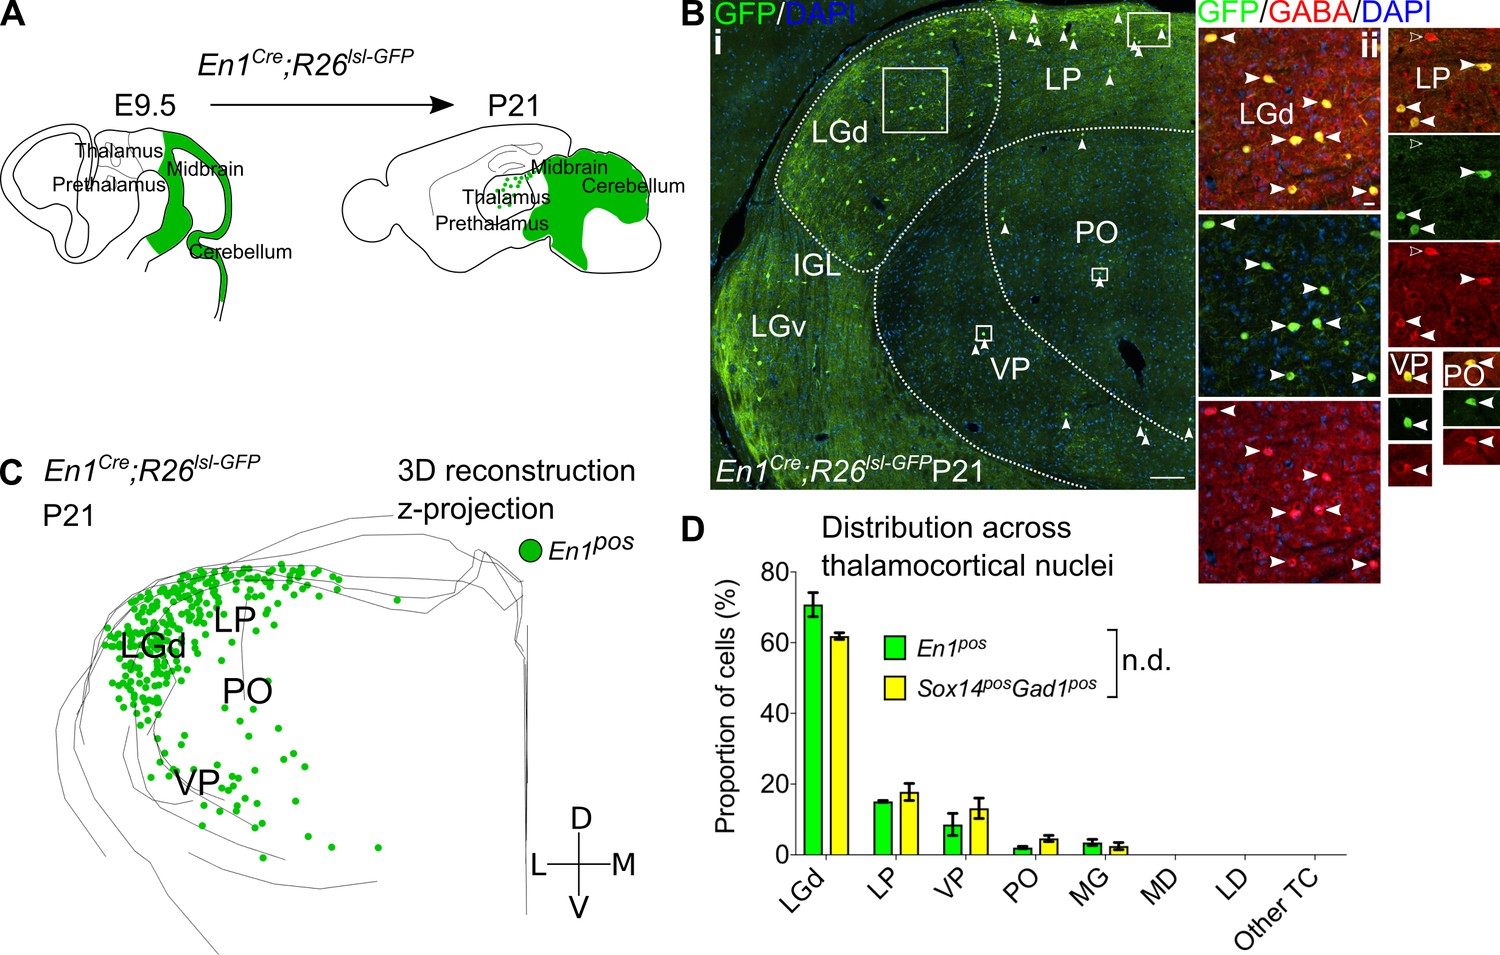
Sox14+ interneurons in TC regions derive from the midbrain.
(A) Schematic of the fate mapping experiment: crossing En1Cre with Rosa26lsl-GFP reporter line permanently labels all midbrain born cells with GFP expression. (B) (i) Representative coronal section of P21 En1Cre; Rosa26lsl-GFP thalamus with En1+ cells observed in the LGd, LP, VP, and PO (considering TC regions only). For clarity some of the En1+ cells are indicated with white arrows. Scale bar, 100 µm. (ii) En1+ cells in these regions co-express GABA (filled white arrows). Empty arrows mark GABA single-positive cells. Scale bar, 10 µm. (C) 3D reconstruction of a representative P21 En1Cre; Rosa26lsl-GFP thalamus from tracing every sixth 60-µm-thick coronal section, displayed as a z-projection and showing distribution of En1+ cells. (D) Distribution of Sox14+Gad1+ and En1+ cells across TC nuclei in Sox14GFP/+ and En1Cre; Rosa26lsl-GFP brains, respectively, plotted as proportion of all the cells within each group (mean ± SEM; n = 3 brains/genotype). The two populations are not differently distributed (p>0.05, chi-squared test).
Figure 7 with 1 supplement
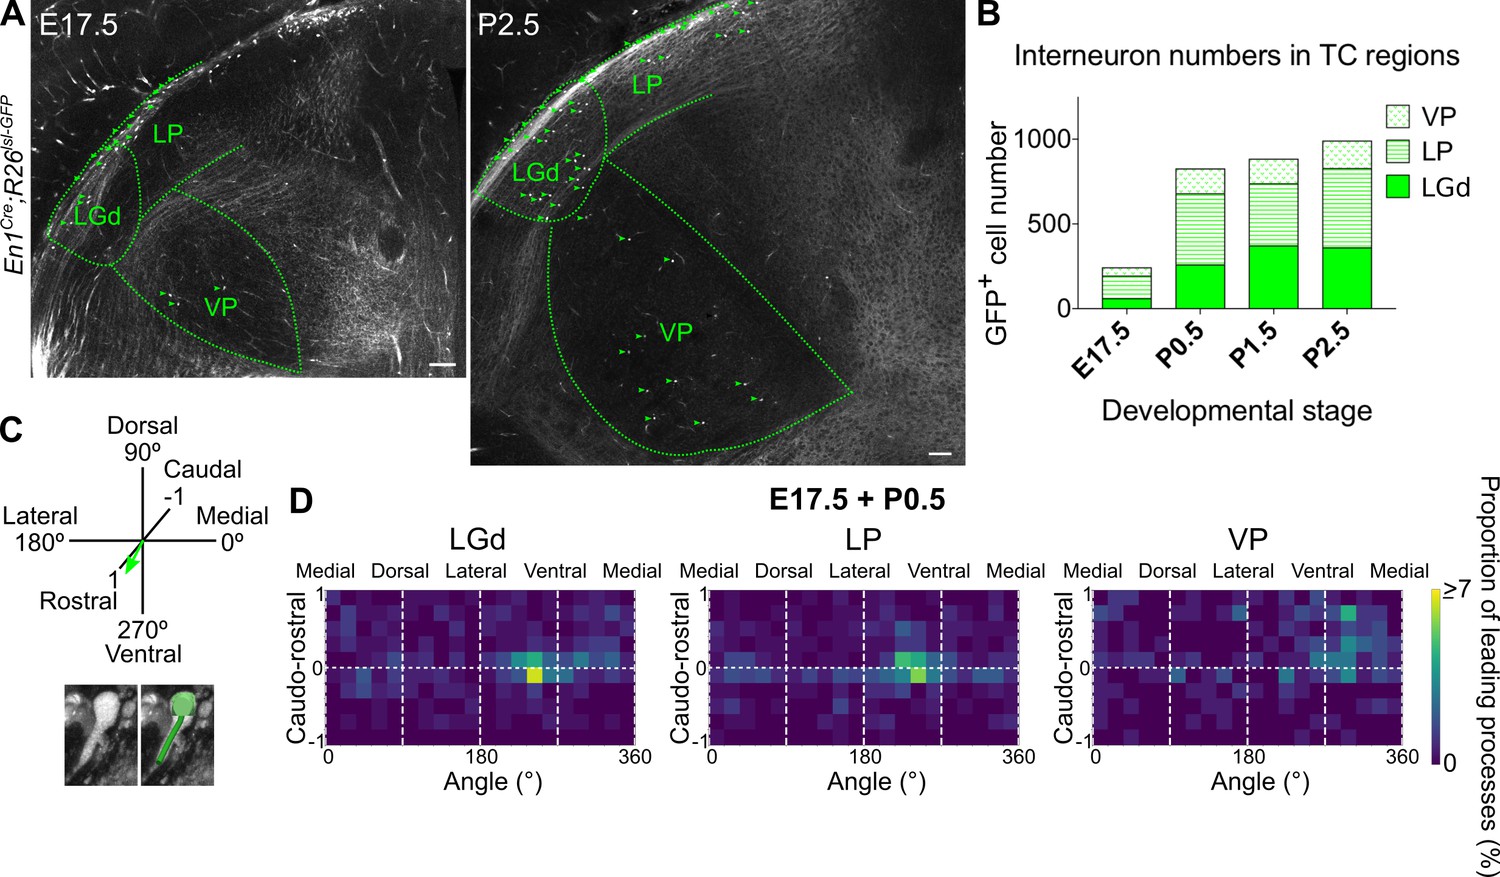
Midbrain-derived interneuron precursors progressively populate the thalamus from E17.5 onwards.
(A) Representative coronal sections of En1Cre; Rosa26lsl-GFP thalamus at E17.5 and P2.5. Green arrows mark some of the GFP+ cells. Scale bars, 100 µm. (B) Number of GFP+ cells counted in the LGd, LP, and VP from E17.5 to P2.5 (mean, n = 3 brains). (C) Leading process orientation of GFP+ cells was determined along the caudo-rostral, ventro-dorsal, and latero-medial dimensions. (D) Frequency distribution of leading process orientation for GFP+ cells in the LGd, LP, and VP at E17.5 and P0.5 combined, represented in heat maps (n = 3 brains/developmental stage).
Figure 7—figure supplement 1
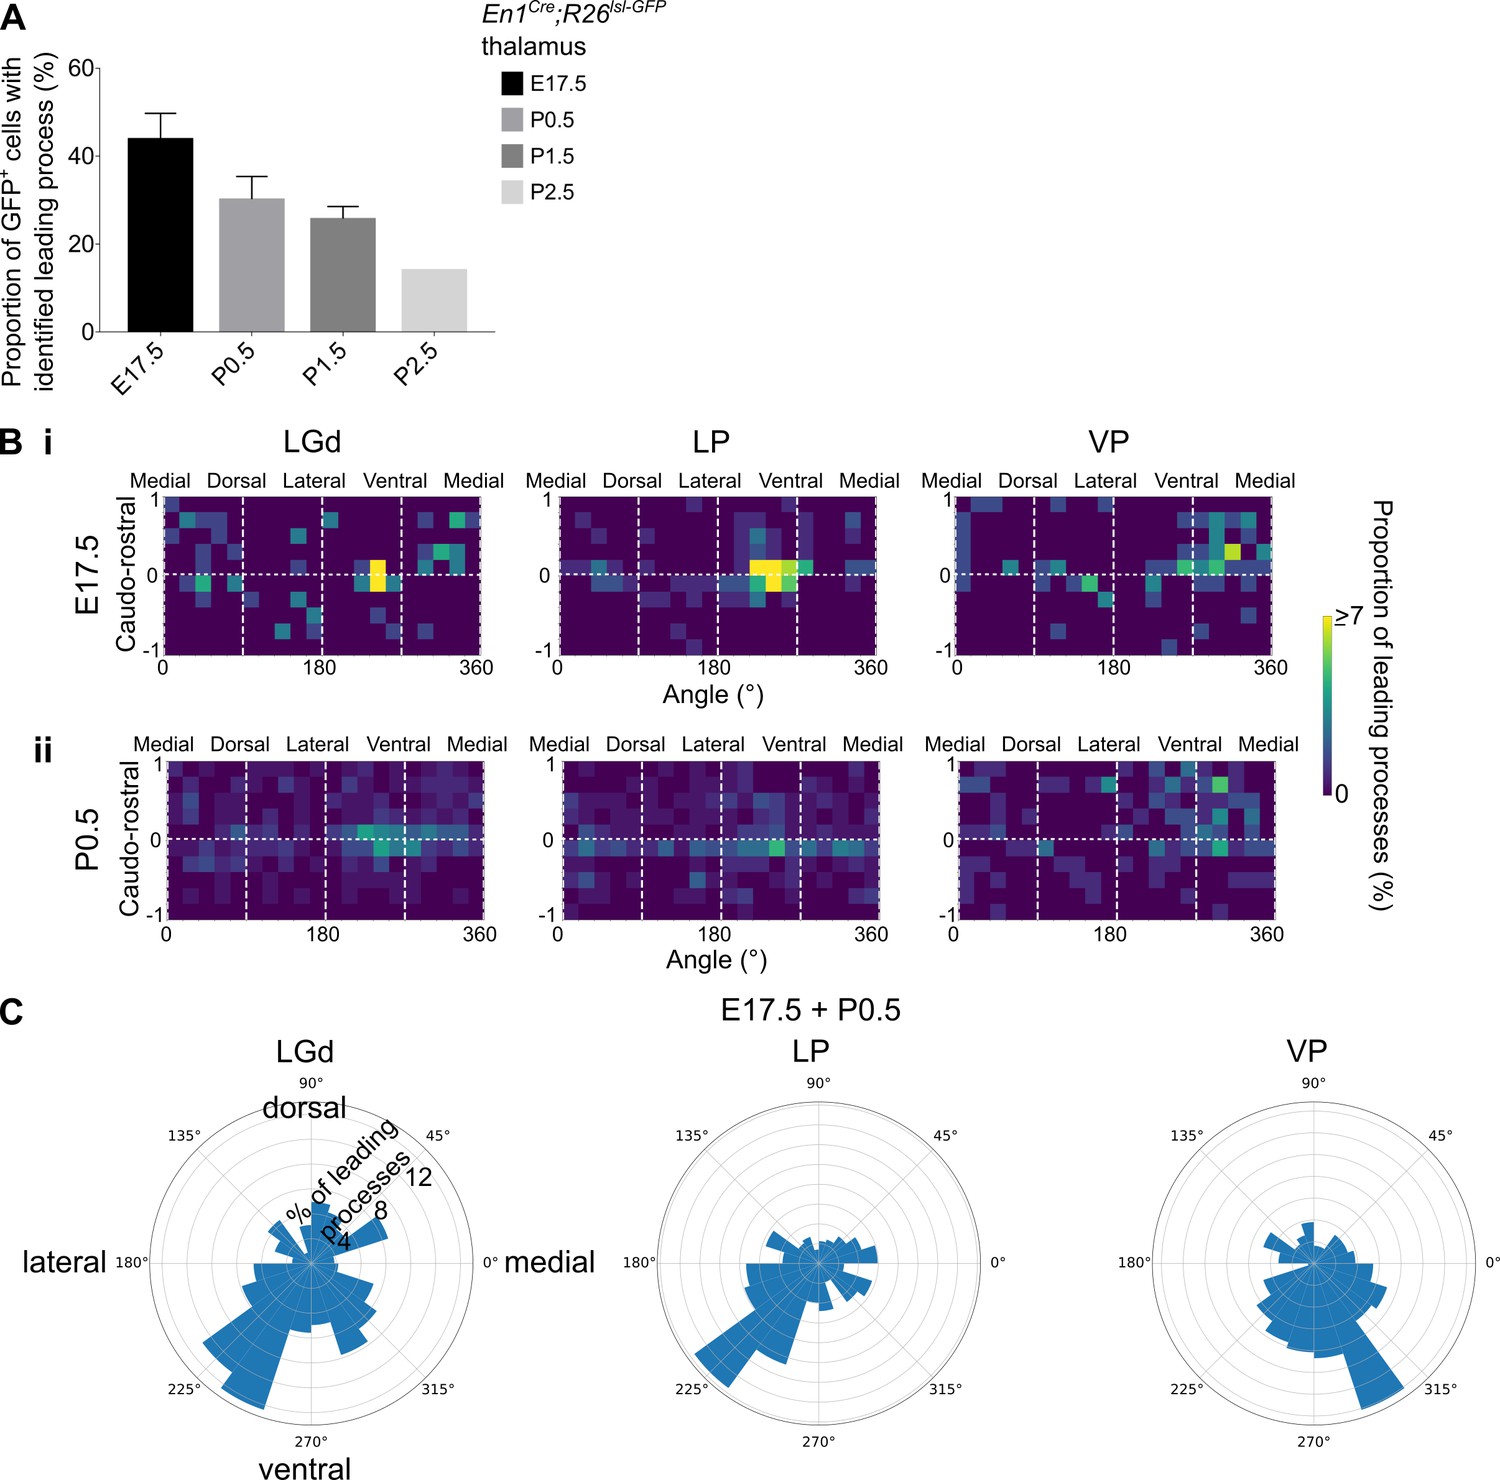
Distinct leading process orientation between interneuron precursors in the LGd and LP compared to VP.
(A) Proportion of GFP+ cells in the LGd, LP, and VP combined, for which a leading process could be identified, in E17.5-P2.5 En1Cre; Rosa26lsl-GFP brains (mean ± SEM, n = 3 brains/developmental stage, apart from P2.5 where n = 1 brain). (B) Frequency distribution of leading process orientation for GFP+ cells in the LGd, LP, and VP at (i) E17.5 and (ii) P0.5 separately, represented in heat maps (n = 3 brains/developmental stage). (C) Polar histograms of leading process orientation in the latero-medial and ventro-dorsal plane for GFP+ cells in the LGd, LP, and VP at E17.5 and P0 combined (n = 3 brains/developmental stage).
Figure 8 with 1 supplement

Sox14-Pvalb+ interneurons in TC regions derive from the Dlx5pos, Foxd1pos, Nkx2.1neg, and Lhx6neg rostral forebrain.
(A) Schematic of the fate mapping experiment: crossing Dlx5/6Cre with Rosa26lsl-GFP reporter line permanently labels all ventral telencephalic, hypothalamic, and prethalamic-born cells with GFP expression. (B) (i) Representative coronal sections of P14 Dlx5/6Cre; Rosa26lsl-GFP thalamus with Dlx5+Pvalb+ cells present in the MD, LD, CL, VAL, VM, LP, and PO (considering TC regions only). Scale bar, 100 µm. (ii) Dlx5+Pvalb+ cells in TC regions co-express GABA. Scale bar, 100 µm. (C) Distribution of Dlx5+Pvalb+ and Sox14-Gad1+ cells across TC nuclei in P14 Dlx5/6Cre; Rosa26lsl-GFP and Sox14GFP/+ brains, respectively, plotted as proportion of all the cells within each group (mean ± SEM, n = 3 brains/genotype). The two populations are not differently distributed (p>0.05, chi-squared test). (D) 3D reconstruction of a representative P14 Dlx5/6Cre; Rosa26lsl-GFP thalamus from tracing every sixth 60-µm-thick coronal section, displayed as a z-projection and showing distribution of Dlx5+Pvalb+ cells. (E) Schematic of the fate mapping experiment crossing the Foxd1Cre with Rosa26lsl-nuclearGFP reporter line to permanently label hypothalamic and prethalamic-born cells with nuclear membrane localised GFP. (F) Representative coronal sections of P14 Foxd1Cre; Rosa26lsl-nuclearGFP thalamus with Foxd1+Pvalb+ cells present in the LD, CL, MD, and LP. Scale bar, 100 µm. Enlarged areas (red boxes) showing Foxd1+Pvalb+ cells co-expressing GABA. Additional GABA+ but Foxd1-Pvalb- neurons are also visible in the LP (red arrows). HA: habenula. (G) Schematic of the fate mapping experiment: crossing Nkx2.1Cre with Rosa26lsl-GFP reporter line permanently labels some hypothalamic and all MGE-born cells with GFP expression. (H) (i) Representative coronal sections of P14 Nkx2.1Cre; Rosa26lsl-GFP thalamus with Pvalb+ and Nkx2.1+ cells present in the MD, LD, CL, VAL, VM, LP, and PO (considering TC regions only). Scale bar, 100 µm. (ii) Nkx2.1+ cells in TC regions do not co-express Pvalb+. Scale bar, 100 µm. (I).Schematic of the fate mapping experiment crossing the Lhx6Cre with Rosa26lsl-GFP reporter line to permanently label some hypothalamic and MGE born cells with GFP. (J) (i) Representative coronal section of P14 Lhx6Cre; Rosa26lsl-GFP showing GFP+Pvalb+ cells in the hippocampus (red arrows) and GFP-Pvalb+ present in the MD, LD, and CL nuclei of the thalamus (considering TC regions only). Scale bar, 100 µm. (ii) GFP+ cells in TC regions are endothelial and do not co-express Pvalb+. Scale bar, 100 µm. (K) Proportion of Pvalb+ cells in TC regions that are Dlx5+, Foxd1+, Nkx2.1+, or Lhx6+ at P14 (mean ± SEM, Dlx5+ n = 3 brains, Foxd1+ n = 5 brains, Nkx2.1+ n = 3 brains, and Lhx6+ n = 4 brains). (L) Proportion of Dlx5+Pvalb+ and Foxd1+Pvalb+ cells in TC regions co-expressing GABA at P14 (mean ± SEM, Dlx5+ n = 3 brains, Foxd1+ n = 5 brains).
Figure 8—figure supplement 1
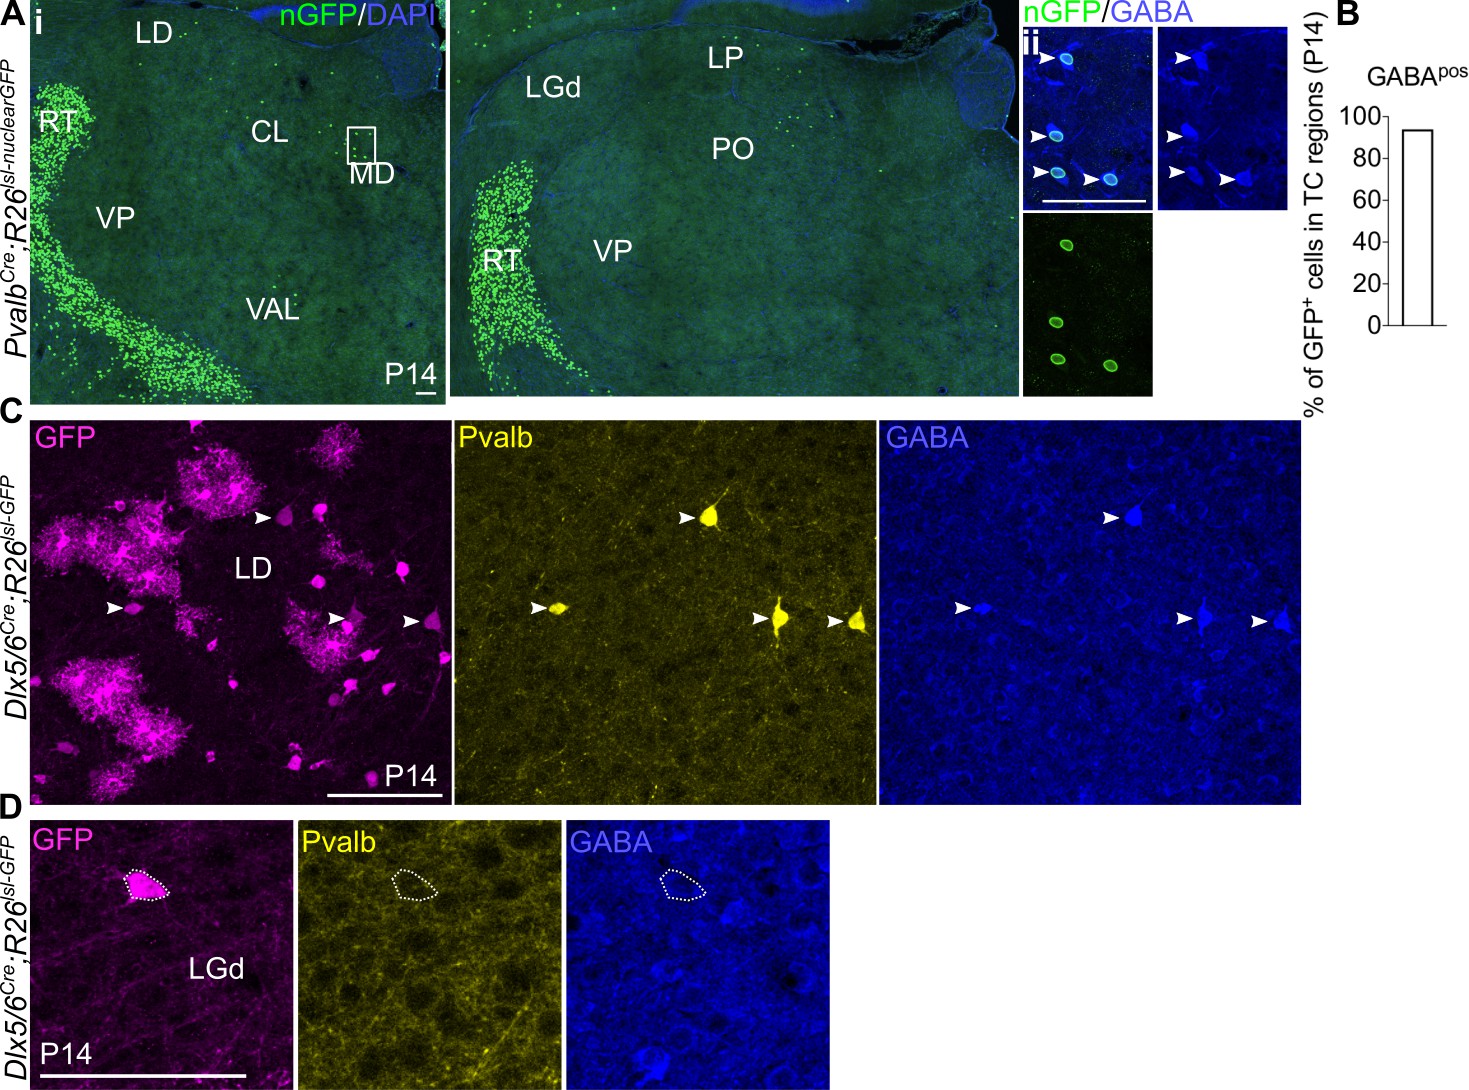
Pvalb is a marker for Sox14- thalamic interneurons.
(A) (i) Representative coronal sections of P14 PvalbCre; Rosa26lsl-nuclearGFP thalamus with GFP+ cells present in the MD, LD, CL, VAL, LP, and PO (considering TC regions only). Scale bar, 100 µm. (ii) GFP+ cells in TC regions express GABA at P14. Scale bar, 100 µm. (B) Proportion of GFP+ cells in TC regions co-expressing GABA at P14 (mean, n = 2 brains). (C) Clusters of Pvalb-GABA-Dlx5+ glia-like cells are observed across TC regions in the Dlx5/6Cre; Rosa26lsl-GFP line at P14, as shown for the LD. White arrows mark Pvalb+GABA+Dlx5+ cells. Scale bar, 100 µm. (D) Pvalb-Dlx5+ cells with neuronal morphology do not express GABA. Scale bar, 100 µm.
Videos
Video 1
A video animation of 28 z-stacks (each 100 μm) of projected coronal slices, downsized to 1 μm voxel size in XY to reduce file size.
Each slice is a maximum intensity projection across 10 serial two-photon optical slices.
Video 2
A video animation of the anatomical delineations from the Allen Institute Common Coordinate Framework (CCF3) projected onto the imaging data from a P21 Sox14GFP/+ brain.
Isotropic 10 μm voxel size.
Tables
Table 1
Animal models used in the study.
| Species | Designation | Source or reference | Identifiers | Additional information |
|---|---|---|---|---|
| Mus musculus | Sox14tm1Tmj (Sox14GFP) | Crone et al., 2008 | MGI ID: 3836003 | Maintained in the C57BL/6J (Charles River Laboratories) background |
| Mus musculus | En1Cre | Kimmel et al., 2000; The Jackson Laboratory | Stock No: 007916 MGI ID: 2446434 | C57BL/6J background |
| Mus musculus | Dlx5/6Cre | Monory et al., 2006; The Jackson Laboratory | Stock No: 008199; MGI ID:3758328 | C57BL/6J background |
| Mus musculus | PvalbCre | Hippenmeyer et al., 2005; The Jackson Laboratory | Stock No: 017320; MGI ID:3590684 | C57BL/6J background |
| Mus musculus | Nkx2.1Cre | Xu et al., 2008 | Stock No: 008661 MGI: J:131144 | C57BL/6J background |
| Mus musculus | Foxd1EGFPcre (Foxd1Cre) | Humphreys et al., 2008 | Stock No: 012463 MGI:4359653 | C57BL/6J background |
| Mus musculus | Lhx6Cre | Fogarty et al., 2007 | Stock No: 026555 MGI:4355717 | C57BL/6J background |
| Mus musculus | RCE:loxP (Rosa26lsl-GFP) | Sousa et al., 2009; The Jackson Laboratory | MMRRC Stock No: 32037-JAX MGI:4412373 | C57BL/6J background |
| Mus musculus | Gt(ROSA)26Sortm5(CAG-Sun1/sfGFP)Nat (Rosa26lsl-nuclearGFP) | Mo et al., 2015; The Jackson Laboratory | Stock No: 021039; MGI ID: 5443817 | C57BL/6J background |
| Callithrix jacchus | WT | Colony at RIKEN RRD | - | - |
Table 2
Antibodies.
| Antibody | Dilution | Incubation time | Source |
|---|---|---|---|
| Rabbit anti-GABA | 1:2000 | 2X ON, 4°C | Sigma, A2052 |
| Chicken anti-Gfp | 1:5000 | 2X ON, 4°C | Abcam, Ab13970 |
| Mouse anti-parvalbumin | 1:2000 | 1X ON, 4°C | Sigma-Aldrich, P3088 |
| Goat anti-chicken Alexa-488 | 1:500 | 2 hr, RT | Invitrogen, A11039 |
| Goat anti-rabbit Alexa-568 | 1:500 | 2 hr, RT | Invitrogen, A11036 |
| Goat anti-rabbit Alexa-647 | 1:500 | 2 hr, RT | Invitrogen, A21245 |
| Goat anti-mouse Alexa-568 | 1:500 | 2 hr, RT | Invitrogen, A11004 |
| Goat anti-mouse Alexa-635 | 1:500 | 2 hr, RT | Invitrogen, A31575 |
Table 3
Genetic identity of cells counted across TC regions and technical details of corresponding experiments.
| Transgenic line | Age | Cells annotated/counted | Number of brains | Sampling | Section thickness (µm) |
|---|---|---|---|---|---|
| Mouse | |||||
| Sox14GFP/+ | P21 | GFP+ | 3 | Whole thalamus | 50 (10; optical sections) |
| Sox14GFP/+ | P14 | GFP+ and Gad1+ | 3 | Every tenth coronal section | 20 |
| Sox14GFP/+ | P14 | GFP+ and Pvalb+ | 2 | Every sixth coronal section | 60 |
| Sox14GFP/GFP | P14 | GFP+ and Gad1+ | 3 | Every tenth coronal section | 20 |
| En1Cre; Rosa26lsl-GFP | P21-30 | GFP+ | 3 | Every sixth coronal section | 60 |
| En1Cre; Rosa26lsl-GFP | P14 | GFP+ and Pvalb+ | 3 | Every sixth coronal section | 60 |
| Dlx5/6Cre; Rosa26lsl-GFP | P14 | GFP+, Pvalb+, and GABA+ | 3 | Every sixth coronal section | 60 |
| Foxd1Cre; Rosa26lsl-nuclearGFP | P14 | GFP+, Pvalb+, and GABA+ | 5 | Every sixth coronal section | 30 |
| Nkx2.1Cre; Rosa26lsl-GFP | P14 | GFP+ and Pvalb+ | 3 | Every sixth coronal section | 60 |
| Lhx6Cre; Rosa26lsl-GFP | P14 | GFP+ and Pvalb+ | 4 | Every sixth coronal section | 60 |
| PvalbCre; Rosa26lsl-nuclearGFP | P14 | GFP+, Pvalb+, and GABA+ | 2 | Every sixth coronal section | 60 |
| Marmoset | |||||
| Wild type | P0 | SOX14 and GAD1 | 3 | Representative anterior, intermediate and posterior planes | 28 |
Additional files
Download links
A two-part list of links to download the article, or parts of the article, in various formats.
Downloads (link to download the article as PDF)
Open citations (links to open the citations from this article in various online reference manager services)
Cite this article (links to download the citations from this article in formats compatible with various reference manager tools)
Dual midbrain and forebrain origins of thalamic inhibitory interneurons
eLife 10:e59272.
https://doi.org/10.7554/eLife.59272


