Dual midbrain and forebrain origins of thalamic inhibitory interneurons
- Department of Basic and Clinical Neuroscience, Institute of Psychiatry, Psychology and Neuroscience, King’s College London, United Kingdom
- Department of Bioengineering, Imperial College London, United Kingdom
- Department of Life Sciences and Centre for Neurotechnology, Imperial College London, United Kingdom
- Department of Physics and Astronomy, University College London, United Kingdom
- RIKEN, Center for Brain Science (CBS), Japan
- The Solomon H. Snyder Department of Neuroscience, School of Medicine, Johns Hopkins University, United States
Abstract
The ubiquitous presence of inhibitory interneurons in the thalamus of primates contrasts with the sparsity of interneurons reported in mice. Here, we identify a larger than expected complexity and distribution of interneurons across the mouse thalamus, where all thalamic interneurons can be traced back to two developmental programmes: one specified in the midbrain and the other in the forebrain. Interneurons migrate to functionally distinct thalamocortical nuclei depending on their origin: the abundant, midbrain-derived class populates the first and higher order sensory thalamus while the rarer, forebrain-generated class is restricted to some higher order associative regions. We also observe that markers for the midbrain-born class are abundantly expressed throughout the thalamus of the New World monkey marmoset. These data therefore reveal that, despite the broad variability in interneuron density across mammalian species, the blueprint of the ontogenetic organisation of thalamic interneurons of larger-brained mammals exists and can be studied in mice.
Introduction
The thalamus is a forebrain structure that develops from the diencephalic prosomere 2 (p2) (Puelles and Rubenstein, 2003; Shi et al., 2017; Wong et al., 2018) and is primarily composed of cortically projecting excitatory thalamocortical (TC) neurons, divided into more than 30 individual nuclei in mammals (Clascá et al., 2012; Hunnicutt et al., 2014; Jones, 2007). The function of the thalamus has been historically described as relay of sensory information to the cortex (Cheong et al., 2013; Hubel and Wiesel, 1962; Piscopo et al., 2013; Shatz, 1996; Sherman and Guillery, 2002; Van der Loos and Woolsey, 1973; Zeater et al., 2015). Taking into account the diversity of input and output features of TC circuits (Clascá et al., 2012; Guillery, 1995; Herkenham, 1980; Rubio-Garrido et al., 2009; Sherman, 2016), more recent work has shown that the thalamus is also critically involved in cognitive processes allowing for behavioural flexibility (Bolkan et al., 2017; Groh et al., 2014; Guo et al., 2017; Ling et al., 2015; Rikhye et al., 2018a; Rikhye et al., 2018b; Saalmann and Kastner, 2011; Schmitt et al., 2017; Sherman, 2016).
In contrast to cortical networks, excitatory neurons in the thalamus do not connect with each other (Bickford et al., 2008; Hirsch et al., 2015; Jones, 2007; Rikhye et al., 2018b). Instead, local connections and computations within TC circuits are dominated by the resident inhibitory, GABA-releasing neurons (interneurons) (Hirsch et al., 2015; Montero, 1987; Pasik and Pasik, 1976; Sherman, 2004).
Interneuron numbers and distribution vary widely across species, suggesting that they are critically involved in the evolution of TC structure and function (Arcelli et al., 1997; Letinic and Rakic, 2001; Rikhye et al., 2018b). In particular, comparative studies across all amniotes (reptiles, birds, and mammals) have described a correlation between the proportion of interneurons and the size and connectivity of the excitatory thalamus (Arcelli et al., 1997; Butler, 2008).
For example, in the reptilian thalamus, which is mostly devoid of descending projections from the cortex, interneurons have only been identified in the retinorecipient regions (Butler, 2008; Kenigfest et al., 1995; Kenigfest et al., 1998; Pritz and Stritzel, 1994; Rio et al., 1992). In birds, however, where reciprocal connections between the thalamus and the cortex are more abundant, thalamic interneurons are distributed more widely (Butler, 2008; Granda and Crossland, 1989; Veenman and Reiner, 1994).
Similarly among mammals, interneurons are largely restricted to the visual thalamus in smaller-brained marsupials, bats and mice, where they represent only 6% of the total neuronal population (Butler, 2008; Evangelio et al., 2018; Seabrook et al., 2013b). In primates, on the other hand, where higher order (HO) nuclei driven by cortical inputs are expanded relative to sensory relay (first order, FO) regions (Armstrong, 1979; Baldwin et al., 2017; Butler, 2008; Halley and Krubitzer, 2019; Stephan et al., 1981), interneurons are present across the entire thalamus and their proportion increases to around 30% (Arcelli et al., 1997; Braak and Bachmann, 1985).
To what extent these differences are the result of species-specific ontogenesis of thalamic interneurons remains poorly understood. We have previously shown that in the mouse, interneurons in the FO visual thalamus, the dorsal lateral geniculate nucleus (LGd), originate in the midbrain from an En1+Gata2+Otx2+Sox14+ lineage (Jager et al., 2016). On the other hand, earlier work in humans has suggested the DLX1/2-expressing ganglionic eminences (GE) in the telencephalon as the source of interneurons for some of the larger HO thalamic nuclei – the mediodorsal (MD) nucleus and the pulvinar (Letinić and Kostović, 1997; Letinic and Rakic, 2001; Rakić and Sidman, 1969). At the same time, the latter studies were not able to detect any such migration from the GE in the mouse and macaque brain (Letinic and Rakic, 2001). While these findings therefore point to innovation in developmental origins, we currently lack an understanding of the shared ontogeny of mammalian thalamic interneurons.
Here we hypothesised that a blueprint of the complex organisation of thalamic interneurons observed in large-brained mammals is present even in the simpler thalamus of the mouse. This prediction is supported by findings from the cortex demonstrating that its inhibitory interneuron classes, generated in the subpallium and defined through expression of regulatory programmes (i.e. transcription factors), are common to the amniote lineages (Arendt et al., 2019; Metin et al., 2007; Tasic et al., 2018; Tosches et al., 2018). Moreover, a conserved subpallial origin was demonstrated for cortical interneurons in the cyclostome hagfish, and therefore appears to be an ancestral feature of the vertebrate brain (Sugahara et al., 2017; Sugahara et al., 2016).
Using genetic fate mapping, two-photon whole brain tomography, and spatial modelling, we investigated the ontogeny and distribution of thalamic GABAergic interneurons comprehensively across the mouse TC nuclei. We then used fluorescent in situ marker detection to compare the distribution of genetically defined interneuron classes in the New World marmoset monkey brain. These experiments identify in the mouse a wider distribution of GABAergic interneurons than previously reported (Arcelli et al., 1997; Evangelio et al., 2018; Seabrook et al., 2013b), encompassing both FO sensory relay and HO thalamic nuclei, including associative HO nuclei that are most enlarged in primates. We then show that while the largest proportion of thalamic interneurons in the mouse is generated in the En1+Sox14+ embryonic midbrain, there is an additional class that derives from the Nkx2.1-Lhx6-Dlx5+Foxd1+ inhibitory progenitor domains in the forebrain. Intriguingly, we also find that in the mouse interneurons are organised in a spatial pattern according to their ontogeny, such that midbrain-born interneurons are largely found in the sensory relays, while the forebrain-generated interneurons reside in the HO thalamus, including MD, laterodorsal (LD), and lateral posterior (LP; aka pulvinar) nuclei. Genoarchitectonic evidence supports a conserved basic organisation of thalamic interneurons in the non-human primate marmoset thalamus, where putative midbrain-generated interneurons are abundant in FO and HO nuclei and complemented by a distinct and more restricted interneuron class enriched in selected HO associative TC nuclei.
Results
Sox14-expressing interneurons are widely distributed across the FO and HO mouse thalamus
In the mouse thalamus, GABAergic interneurons are most abundant in the LGd (Arcelli et al., 1997; Evangelio et al., 2018). We had previously demonstrated that all LGd interneurons are defined by expression of the transcription factor gene Sox14 and presented the Sox14GFP/+ knockin mouse line (Table 1; Crone et al., 2008) as a useful tool to study these cells (Jager et al., 2016). Both the Allen Brain Atlas (2015 Allen Institute for Brain Science. Allen Cell Types Database. Available from: celltypes.brain-map.org) and DropViz resources (available from: dropviz.org; Saunders et al., 2018) identify a Sox14+ transcriptional cluster corresponding to mouse LGd interneurons, confirming our previous findings. Sox14 is expressed upon cell-cycle exit within inhibitory lineages in the diencephalon, midbrain, hindbrain, and spinal cord, but not in the telencephalon (Achim et al., 2013; Delogu et al., 2012; Guo and Li, 2019; Prekop et al., 2018).
Table 1
Animal models used in the study.
| Species | Designation | Source or reference | Identifiers | Additional information |
|---|---|---|---|---|
| Mus musculus | Sox14tm1Tmj (Sox14GFP) | Crone et al., 2008 | MGI ID: 3836003 | Maintained in the C57BL/6J (Charles River Laboratories) background |
| Mus musculus | En1Cre | Kimmel et al., 2000; The Jackson Laboratory | Stock No: 007916 MGI ID: 2446434 | C57BL/6J background |
| Mus musculus | Dlx5/6Cre | Monory et al., 2006; The Jackson Laboratory | Stock No: 008199; MGI ID:3758328 | C57BL/6J background |
| Mus musculus | PvalbCre | Hippenmeyer et al., 2005; The Jackson Laboratory | Stock No: 017320; MGI ID:3590684 | C57BL/6J background |
| Mus musculus | Nkx2.1Cre | Xu et al., 2008 | Stock No: 008661 MGI: J:131144 | C57BL/6J background |
| Mus musculus | Foxd1EGFPcre (Foxd1Cre) | Humphreys et al., 2008 | Stock No: 012463 MGI:4359653 | C57BL/6J background |
| Mus musculus | Lhx6Cre | Fogarty et al., 2007 | Stock No: 026555 MGI:4355717 | C57BL/6J background |
| Mus musculus | RCE:loxP (Rosa26lsl-GFP) | Sousa et al., 2009; The Jackson Laboratory | MMRRC Stock No: 32037-JAX MGI:4412373 | C57BL/6J background |
| Mus musculus | Gt(ROSA)26Sortm5(CAG-Sun1/sfGFP)Nat (Rosa26lsl-nuclearGFP) | Mo et al., 2015; The Jackson Laboratory | Stock No: 021039; MGI ID: 5443817 | C57BL/6J background |
| Callithrix jacchus | WT | Colony at RIKEN RRD | - | - |
To investigate the spatial distribution of Sox14 neurons comprehensively across all thalamic (TC) regions in the mouse, we took advantage of the endogenous and bright fluorescence of GFP in postnatal day (P) 21 Sox14GFP/+ mice to perform high resolution (0.54 μm voxel) whole brain imaging by two-photon laser scanning tomography; for an indicative low-resolution scan through a series of z-projections, see also: Video 1. Optical sections were acquired in the coronal plane 10 μm apart and registered with the Allen Institute Common Coordinate Framework (CCF3; Figure 1A) using a custom Python pipeline alongside the Elastix registration library (Klein et al., 2010) to delineate anatomical subdivisions according to the Allen Brain Institute taxonomy (Figure 1A and Video 2). To perform automated detection of cells, a deep learning strategy was implemented to train a U-Net segmentation model (Ronneberger and Brox, 2015) on a data set of 12,264 images (512 × 512 pixels at 0.54 μm voxel), obtained by supplemental augmentation of 219 manually annotated samples (Figure 1B). The accuracy of our automated counting strategy was validated by comparing the total count of GFP+ cells in the LGd of P21 Sox14GFP/+ mice (Figure 1C,D; 1234 ± 82; mean ± SD) to a recent stereological study of LGd GABA interneurons in the wild-type adult C57Bl/6 mouse (1255 ± 195; mean ± SD) (Evangelio et al., 2018), which confirmed the validity of our protocol.
Figure 1

Automated total counts of GFP+ cells in the thalamus of the Sox14GFP/+ mouse.
(A) Autofluorescence (Autofl.) from serial two-photon imaging of Sox14GFP/+ mice (n = 3) at 0.54 × 0.54 × 10 μm voxel resolution was registered to the Allen Institute CCF3 atlas using Elastix (left; scale bar 1 mm). This permits delineation and identification of all anatomical structures according to the Allen Institute hierarchical taxonomy (right; scale bar 100 μm). (B) Automated cell detection was done using a U-Net trained on 219 manually segmented images (512 × 512 pixels) augmented to a total sample size of 12,264, split 75% for training and 25% validation. Images containing GFP fluorescence were passed into the trained U-Net (left) for cell prediction based on learned features during training (right; scale bar 100 μm). Oversampling in the z-axis was corrected for by grouping and averaging detected cell positions which colocalised within a defined cell radius. (C) Example illustration of automatically detected cells in the LGd and VB complex projected onto a representative coronal section of the thalamus. (D) Quantification of GFP+ cells in the LGd at 1234 ± 82 (mean ± SD) validated against stereological study by Evangelio et al., 2018 of 1255 ± 195 (mean ± SD) interneurons in the LGd. Other counts are shown for LP, VB complex [VPM, parvicellular part of the ventral posteromedial nucleus (VPMpc), VPL, parvicellular part of the ventral posterolateral nucleus (VPLpc), VAL, VM], MGv, MGd, and PO.
Video 1
A video animation of 28 z-stacks (each 100 μm) of projected coronal slices, downsized to 1 μm voxel size in XY to reduce file size.
Each slice is a maximum intensity projection across 10 serial two-photon optical slices.
Video 2
A video animation of the anatomical delineations from the Allen Institute Common Coordinate Framework (CCF3) projected onto the imaging data from a P21 Sox14GFP/+ brain.
Isotropic 10 μm voxel size.
Automated counting identified a total of 6588 ± 811 (mean ± SEM) GFP+ cells across TC nuclei of both hemispheres spanning the rostrocaudal and mediolateral extensions of the thalamus (n = 3 Sox14GFP/+ at P21). Their distribution was not stochastic but skewed instead towards sensory TC nuclei and within sensory modality by a prevalence in FO nuclei. The GFP+ cells are most abundant in the visual FO LGd (1234 ± 82) and HO LP (aka pulvinar; 411 ± 110), followed by sensory-motor ventrobasal (VB) complex [ventral posteromedial (VPM; 250 ± 49), ventral posterolateral (VPL; 105 ± 40), ventral anterior lateral (VAL; 4 ± 3) and ventral medial nucleus (VM; 4 ± 2)] and HO posterior nucleus (PO; 99 ± 12), in turn followed by the auditory FO ventral medial geniculate (MGv; 53 ± 12) and HO dorsal medial geniculate nucleus (MGd; 20 ± 13). Sparse GFP+ cells were also detected in limbic TC nuclei: LD (20 ± 7), parafascicular (PF) (25 ± 5), and MD (13 ± 6) nuclei. Notably, GFP+ neurons are typically found in the caudal-most part of the LD, nearer the LP border and nearly all GFP+ neurons were in the caudal half of the MD (see also: Video 1). Counts per TC nucleus are reported for a single hemisphere.
Sox14 expression distinguishes between two spatially clustered interneuron classes
To validate the inhibitory nature of the GFP+ cells in TC nuclei of the Sox14GFP/+ mouse, we combined immunodetection of GFP+ with in situ RNA hybridisation (ISH) against the Gad1 mRNA in Sox14GFP/+ mice sampling the rostrocaudal extent of the thalamus at approximately 200 μm intervals (Figure 2A–C). In our experience, the simultaneous detection of protein and mRNA is more reliable in younger tissue, hence experiments were done at P14, by which time point mouse TC nuclei are considered to display adult-like circuit composition (Bickford et al., 2010; Golding et al., 2014; Seabrook et al., 2013a; Seabrook et al., 2013b; Thompson et al., 2016).
Figure 2 with 1 supplement see all
Diversity and distribution of GABAergic cells in the mouse thalamocortical nuclei.
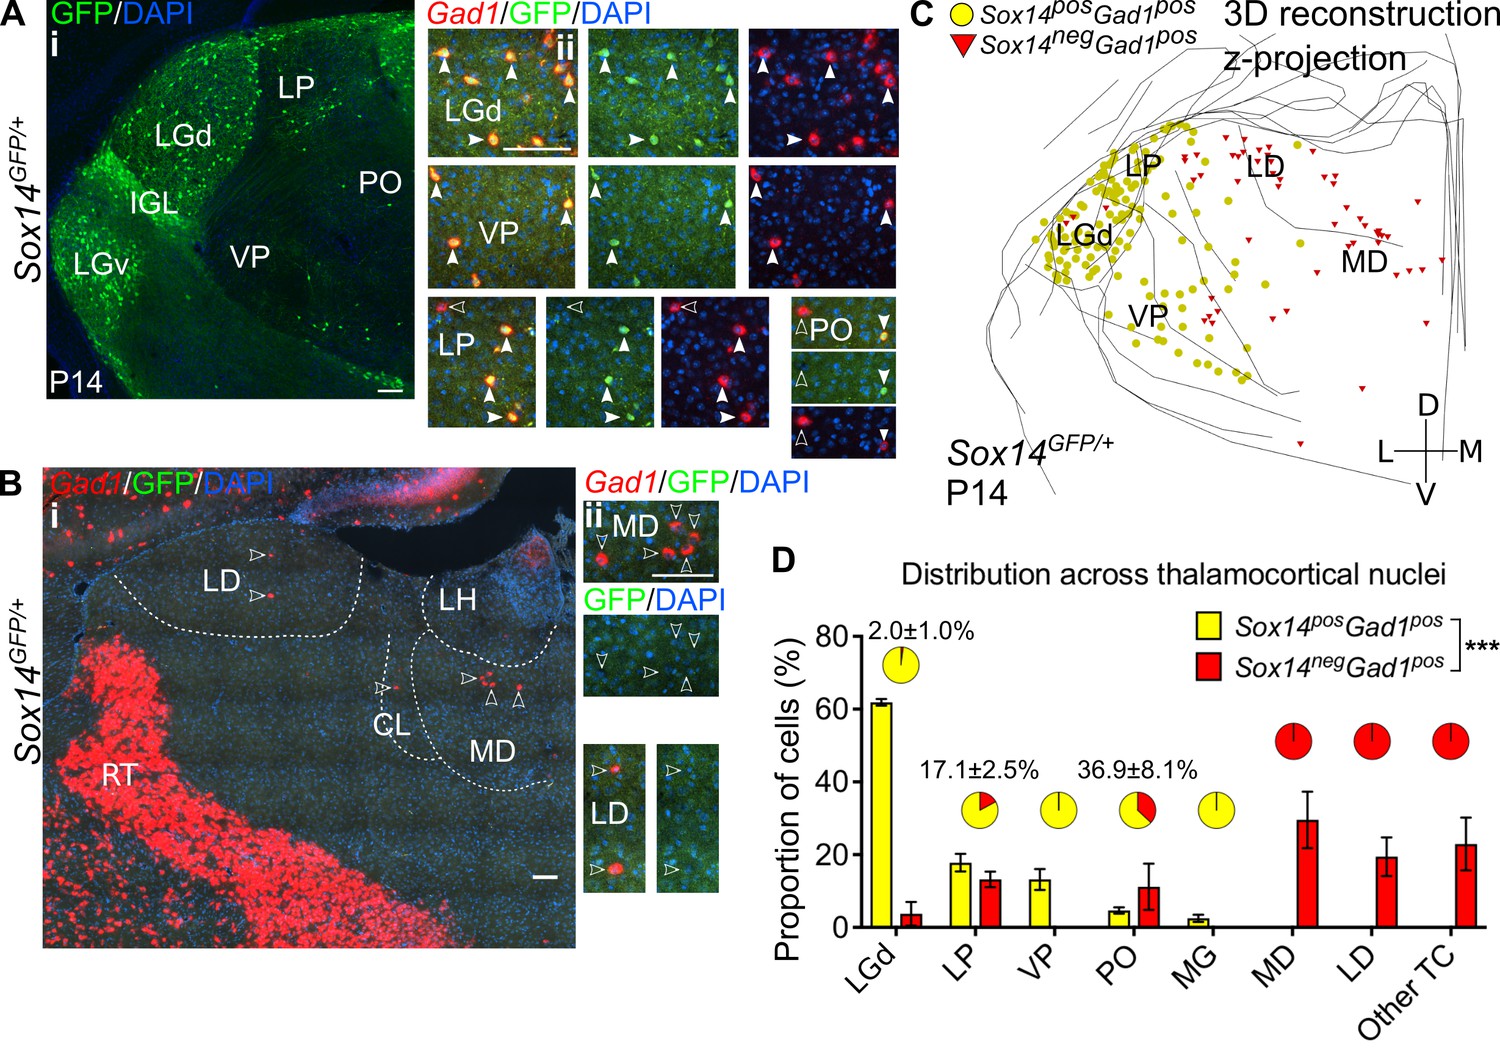
(A) (i) Representative coronal section of P14 Sox14GFP/+ thalamus with Sox14+ cells in the LGd, VP, LP, and PO. (ii) Sox14+ cells in TC regions co-express Gad1, but not all Gad1+ cells co-express Sox14 in the LP and PO. Filled arrows mark Sox14+Gad1+ and empty arrows Sox14-Gad1+ cells. Scale bars, 100 μm. (B) (i) Representative rostral coronal section of P14 Sox14GFP/+ thalamus with Gad1+ cells in the MD, CL, and LD, which contain no Sox14+ cells. (ii) Gad1+ cells in these nuclei do not co-express Sox14. Scale bars, 100 μm. (C) 3D reconstruction of a representative P14 Sox14GFP/+ thalamus from tracing every tenth 20-µm-thick coronal section, displayed as a z-projection and showing distribution of Sox14+Gad1+ (yellow) and Sox14-Gad1+ cells (red). One dot represents one neuron. (D) Distribution of Sox14+Gad1+ and Sox14-Gad1+ cells across TC nuclei in the Sox14GFP/+ brains at P14, plotted as proportion of all the cells within each interneuron group (mean ± SEM; n = 3 brains). The category ‘other TC’ refers to regions where nuclear boundaries cannot be defined precisely and that contain VAL, VM, CL, IMD, PF, RE, RH, SPF, SPA, CM, and AM. Sox14+Gad1+ and Sox14-Gad1+ populations have distinct distributions (p<10-3 chi-squared test). Pie charts show the proportion (mean ± SEM) of the two interneuron classes within each nucleus.
Recapitulating the distribution observed at P21, GFP+ cells were detected in the LGd, LP, VP, and PO and in very small numbers in the MG (Figure 2A,C,D). In these nuclei all GFP+ cells had a GABAergic profile and co-expressed Gad1 (100%, n = 3 brains). In the LGd, VP, and MGv (i.e. FO sensory relay nuclei) they also represented virtually all GABAergic cells (≥98%, pie charts in Figure 2D).
Unexpectedly, however, 22.1 ± 4.0% of the total GABAergic population in TC regions did not express GFP (Figure 2B,C; Figure 5Bii), and these GFP-Gad1+ cells appeared spatially largely non-overlapping with the Sox14+ interneuron class and enriched at more rostral TC territory (Figure 2C,D). Gad1+ cells are seen populating these rostral TC regions during the first five postnatal days (Figure 2—figure supplement 1). In particular, we observed that the distribution of GFP-Gad1+ cells is skewed towards the limbic HO MD (29.6 ± 4.5%) and LD (19.4 ± 3.1%) and the associative HO LP (13.2 ± 1.2%), and in smaller numbers towards the PO. Sparse GFP-Gad1+ cells were also found in thalamic regions where nuclear boundaries cannot be defined precisely at this age and that contain VAL, VM, centrolateral (CL), intermediodorsal (IMD), PF, reuniens (RE), romboid (RH), subparafascicular (SPF), subparafascicular area (SPA), central medial (CM), and anteromedial (AM) nuclei. Cell counts in these regions were grouped together under ‘other TC’ (Figure 2D).
To quantitatively demonstrate spatial clustering of these two putative thalamic interneuron classes (Gad1+Sox14+ and Gad1+Sox14-), we calculated the nearest neighbour distances (NND) from 3D reconstructions of their respective distributions in the Sox14GFP/+ thalamus (Figure 2C and Figure 3A). Indeed, the cumulative distribution of NNDs was significantly shifted to smaller distances within each of the classes than between them (p<1.4 × 10⁻³⁰, two-sample Kolmogorov–Smirnov test, n = 3 brains; Figure 3A).
Figure 3 with 1 supplement see all
Spatial organisation of thalamic GABAergic cells.
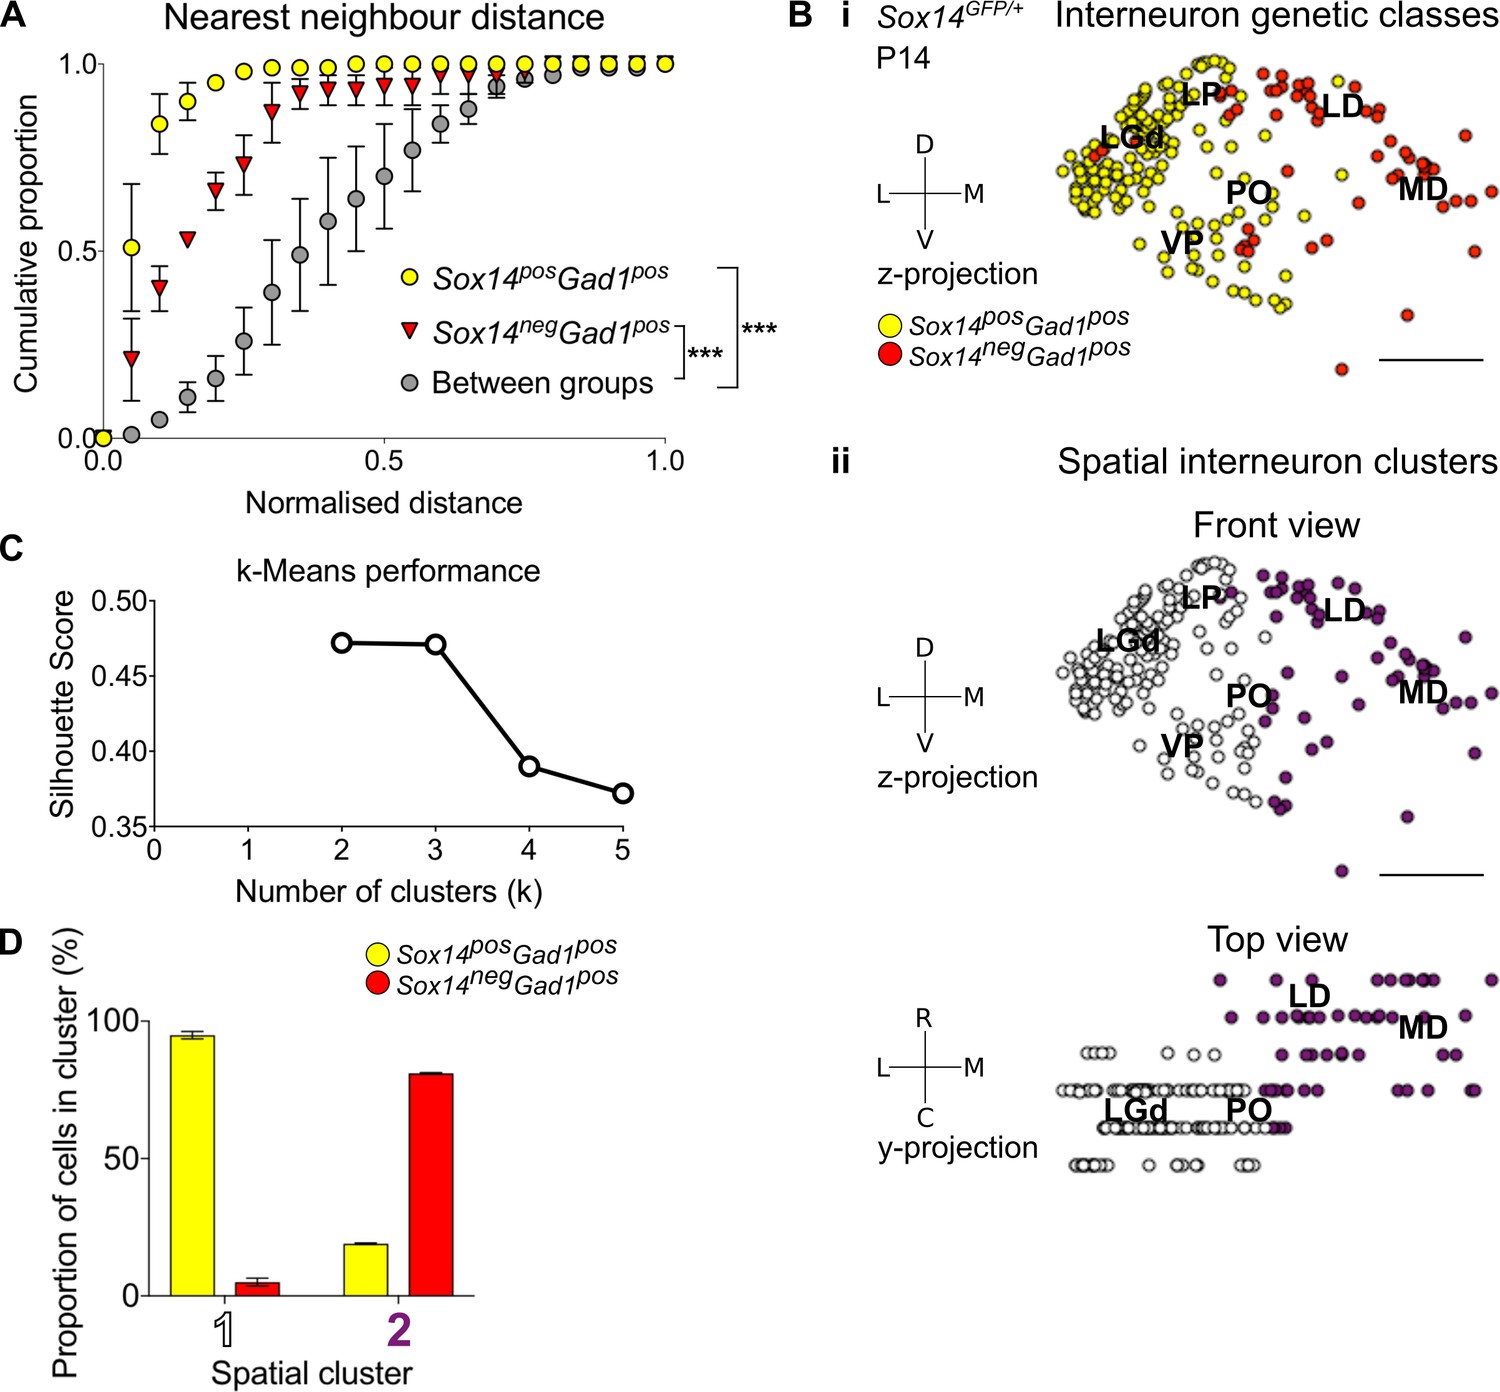
(A) Normalised nearest neighbour distance (NND) for Sox14+Gad1+ and Sox14-Gad1+ populations and between the two groups from P14 Sox14GFP/+ data (Figure 2), plotted as cumulative proportion of all cells within a given set. The NND distribution is significantly shifted to larger distances between groups than within each of the groups (p<1.4 × 10⁻³⁰, two-sample Kolmogorov–Smirnov test, n = 3 brains). (B) Representative z-projections of interneuron distribution amongst TC nuclei, from P14 Sox14GFP/+ data (Figure 2). One dot represents one neuron and they are colour coded by (i) their genetic identity or (ii) spatial cluster. For the spatial clusters a y-projection is also shown. Scale bars, 500 µm. (C) Performance of unsupervised k-means algorithm in identifying thalamic interneuron spatial clusters from the P14 Sox14GFP/+ data (n = 3 brains, see also Figure 2) as measured by the silhouette score, which varies with number of clusters (k). We choose k = 2 as this point has the highest score. (D) Proportion of Sox14+ and Sox14- GABAergic cells in each spatial cluster, averaged over three brains (mean ± SEM).
To characterise spatial organisation of thalamic GABAergic interneurons in an unbiased way, we then applied machine learning (k-means clustering) to these same 3D reconstructions of the Sox14GFP/+ thalami (Figures 2C and 3B,C). The data best fit two spatial clusters, as assessed from the silhouette score (Figure 3Bii,C; see also Materials and methods). Consistent with the NND analysis, one cluster corresponded to the Sox14+ cells (contains 94.9 ± 1.4% of all Sox14+ cells), and the other to the Sox14- interneurons (contains 81.0 ± 0.3% of all Sox14- cells; Figure 3B,D). The two thalamic molecular GABAergic groups therefore occupy their own respective spatial clusters, with the Sox14- cells located more rostrally and medially compared to the Sox14+ interneurons.
To independently confirm our findings and control for potential effects of looking at a juvenile age (P14), we also mapped anatomical distribution of all Gad1+ and Chrna6+ cells across the adult mouse TC nuclei at P56, using the Allen Mouse Brain Atlas (2004 Allen Institute for Brain Science. Allen Mouse Brain Atlas. Available from: mouse.brain-map.org; Lein et al., 2007) ISH data (Figure 3—figure supplement 1A). Chrna6 has been identified as another marker specific for interneurons, at least in the LGd (Golding et al., 2014; DropViz; Allen Cell Types Database). The resulting 3D reconstructions, k-means spatial clustering (Figure 3—figure supplement 1A), and distribution plot (Figure 3—figure supplement 1B) were consistent with our observations from the P14 Sox14GFP/+ thalamus.
The mouse thalamus therefore exhibits wider interneuron diversity than has been previously reported, with at least two molecularly and spatially distinct classes. The largest interneuron class is defined by Sox14+ and is enriched in the caudal part of the thalamus which contains principal sensory relays and their associated HO nuclei. Conversely, the smaller Sox14- GABAergic population is enriched in the rostral part of the thalamus, in HO regions that associate with more cognitive functions, such as the MD and LD (Halassa and Kastner, 2017; Rikhye et al., 2018b).
The Sox14+ interneuron class is abundant and widespread in the marmoset thalamus
Given the sparseness of interneurons in the mouse thalamus, there exists the possibility that the Sox14+ interneuron class may represent a unique feature of smaller-brained species, or that it may be a conserved, but numerically negligible type of interneuron complemented by novel and more abundant types in species with larger brains. To detect the presence and assess the relative abundance of the Sox14+ interneuron class in the thalamus of species with a high density of interneurons, we sampled the distribution of SOX14+GAD1+ cells in selected TC nuclei of the neonatal non-human primate marmoset.
Fluorescent ISH for SOX14 and GAD1 mRNAs revealed the widespread presence of SOX14+GAD1+ bona fide interneurons across all major TC nuclei (Figure 4A–C). Reminiscent of the expression pattern observed in the mouse, SOX14+ cells were not present in prethalamic structures [RT, zona incerta (ZI)], but detectable in the pregeniculate/subgeniculate (SubG), the primate homologue of the mouse IGL (Figure 4B).
Figure 4

SOX14+GAD1+ interneurons dominate TC regions of the non-human primate marmoset.
Representative coronal sections of the thalamus of a new-born marmoset illustrating the distribution of cells expressing the SOX14 (green) and GAD1 (red) mRNAs. (A) Caudal plane containing subdivisions of the pulvinar complex, the PO, and the auditory MG. Also visible are parafascicular (PaF) nuclei. Fr, fasciculus retroflexus; 3V, third ventricle. (Ai–iii) Magnifications of indicative areas of the medial (MPul) and anterior pulvinar (APul), the lateral pulvinar (LPul), and inferior pulvinar (IPul). (Aiv). Magnification of a region of the PO. (Av and vi). Magnifications of representative regions of the ventral (MGv) and dorsal (MGd) subdivisions of the auditory thalamus. (B) Middle plane section containing the sensory TC nuclei LGd, VPM, VPL, and other non-TC structures (ZI, RT, and SubG). (Bi–iii). Magnifications illustrating the dominant presence of SOX14+GAD1+ interneurons in the sensory FO nuclei. (C) Anterior plane containing the VAL, centromedial (CM), anteroventral (AV), LD, and MD. The prethalamic RT is recognisable as an entirely SOX14-GAD1+ structure. (Ci). Magnification of an area of the LD containing comparable densities of SOX14+ and SOX14- interneurons. (Cii). Magnification of an area of the MD containing SOX14+ and SOX14- interneurons. (D) Fraction of SOX14+GAD1+ (yellow) and SOX14-GAD1+ (red) interneurons in selected TC nuclei. Above each bar the total cell counts from nine regions of interest (ROI) measuring 263 μm by 263 μm per each TC nucleus in three age-matched brains (three ROI per TC nucleus per brain). The average fraction of SOX14-GAD1+ interneurons deviates significantly from background level in the MD and LD. Scale bars: low magnification; overviews: ~1 mm; magnified areas:~0.2 mm.
Qualitative analysis shows largely overlapping distribution of the fluorescent probes for SOX14 and GAD1 in all TC nuclei at caudal (Figure 4Ai–vi) and intermediate levels (Figure 4Bi–iii), but some areas of differential expression at rostral level, where GAD1 expression is not accompanied by SOX14 expression in medial and dorsal regions of the thalamus (Figure 4C) that contain the limbic HO TC nuclei LD (Figure 4Ci) and MD (Figure 4Cii). We then proceeded to quantify the number of SOX14+GAD1+ and SOX14-GAD1+ cells in three brains of the new-born marmoset by randomly selecting three regions of 263 μm by 263 μm within the following nuclei: FO visual LGd, HO visual and multimodal associative medial, lateral, inferior, and anterior pulvinar subdivisions (MPul, LPul, IPul, and APul, respectively), FO somatosensory VPM and VPL, HO sensory PO, and FO auditory (MGv) and HO auditory (MGd) as well as non-specific HO MD and LD. With the exception of the MD and LD, all TC nuclei tested contained mostly SOX14+GAD1+ cells (90.2 ± 0.9%; mean ± SEM; dotted line in Figure 4D). This may in fact be an underestimate due to the observed lower efficiency of the SOX14 probe compared to the GAD1. Analysis of the frequency distribution of the two cell classes across the tested nuclei reveals the MD and LD as outliers of an otherwise normal distribution (Motulsky and Brown, 2006). Indeed, in the MD and LD SOX14-GAD1+ cells account for 28.7 ± 6.7% and 52.3 ± 2.8% (mean ± SEM) of the total GAD1+, respectively (Figure 4D). The presence of a sizeable population of SOX14-GAD1+ cells in the MD and LD is intriguing for their reminiscence of the Sox14-Gad1+ interneurons of the mouse (Figure 2C,D) which are also most abundant in these two non-specific HO nuclei.
We find the presence in both the mouse and marmoset of an abundant SOX14+GAD1+ interneuron class and the relative distribution of SOX14+GAD1+ and GAD1+ single positive interneurons compatible with a conserved basic organisation of interneuron diversity in rodents and primates alike.
All Sox14-expressing thalamic interneurons are born in the midbrain
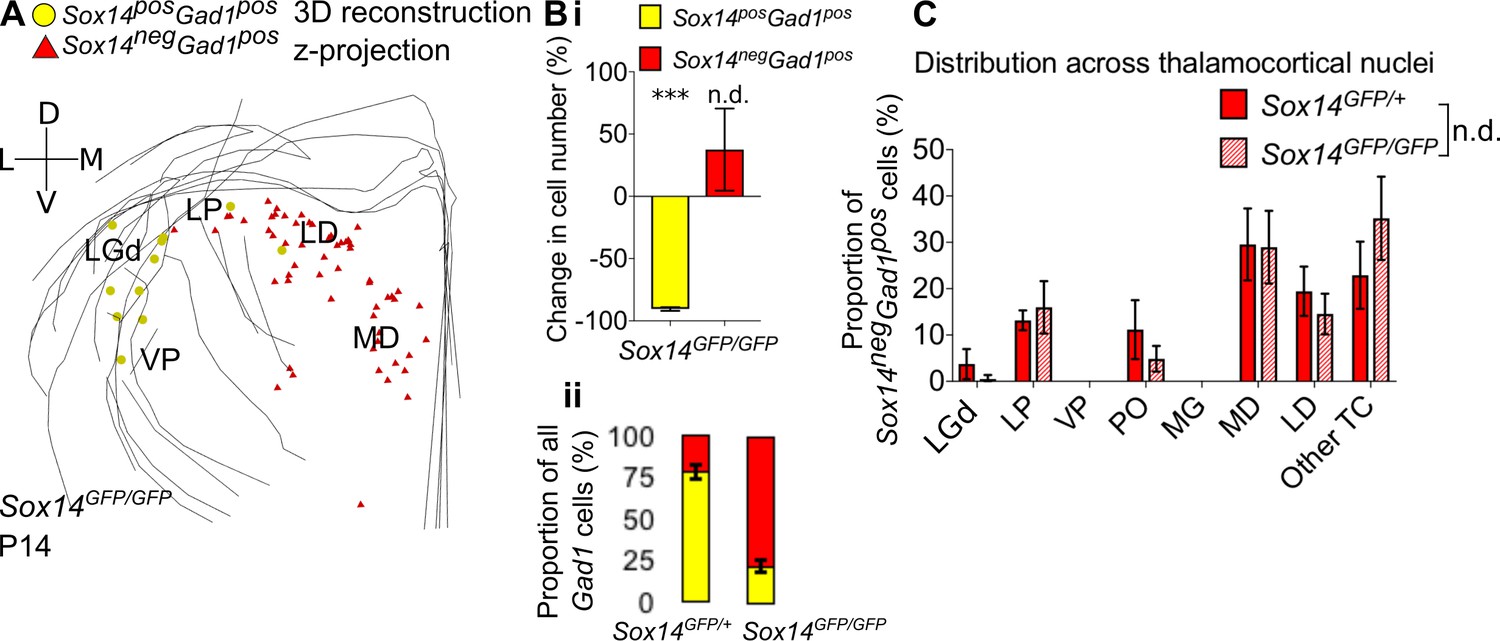
Given the known role of Sox14 in specifying subcortical inhibitory classes (Achim et al., 2013; Delogu et al., 2012; Guo and Li, 2019; Prekop et al., 2018; Sellers et al., 2014) and following our identification of Sox14 as a conserved genetic marker for the larger cohort of thalamic interneurons in both the primate and rodent brain, we investigated the requirement for this gene in interneurons across TC modalities and hierarchy using the Sox14GFP/GFP (Sox14 knockout, KO) mouse. We have previously shown that in the Sox14 KO there is a >90% reduction in the number of interneurons in the LGd (Jager et al., 2016). We find a comparable reduction in the number of GFP+ interneurons overall across the LGd, LP, VP, PO, and MG in the Sox14 KO (90.5 ± 1.5%, p=2.7 × 10⁻⁴, two-sample two-tailed t-test, n = 3 brains/genotype; Figure 5A,B). Conversely, there was no significant change in the number of Sox14-Gad1+ cells (p=0.4, two-sample two-tailed t-test; Figure 5A,B) and in their distribution across TC regions (Figure 5A,C; p>0.05, chi-squared test, n = 3 brains/genotype). These results therefore indicate that the two TC interneuron populations may already be segregated during development and represent two distinct GABAergic lineages.
Figure 5
Differential requirement for Sox14 highlights two distinct developmental classes.
(A) Differential requirement for Sox14 highlights two distinct developmental classes. 3D reconstruction of a representative P14 Sox14GFP/GFP thalamus from tracing every tenth 20-µm-thick coronal section, displayed as a z-projection and showing distribution of Sox14+Gad1+ (yellow) and Sox14-Gad1+ cells (red). (B) (i) Relative change in the number of GFP+Gad1+ and GFP-Gad1+ cells across TC regions in P14 Sox14GFP/GFP relative to P14 Sox14GFP/+ data (mean ± SEM, n = 3 brains/genotype). There is a significant reduction in the GFP+Gad1+ population (p=2.7 × 10⁻⁴, two-sample two-tailed t-test), but no statistically significant difference in the size of the GFP-Gad1+ group (p=0.4, two-sample two-tailed t-test). (ii) Proportion of GFP+Gad1+ cells within the total GABAergic population is decreased in the Sox14GFP/GFP (mean ± SEM, n = 3 brains/genotype). (C) Distribution of GFP-Gad1+ cells across TC nuclei in the Sox14GFP/+ and Sox14GFP/GFP brains at P14 (mean ± SEM; n = 3 brains/genotype). GFP-Gad1+ distribution is unaltered in the Sox14 KO (p>0.05, chi-squared test).
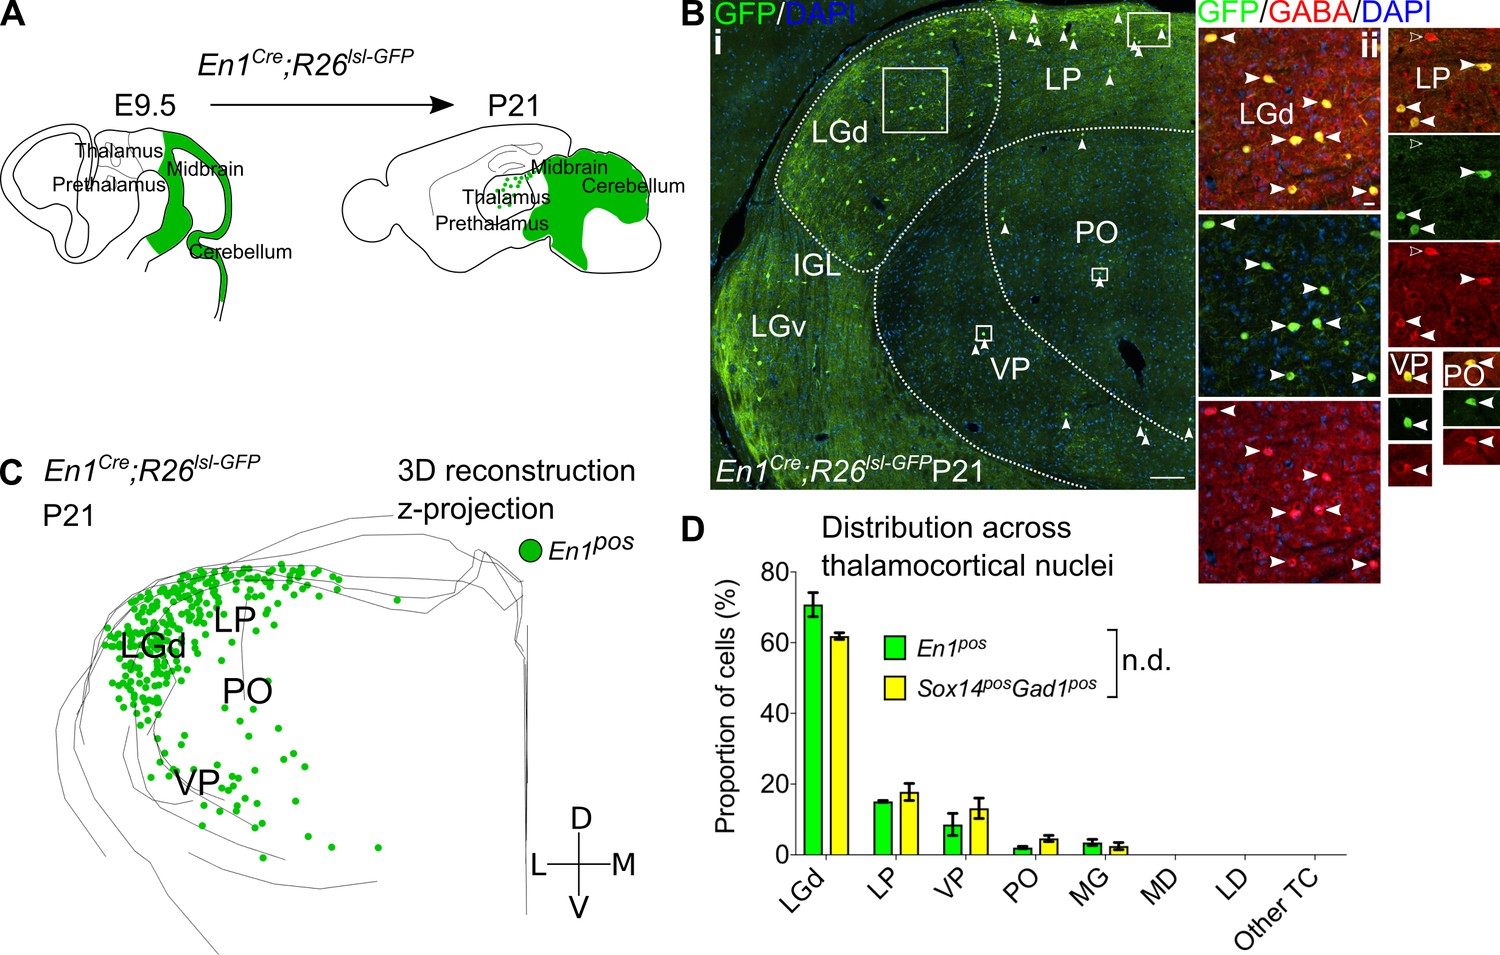
LGd interneurons in the mouse derive from the midbrain (Jager et al., 2016). To explore how the molecular and spatial organisation of thalamic interneurons is generated during development more conclusively, we fate-mapped midbrain lineages and checked for their presence, distribution, and inhibitory profile across the thalamus. We crossed En1Cre (Kimmel et al., 2000) with a Rosa26lsl-GFP (Sousa et al., 2009) reporter line (Figure 6A; see also Table 1), as the En1 TF gene is expressed in the midbrain and rostral hindbrain progenitors, but not in the forebrain (Sgaier et al., 2007). Analysis of the thalamus at P21 reveals GFP+ cells (En1+ lineage) distributed across the LGd and co-expressing GABA (Figure 6B), therefore independently validating our previous observation (Jager et al., 2016). However, like the Sox14+Gad1+ neurons, En1+ cells were observed beyond the LGd – in the LP, VP, PO, and MG, where they were also positive for GABA (Figure 6B,C). Plotting their distribution confirmed that it is equivalent to the distribution of Sox14+ INs (p>0.05, chi-squared test; Figure 6C,D). Occasional GFP+ cells with glia-like morphology were also observed in the thalamus. These cells were GABA- and were not included in any of the analyses.
Figure 6
Sox14+ interneurons in TC regions derive from the midbrain.
(A) Schematic of the fate mapping experiment: crossing En1Cre with Rosa26lsl-GFP reporter line permanently labels all midbrain born cells with GFP expression. (B) (i) Representative coronal section of P21 En1Cre; Rosa26lsl-GFP thalamus with En1+ cells observed in the LGd, LP, VP, and PO (considering TC regions only). For clarity some of the En1+ cells are indicated with white arrows. Scale bar, 100 µm. (ii) En1+ cells in these regions co-express GABA (filled white arrows). Empty arrows mark GABA single-positive cells. Scale bar, 10 µm. (C) 3D reconstruction of a representative P21 En1Cre; Rosa26lsl-GFP thalamus from tracing every sixth 60-µm-thick coronal section, displayed as a z-projection and showing distribution of En1+ cells. (D) Distribution of Sox14+Gad1+ and En1+ cells across TC nuclei in Sox14GFP/+ and En1Cre; Rosa26lsl-GFP brains, respectively, plotted as proportion of all the cells within each group (mean ± SEM; n = 3 brains/genotype). The two populations are not differently distributed (p>0.05, chi-squared test).
We therefore conclude that the Sox14+ thalamic interneurons across FO and HO TC nuclei all derive from the midbrain, and simultaneously that the Sox14- GABAergic cells do not; the two classes thus represent distinct inhibitory lineages in TC regions, further supporting their definition as two distinct thalamic interneuron classes.
Midbrain-derived interneurons migrate along two streams into the sensory thalamus during the first postnatal week
En1Cre;Rosa26lsl-GFP line was then used to investigate the timeline and spatial trajectories of the Sox14+ interneuron precursors migrating from the midbrain into the FO and HO sensory TC regions (Figure 7A). Previously, LGd interneurons were found to populate this nucleus in the first postnatal week (Golding et al., 2014; Jager et al., 2016). We therefore looked at the numbers and migratory morphology of GFP+ (i.e. En1+) cells in the thalamus at E16.5, E17.5, P0.5, P1.5, and P2.5. We focused on the LGd, LP, and VP, but left out the PO and MG, due to low overall numbers of interneurons in these two regions (Figure 1D and Figure 2D).
Figure 7 with 1 supplement see all
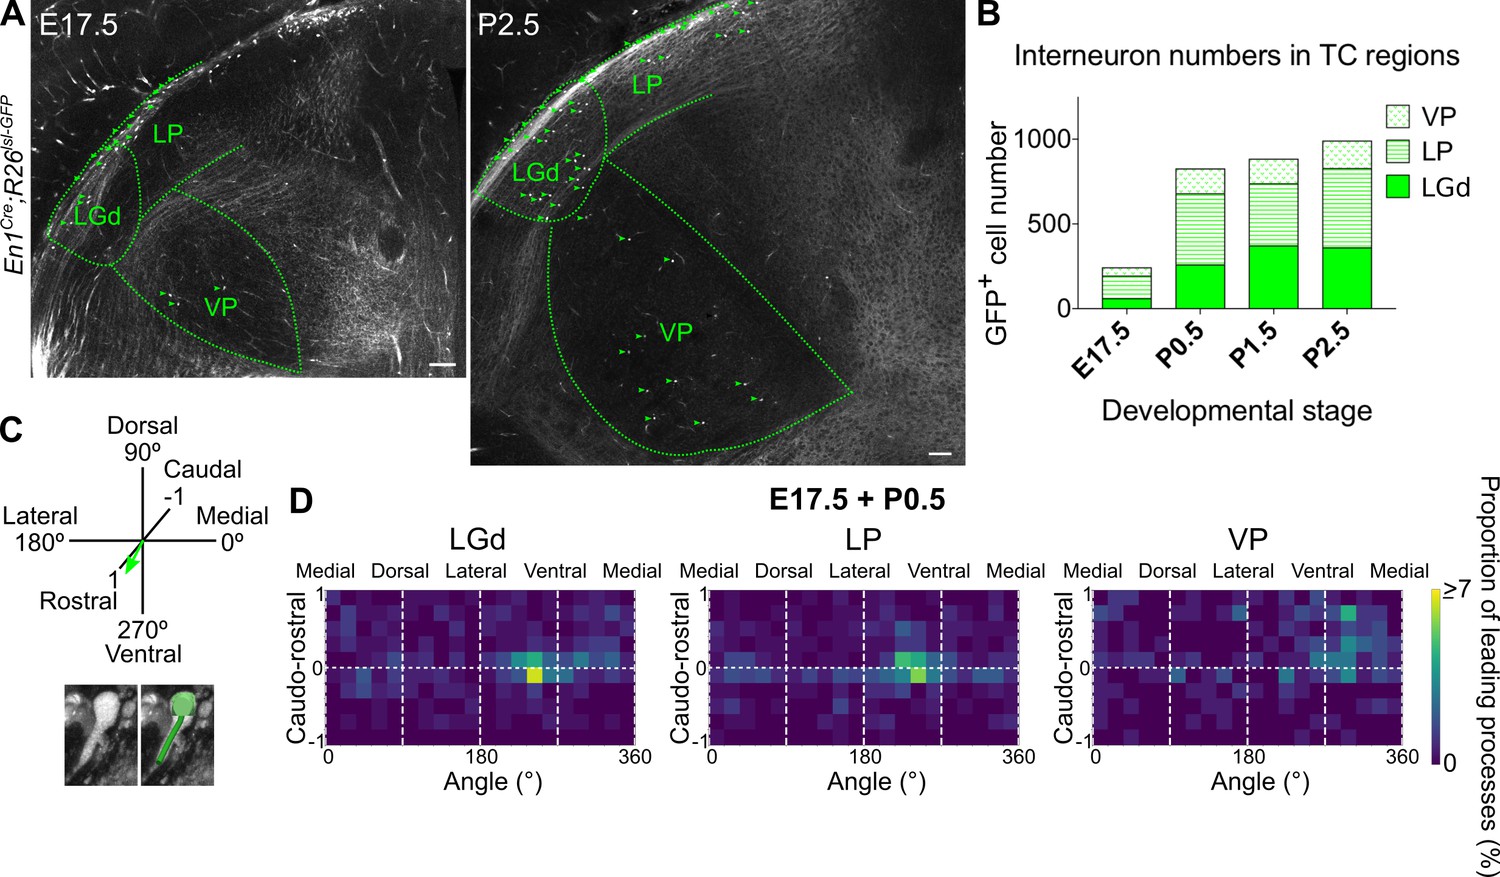
Midbrain-derived interneuron precursors progressively populate the thalamus from E17.5 onwards.
(A) Representative coronal sections of En1Cre; Rosa26lsl-GFP thalamus at E17.5 and P2.5. Green arrows mark some of the GFP+ cells. Scale bars, 100 µm. (B) Number of GFP+ cells counted in the LGd, LP, and VP from E17.5 to P2.5 (mean, n = 3 brains). (C) Leading process orientation of GFP+ cells was determined along the caudo-rostral, ventro-dorsal, and latero-medial dimensions. (D) Frequency distribution of leading process orientation for GFP+ cells in the LGd, LP, and VP at E17.5 and P0.5 combined, represented in heat maps (n = 3 brains/developmental stage).
At E16.5 no GFP+ cells were present in the thalamus. From E17.5 to P2.5 their numbers progressively increased in all of the regions analysed (Figure 7A,B). The number of GFP+ cells in the LGd at P2.5 matched previous independent reports (Golding et al., 2014), validating our counting method. Midbrain-derived interneurons therefore populate the different TC regions following a similar timeline. Interestingly, they appear in two ventrally located nuclei (i.e. LGd and VP) simultaneously (Figure 7A,B), implying they use distinct routes to reach them.
To assess quantitatively the direction of migration of the larger, midbrain-derived interneuron class, we determined the leading process orientation of migrating GFP+ cells along all three dimensions: ventro-dorsal, latero-medial, and caudo-rostral; Figure 7C; (Jager et al., 2016; Paredes et al., 2016). This was plotted at a population level as frequency distribution using heat maps, for each nucleus individually, for E17.5 and P0.5 (Figure 7D; Figure 7—figure supplement 1B), as the relative increase in GFP+ cell numbers was the greatest between these two time points (Figure 7B). Moreover, there was a progressive decrease across developmental stages in the proportion of GFP+ cells for which migratory morphology could be identified (Figure 7—figure supplement 1A).
Heat maps indicate that at a population level (integrated across dimensions), GFP+ cells migrate into the LGd, LP, and VP in a caudo-rostral and dorso-ventral direction (Figure 7D), consistent with the position of the thalamus in the brain relative to their midbrain origin. However, GFP+ precursors in the LGd and LP have a dominant medio-lateral orientation, while those in the VP an opposite, latero-medial orientation, as can also be seen from polar histograms (Figure 7—figure supplement 1C). This suggests that midbrain-derived interneuron precursors enter TC regions simultaneously in two distinct streams, one migrating rostro-ventro-laterally to the LGd and LP, and the other rostro-ventro-medially to the VP, indicating a split between visual (LGd, LP) and somatosensory (VP) TC nuclei.
Sox14-negative thalamic interneurons populating HO nuclei are born in the forebrain
With the aim of identifying the origin of the Sox14- interneuron class in the mouse, we first looked for a positive molecular marker that would complement the absence of Sox14 expression. We made use of DropViz data [available from: dropviz.org; (Saunders et al., 2018)] and observed that within inhibitory clusters from the diencephalon, Sox14 and Pvalb show largely non-overlapping expression. It is known that Pvalb is expressed by the prethalamic RT (Clemente-Perez et al., 2017) and by telencephalic interneuron subtypes derived from the GE (Marín and Rubenstein, 2001; Tasic et al., 2016; Tremblay et al., 2016).
We therefore checked whether any thalamic interneurons are fluorescently labelled using a PvalbCre mouse (Hippenmeyer et al., 2005) crossed to the conditional reporter Sun1sfGFP (Rosa26lsl-nuclearGFP; see also Table 1). These mice contain a CAG promoter driving expression of the mouse nuclear membrane protein SUN1 (Sad1 and UNC84 domain containing 1) fused to two copies of superfolder GFP (sfGFP) inserted in the Rosa26 locus (Mo et al., 2015). Indeed, at P14 GFP was detected at the nuclear membrane of GABA-expressing neurons within the same regions populated by the Sox14- interneurons (Figure 8—figure supplement 1A), including the MD and LD, but absent from TC nuclei populated exclusively by Sox14+ interneurons, such as the LGd and VP (Figure 8—figure supplement 1Ai).
At later ages (P56) Pvalb is widely expressed in the mouse thalamus and is observed in high-density gradients in several TC nuclei [2004 Allen Institute for Brain Science. Allen Mouse Brain Atlas. Available from: mouse.brain-map.org; (Lein et al., 2007)]. Pvalb expression is not conserved across rodents and primates and cannot assist in comparative studies (Rausell and Jones, 1991). Importantly, however, in the P14 mouse 93.9% of Pvalb+ cells in TC regions co-expressed GABA (n = 2 brains, Figure 8—figure supplement 1Aii, B) and none were labelled by the En1Cre reporter (0 out of 491 Pvalb+ cells, n = 4 En1cre; Rosa26lsl-GFP mice) or Sox14GFP/+ reporter(0 out of 206 Pvalb+ cells, n = 2 Sox14GFP/+ mice). Therefore, we define the mouse Sox14- GABAergic cells as Pvalb+.
We found the presence of a minor population of Pvalb+ interneurons in the anterior thalamus of the mouse intriguing. Spatial proximity to the RT and shared marker expression (Pvalb) may suggest a prethalamic origin for the Sox14-Pvalb+ interneurons. On the other hand, progenitor domains of the telencephalic medial ganglionic eminences (MGE) and preoptic area (POA) also generate Pvalb+ interneurons, which are known to integrate in neocortical and hippocampal circuitries (Gelman et al., 2011; Lavdas et al., 1999; Wichterle et al., 2001; Xu et al., 2004; Xu et al., 2008), but could potentially reach the thalamus. In addition, in humans the DLX1/2/5+ GE generate thalamic interneurons selectively for the HO MD and pulvinar nuclei (Letinić and Kostović, 1997; Letinic and Rakic, 2001; Rakić and Sidman, 1969).
We set out first to validate the distinct origin of the Sox14-Pvalb+ interneurons by fate-mapping rostral forebrain inhibitory progenitor domains using the Dlx5/6Cre (Monory et al., 2006) crossed to Rosa26lsl-GFP line (Figure 8A; see also Table 1). Expression of the distal less homeobox genes Dlx1/2/5/6 is a common ontogenetic step for all GABAergic lineages in the subpallium, prethalamus, and hypothalamus (Anderson et al., 1997a; Anderson et al., 1997b; Bulfone et al., 1993; Le et al., 2017; Liu et al., 1997; Long et al., 2009a; Long et al., 2007; Long et al., 2009b; Simeone et al., 1994; Wang et al., 2010; Yun et al., 2002).
Figure 8 with 1 supplement see all

Sox14-Pvalb+ interneurons in TC regions derive from the Dlx5pos, Foxd1pos, Nkx2.1neg, and Lhx6neg rostral forebrain.
(A) Schematic of the fate mapping experiment: crossing Dlx5/6Cre with Rosa26lsl-GFP reporter line permanently labels all ventral telencephalic, hypothalamic, and prethalamic-born cells with GFP expression. (B) (i) Representative coronal sections of P14 Dlx5/6Cre; Rosa26lsl-GFP thalamus with Dlx5+Pvalb+ cells present in the MD, LD, CL, VAL, VM, LP, and PO (considering TC regions only). Scale bar, 100 µm. (ii) Dlx5+Pvalb+ cells in TC regions co-express GABA. Scale bar, 100 µm. (C) Distribution of Dlx5+Pvalb+ and Sox14-Gad1+ cells across TC nuclei in P14 Dlx5/6Cre; Rosa26lsl-GFP and Sox14GFP/+ brains, respectively, plotted as proportion of all the cells within each group (mean ± SEM, n = 3 brains/genotype). The two populations are not differently distributed (p>0.05, chi-squared test). (D) 3D reconstruction of a representative P14 Dlx5/6Cre; Rosa26lsl-GFP thalamus from tracing every sixth 60-µm-thick coronal section, displayed as a z-projection and showing distribution of Dlx5+Pvalb+ cells. (E) Schematic of the fate mapping experiment crossing the Foxd1Cre with Rosa26lsl-nuclearGFP reporter line to permanently label hypothalamic and prethalamic-born cells with nuclear membrane localised GFP. (F) Representative coronal sections of P14 Foxd1Cre; Rosa26lsl-nuclearGFP thalamus with Foxd1+Pvalb+ cells present in the LD, CL, MD, and LP. Scale bar, 100 µm. Enlarged areas (red boxes) showing Foxd1+Pvalb+ cells co-expressing GABA. Additional GABA+ but Foxd1-Pvalb- neurons are also visible in the LP (red arrows). HA: habenula. (G) Schematic of the fate mapping experiment: crossing Nkx2.1Cre with Rosa26lsl-GFP reporter line permanently labels some hypothalamic and all MGE-born cells with GFP expression. (H) (i) Representative coronal sections of P14 Nkx2.1Cre; Rosa26lsl-GFP thalamus with Pvalb+ and Nkx2.1+ cells present in the MD, LD, CL, VAL, VM, LP, and PO (considering TC regions only). Scale bar, 100 µm. (ii) Nkx2.1+ cells in TC regions do not co-express Pvalb+. Scale bar, 100 µm. (I).Schematic of the fate mapping experiment crossing the Lhx6Cre with Rosa26lsl-GFP reporter line to permanently label some hypothalamic and MGE born cells with GFP. (J) (i) Representative coronal section of P14 Lhx6Cre; Rosa26lsl-GFP showing GFP+Pvalb+ cells in the hippocampus (red arrows) and GFP-Pvalb+ present in the MD, LD, and CL nuclei of the thalamus (considering TC regions only). Scale bar, 100 µm. (ii) GFP+ cells in TC regions are endothelial and do not co-express Pvalb+. Scale bar, 100 µm. (K) Proportion of Pvalb+ cells in TC regions that are Dlx5+, Foxd1+, Nkx2.1+, or Lhx6+ at P14 (mean ± SEM, Dlx5+ n = 3 brains, Foxd1+ n = 5 brains, Nkx2.1+ n = 3 brains, and Lhx6+ n = 4 brains). (L) Proportion of Dlx5+Pvalb+ and Foxd1+Pvalb+ cells in TC regions co-expressing GABA at P14 (mean ± SEM, Dlx5+ n = 3 brains, Foxd1+ n = 5 brains).
At P14 virtually all TC Pvalb+ cells are a Dlx5 lineage (GFP+; 99.71 ± 0.29%, n = 3 brains; Figure 8B,K) and majority of them co-expressed detectable GABA (93.6 ± 3.7%; Figure 8B,L), in line with observations from the PvalbCre; Rosa26lsl-nuclearGFP line (Figure 8—figure supplement 1Aii,B). We mapped the distribution of Pvalb+Dlx5+ cells across TC regions (Figure 8C,D) and observed that it closely recapitulates the distribution of Sox14-Gad1+ cells (Figure 8C; p>0.05, chi-squared test).
We also observed other Pvalb-Dlx5+ cells in the thalamus, the majority of which had a glia-like morphology and did not express GABA (Figure 8—figure supplement 1C). Occasional Pvalb-GABA-Dlx5+ cells with neuronal-like morphology were also seen (Figure 8—figure supplement 1C,D), suggesting leaky Cre activity in some cases. That all Pvalb+cells in TC nuclei are labelled with GFP argues against this being an artefact of leaky reporting. Pvalb-GABA-Dlx5+ cells were not considered in any of the analyses.
While the Dlx5/6Cre fate mapping confirmed the Sox14-Pvalb+ cells as a distinct, forebrain-derived interneuron in the mouse thalamus, it does not resolve between the different rostral forebrain GABAergic territories of the telencephalon and diencephalon, the latter comprised of the prethalamus and the hypothalamus.
To further discriminate between telencephalic and prethalamic/hypothalamic GABAergic progenitors, we took advantage of the restricted expression of the Forkhead box gene Foxd1 during the neurogenic period in the prethalamus and hypothalamus (Newman et al., 2018; Shimogori et al., 2010) and fate-mapped Foxd1+ lineages by crossing the Foxd1Cre (Humphreys et al., 2008) with the Rosa26lsl-nuclearGFP reporter line, described earlier (Figure 8E; see also Table 1). At P14, GFP was readily detectable at the nuclear membrane of neurons in the prethalamus and, as previously reported (Newman et al., 2018), in non-neuronal endothelial cells of the brain’s vascular system. Within TC nuclei, colabelling with Pvalb and GABA revealed that the vast majority of thalamic Pvalb+ cells derive from Foxd1+ progenitors (85.56 ± 2.1%; 297 Pvalb+ cells from n = 5 Foxd1Cre; Rosa26lsl-nuclearGFP mice) and that virtually all Pvalb+Foxd1+ cells contained detectable GABA (96.43 ± 1.63%). Other GFP nuclei that are neither Pvalb+ nor GABA+ likely belong to endothelial cells in blood vessels and were NeuN negative (data not shown). The minor residual fraction of Pvalb+GFP- cells is similarly distributed across TC nuclei and likely to reflect incomplete loxp recombination or very low expression at the Rosa26 locus.
The fate mapping with Foxd1Cre is therefore consistent with a rostral diencephalic origin of the Sox14-Pvalb+ interneurons, rather than a telencephalic one, but cannot resolve between prethalamus and hypothalamus. However, Dlx5+ GABAergic domains of the posterior and ventral hypothalamus can be defined by partially overlapping expression of Lhx6 or Nkx2.1 (Díaz et al., 2014; Shimogori et al., 2010), two transcription factor genes that are also expressed in the GE, but not expressed in the prethalamus (Figure 8G,I). Therefore, we tested for a potential hypothalamic origin of the Sox14-Pvalb+ interneurons by fate mapping GABAergic subdomains of the hypothalamus using the Nkx2.1Cre (Xu et al., 2008) and the Lhx6Cre (Fogarty et al., 2007) line crossed to the Rosa26lsl-GFP reporter (Table 1).
The Dlx5+Nkx2.1+ hypothalamic GABAergic progenitors are located in the tuberal and retrotuberal area of the basal hypothalamus (Díaz et al., 2014; Morales-Delgado et al., 2014; Shimogori et al., 2010). Hence, we fate-mapped Nkx2.1+ lineages with the Nkx2.1Cre line (Figure 8G) and investigated the presence of GFP+Pvalb+ co-expressing neurons in TC regions, at P14. While GFP+ cells are present in thalamic territory, none of the TC Pvalb+ cells belonged to a Nkx2.1+ lineage (GFP+Pvalb+0%, n = 3 brains; Figure 8Hi,Hii,K), therefore excluding the posteroventral hypothalamus as a possible source of the Pvalb+ thalamic interneurons. Importantly, Nkx2.1 is also a well-established marker of GABAergic progenitors in the MGE and POA (Shimamura et al., 1995; Sussel et al., 1999) and defines several cortical interneuron lineages including the fast spiking Pvalb+ interneurons, the somatostatin+ interneurons (Fogarty et al., 2007; Pleasure et al., 2000; Xu et al., 2004; Xu et al., 2008), and from the POA, Npy+, or Reelin+ interneurons (Gelman et al., 2011; Gelman et al., 2009). Hence this result strengthens the evidence against a telencephalic contribution to thalamic interneurons in the mouse.
Although we did not conduct a detailed investigation of Pvalb- cell types labelled by the Nkx2.1Cre; Rosa26lsl-GFP reporter in the thalamus, we noted several glia-like morphologies that were also negative for the pan-neuronal marker NeuN (data not shown).
The hypothalamic domain of Lhx6 expression only partially overlaps with that one of Nkx2.1 and defines additional Dlx5+ GABAergic progenitors of the hypothalamus (Díaz et al., 2014; Kim et al., 2020; Shimogori et al., 2010). Hence, we fate-mapped Lhx6+ lineages with the Lhx6Cre line (Figure 8I) and investigated the presence of GFP+Pvalb+ co-expressing neurons in TC regions, at P14. As no GFP+ cells were present in thalamic territory (GFP+Pvalb+0%, n = 4 brains; Figure 8Ji,Jii,K), we excluded the alar hypothalamus as a potential source of the Pvalb+ thalamic interneurons. Importantly, Lhx6 marks also the vast majority of GE-derived telencephalic interneurons (Zhao et al., 2008), hence this result further confirms that the telencephalic GE are an unlikely source of thalamic interneurons in the mouse.
Altogether, we therefore conclude that the rarer Sox14- thalamic interneuron class is a distinct lineage compared to the larger, midbrain-born Sox14+ thalamic interneuron class, and that originates from Dlx5+Foxd1+ progenitors in the prethalamus.
Discussion
Our study reveals a previously unappreciated complexity of GABAergic interneurons in the mouse TC nuclei, demonstrating that interneurons are not restricted to the FO visual thalamus, but present across modalities and hierarchical levels, including limbic structures.
We recognise two broad thalamic interneuron classes, defined by their origin in either the En1+ midbrain or the Dlx5+Foxd1+Nkx2.1-Lhx6- rostral forebrain. However, the two ontogenetic programmes contribute differentially to interneuron numbers, with the midbrain-derived class overwhelmingly more abundant.
The midbrain-derived interneurons depend on the Sox14 transcription factor, a gene that we had previously implicated in LGd interneuron differentiation (Jager et al., 2016) and a known postmitotic marker for GABAergic subtype neurogenesis in the brainstem (Achim et al., 2013; Achim et al., 2014; Huisman et al., 2019; Prekop et al., 2018). Taking advantage of a Sox14GFP mouse line, we now provide absolute numbers and standardised anatomical distribution of this major class of interneurons across the entire thalamus, in the Sox14GFP/+ C57Bl/6 genetic background.
Rather than representing a peculiarity of mice, the midbrain ontogenetic programme may be the dominant source of thalamic interneurons in larger-brained mammals, as suggested by the identification of SOX14+GAD1+ interneurons across virtually all TC nuclei in the interneuron-rich thalamus of the marmoset. This finding is consistent with the recent report of molecularly defined classes of GABAergic interneurons in the macaque and human thalamus, where SOX14 expression differentiates between interneuron subclasses. Interestingly, SOX14- interneurons are DLX1-6+, in agreement with the ontogenetic plan that we propose here (Bakken et al., 2020). Consistent with a conserved midbrain ontogeny of thalamic interneurons, Jones previously described late appearance of interneurons in the ferret and macaque thalamus, progressively from caudal towards rostral nuclei (Hayes et al., 2003; Jones, 2002). It can also be seen from the BrainSpan Atlas of the Developing Human Brain [BrainSpan Atlas of the Developing Human Brain; available from: http://www.brainspan.org; (Miller et al., 2014)] that both GAD1 and SOX14 expression increase in the dorsal thalamus in the mid-prenatal period (from postconception week 16), which is also consistent with a migration of midbrain-born interneurons into these regions.
Interestingly, grafting experiments using chick and quail embryos demonstrated a potential for midbrain cells to populate retino-recipient nuclei in the chick diencephalon (Martinez and Alvarado-Mallart, 1989). The grafted midbrain cells were observed migrating tangentially at the surface of the diencephalon and seemingly through the host optic tract before invading the regions targeted by the retinal projections (Martinez and Alvarado-Mallart, 1989). The neurotransmitter identity of these migrating cells is unknown, but their midbrain origin and distribution across the thalamus resemble the mouse Sox14+ interneurons, suggesting that in birds too, the largest cohort of interneurons is a midbrain lineage. Relatedly, lineage tracing in chick, using a retroviral library, indicated that clonally related siblings can populate both the diencephalon and mesencephalon (Golden and Cepko, 1996), in keeping with a revised model of evolutionary relationship of caudal diencephalon and midbrain (Albuixech-Crespo et al., 2017). The distribution of Sox14+ interneurons observed in the mouse is similar to the one described in the opossum, a living marsupial thought to resemble early mammals in the fossil record (Penny et al., 1984). Intriguingly, rather than spreading throughout the nucleus, interneurons occupy the lateral subdivision of the LP in the adult opossum thalamus (Penny et al., 1984), reminiscent of the route taken by migrating midbrain-derived interneuron precursors in the developing mouse thalamus.
While the emerging picture points to a midbrain ontogeny for the largest fraction of thalamic interneurons, this is not sufficient to explain the overall developmental complexity of interneurons in the thalamus. In both the mouse and marmoset, we now report the presence of Sox14-Gad1+ interneurons with drastically more restricted distribution. In the mouse this interneuron class is found enriched in HO TC nuclei (the non-specific MD and LD, but also sensory-related LP and PO). Similarly, in the marmoset SOX14-GAD1+ interneurons are also a minor class enriched in the HO nuclei MD and LD in the anterior portion of the thalamus. This specific distribution is intriguing as it may reflect the requirement in some associative nuclei for interneurons with unique functional properties that the larger midbrain-derived class cannot provide. Such hypothetical evolutionary drive is not dissimilar to the one previously proposed for some interneurons of the human thalamus, where GE-derived DLX1/2+ interneurons were shown to migrate into associative nuclei MD and pulvinar (Letinić and Kostović, 1997; Letinic and Rakic, 2001; Rakić and Sidman, 1969).
While a dual midbrain and forebrain ontogeny of thalamic interneurons emerges as the conserved mammalian blueprint for thalamic interneuron organisation, with the midbrain-derived class contributing the largest proportion of interneurons and the forebrain-derived class enriched in selected HO TC nuclei, species-specific differences also exist. In the mouse, midbrain- and forebrain-derived interneurons are spatially segregated along clear anatomical and functional subdivisions of the thalamus, in the marmoset, presumptive midbrain-derived interneurons expanded dramatically and are more broadly distributed. The forebrain-derived interneurons are not found in precisely the same set of associative TC nuclei across mouse and marmoset, while the forebrain-derived human lineage previously described is thought to be an evolutionary innovation that migrates into the thalamus from the GE along transient anatomical structures that are not present in rodents and non-human primates (Letinić and Kostović, 1997). Consistent with this, our data support a model whereby the mouse, and by extension the marmoset Sox14-Gad1+ interneurons are specified in the Nkx2.1-Lhx6-Dlx5+Foxd1+ prethalamus, rather than subpallium. Technical limitations make a detailed assessment of lineage descent in non-human primates and humans more challenging and whether humans retained the prethalamic interneuron class that we described here is currently unknown. Further investigation of species-specific differences may provide important cues to trace the evolution of the mammalian TC system, using interneurons as the key to unravel its complexity.
Materials and methods
Animals
The mice were housed in the animal facilities at King’s College London under standard conditions on a 12 hr:12 hr dark/light cycle, with unrestricted access to water and food. Housing and experimental procedures were approved by the King’s College London Ethical Committee and conformed to the regulations of the UK Home Office personal and project licences under the UK Animals (Scientific Procedures) 1986 Act. Both female and male mice were used in a randomised way across experiments. The morning when the vaginal plug was observed was designated as embryonic day (E) 0.5 and the day of birth as postnatal day (P) 0.5 (see also Table 1).
Callithrix jacchus
Request a detailed protocolA total of seven New World marmoset (C. jacchus) monkeys were used in this study. All experiments were conducted in accordance with the guidelines approved by the RIKEN Institutional Animal Care (W2020-2-022).
Immunohistochemistry and ISH
Request a detailed protocolMice were transcardially perfused with 4% PFA and the brains dissected and postfixed in PFA at 4°C overnight, then washed in PBS for at least 24 hr at 4°C. For ISH, brains were stored in PFA for 5 days, to minimise RNA degradation, and all the subsequent solutions were treated with diethyl pyrocarbonate (DEPC; AppliChem). The brains were cryoprotected in a sucrose gradient (10–20–30%), frozen on dry ice, and cryosectioned as 20 μm coronal sections collected on Superfrost Ultra Plus slides (Thermo Scientific) for ISH, or as 60 μm free-floating coronal sections for IHC.
Immunohistochemistry
Request a detailed protocolBrain sections were washed in PBS three times and blocked in 2–7% normal goat serum (NGS) solution (in 1× PBS, 0.1–0.3% Triton-X100) for 2 hr at room temperature (RT). Primary antibodies (Table 2) were diluted in blocking solution and incubated with the sections (as stated in the table). This was followed by three 30 min PBS washes, and incubation in secondary antibodies (Table 2) diluted 1:500 in blocking solution, for 2 hr at RT. After two 30 min PBS washes, the sections were incubated in DAPI for 30 min (1:40,000 dilution in PBS; Life Technologies) and mounted using ProLong Gold mounting media (Invitrogen).
Table 2
Antibodies.
| Antibody | Dilution | Incubation time | Source |
|---|---|---|---|
| Rabbit anti-GABA | 1:2000 | 2X ON, 4°C | Sigma, A2052 |
| Chicken anti-Gfp | 1:5000 | 2X ON, 4°C | Abcam, Ab13970 |
| Mouse anti-parvalbumin | 1:2000 | 1X ON, 4°C | Sigma-Aldrich, P3088 |
| Goat anti-chicken Alexa-488 | 1:500 | 2 hr, RT | Invitrogen, A11039 |
| Goat anti-rabbit Alexa-568 | 1:500 | 2 hr, RT | Invitrogen, A11036 |
| Goat anti-rabbit Alexa-647 | 1:500 | 2 hr, RT | Invitrogen, A21245 |
| Goat anti-mouse Alexa-568 | 1:500 | 2 hr, RT | Invitrogen, A11004 |
| Goat anti-mouse Alexa-635 | 1:500 | 2 hr, RT | Invitrogen, A31575 |
In situ hybridisation
Request a detailed protocolGad1 antisense RNA probe was transcribed in vitro from full-length cDNA template (IMAGE ID: 5358787). The probe was diluted to a final concentration of 800 ng/ml in hybridisation buffer (50% formamide, 10% dextran sulphate, 1 mg/ml rRNA, 1× Denhardt’s solution, 0.2 M NaCl, 10 mM Tris HCl, 5 mM NaH2PO4.2H2O, 1 mM Tris base, 50 mM EDTA) and applied onto the slides, which were incubated in a humidified chamber at 65°C overnight. The slides were then washed three times for 30 min in wash buffer (50% formamide, 1× SSC, 0.1% Tween) at 65°C, two times for 30 min in MABT buffer (100 mM maleic acid, 150 mM NaCl, 0.1% Tween-20) at RT, and blocked for 2 hr at RT (2% Boehringer Blocking Reagent (Roche), 20% inactivated sheep serum in MABT). Sheep a-DIG alkaline phosphatase conjugated antibody (Roche, 11093274910) was diluted 1:2000 in the blocking solution and incubated with the slides overnight at 4°C. This was followed by five 20 min washes in MABT and two 20 min washes in the AP buffer (0.1M Tris-HCl pH 8.2, 0.1%-Tween-20). Fast red TR/Naphthol AS-MX tablets (Sigma) were dissolved in the AP buffer and applied onto the slides for colour reaction for 3–6 hr at RT in the dark. The slides were then washed three times for 20 min in PBS before proceeding with IHC for GFP as described above. Sox14GFP/+ and Sox14GFP/GFP sections were always processed in parallel.
ISH in C. jacchus
Request a detailed protocolFluorescent ISH was performed as previously described (Watakabe et al., 2006) with some modifications. Riboprobes incorporating digoxigenin (DIG) and fluorescein (FL) were hybridised overnight. After washing, FL- and DIG-labelled probes were each detected in different ways. For detection of the DIG probes, the sections were incubated with an anti-DIG antibody conjugated with horse radish peroxidase (HRP) (1/500, Roche Diagnostics) for 6 hr at room temperature. After washing in TNTx (0.1 M Tris-HCl, pH 7.5, 0.15 M NaCl, 0.05% Triton X-100) three times for 5 min, the sections were treated with 1:100 diluted TSA-Plus (DNP) reagents (Perkin Elmer) for 20 min. After washing in TNTx 3 × 10 min, the sections were incubated for 2 hr at room temperature with an anti-DNP antibody conjugated with Alexa 488 (1/500, Invitrogen). After quenching HRP activity and washing, the sections were incubated for 2 hr at room temperature with an anti-FL antibody conjugated with HRP (1/500, Roche Diagnostics) followed by reaction with TSA biotin reagents (Perkin Elmer) and visualisation with streptavidin conjugated with Alexa594 (Invitrogen).
Quantifying distribution of neuronal populations in histological sections
In mice
Request a detailed protocolConfocal z-stacks covering the extent of the thalamus across all axes (caudo-rostral, ventro-dorsal, and latero-medial) were acquired using either Nikon A1R inverted confocal, inverted spinning disk Nikon Ti microscope or Olympus VS120 slide scanner, with 10× (NA 0.30 Plan Fluor DLL) and 20× (NA 0.75 Plan Apo VC or UPLSAPO NA 0.75) objectives. The stacks were then viewed with the Neurolucida software. TC nuclei were identified from the DAPI counterstain, using cytoarchitectonically recognisable structures, such as the LGd, the habenular complex, the RT, the anterior pretectum, and the fasciculus retroflexus (fr), as landmarks for orientation and reference. When the nuclear GFP reporter was used, only cells with detectable DAPI signal were included in the calculations. The cells of interest (Table 3) were assigned to TC regions by comparing the sections to the Allen Brain Reference Atlas and annotated and counted manually. For each brain, only one hemisphere was analysed (chosen in a randomised way). For experiments using Gad1+ and Chrna6+ ISH data from the Allen Mouse Brain Atlas resource [2004 Allen Institute for Brain Science. Allen Mouse Brain Atlas. Available from: mouse.brain-map.org; (Lein et al., 2007)], all images of P56 C57BL/6J coronal brain sections containing the thalamus were downloaded for each gene (every eighth 25-µm-thick section, sampling every 200 µm across the thalamus), and analysed in the same way as described above.
Table 3
Genetic identity of cells counted across TC regions and technical details of corresponding experiments.
| Transgenic line | Age | Cells annotated/counted | Number of brains | Sampling | Section thickness (µm) |
|---|---|---|---|---|---|
| Mouse | |||||
| Sox14GFP/+ | P21 | GFP+ | 3 | Whole thalamus | 50 (10; optical sections) |
| Sox14GFP/+ | P14 | GFP+ and Gad1+ | 3 | Every tenth coronal section | 20 |
| Sox14GFP/+ | P14 | GFP+ and Pvalb+ | 2 | Every sixth coronal section | 60 |
| Sox14GFP/GFP | P14 | GFP+ and Gad1+ | 3 | Every tenth coronal section | 20 |
| En1Cre; Rosa26lsl-GFP | P21-30 | GFP+ | 3 | Every sixth coronal section | 60 |
| En1Cre; Rosa26lsl-GFP | P14 | GFP+ and Pvalb+ | 3 | Every sixth coronal section | 60 |
| Dlx5/6Cre; Rosa26lsl-GFP | P14 | GFP+, Pvalb+, and GABA+ | 3 | Every sixth coronal section | 60 |
| Foxd1Cre; Rosa26lsl-nuclearGFP | P14 | GFP+, Pvalb+, and GABA+ | 5 | Every sixth coronal section | 30 |
| Nkx2.1Cre; Rosa26lsl-GFP | P14 | GFP+ and Pvalb+ | 3 | Every sixth coronal section | 60 |
| Lhx6Cre; Rosa26lsl-GFP | P14 | GFP+ and Pvalb+ | 4 | Every sixth coronal section | 60 |
| PvalbCre; Rosa26lsl-nuclearGFP | P14 | GFP+, Pvalb+, and GABA+ | 2 | Every sixth coronal section | 60 |
| Marmoset | |||||
| Wild type | P0 | SOX14 and GAD1 | 3 | Representative anterior, intermediate and posterior planes | 28 |
In marmoset
Request a detailed protocolImages were acquired with a fluorescence microscope BZ-X810 (Keyence) or BZ-9000 (Keyence). Representative coronal sections at anterior, intermediate, and posterior levels were analysed manually, by delineating nuclear boundaries according to the neonate Marmoset Gene Atlas, RIKEN CBS, Japan (https://gene-atlas.brainminds.riken.jp). Cell counting was conducted using the Cell Counter Plugin and ROI manager in ImageJ (Schindelin et al., 2015). Within the boundaries of each TC nucleus analysed, three ROIs of 263 μm by 263 μm were positioned randomly and their content of single positive or double positive cells added together to generate a representative fraction of GAD1+ and GAD1+SOX14+ cells for the TC nucleus (no SOX14 single positive cells were detected). Counts were replicated in three age matched brains to calculate mean ± SEM.
3D reconstructions of cell distributions from histological sections
Request a detailed protocol3D reconstructions of cell distributions (Table 3) across thalamic regions were generated for each brain separately using the Neurolucida software (MBF Bioscience), from the acquired confocal z-stacks or Allen Mouse Brain Atlas ISH data as described above. For each image the outline of the thalamus and the surrounding structures were manually traced using the ‘contour’ function and the cells were annotated with the ‘marker’ function, placed at the centre of the soma. Traced images were then aligned in sequential rostro-caudal order, manually for each brain, using tissue landmarks (midline and clearly recognisable structures, for example, LGd, RT, habenula, hippocampus) for reference, and their spacing in the rostro-caudal dimension was preserved according to the sampling used for each brain.
3D reconstructions of cell distributions by whole brain serial two photon imaging
Request a detailed protocolSox14GFP/+ mouse brain samples (P21; n = 3) were embedded in a 4.5% oxidised-agarose solution containing agarose (type 1; Sigma), 10 mM NaIO4 (Sigma) and 50 mM phosphate buffer (PB). Samples were imaged with TissueCyte 1000 (Ragan et al., 2012) with a custom cooling system (JULABO UK Ltd.) for serial two-photon (STP) tomography across the complete mouse brain. Physical sectioning was performed every 50 μm with optical sectioning every 10 μm. A 16×, 0.8 NA immersion objective (Nikon Inc) acquired 1 × 1 mm image tiles at spatial resolution 0.54 μm with a 12 × 10 tiling mosaic required to obtain a complete coronal tissue section. Laser (Chameleon Ultra II, Coherent) excitation was conducted at 920 nm for GFP excitation with three PMT channel acquisition for red, green, and blue wavelength collection. STP imaging occurred over 5 days and generated 3.5 terabytes of data per brain. Tiled data was stitched alongside STP acquisition using a custom Python and ImageJ/Fiji pipeline.
STP data sets of each mouse brain were down-sampled to 10 μm isotropic voxel size and registered with the Allen CCF3 average atlas using Elastix (Klein et al., 2010). Registration was performed from average atlas (moving) to down-sampled STP (fixed) using a combination of rigid, affine and b-spline transformation steps, executed using a multiresolution approach for robust global and local structure registration. An advanced Mattes Mutual Information similarity metric and an adaptive stochastic gradient descent objective optimiser were used at each transformation step with the transformation at each step combined into a final transformation map which was applied to the CCF3 annotation atlas and a custom hemisphere atlas used to distinguish structures across hemisphere. Registration resulted in a spatial mapping from the STP data to the CCF3 atlas space allowing the delineation of thousands of anatomical structures according to the Allen Brain Atlas hierarchically organised taxonomy.
For automated cell counting, a U-Net (Ronneberger O., 2015) deep learning network was trained to segment fluorescently labelled cells in STP and confocal data sets. During training, 219 images of fluorescently labelled cells (512 × 512 pixels; 0.54 μm voxel size) were manually segmented using ImageJ/Fiji. Images came from STP and confocal data sets of GFP labelled cells from transgenic mouse lines and viral tracing studies and contained GFP expression localised to soma and dendritic and axonal structures. During manual segmentation, only soma localised fluorescence was labelled. To increase generalisation of the network for robust performance on new data, drop out layers at 50% probability were introduced into the network, plus image augmentation was used to increase the initial 219 image data set by 56-fold. Augmentation operations included image flipping, rotation in the range −360° to +360°, zooming in the range 90–110%, skewing, a random elastic distortion using a grid size of 10 pixel spacing, shearing and a custom Poisson noise addition. Some transformations were assisted using the Python package Augmentor (D Bloice et al., 2017), with the custom Poisson noise generation written as a class to interface with the Augmentor package. Each transformation was given a 50% probability of occurring and resulted in a final training data set of 12,264 image and annotated pairs. Training data was split 75% (9198 samples) for training the network and 25% (3066 samples) for validating the network with conscious effort to maintain class balance between the training and validation to prevent overfitting or loss issues during training.
The model was trained with the ELU activation function, using an Adam optimiser with a Binary Cross-entropy loss function. A batch size of 8 was used with early stopping evoked if a validation dice loss score did not improve after 30 epochs of training. Model training was performed on a workstation equipped with a NVIDIA Titan Xp GPU using Python and the TensorFlow 2.0 platform.
For automated thalamus counting, all structures belonging to the thalamus, according to the Allen Brain Atlas hierarchically organised taxonomy, were extracted from the registered STP data sets using masks upsampled to the original 0.54 μm data and fed into the trained network for automated segmentation. Correction for oversampling of cells in the axial axis was done by grouping detected cells if they overlapped within a radius of 10 μm, and subsequently keeping the centrally positioned cell in the axial axis. Automated counting in the entire thalamus took 7 hr per sample using an Ubuntu Intel(R) Core(TM) i9-7980XE CPU at 2.60 GHz workstation, with 32 cores and 128 GB RAM.
NND calculations
Request a detailed protocolNearest neighbour distance (NND) was determined for the Sox14+Gad1+ and Sox14-Gad1+ cells from the 3D reconstructions of their distributions. The cells’ coordinates in 3D were generated by Neurolucida and analysed using a custom Python script and the Pandas library (McKinney et al., 2010) to calculate NNDs separately for each group and between the two groups, for each Sox14GFP/+ brain individually. The data was then normalised to the largest NND within each data set (each individual group and between groups sets for each brain) averaged across the brains (mean ± SEM) and plotted as cumulative distribution. Normalisation allows us to plot their cumulative distribution as a fraction of the maximum distance, though even before normalisation of the curves were broadly similar. Statistically significant differences between the distributions were verified using the two-sample Kolmogorov–Smirnov test, implemented in the SciPy library (Jones et al., 2001).
Migratory morphology analysis
Request a detailed protocolE16.5, E17.5, P0.5, P1.5 (n = 3 brains/developmental stage), and P2.5 (n = 1) En1Cre; Rosa26lsl-GFP brains were quickly dissected on ice and immersed in 4% PFA for 12 hr before switching to PBS. 300-µm-thick coronal sections were cut on a vibratome (Leica VT 1200S). To increase the imaging depth, the sections were cleared following the ScaleSQ protocol (Hama et al., 2015). ScaleS4 buffer was used as a mounting medium (Hama et al., 2015), and spacers were placed on the slides to prevent compressing the sections. Nikon A1R inverted confocal was used to acquire z-stacks that covered the entire extent of the thalamus for each brain, with a 20× objective (NA 0.75 Plan Apo VC). The achieved imaging depth in z ranged from 200 to 250 µm. The stacks were imported into Neurolucida software (MBF Bioscience) to trace the migratory morphology of GFP+ cells in the LGd, LP, and VP. On average, two sections covered the extent of these nuclei in the rostro-caudal dimension and the first time point when GFP+ cells were observed there was at E17.5. GFP+ cells were not traced in the PO and MG due to their low numbers in these nuclei in the juvenile and adult brains, and the ambiguity in delineating these regions anatomically in the embryonic brains. We did not observe GFP+ cells with neuronal morphology in any other TC regions (i.e. outside the FO and HO sensory thalamus) for all ages analysed. In the analysed regions (LGd, LP, and VP), all GFP+ somas were annotated using the semi-automated ‘Soma’ function. The leading processes were traced manually with the ‘Tree’ function, starting in the middle of the soma and until each process could be unequivocally identified or until the point of bifurcation, for all GFP+ cells with a clearly visible and identifiable leading process (44% of all GFP+ cells at E17.5, 30% at P0.5, 26% at P1.5, 14% at P2.5). The 3D coordinates for each leading process were then exported into Excel, and their orientation was expressed in the brain’s coordinate system (x=L−M, y=V−M, z=C−R), as a vector joining the start and end point of the process, using a custom Python script and the Pandas (McKinney et al., 2010) and Numpy (van der Walt et al., 2011) libraries. Each vector was defined by its orientation in spherical coordinates (polar and azimuthal angle) and overall length. Population level orientation data for the LGd, LP, and VP at E17.5 and P0 was plotted as heat-maps, by binning cells according to their spherical coordinates. The bins were then integrated along each axis to reveal a dominant orientation (e.g. for the LGd, 66% and 69% of cells oriented dorso-ventrally and caudo-rostrally, respectively). Polar histograms of leading process orientation in the dorsal-ventral-lateral-medial plane were also produced.
Spatial clustering analysis
Request a detailed protocolUnsupervised machine learning methods were used to investigate spatial organisation of Sox14+Gad1+ and Sox14-Gad1+ cells. The 3D models of P14 Sox14GFP/+ thalamus generated with Neurolucida for NND analysis were again used to obtain the coordinates of all thalamic interneurons.
These data were analysed separately for each brain (n = 3) using a custom Python script, and partitioned into clusters using the k-means algorithm implemented in the library Scikit-Learn (Buitinck et al., 2013). The algorithm takes as input the expected number of clusters k.
Multiple values of k were tested, and evaluated using the silhouette coefficient metric of clustering performance (Rousseeuw, 1987), also implemented in Scikit-Learn. The silhouette coefficient is equal to the average ratio of distances between points within and between each cluster. More positive scores indicate coherent, well-separated clusters, whereas scores close to zero indicate overlapping clusters. The score was highest (0.472 ± 0.012) for k = 2, and the average fraction of all Sox14+ and Sox14- cells in each of the resulting clusters was computed across all brains.
We also performed k-means clustering on the 3D distribution of Gad1+ cells obtained from ISH data from the Allen Mouse Brain Atlas. The silhouette score was again highest (0.512) for k = 2, and the resulting clusters have a spatial definition similar to those from the P14 Sox14GFP/+ thalamus.
Statistics
Comparison of distributions
Request a detailed protocolThe chi-squared test was used to test for significant differences in the thalamus-wide distribution of specific cell classes. This thalamus-wide comparison compensates for categorical errors arising from a degree of uncertainty in nuclear boundaries, as a result of variation in the sectioning plane and other factors.
For each distribution, average relative cell numbers were computed in Excel. A custom python script was used to compute the chi-squared statistic, and the corresponding p-value was computed using the chi-squared cumulative density function implemented in SciPy (Jones et al., 2001).
Change in interneuron numbers in the Sox14 knockout
Request a detailed protocolThis was tested for statistical significance using unpaired two-sample two-tailed t-test, comparing the Sox14 knockout to Sox14GFP/+ for each interneuron class separately (n = 3 brains/genotype). Total interneuron numbers across all TC nuclei were compared and sampling was consistent between genotypes (each 10th thalamic section was analysed for each brain).
Identification of outliers
Request a detailed protocolIn the analysis of the Marmoset's thalamus, the fraction of GAD1 single positive cells is low in most TC nuclei tested, this low frequency is partly due to the lower efficiency of the SOX14 probe compared to the GAD1 and therefore a systematic error. In the LD and MD, however, the frequency of GAD1 single positive cells is higher. To demonstrate that values for these two TC nuclei are outliers, we applied the method described in Motulsky and Brown, 2006, implemented in GraphPad Prism software.
Data availability
All data generated or analysed during this study are included in the manuscript.
References
-
Mechanisms regulating GABAergic neuron developmentCellular and Molecular Life Sciences 71:1395–1415.https://doi.org/10.1007/s00018-013-1501-3
-
GABAergic neurons in mammalian thalamus: a marker of thalamic complexity?Brain Research Bulletin 42:27–37.https://doi.org/10.1016/S0361-9230(96)00107-4
-
Evolution of neuronal types and familiesCurrent Opinion in Neurobiology 56:144–152.https://doi.org/10.1016/j.conb.2019.01.022
-
A quantitative comparison of the hominoid thalamus I specific sensory relay nucleiAmerican Journal of Physical Anthropology 51:365–381.https://doi.org/10.1002/ajpa.1330510308
-
The evolution and functions of nuclei of the visual pulvinar in primatesJournal of Comparative Neurology 525:3207–3226.https://doi.org/10.1002/cne.24272
-
Synaptic organization of thalamocortical axon collaterals in the perigeniculate nucleus and dorsal lateral geniculate nucleusThe Journal of Comparative Neurology 508:264–285.https://doi.org/10.1002/cne.21671
-
Synaptic development of the mouse dorsal lateral geniculate nucleusJournal of Comparative Neurology 518:622–635.https://doi.org/10.1002/cne.22223
-
Thalamic projections sustain prefrontal activity during working memory maintenanceNature Neuroscience 20:987–996.https://doi.org/10.1038/nn.4568
-
The percentage of projection neurons and interneurons in the human lateral geniculate nucleusHuman Neurobiology 4:91–95.
-
Evolution of the thalamus: a morphological and functional reviewThalamus & Related Systems 4:35–58.https://doi.org/10.1017/S1472928808000356
-
Cortical-Like receptive fields in the lateral geniculate nucleus of marmoset monkeysJournal of Neuroscience 33:6864–6876.https://doi.org/10.1523/JNEUROSCI.5208-12.2013
-
Unveiling the diversity of thalamocortical neuron subtypesEuropean Journal of Neuroscience 35:1524–1532.https://doi.org/10.1111/j.1460-9568.2012.08033.x
-
Augmentor: an image augmentation library for machine learningThe Journal of Open Source Software 2:432.https://doi.org/10.21105/joss.00432
-
The embryonic preoptic area is a novel source of cortical GABAergic interneuronsJournal of Neuroscience 29:9380–9389.https://doi.org/10.1523/JNEUROSCI.0604-09.2009
-
A wide diversity of cortical GABAergic interneurons derives from the embryonic preoptic areaJournal of Neuroscience 31:16570–16580.https://doi.org/10.1523/JNEUROSCI.4068-11.2011
-
Clones in the chick diencephalon contain multiple cell types and siblings are widely dispersedDevelopment 122:65–78.
-
GABA-like immunoreactivity of neurons in the chicken diencephalon and mesencephalonThe Journal of Comparative Neurology 287:455–469.https://doi.org/10.1002/cne.902870405
-
Anatomical evidence concerning the role of the thalamus in corticocortical communication: a brief reviewJournal of Anatomy 187:583–592.
-
Thalamic functions in distributed cognitive controlNature Neuroscience 20:1669–1679.https://doi.org/10.1038/s41593-017-0020-1
-
Not all cortical expansions are the same: the coevolution of the neocortex and the dorsal thalamus in mammalsCurrent Opinion in Neurobiology 56:78–86.https://doi.org/10.1016/j.conb.2018.12.003
-
ScaleS: an optical clearing palette for biological imagingNature Neuroscience 18:1518–1529.https://doi.org/10.1038/nn.4107
-
Two epochs in the development of ?-aminobutyric acidergic neurons in the ferret thalamusThe Journal of Comparative Neurology 463:45–65.https://doi.org/10.1002/cne.10749
-
How inhibitory circuits in the thalamus serve visionAnnual Review of Neuroscience 38:309–329.https://doi.org/10.1146/annurev-neuro-071013-014229
-
Receptive fields, binocular interaction and functional architecture in the cat's visual cortexThe Journal of Physiology 160:106–154.https://doi.org/10.1113/jphysiol.1962.sp006837
-
A comprehensive thalamocortical projection map at the mesoscopic levelNature Neuroscience 17:1276–1285.https://doi.org/10.1038/nn.3780
-
SoftwareSciPy: Open Source Scientific Tools for PythonSciPy: Open Source Scientific Tools for Python.
-
Dichronous appearance and unusual origins of GABA neurons during development of the mammalian thalamusThalamus and Related Systems 1:283–288.https://doi.org/10.1017/S147292880200002X
-
Retinal and cortical afferents to the dorsal lateral geniculate nucleus of the turtle,Emys orbicularis: a combined axonal tracing, glutamate, and GABA immunocytochemical electron microscopic studyThe Journal of Comparative Neurology 391:470–490.https://doi.org/10.1002/(SICI)1096-9861(19980222)391:4<470::AID-CNE5>3.0.CO;2-Y
-
Two lineage boundaries coordinate vertebrate apical ectodermal ridge formationGenes & Development 14:1377–1389.
-
Elastix: a toolbox for intensity-based medical image registrationIEEE Transactions on Medical Imaging 29:196–205.https://doi.org/10.1109/TMI.2009.2035616
-
The medial ganglionic eminence gives rise to a population of early neurons in the developing cerebral cortexThe Journal of Neuroscience 19:7881–7888.https://doi.org/10.1523/JNEUROSCI.19-18-07881.1999
-
Telencephalic origin of human thalamic GABAergic neuronsNature Neuroscience 4:931–936.https://doi.org/10.1038/nn0901-931
-
Attention alters orientation processing in the human lateral geniculate nucleusNature Neuroscience 18:496–498.https://doi.org/10.1038/nn.3967
-
Dlx-dependent and -independent regulation of olfactory bulb interneuron differentiationJournal of Neuroscience 27:3230–3243.https://doi.org/10.1523/JNEUROSCI.5265-06.2007
-
Dlx1&2 and Mash1 transcription factors control striatal patterning and differentiation through parallel and overlapping pathwaysThe Journal of Comparative Neurology 512:556–572.https://doi.org/10.1002/cne.21854
-
A long, remarkable journey: tangential migration in the telencephalonNature Reviews Neuroscience 2:780–790.https://doi.org/10.1038/35097509
-
ConferenceData structures for statistical computing in PythonProceedings of the 9th Python in Science Conference. pp. 51–56.
-
Ultrastructural identification of synaptic terminals from the axon of type 3 interneurons in the cat lateral geniculate nucleusThe Journal of Comparative Neurology 264:268–283.https://doi.org/10.1002/cne.902640210
-
Regionalized differentiation of CRH, TRH, and GHRH peptidergic neurons in the mouse hypothalamusBrain Structure and Function 219:1083–1111.https://doi.org/10.1007/s00429-013-0554-2
-
Foxd1 is required for terminal differentiation of anterior hypothalamic neuronal subtypesDevelopmental Biology 439:102–111.https://doi.org/10.1016/j.ydbio.2018.04.012
-
Synapses between interneurons in the lateral geniculate nucleus of monkeysExperimental Brain Research 25:1–13.https://doi.org/10.1007/BF00237322
-
The distribution of glutamic acid decarboxylase immunoreactivity in the diencephalon of the opossum and rabbitThe Journal of Comparative Neurology 228:38–56.https://doi.org/10.1002/cne.902280106
-
Diverse visual features encoded in mouse lateral geniculate nucleusJournal of Neuroscience 33:4642–4656.https://doi.org/10.1523/JNEUROSCI.5187-12.2013
-
Sox14 is required for a specific subset of Cerebello-Olivary projectionsThe Journal of Neuroscience 38:9539–9550.https://doi.org/10.1523/JNEUROSCI.1456-18.2018
-
Forebrain gene expression domains and the evolving prosomeric modelTrends in Neurosciences 26:469–476.https://doi.org/10.1016/S0166-2236(03)00234-0
-
Telencephalic origin of pulvinar neurons in the fetal human brainZeitschrift Für Anatomie Und Entwicklungsgeschichte 129:53–82.https://doi.org/10.1007/BF00521955
-
Toward an integrative theory of thalamic functionAnnual Review of Neuroscience 41:163–183.https://doi.org/10.1146/annurev-neuro-080317-062144
-
Silhouettes: a graphical aid to the interpretation and validation of cluster analysisJournal of Computational and Applied Mathematics 20:53–65.https://doi.org/10.1016/0377-0427(87)90125-7
-
The ImageJ ecosystem: an open platform for biomedical image analysisMolecular Reproduction and Development 82:518–529.https://doi.org/10.1002/mrd.22489
-
Retinal input regulates the timing of corticogeniculate innervationJournal of Neuroscience 33:10085–10097.https://doi.org/10.1523/JNEUROSCI.5271-12.2013
-
Interneurons and triadic circuitry of the thalamusTrends in Neurosciences 27:670–675.https://doi.org/10.1016/j.tins.2004.08.003
-
Thalamus plays a central role in ongoing cortical functioningNature Neuroscience 19:533–541.https://doi.org/10.1038/nn.4269
-
The role of the thalamus in the flow of information to the cortexPhilosophical Transactions of the Royal Society of London. Series B: Biological Sciences 357:1695–1708.https://doi.org/10.1098/rstb.2002.1161
-
Ontogenetic establishment of order-specific nuclear organization in the mammalian thalamusNature Neuroscience 20:516–528.https://doi.org/10.1038/nn.4519
-
Longitudinal organization of the anterior neural plate and neural tubeDevelopment 121:3923–3933.
-
A genomic atlas of mouse hypothalamic developmentNature Neuroscience 13:767–775.https://doi.org/10.1038/nn.2545
-
Reconstructing the ancestral vertebrate brainDevelopment, Growth & Differentiation 59:163–174.https://doi.org/10.1111/dgd.12347
-
Loss of Nkx2.1 homeobox gene function results in a ventral to dorsal molecular respecification within the basal telencephalon: evidence for a transformation of the pallidum into the striatumDevelopment 126:3359–3370.
-
Adult mouse cortical cell taxonomy revealed by single cell transcriptomicsNature Neuroscience 19:335–346.https://doi.org/10.1038/nn.4216
-
The NumPy array: a structure for efficient numerical computationComputing in Science & Engineering 13:22–30.https://doi.org/10.1109/MCSE.2011.37
-
Dlx5 and Dlx6 Regulate the Development of Parvalbumin-Expressing Cortical InterneuronsJournal of Neuroscience 30:5334–5345.https://doi.org/10.1523/JNEUROSCI.5963-09.2010
-
Binding and complementary expression patterns of semaphorin 3E and plexin D1 in the mature neocortices of mice and monkeysThe Journal of Comparative Neurology 499:258–273.https://doi.org/10.1002/cne.21106
-
In utero fate mapping reveals distinct migratory pathways and fates of neurons born in the mammalian basal forebrainDevelopment 128:3759–3771.
-
Origins of Cortical Interneuron SubtypesJournal of Neuroscience 24:2612–2622.https://doi.org/10.1523/JNEUROSCI.5667-03.2004
-
Fate mapping Nkx2.1-lineage cells in the mouse telencephalonThe Journal of Comparative Neurology 506:16–29.https://doi.org/10.1002/cne.21529
-
Modulation of the notch signaling by Mash1 and Dlx1/2 regulates sequential specification and differentiation of progenitor cell types in the subcortical telencephalonDevelopment 129:5029–5040.
-
Binocular visual responses in the primate lateral geniculate nucleusCurrent Biology 25:3190–3195.https://doi.org/10.1016/j.cub.2015.10.033
-
Distinct molecular pathways for development of telencephalic interneuron subtypes revealed through analysis of Lhx6 mutantsThe Journal of Comparative Neurology 510:79–99.https://doi.org/10.1002/cne.21772
Article and author information
Author details
Funding
Biotechnology and Biological Sciences Research Council (BB/L020068/1)
- Alessio Delogu
Biotechnology and Biological Sciences Research Council (BB/R007020/1)
- Alessio Delogu
Biotechnology and Biological Sciences Research Council (BB/R007659/1)
- Stephen Brickley
Engineering and Physical Sciences Research Council (EP/J021199/1)
- Simon R Schultz
Engineering and Physical Sciences Research Council (EP/L016737/1)
- Gerald Moore
The funders had no role in study design, data collection and interpretation, or the decision to submit the work for publication.
Acknowledgements
We thank the Wohl Cellular Imaging Centre, King’s College London for support with imaging and image analysis software. We are grateful to Beatriz Rico, Monica Moissidis, and Patricia Hernandez at King’s College London for the Nkx2.1Cre; Rosa26lsl-GFP and the Lhx6Cre; Rosa26lsl-GFP samples. We are grateful to the anonymous peer reviewers for their constructive and specific comments. This work was funded by the Biotechnology and Biological Sciences Research Council (BBSRC) grants BB/L020068/1 and BB/R007020/1 to AD and BB/R007659/1 to SB. Two-photon tomography was developed with Engineering and Physical Sciences Research Council (EPSRC) grant EP/J021199/1 to SRS.
Ethics
Animal experimentation: Mice: Housing and experimental procedures were approved by the King's College London Ethical Committee and conformed to the regulations of the UK Home Office personal and project licences under the UK Animals (Scientific Procedures) 1986 Act. Marmoset: All experiments were conducted in accordance with the guidelines approved by the RIKEN Institutional Animal Care (W2020-2-022).
Copyright
© 2021, Jager et al.
This article is distributed under the terms of the Creative Commons Attribution License, which permits unrestricted use and redistribution provided that the original author and source are credited.
Metrics
-
- 4,438
- views
-
- 530
- downloads
-
- 64
- citations
Views, downloads and citations are aggregated across all versions of this paper published by eLife.
Citations by DOI
-
- 64
- citations for umbrella DOI https://doi.org/10.7554/eLife.59272
Download links
A two-part list of links to download the article, or parts of the article, in various formats.
Downloads (link to download the article as PDF)
Open citations (links to open the citations from this article in various online reference manager services)
Cite this article (links to download the citations from this article in formats compatible with various reference manager tools)
Dual midbrain and forebrain origins of thalamic inhibitory interneurons
eLife 10:e59272.
https://doi.org/10.7554/eLife.59272


