Vascular control of the CO2/H+-dependent drive to breathe
- Department of Physiology and Neurobiology, University of Connecticut, United States
- Department of Physiology and Biophysics, University of São Paulo, Brazil
- Department of Pharmacology, University of São Paulo, Brazil
- Department of Pharmacology, University of Vermont, United States
- Institute of Cardiovascular Sciences, United Kingdom
- Department of Physiology, University of Maryland, United States
Figures
Figure 1 with 2 supplements
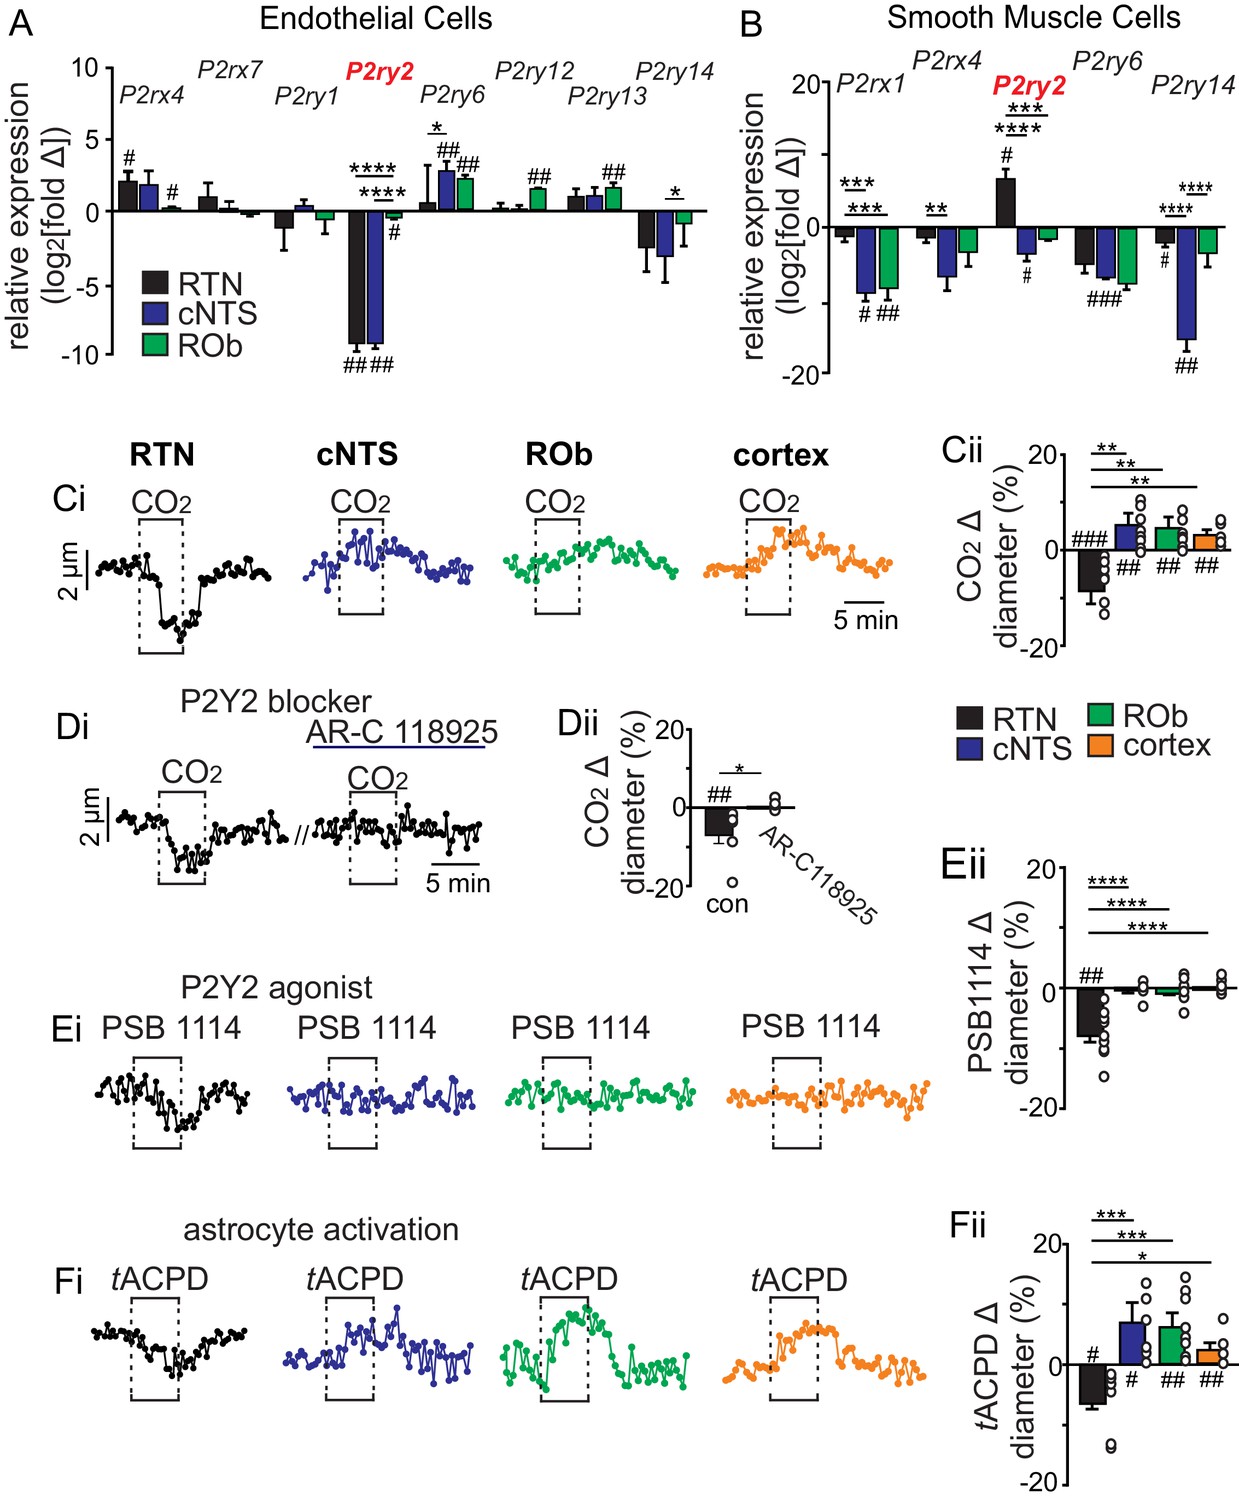
CO2/H+ differentially regulates arteriole tone in the RTN by a P2Y2 receptor dependent mechanism.
(A-B) Tissue sections containing the cNTS, ROb, and RTN were prepared from an endothelial cell (TekCre::TdTomato) and smooth muscle cell reporter mice (Myh11Cre/eGFP). Individual cells were dissociated and sorted to isolate enriched cell populations from each region (100–300 cells/region). Control cells for each region were prepared from slices with experimental regions removed. Fold change of each P2 receptor was determined for each region by normalizing to within group Gapdh expression as well as to control group receptor expression and plotted as log2[fold change]; 0 on the y-axis indicates control group expression for each receptor and negative values reflect less than the control group and positive values reflect greater than control group. Of all P2 receptors detected in each region, only P2ry2 showed an expression pattern consistent with a role in vasoconstriction in the RTN; low expression in endothelial cells (A) and above baseline expression in smooth muscle cells (B) from this region. (C-F) Diameter of arterioles in the RTN, cNTS, ROb and somatosenstory cortex was monitored in brain slices from adult mice over time by fluorescent video microscopy. (C-F) Diameter traces of individual arterioles in each region and corresponding summary bar graphs show that exposure to 15% CO2 (Ci-ii), activation of P2Y2 receptors by bath application of PSB1114 (100 µM) (Ei-ii), or activation of astrocytes by bath application of t-ACPD (50 μM) (Fi-ii) caused vasoconstriction in the RTN and dilation in all other regions of interest. (Di-Dii) The CO2/H+ response of RTN vessels was blocked by a selective P2Y2 receptor antagonist (AR-C118925; 10 μM) #, difference from baseline (one sample t-test). *, differences in each condition (one-way ANOVA with Tukey’s multiple comparison test). One symbol = p < 0.05, two symbols = p < 0.01, three symbols = p < 0.001, four symbols = p < 0.0001.
-
Figure 1—source data 1
Raw Ct values of P2 purinergic transcripts and control marker expression for endothelial and smooth muscle cells.
- https://cdn.elifesciences.org/articles/59499/elife-59499-fig1-data1-v3.xlsx
Figure 1—figure supplement 1
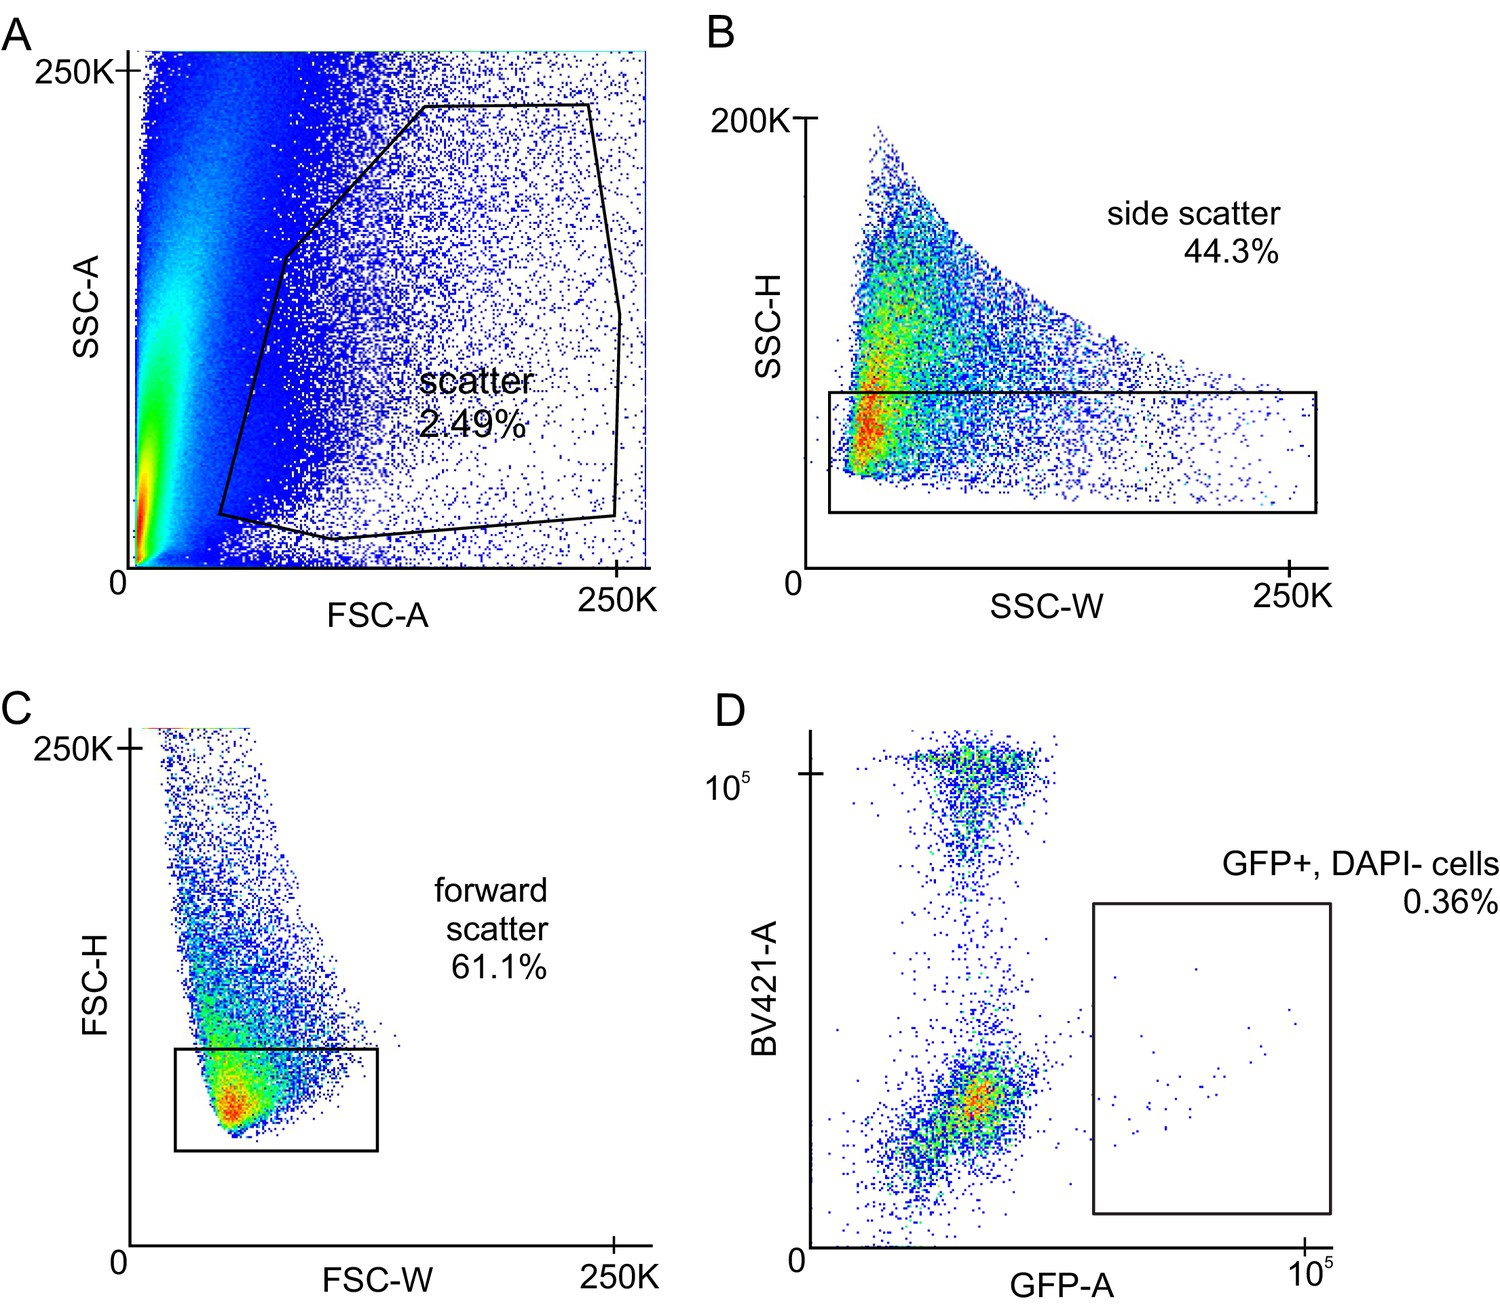
Gating Strategy for FACS sorting of smooth muscle cell and endothelial cell populations from a single-cell suspension.
(A) Scatter graph gating out debris from the sample. (B) Side scatter graph to gate for complexity/doublets. (C) Forward scatter graph to gate for cell size. (D) Scatter graph for DAPI and GFP (or TdTomato). Cells were gated for positive GFP (or TdTomato) and low DAPI signal.
Figure 1—figure supplement 2
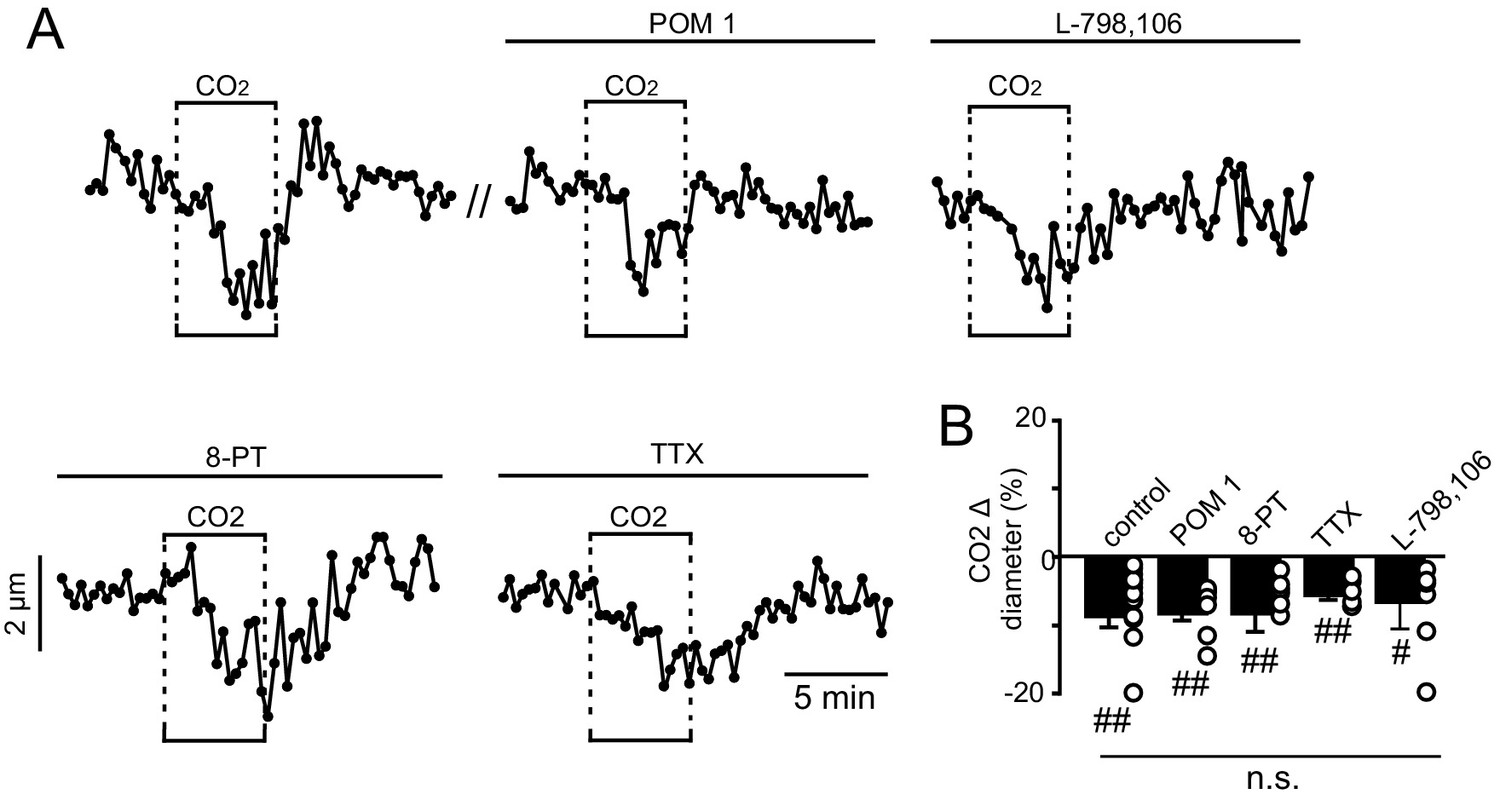
CO2/H+-induced constriction of RTN arterioles in vitro is not dependent on neural activity, prostaglandin EP3 receptors or adenosine signaling.
(A) Traces of arteriole diameter shows that exposure to 15% CO2 alone and in the presence of POM 1 (100 μM; an ectonucleotidase inhibitor), L-798,106 (0.5 μM; a selective EP3 receptor blocker), 8-PT (10 μM; an adenosine receptor antagonist), or TTX (0.5 μM) to block action potentials had similar effects on arteriole diameter. (B) Summary data show CO2-induced change in diameter under control conditions (N = 7 vessels) and in the presence of POM 1 (N = 7 vessels), L-798,106 (N = 5 vessels), 8-PT (N = 8 vessels), and TTX (N = 7 vessels) (F2,19 = 1.063, p>0.05, one-way ANOVA).
Figure 2
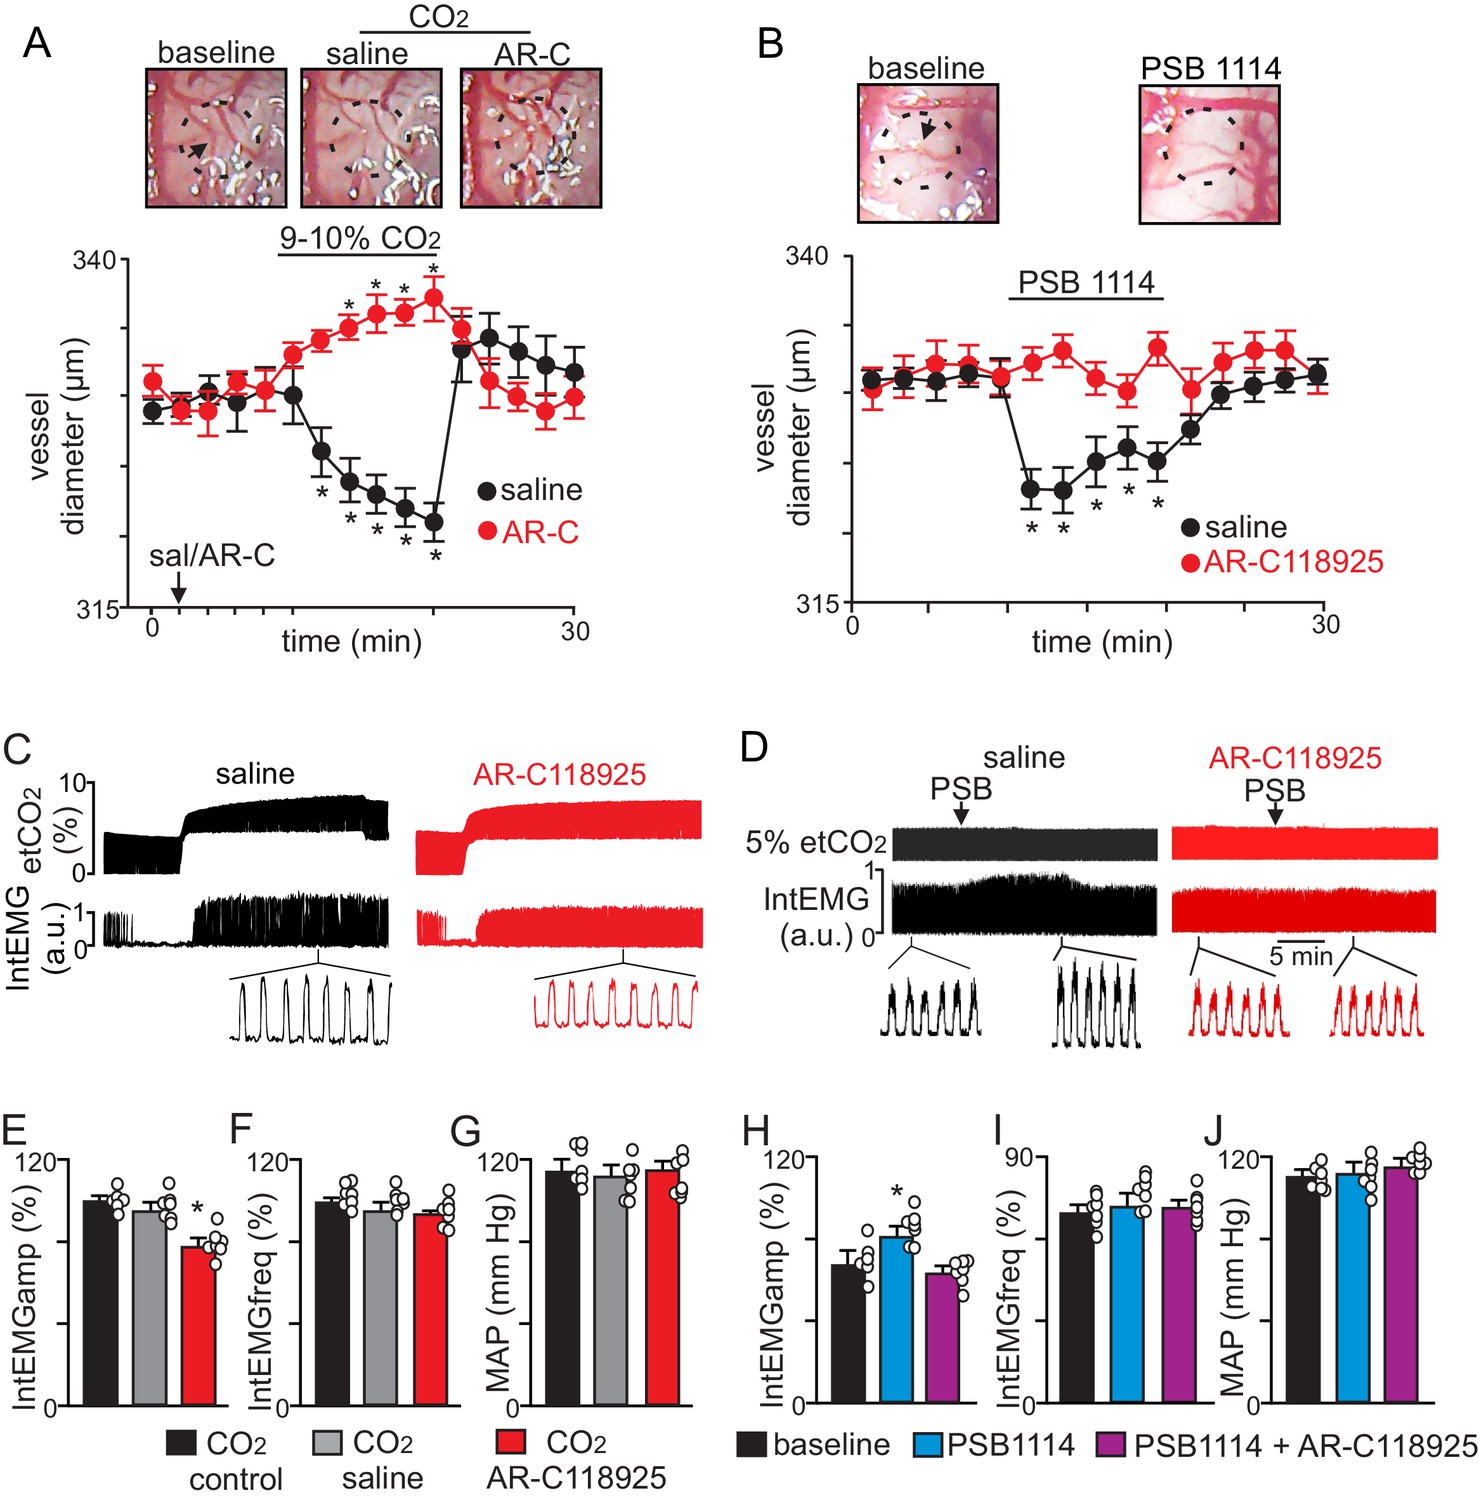
CO2 constricts pial vessels in the RTN region by a P2Y2 receptor-dependent mechanism to increase respiratory behavior in anesthetized mice.
(A) Images of RTN pial vessels and corresponding traces of vessel diameter (N = 6 mice/condition) show that exposure to 9–10% CO2 decreased vessel diameter under control conditions (saline) but not when P2Y2 receptors were blocked with AR-C118925 (1 mM). (B) Images of RTN pial vessels and corresponding traces vessel diameter show that application of a P2Y2 receptor agonist (PSB1114; 100 µM) caused a reversible constriction. (C-D) Traces of external intercostal EMG (IntEMG) and end expiratory CO2 (etCO2) show that blocking CO2/H+-induced vasoconstriction by ventral surface application of AR-C118925 minimally affected respiratory activity at low etCO2 levels but blunted the ventilatory response to 9–10% CO2 (C). Conversely, at a constant etCO2 of 5% the application of PSB1114 to mimic CO2/H+ constriction increased respiratory output (D). (E-J) Summary data show (N = 6 mice/condition) effects RTN application of saline, AR-C118925 or PSB1114 on intercostal EMG amplitude (E, H), frequency (F, I) and mean arterial pressure (MAP; G, J). *, Different (RM-ANOVA followed by Bonferroni multiple-comparison test; *, p<0.05). scale bar = 200 μm.
Figure 3
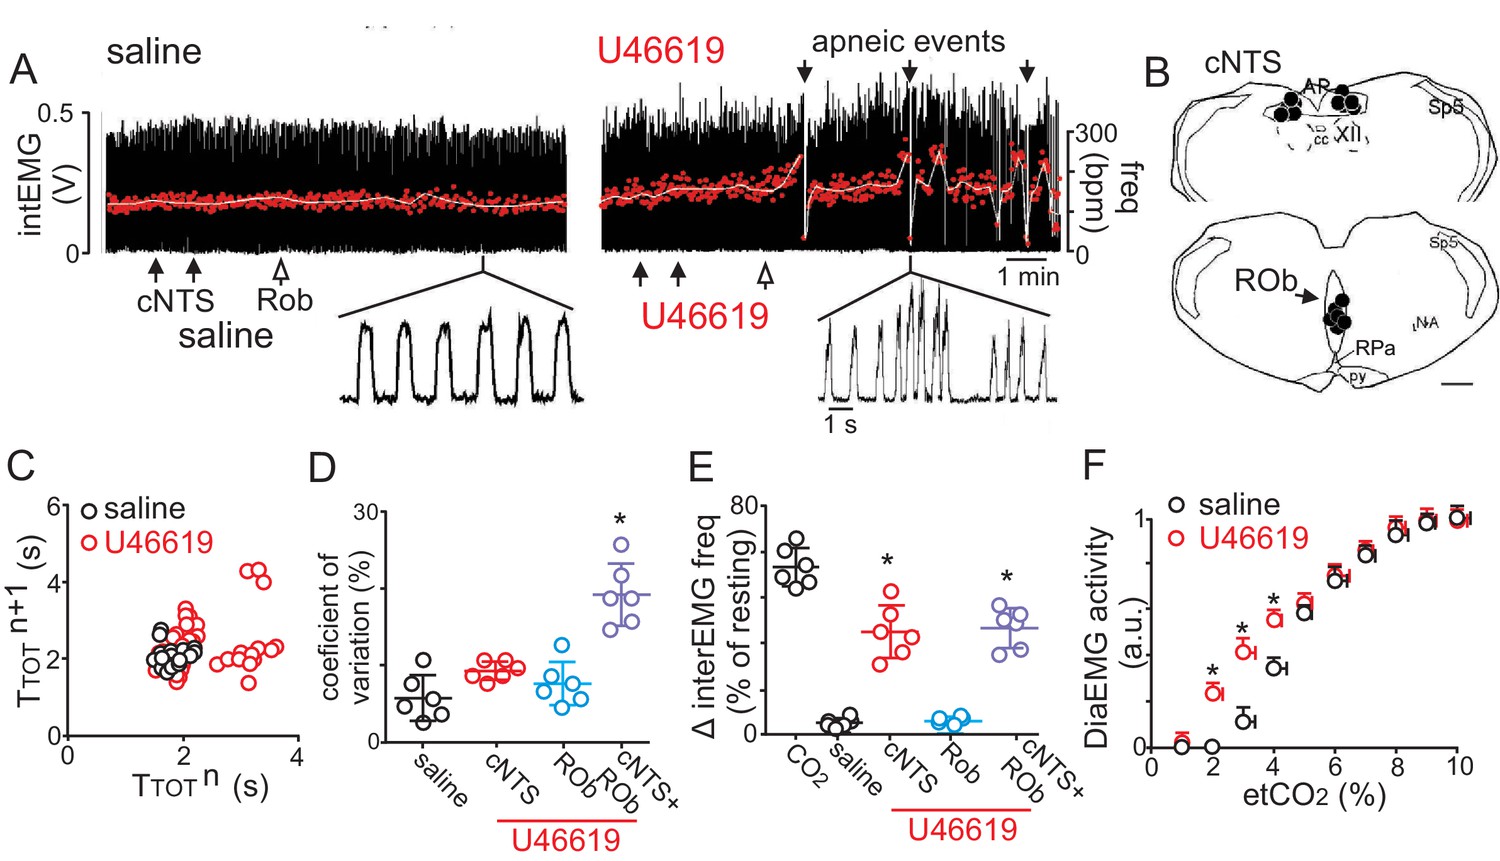
Disruption of CO2/H+ dilation in the cNTS and ROb causes unstable breathing and apnea.
(A) Trace of external intercostal muscle EMG (IntEMG) activity shows respiratory activity of an anesthetized wild type mouse breathing 2.5% CO2 following injections of saline or U46619 (1 μM; 30 nL/region) into the cNTS and ROb. (B) Location of injections in the cNTS and ROb. (C) Representative Poincaré plot (50 breaths) shows breath‐to‐breath (TTOT) interval variability following injections saline (black) or U46619 (red) conditions. (D-E) Summary data (N = 6 animals/group) shows effects of U46619 injections into the cNTS and ROb alone and in combination on the coefficient of variation of IntEMG frequency (C) and IntEMG frequency (E). (F) Summary data show that injections of U46619 injections into the cNTS and ROb lowered the CO2 apneic threshold from 3.2 ± 0.3% to 2.1 ± 0.1% (N = 7 mice). *, Difference in IntEMG activity under control conditions (saline) vs. during U46119 into the NTS and/or ROb (RM-ANOVA followed by Bonferroni multiple-comparison test, p<0.05). scale bar = 200 μm.
Figure 4 with 5 supplements
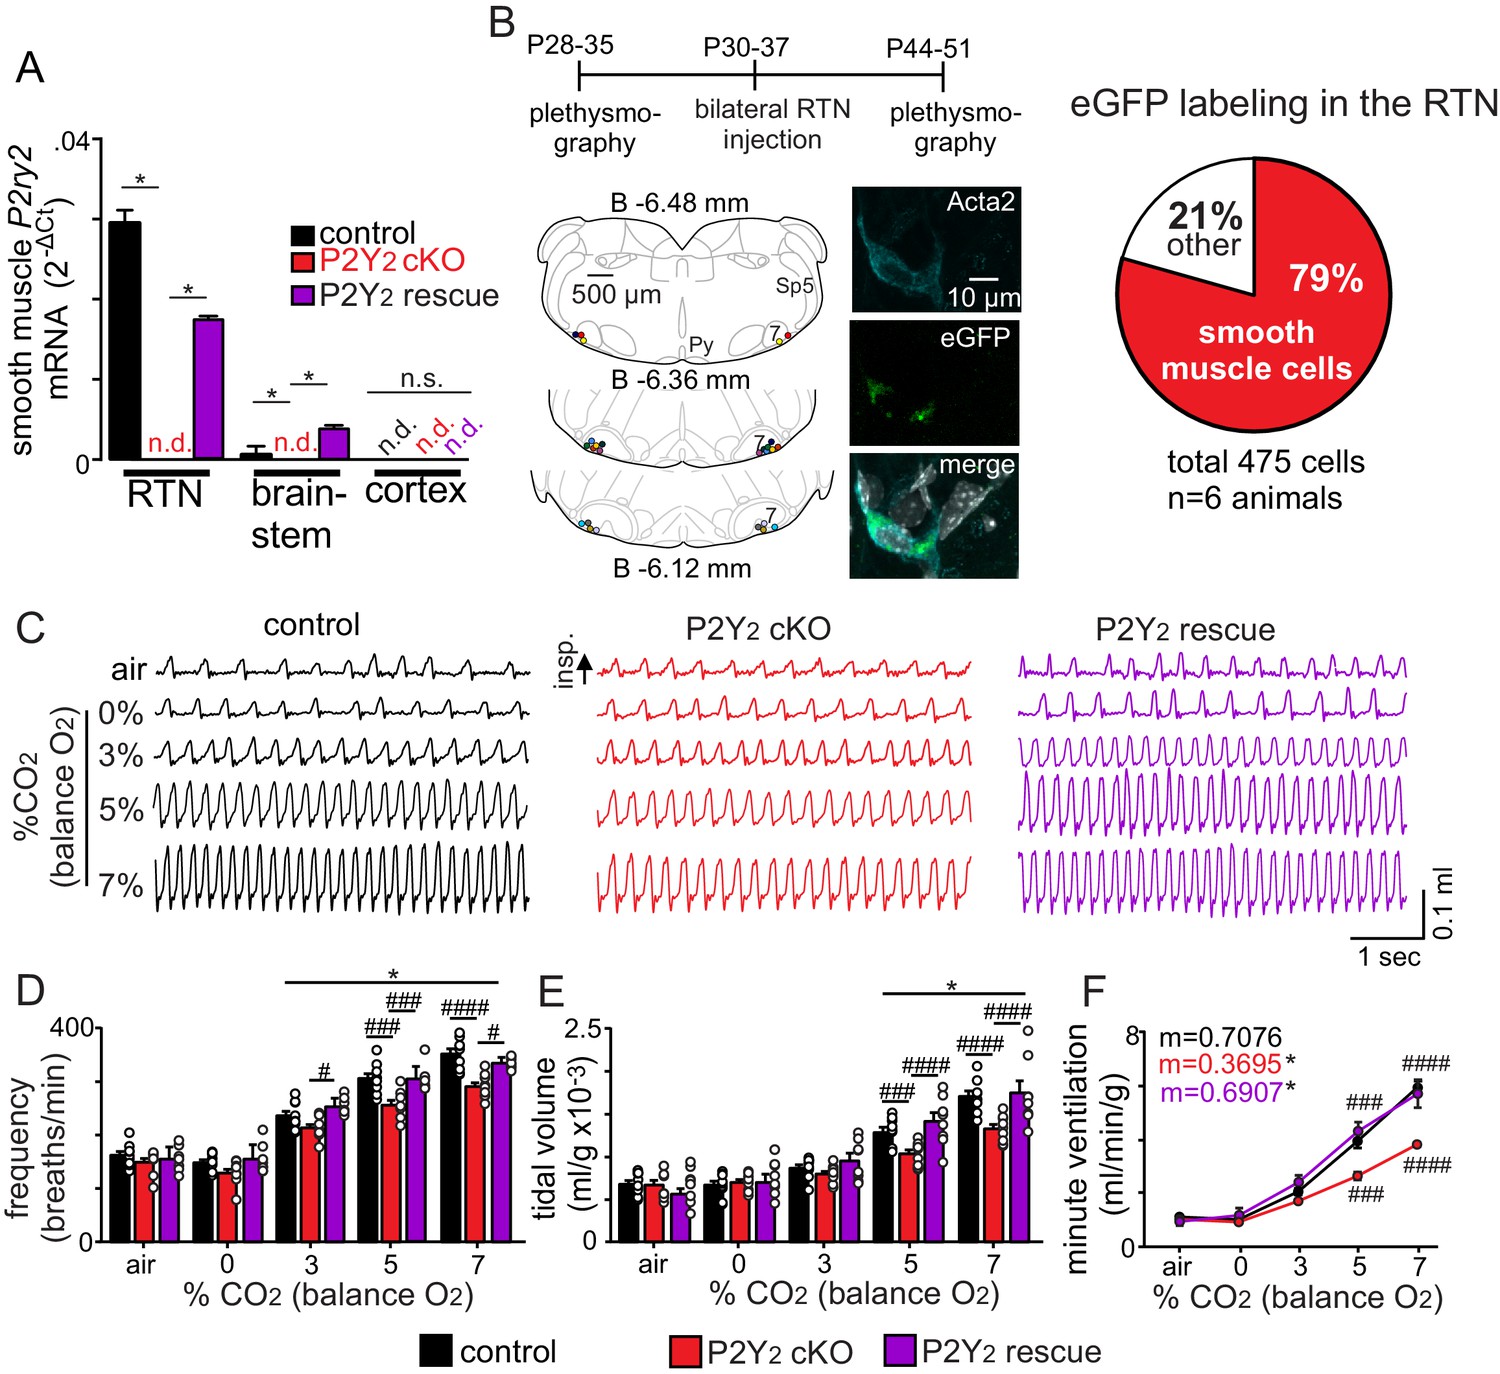
Smooth muscle P2Y2 cKO mice show a blunted CO2 chemoreflex that can be rescued by re-expression of P2Y2 only in RTN smooth muscle cells.
(A) P2Y2 transcript was detected in RTN, brainstem and cortical smooth muscle cells isolated from control mice (TaglnCre::TdTomato), P2Y2 cKO mice (TaglnCre::P2ry2f/f::TdTomato), and P2Y2 rescue mice (P2Y2 cKO animals that received bilateral RTN injections of AAV2-Myh11p-eGFP-2A-mP2ry2). P2ry2 transcript was not detected (n.d.) in smooth muscle cells from P2Y2 cKO mice (N = 3 runs/9 animals). P2ry2 was also not detected in cortical smooth muscle cells from either genotype. Conversely, RTN (p=0.0073) and brainstem (p=0.0073) but not cortical (p>0.05) smooth muscle cells from P2Y2 rescue mice show increased P2ry2 transcript compared to P2Y2 cKO but not to the same level as cells from control mice (p=0.0219) (ANOVA on ranks followed by Dunn multiple comparison test). (B) Left, computer-assisted plots show the center of all bilateral AAV2-Myh11p-eGFP-2A-mP2ry2 injections; each matching color pair of dots corresponds to one animal (N = 13 animals). Approximate millimeters behind bregma (Paxinos and Franklin, 2013) is indicated by numbers next to each section. Right, 2 weeks after injections we confirmed that ~80% of RTN smooth muscle α2 actin (Acta2)-immunoreactive cells were also GFP+(inset). (C-F) Representative traces of respiratory activity (C) and summary data show that smooth muscle-specific P2Y2 KO mice (TaglnCre::P2ry2f/f) breathe normally under room air conditions but fail to increase respiratory frequency (C) or tidal volume (D) during exposure to CO2, thus resulting in diminished minute ventilation at 5–7% CO2 (E). Re-expression of P2Y2 in only RTN smooth muscle cells rescued of the ventilatory response to CO2. Note that TaglnCre only and P2ry2f/f only control mice show similar baseline breathing and responses to CO2 and so were pooled. *, Different from 0% CO2 in condition as assessed by Tukey’s post-hoc multiple comparison test. ####, Different between genotypes (two-way ANOVA with Tukey’s multiple comparison test, p<0.0001).
-
Figure 4—source data 1
Raw Ct values of P2Y2 cKO and P2Y2 rescue mice.
- https://cdn.elifesciences.org/articles/59499/elife-59499-fig4-data1-v3.xlsx
-
Figure 4—source data 2
Metabolic testing in light and dark cycles of control and P2Y2 cKO mice.
- https://cdn.elifesciences.org/articles/59499/elife-59499-fig4-data2-v3.xlsx
Figure 4—figure supplement 1

Cardiovascular, metabolic and blood gas parameters in control and smooth muscle P2Y2 cKO mice.
(A) Traces of blood pressure and ECG activity from control and P2Y2 cKO mice. (B) Summary data (N = 4/genotype) shows that control and P2Y2 cKO mice have similar mean arterial pressures (MAP) during a 12 hr light cycle (T3 = 0.1152, p>0.05) and during a 12 hr dark cycle (T3 = 0.1349, p>0.05). (C) Summary (N = 4/genotype) heart rate (beats/min) during light and dark cycles show similar means for controls and P2Y2 cKO (F1,3=2.896, p>0.05). (D-E), summary (N = 4/genotype) blood pressure (D) and heart rate (E) under room air conditions and during exposure to graded increases in CO2 (values were obtained during the last minute of each condition). Control and P2Y2 cKO animals show similar blood pressure (F1,3=2.051, p>0.05) and heart rate (F2,3=2.896, p>0.05) responses across all experimental conditions. *, indicates significant change from 0% CO2. (F-H) Oxygen consumption (VO2) (F), CO2 production (VCO2) and the respiratory exchange ratio (H) were similar between control (N = 11 animals) and P2Y2 cKO (N = 10 animals) mice. (I-K) Under room air conditions control and P2Y2 cKO mice (N = 7 animals/genotype) showed similar arteriole PO2 (T12 = 0.3080, p>0.05), PCO2 (T12 = 0.7548, p>0.05) and pH (T12 = 0.4437, p>0.05). Blood pressure and heart rate values were compared using a two-way ANOVA with Tukey's post-hoc multiple comparison test. Baseline metabolic activity and blood gas values were compared using an unpaired two-way t-test.
Figure 4—figure supplement 2

Respiratory activity of Myh11Cre/eGFP::P2ry2f/f and control viral injected P2Y2 cKO mice.
(A-C) We crossed Myh11Cre/eGFP with P2ry2f/f as an alternative means of generating a different smooth muscle-specific P2Y2 cKO (Myh11Cre/eGFP::P2ry2f/f) mice. Control (Myh11Cre only and P2ry2f/f only) and Myh11Cre/eGFP ::P2ry2f/f cKO mice show a similar respiratory frequency (A), tidal volume (B) and minute ventilation (c) under room air conditions. However, Myh11Cre/eGFP::P2ry2f/f mice exhibit a blunted ventilatory response to CO2. This respiratory phenotype is nearly identical to the respiratory phenotype of TaglnCre::P2ry2f/f mice (defined as P2Y2 cKO) described in the main text. (D-F) Bilateral RTN injections of control virus (AAV2-Myh11p-eGFP) minimally affected respiratory frequency (D), tidal volume (E) or minute ventilation (F) in TaglnCre::P2ry2f/f (P2Y2 cKO) mice. *, Difference from 0% CO2; #, differences between genotypes (two-way ANOVA with Tukey's multiple comparison test). One symbol = p < 0.05; two symbols = p < 0.01; three symbols = p < 0.001; four symbols = p < 0.0001. Linear regressions were compared by two-tailed analysis of covariance.
Figure 4—figure supplement 3
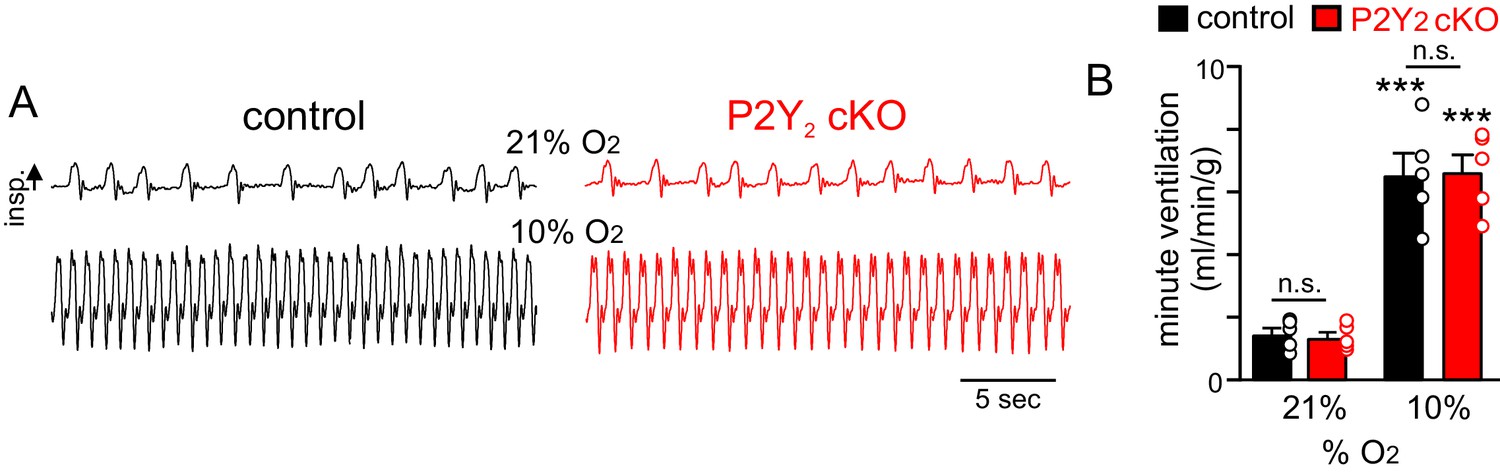
P2Y2 cKO mice show a normal ventilatory response to acute hypoxia.
(A) Traces of respiratory activity from control and P2Y2 cKO mice in room air (21% O2) and during exposure to hypoxia (10% O2). (B) Summary data (N = 8 animals/genotype) plotted as minute ventilation shows that control and P2Y2 cKO exhibit similar respiratory activity under baseline conditions and during hypoxia. ***, Different from control at p<0.001 (two-way RM-ANOVA with Tukey's multiple comparison test).
Figure 4—figure supplement 4
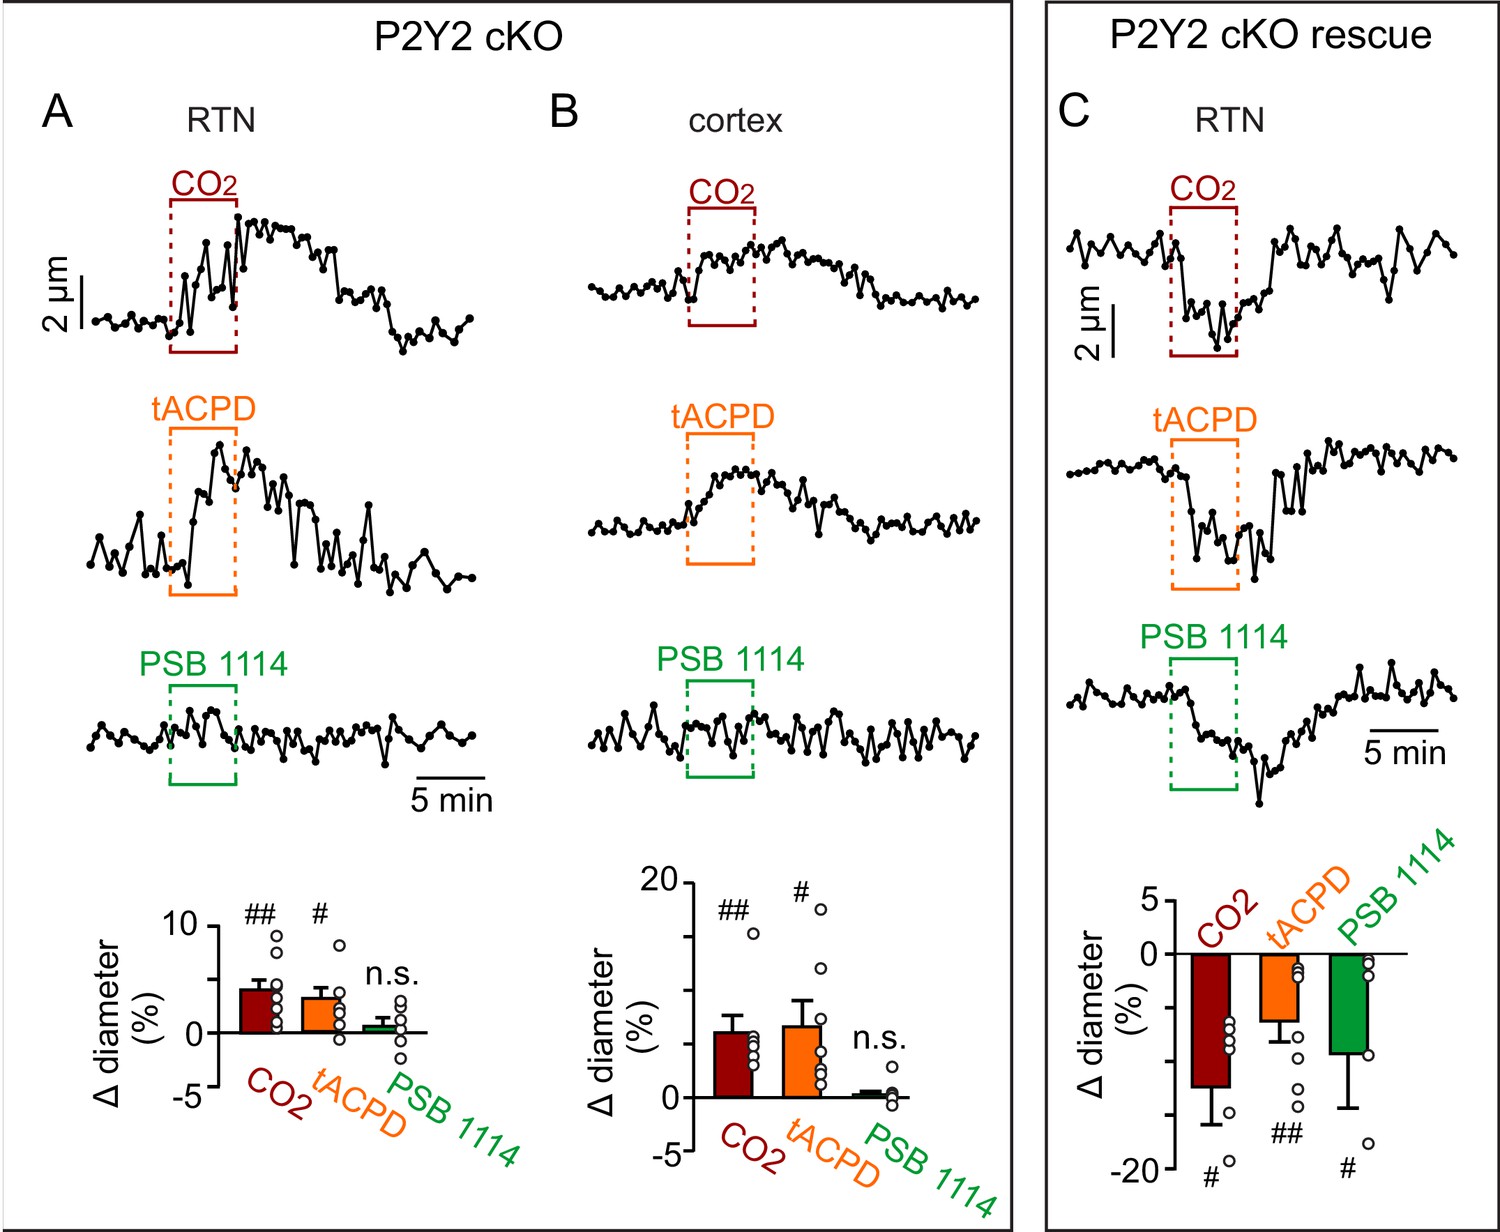
Functional characterization of RTN and cortical arterioles in slices from P2Y2 cKO mice.
(A-B) Diameter traces of individual arterioles and summary data (bottom) show that vessels from the RTN (A) and cortex (B) in slices from P2Y2 cKO mice respond similarly to 15% CO2 and t-ACPD (50 μM). As expected, vessels from each region in slices from P2Y2 cKO mice failed to respond to bath application of the P2Y2 agonist PSB 1114 (200 nM). (C) RTN arterioles in slices from P2Y2 cKO mice 2 weeks after AAV2-Myh11p-eGFP-2A-mP2ry2 was injected bilaterally into the RTN (P2Y2 cKO rescue) constrict in response to 15% CO2, t-ACPD and PSB 1114 in a manner similar to vessels from control mice (Figure 1C). ##, different from baseline (paired two-tailed t-test; p<0.0001).
Figure 4—figure supplement 5
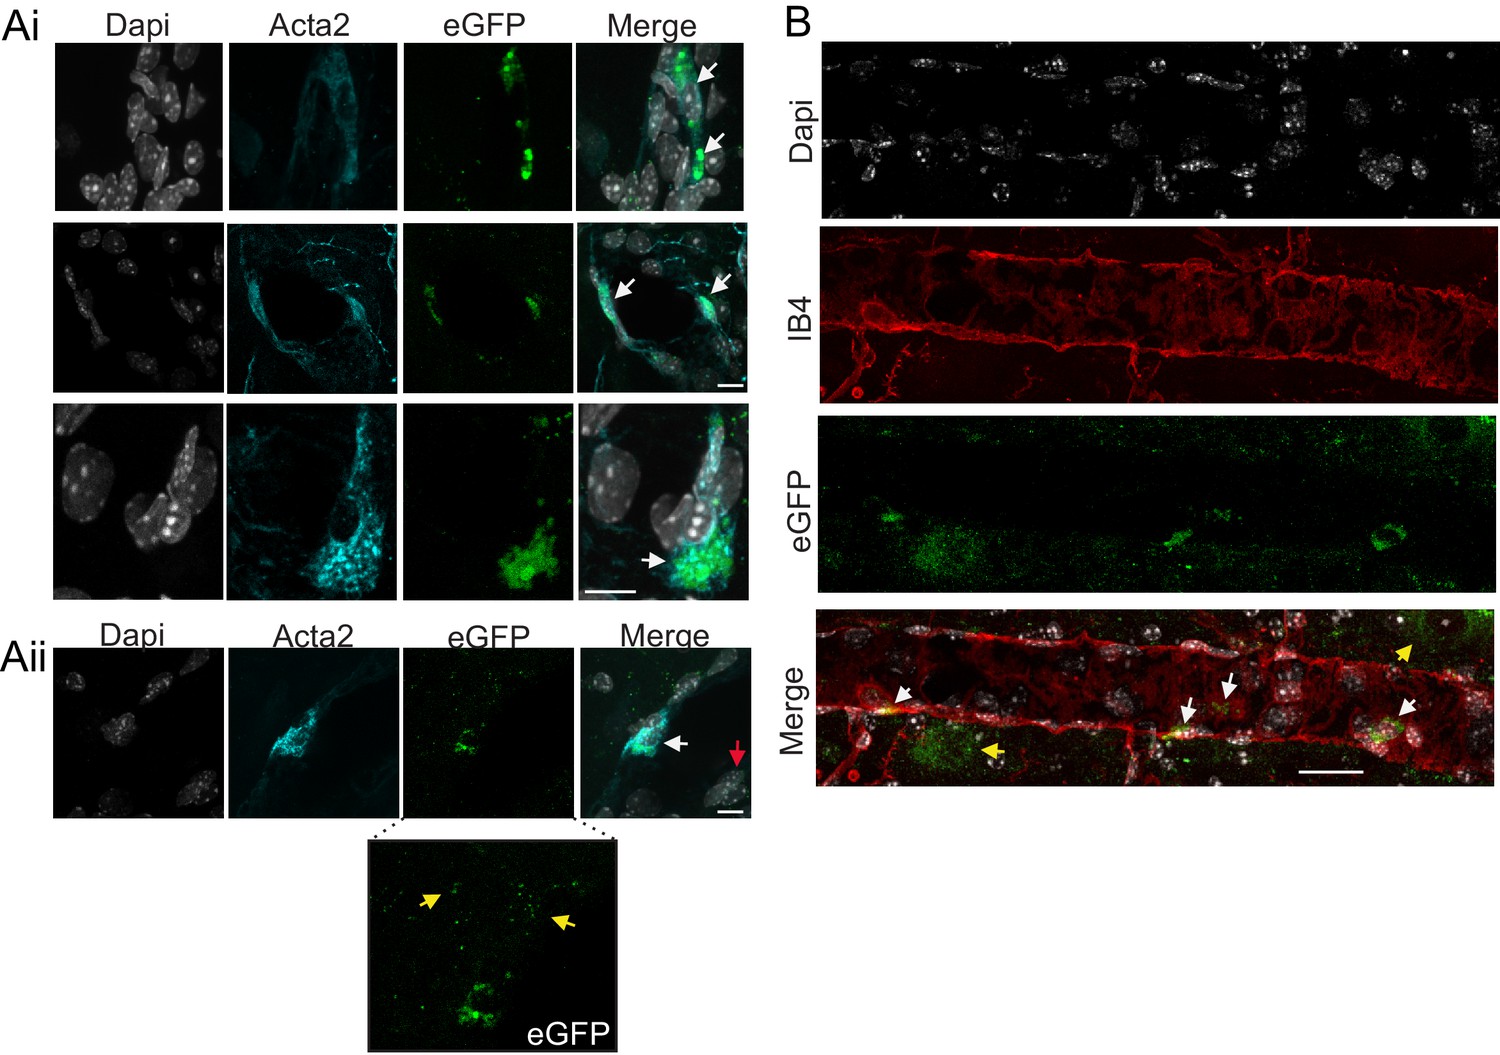
Cell specificity of AAV2-Myh11p-eGFP-2A-mP2ry2 transduction.
Histological analysis was performed on brainstem sections collected from P2Y2 cKO mice two weeks after bilateral RTN injections of AAV2-Myh11p-eGFP-2A-mP2ry2. (Ai) Example images of virally transduced (eGFP driven by Myh11 promoter) smooth muscle cells counterstained with alpha smooth muscle actin 2 (Acta2; cyan). Overlapping Acta2 and eGFP localization represents positive smooth muscle cell transduction. 4’,6-diamidino-2-phenylindole dihydrochloride (DAPI; white) was used to visualize non-transfected negative cells. (Aii) Example images of a transduced smooth muscle cell. Some small eGFP green puncta are also observed in a DAPI-positive but Acta2-negative cell (red arrow). Inset, shows eGFP puncta not co-localized with DAPI (yellow arrows). (B) Sagittal view of an arteriole in the RTN with four eGFP labeled smooth muscle cells and some eGFP puncta not co-localized with DAPI (yellow arrows). Scale bars 20 µm.
Tables
Table 1
Respiratory parameters in control (TaglnCre only and P2ry2f/f only), P2Y2 cKO (TaglnCre::P2ry2f/f) and P2Y2 rescue animals 2 weeks after bilateral RTN injections of AAV2-Myh11p-eGFP-2A-mP2ry2.
No significant differences were observed (p>0.05).
| TaglnCre only, P2ry2f/f only | P2Y2 cKO | |
|---|---|---|
| Frequency (breaths/min) | 163.4 ± 7.1 | 149.8 ± 7.2 |
| Tidal volume (mL/g x 10−3) | 6.8 ± 0.4 | 6.7 ± 0.5 |
| Minute ventilation (mL/min/g) | 1.1 ± 0.1 | 1.0 ± 0.1 |
| Systolic blood pressure (mmHg) | 124.2 ± 0.9 | 123.0 ± 1.2 |
| Diastolic blood pressure (mmHg) | 85.5 ± 0.8 | 86.7 ± 1.4 |
| Heart rate (beats/min) | 473.8 ± 3.0 | 465.0 ± 5.0 |
| VO2 (mL/kg/hr) | 4886.5 ± 127.1 | 5067.0 ± 230.4 |
| VCO2 (mL/kg/hr) | 4392.8 ± 101.9 | 4653.8 ± 204.5 |
| Respiratory exchange ratio (RER) | 0.89 ± 0.01 | 0.91 ± 0.01 |
| pH | 7.410 ± 0.005 | 7.406 ± 0.008 |
| pCO2 (mmHg) | 40.1 ± 0.4 | 40.7 ± 0.6 |
| pO2 (mmHg) | 88.3 ± 0.9 | 88.0 ± 0.8 |
Table 2
Cardiorespiratory and metabolic parameters under room air conditions in control and P2Y2 cKO mice.
| A | TaglnCre or P2ry2f/f only | ||
|---|---|---|---|
| Frequency (breaths/minute) | Tidal volume (mL/g x 10−3) | Minute ventilation (mL/min/g) | |
| Room air | 163.4 ± 7.1 | 6.8 ± 0.4 | 1.1 ± 0.1 |
| 0% CO2/100% O2 | 149.1 ± 5.7 | 6.7 ± 0.5 | 1.0 ± 0.1 |
| 3% CO2/97% O2 | 236.6 ± 8.5 **** | 8.7 ± 0.4 **** | 2.1 ± 0.1 **** |
| 5% CO2/95% O2 | 306.0 ± 9.4 **** | 12.9 ± 0.6 **** | 4.0 ± 0.3 **** |
| 7% CO2/93% O2 | 351.6 ± 9.8 **** | 17.1 ± 1.4 **** | 6.0 ± 0.3 **** |
| B | P2Y2 cKO | ||
| Frequency (breaths/minute) | Tidal volume (mL/g x 10−3) | Minute ventilation (mL/min/g) | |
| Room air | 149.8 ± 7.2 | 6.7 ± 0.5 | 1.0 ± 0.1 |
| 0% CO2/100% O2 | 130.1 ± 7.4 | 7.1 ± 0.3 | 0.9 ± 0.1 |
| 3% CO2/97% O2 | 213.7 ± 6.5 **** | 8.0 ± 0.3 | 1.7 ± 0.1 ** |
| 5% CO2/95% O2 | 256.2 ± 9.6 ### **** | 10.4 ± 0.4 #### **** | 2.7 ± 0.2 #### **** |
| 7% CO2/93% O2 | 291.3 ± 7.5 #### **** | 13.3 ± 0.5 #### **** | 3.9 ± 0.1 #### **** |
| C | P2Y2 cKO rescue | ||
| Frequency (breaths/minute) | Tidal volume (mL/g x 10−3) | Minute ventilation (mL/min/g) | |
| Room air | 156.3 ± 9.0 | 5.6 ± 0.1 | 0.9 ± 0.2 |
| 0% CO2/100% O2 | 158.3 ± 12.8 | 6.8 ± 0.1 | 1.1 ± 0.3 |
| 3% CO2/97% O2 | 254.0 ± 6.2 ## **** | 9.5 ± 0.1 *** | 2.4 ± 0.3 **** |
| 5% CO2/95% O2 | 305.1 ± 9.8 #### **** | 14.0 ± 0.1 ## **** | 4.3 ± 0.4 #### **** |
| 7% CO2/93% O2 | 335.6 ± 4.1 ### **** | 17.0 ± 0.2 ### **** | 5.7 ± 0.6 #### **** |
-
*,difference from 0% CO2; #, differences between genotypes under an experimental condition (two-way ANOVA with Tukey's multiple comparison test). Two symbols = p < 0.01, three symbols = p < 0.001, four symbols = p < 0.0001.
Key resources table
| Reagent type (species) or resource | Designation | Source or reference | Identifiers | Additional information |
|---|---|---|---|---|
| Strain, strain background (M. musculus, Tie2-Cre, C57BL6/J background) | B6.Cg-Tg(Tek-cre) 1Ywa/J | Jackson Laboratories | RRID:IMSR_JAX:008863 | |
| Strain, strain background (M. musculus, smMHC-Cre/eGFP, C57BL6/J background) | B6.Cg-Tg(Myh11-cre,-EGFP)2Mik/J Mus musculus | Jackson Laboratories | RRID:IMSR_JAX:007742 | |
| Strain, strain background (aSM22-Cre, C57BL6/J background) | B6.Cg-Tg(Tagln-cre)1Her/J Mus musculus | Jackson Laboratories | RRID:IMSR_JAX:017491 | |
| Strain, strain background (TdTomato reporter Ai14, C57BL6/J background) | B6.Cg-Gt(ROSA)26Sortm9(CAG-tdTomato)Hze/J Mus musculus | Jackson Laboratories | RRID:IMSR_JAX:007909 | |
| Strain, strain background (P2ry floxed, C57BL6/J background) | P2ry2f/f Mus musculus | PMID:27856454 | Gifted by Dr. Cheike Seye (Indiana Univ.) | |
| Transfected construct (M. musculus) | AAV2-Myh11p-eGFP-2A-mP2ry2 | This paper | Custom AAV product from Vector Biolabs | |
| Transfected construct (M. musculus) | AAV2-Myh11p-eGFP | This paper | Custom AAV product from Vector Biolabs | |
| Genetic reagent (TaKaRa TaqTM DNA Polymerase) | Taq polymerase | Promega | R001A | |
| Antibody | (mouse monoclonal) anti-α smooth muscle actin | Sigma | A5228 | (1:100 dilution) |
| Sequence-based reagent | Taqman probe Gapdh | ThermoFisher | Mm99999915_g1 | |
| Sequence-based reagent | Taqman probe Rbfox3 | ThermoFisher | Mm01248771_m1 | |
| Sequence-based reagent | Taqman probe Aldh1l1 | ThermoFisher | Mm03048957_m1 | |
| Sequence-based reagent | Taqman probe Acta2 | ThermoFisher | Mm00725412_s1 | |
| Sequence-based reagent | Taqman probe Flt1 | ThermoFisher | Mm00438980_m1 | |
| Sequence-based reagent | Taqman probe P2rx1 | ThermoFisher | Mm00435460_m1 | |
| Sequence-based reagent | Taqman probe P2rx2 | ThermoFisher | Mm00462952_m1 | |
| Sequence-based reagent | Taqman probe P2rx3 | ThermoFisher | Mm00523699_m1 | |
| Sequence-based reagent | Taqman probe P2rx4 | ThermoFisher | Mm00501787_m1 | |
| Sequence-based reagent | Taqman probe P2rx5 | ThermoFisher | Mm00473677_m1 | |
| Sequence-based reagent | Taqman probe P2rx6 | ThermoFisher | Mm00440591_m1 | |
| Sequence-based reagent | Taqman probe P2rx7 | ThermoFisher | Mm01199500_m1 | |
| Sequence-based reagent | Taqman probe P2ry1 | ThermoFisher | Mm02619947_s1 | |
| Sequence-based reagent | Taqman probe P2ry2 | ThermoFisher | Mm02619978_s1 | |
| Sequence-based reagent | Taqman probe P2ry4 | ThermoFisher | Mm00445136_s1 | |
| Sequence-based reagent | Taqman probe P2ry6 | ThermoFisher | Mm02620937_s1 | |
| Sequence-based reagent | Taqman probe P2ry12 | ThermoFisher | Mm01950543_s1 | |
| Sequence-based reagent | Taqman probe P2ry13 | ThermoFisher | Mm01950543_s1 | |
| Sequence-based reagent | Taqman probe P2ry14 | ThermoFisher | Mm01952477_s1 | |
| Chemical compound, drug | Papain | Sigma | P4762 | |
| Chemical compound, drug | 1,4-Dithioerythritol | Sigma | D8255 | |
| Chemical compound, drug | Collagenase IV | ThermoFisher | 1714019 | |
| Chemical compound, drug | Bovine Serum Albumin | Sigma | A2153 | |
| Chemical compound, drug | Trypsin Inhibitor | Sigma | T9253 | |
| Chemical compound, drug | U46619 | Tocris | 1932 | |
| Chemical compound, drug | Trans-ACPD | Tocris | 0187 | |
| Chemical compound, drug | AR-C 118925XX | Tocris | 4890 | |
| Chemical compound, drug | PSB 1114 | Tocris | 4333 | |
| Chemical compound, drug | POM 1 | Tocris | 2689 | |
| Chemical compound, drug | 1,3-dimethyl-8-phenyl-xantine (8-PT) | Sigma | P2278 | |
| Chemical compound, drug | Prostaglandin E2 | Cayman Chemical | 14010 | |
| Chemical compound, drug | L-798, 106 | Cayman Chemical | 11129 | |
| Chemical compound, drug | Papaverine | Sigma | P3510 | |
| Chemical compound, drug | Diltiazem | Tocris | 0685 | |
| Commercial assay, kit | Taqman Gene Expression Cells-to-CT kit | ThermoFisher | AM1728 | |
| Commercial assay, kit | Taqman Fast Advanced Master Mix | ThermoFisher | 4444557 | |
| Software, algorithm | ImageJ | NIH | RRID:SCR_003070 | Version 2.0.0 |
| Software, algorithm | Macro (for vessel analysis) | PMID:28387198 | ||
| Software, algorithm | Ponemah | DSI | RRID:SCR_017107 | Version 5.23 |
| Software, algorithm | QuantStudio Design and Analysis | ThermoFisher | RRID:SCR_018712 | Version 1.5.1 |
| Software, algorithm | Prism 7 | GraphPad | RRID:SCR_011323 | Version 7.03 |
| Other | (Griffonia Simplicifolia Lectin I) isolectin B4, Dylight 594 | Vector Laboratories | SL-1207-.5 | (6 µg/mL dilution) |
Additional files
Download links
A two-part list of links to download the article, or parts of the article, in various formats.
Downloads (link to download the article as PDF)
Open citations (links to open the citations from this article in various online reference manager services)
Cite this article (links to download the citations from this article in formats compatible with various reference manager tools)
Vascular control of the CO2/H+-dependent drive to breathe
eLife 9:e59499.
https://doi.org/10.7554/eLife.59499


