3D virtual pathohistology of lung tissue from Covid-19 patients based on phase contrast X-ray tomography
- Institut für Röntgenphysik, Georg-August-Universität, Germany
- Cluster of Excellence 'Multiscale Bioimaging: from Molecular Machines to Networks of Excitable Cells' (MBExC), University of Göttingen, Germany
- Deutsches Elektronen-Synchrotron (DESY), Germany
- Institut für Medizinische Genetik und Pathologie, Universitätsspital Basel, Switzerland
- Medizinische Hochschule Hannover (MHH), Germany
- Deutsches Zentrum für Lungenforschung (DZL), Germany
Figures
Figure 1
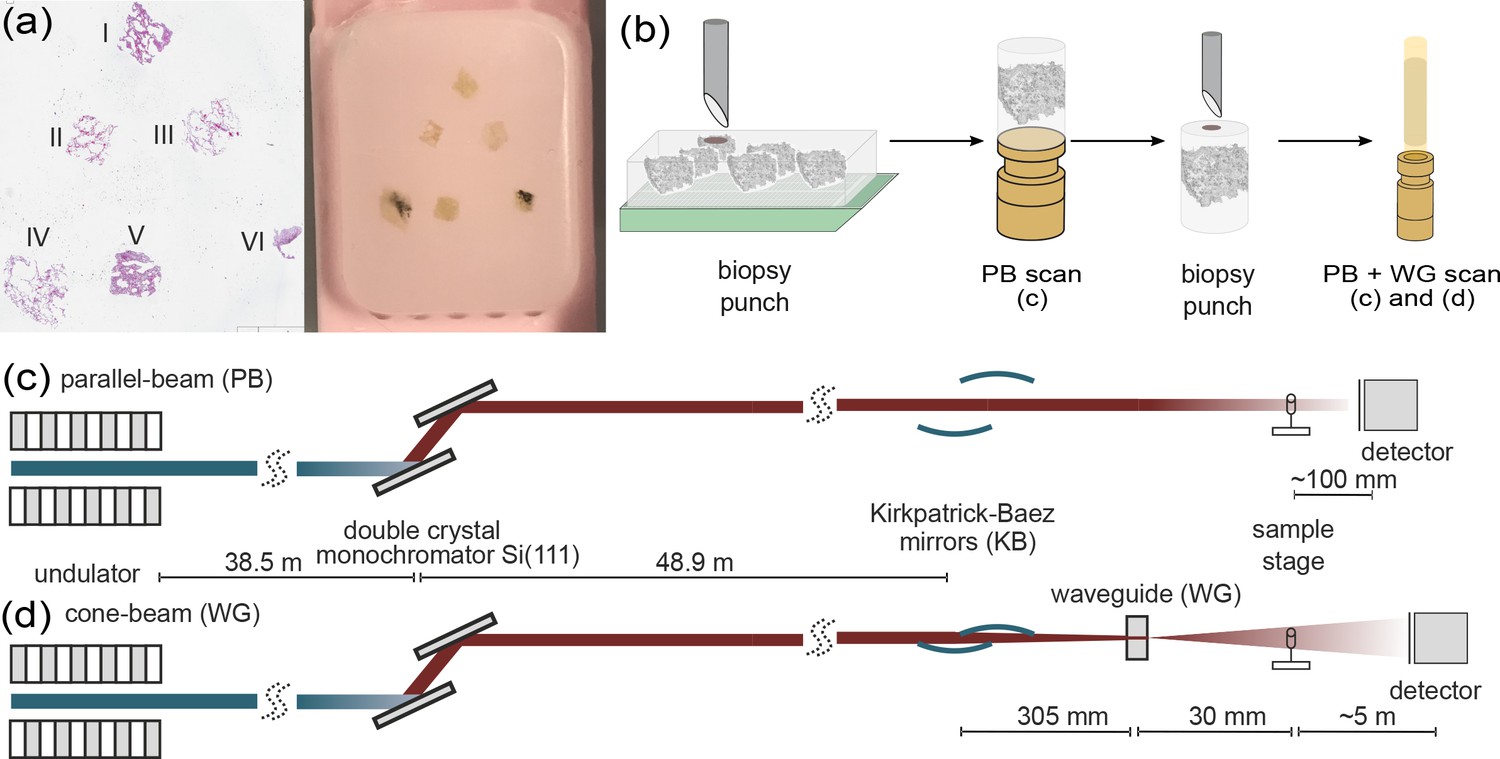
Multi-scale x-ray tomography setup.
(a) HE stain of a tissue micro-array paraffin block with samples of all six patients who succumbed to Covid-19. (b) Schematic representation of the sample preparation and mounting. In a first step biopsy punches containing the entire individual lung tissues are transferred onto a holder for the parallel-beam local tomography acquisition, followed by a further reduction in size to a 1 mm biopsy punch, for cone-beam tomographic recordings. (c) Configuration for parallel-beam tomography. (d) Configuration for cone-beam holo-tomography.
Figure 2
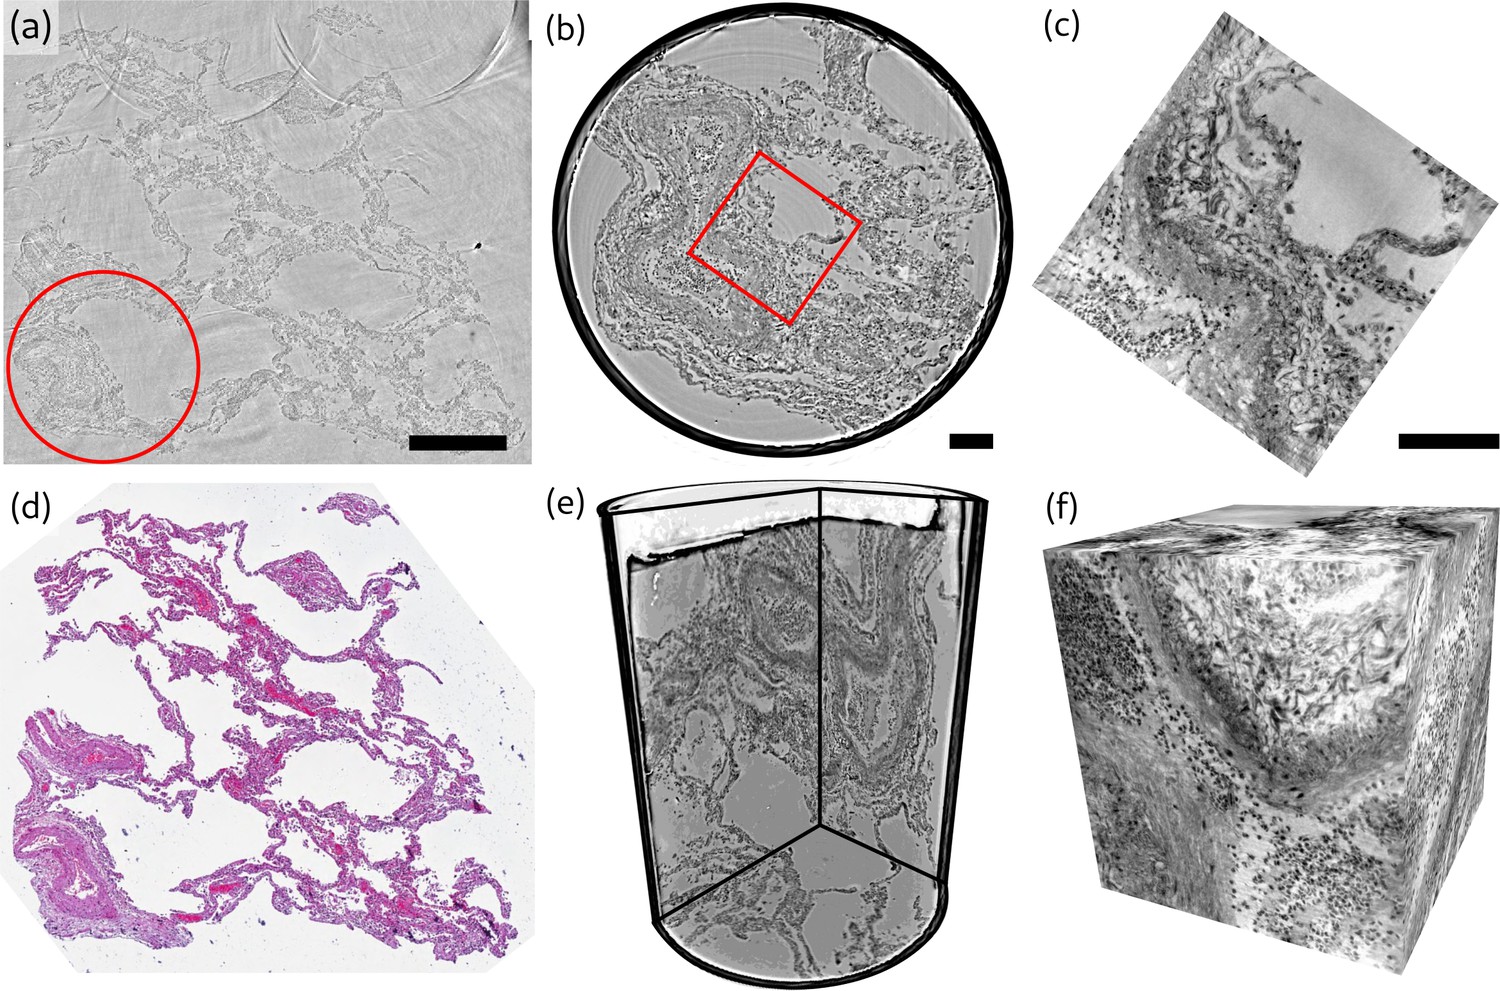
Overview of reconstruction volumes, exemplified for a punch biopsy of pulmonary autopsy sample I.
(a) Virtual section through the stitched reconstruction volume with indicated position for the 1 mm biopsy punch. (b) Virtual section through the reconstruction of the 1 mm biopsy punch volume with indicated position for the cone-beam dataset. (c) Virtual section through the cone beam dataset. (d) Image of an HE-stained histological section, which is in close proximity to the virtual slice in (a). (e) 3D views of the biopsy punch. (f) 3D views of the cone-beam datasets. Scale bars: (a) and (b,c) . The entire reconstruction volume is visualized in Video 1.
Figure 3
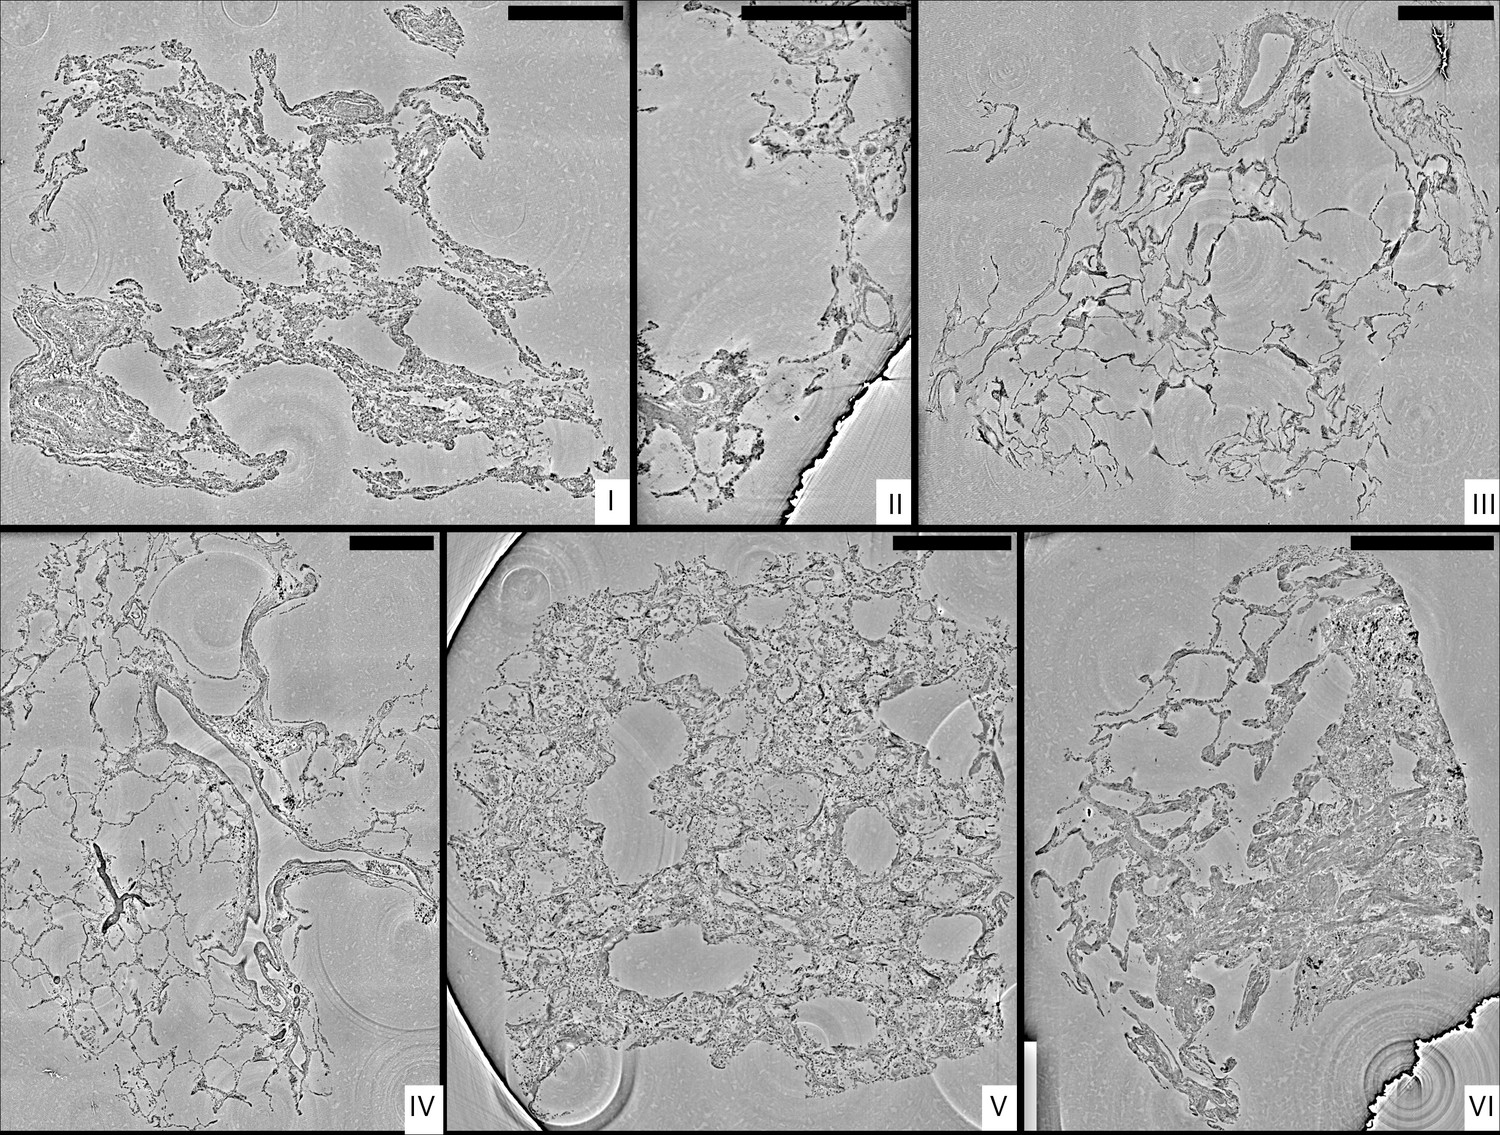
Stitched parallel-beam reconstructions for full pulmonary samples (I–VI).
Representative virtual sections through the reconstruction volumes of full biopsies (I–VI), respectively. Scale bars: .
Figure 4
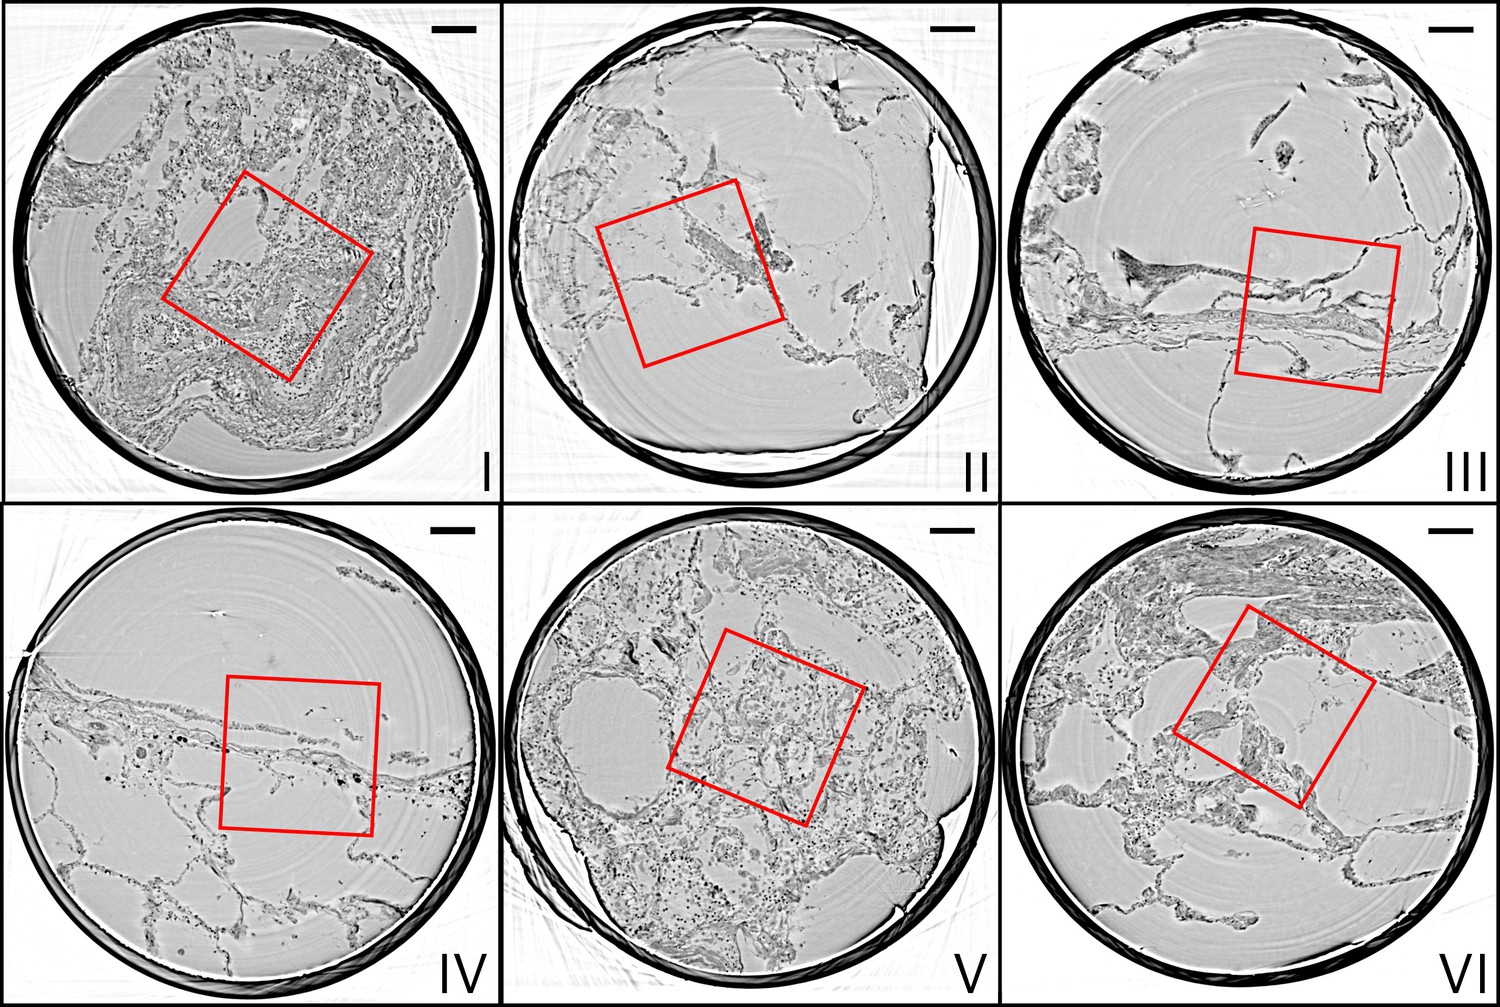
Parallel-beam reconstructions for 1 mm biopsy punches (I–VI).
Representative virtual sections through the reconstruction volumes of the 1 mm punches into the volumes of the full biopsies (I–VI), respectively. The fact that the punches are isolated results in higher image quality, since the errors associated with local tomography are avoided. Scale bars: .
Figure 5
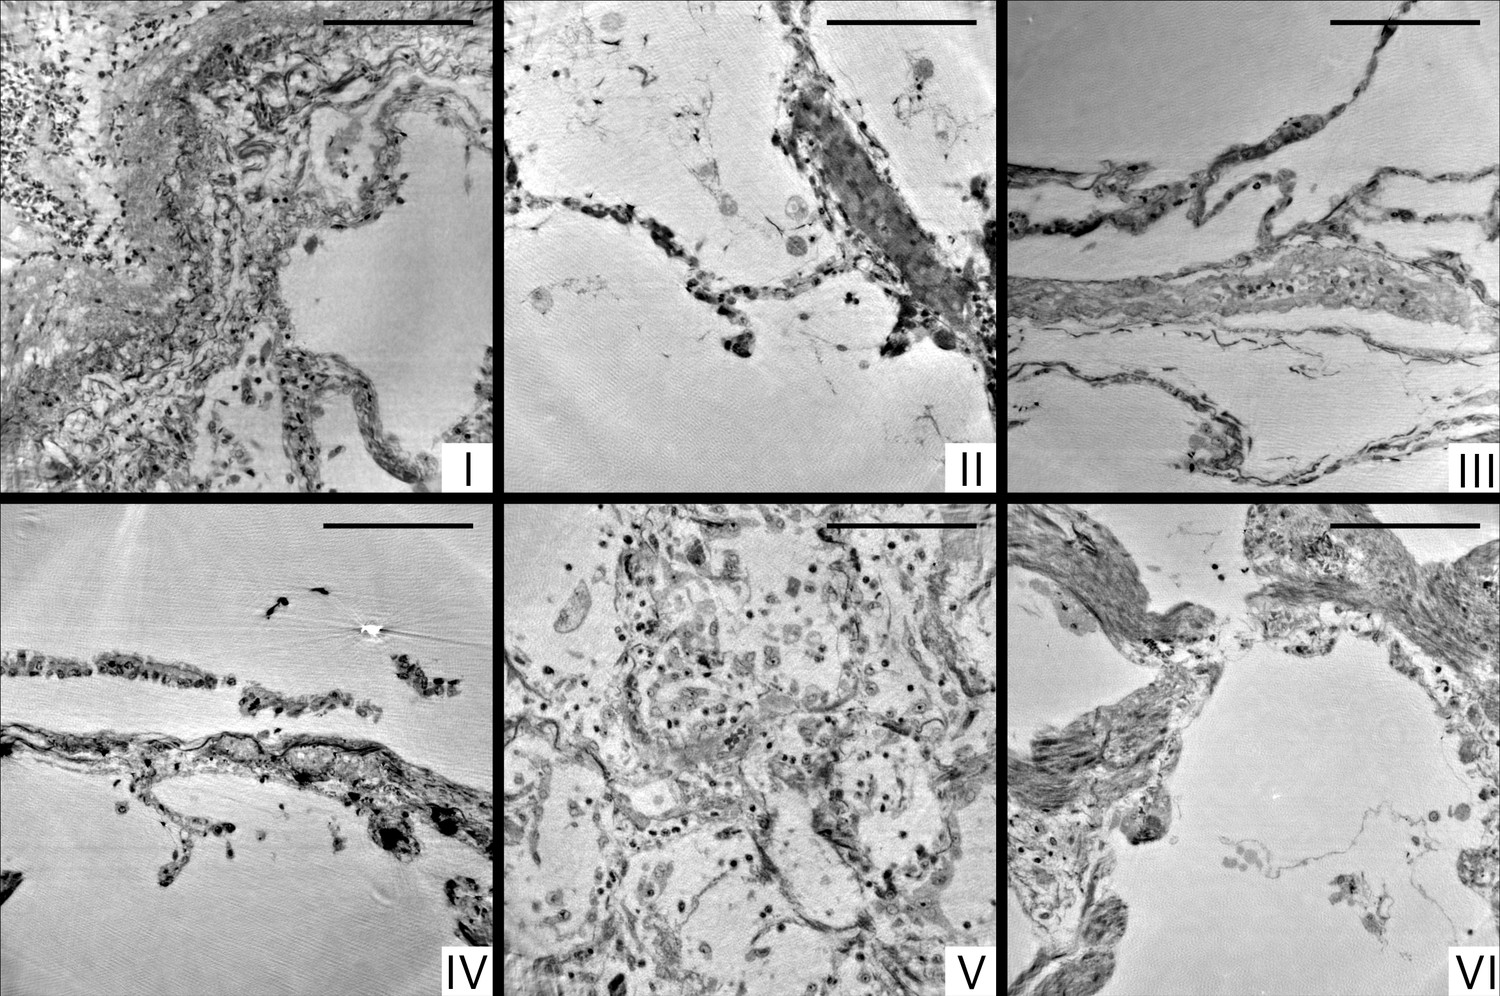
Cone-beam reconstructions for biopsy punches (I–VI), shown for approximately the same slices as in Figure 4 for the parallel beam reconstruction.
Virtual sections through the reconstruction volumes of the cone-beam recordings corresponding to sections in Figure 4, obtained by the parallel beam configuration, for biopsies (I–VI) , respectively. Scale bars: .
Figure 6
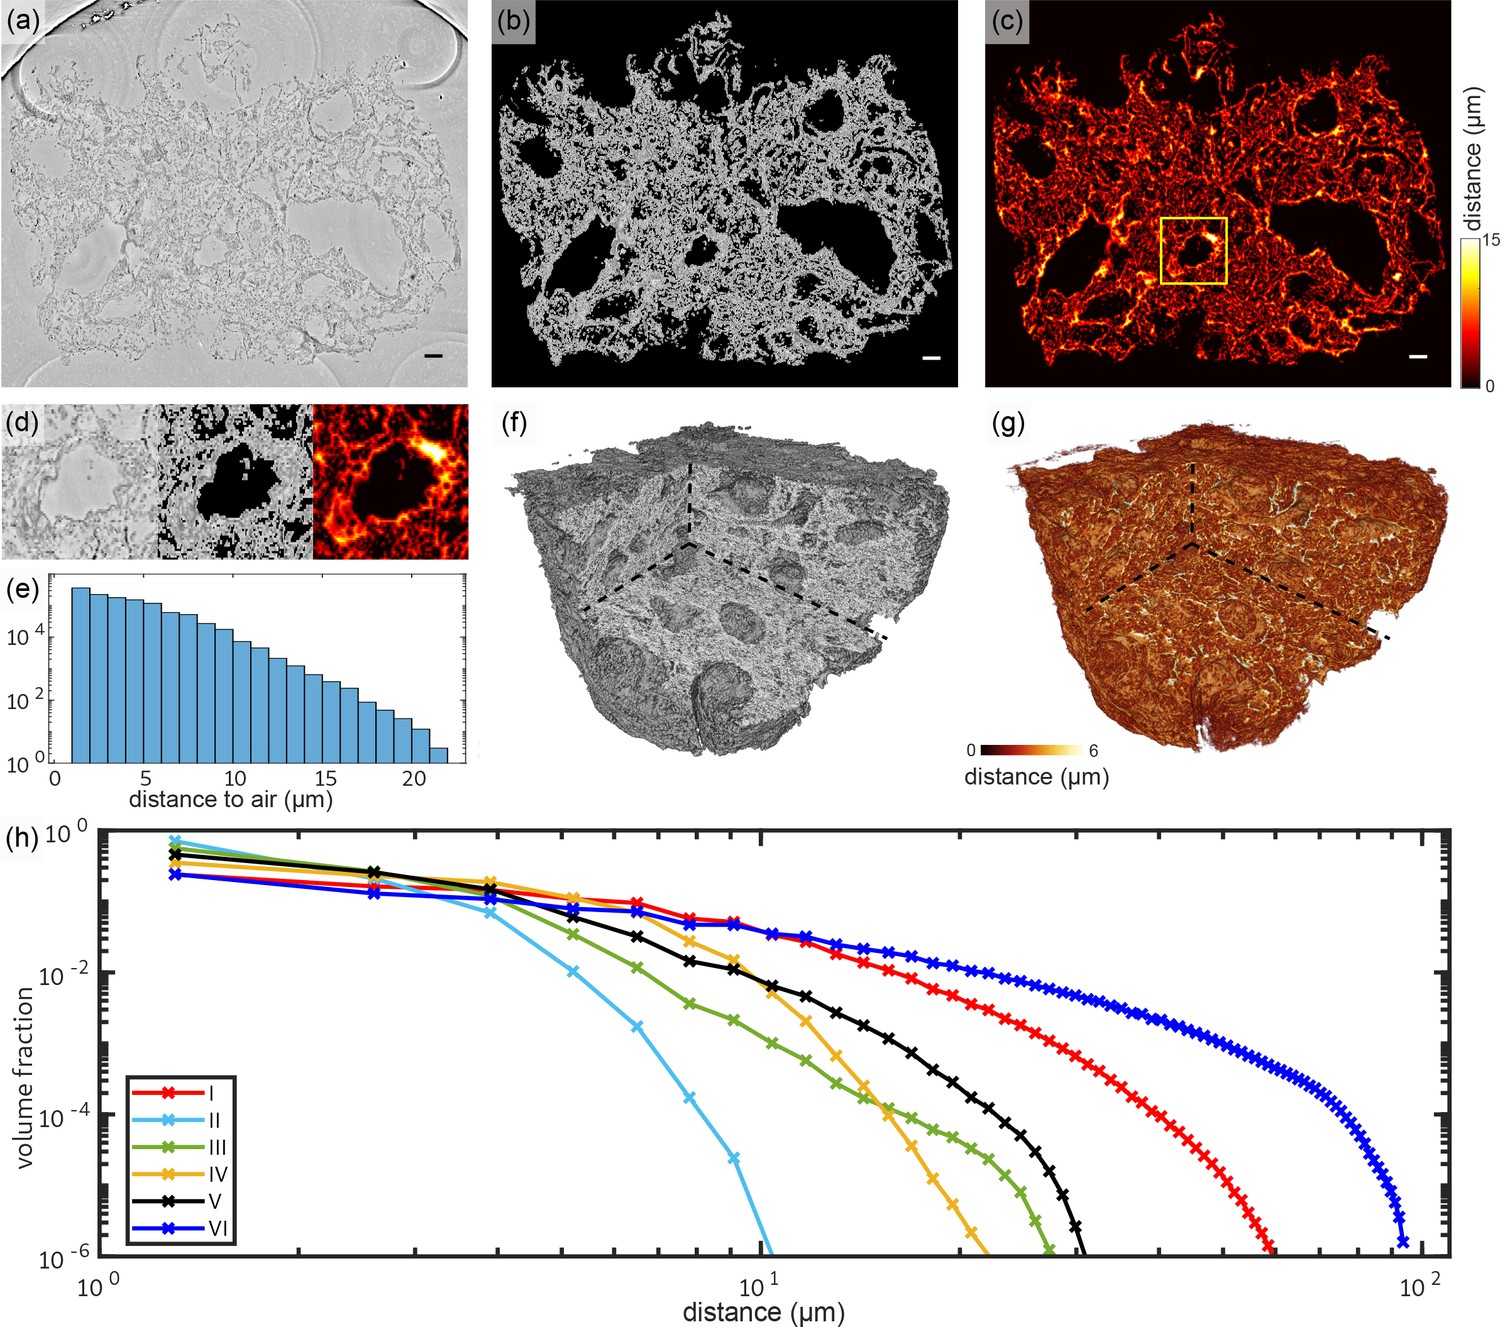
Tissue compactness and distance metrics: The 3D reconstructions of the lung tissue were analyzed in terms of specific surface and characteristic lengths.
The workflow is sketched for sample V in the top part (a–g). In a first step, the tissue was segmented using Ilastik. A slice of the reconstructed electron density is shown in (a). Based on the segmentation, the areas of air which are directly connected and potentially filled with oxygen (or blood) are masked out (b). (c) For each of the remaining tissue voxels the shortest possible distance to air was calculated. Especially around vessels and larger alveoli, the distances are larger. (d) Zoom into an area around a vessel. Further analysis is based on the distance distribution shown in (e). (f) Volume rendering of the reconstructed electron density, with (g) showing the corresponding 3D distance map. (h) Based on the tissue segmentation of all samples, the distance from the tissue interior to the closest air compartment was calculated. In order to compare all samples, the count of voxels was normalized by the total volume of the respective sample. The specific surface area SV (represented by the first value of each curve), the characteristic length Lc and the mean distance for each sample was calculated based on this data. Double logarithmic scale, bin width of the distribution of distances: 1 . Scale bars: (a–c) .
Figure 7
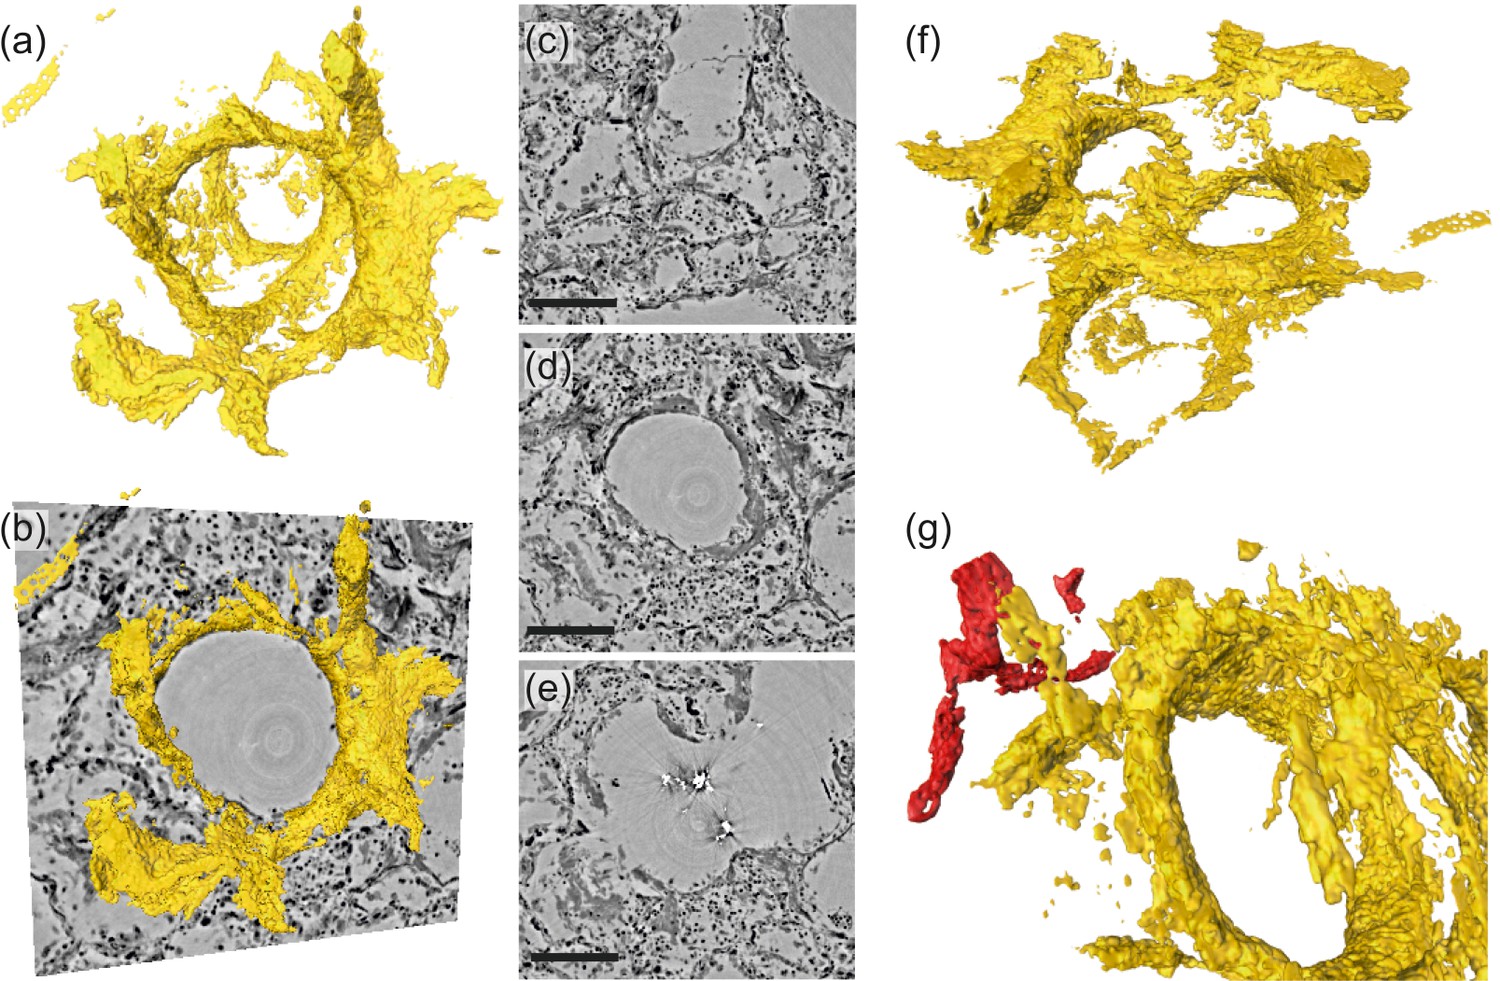
Rendering of hyaline membrane attached to alveolar walls (patient V, parallel beam-scan of a 1 mm punch).
The rendered subvolume was restricted to , to contain a single alveole foremost. (a) Volume rendering of the segmented hyaline membrane in same spatial orientation as (c)-(e), which show virtual slices through the (c) top, (d) center and (e) bottom of the alveole. For a better spatial classification, (b) gives a combination of the volume in (a) and the slice in (d). (f) Volume rendering of the entire subvolume including neighboring alveolae. (g) Zoom-in onto a major blood vessel (red) which is directly connected with the hyaline membrane. Scale bars: (c–e) .
Figure 8
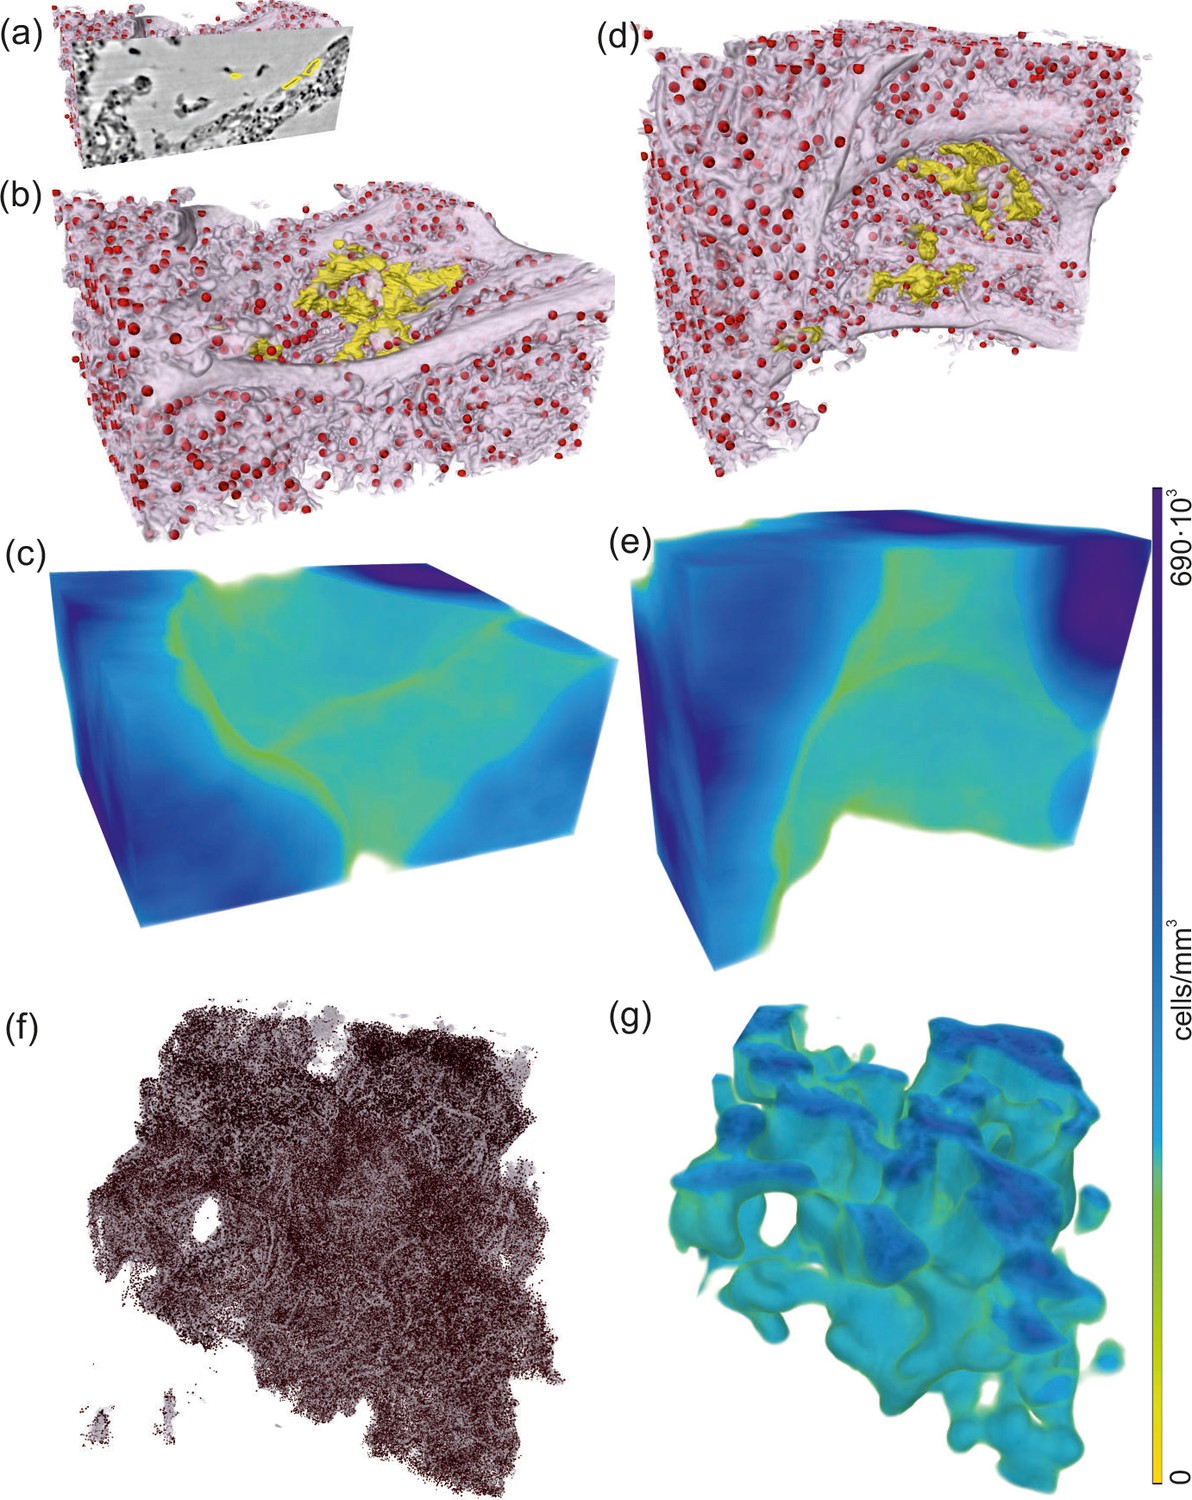
Rendering of alveolar wall with hyaline membrane and quantification of lymphocyte infiltration (unstained tissue, patient I, parallel beam scan of a 1 mm punch).
The illustrations in (a–e) show a subvolume of mm3, (f and g) this concept applied to the full tissue block of mm3. (a) Yellow contours mark the locations of hyaline membrane in an exemplary slice. In same spatial orientation, (b, d and f) volume rendering of soft tissue (light pink), infiltrated by hyaline membrane (yellow) and lymphocytes (red) and (c, e and g) their local cell density among the lung tissue, including air compartments.
Figure 9
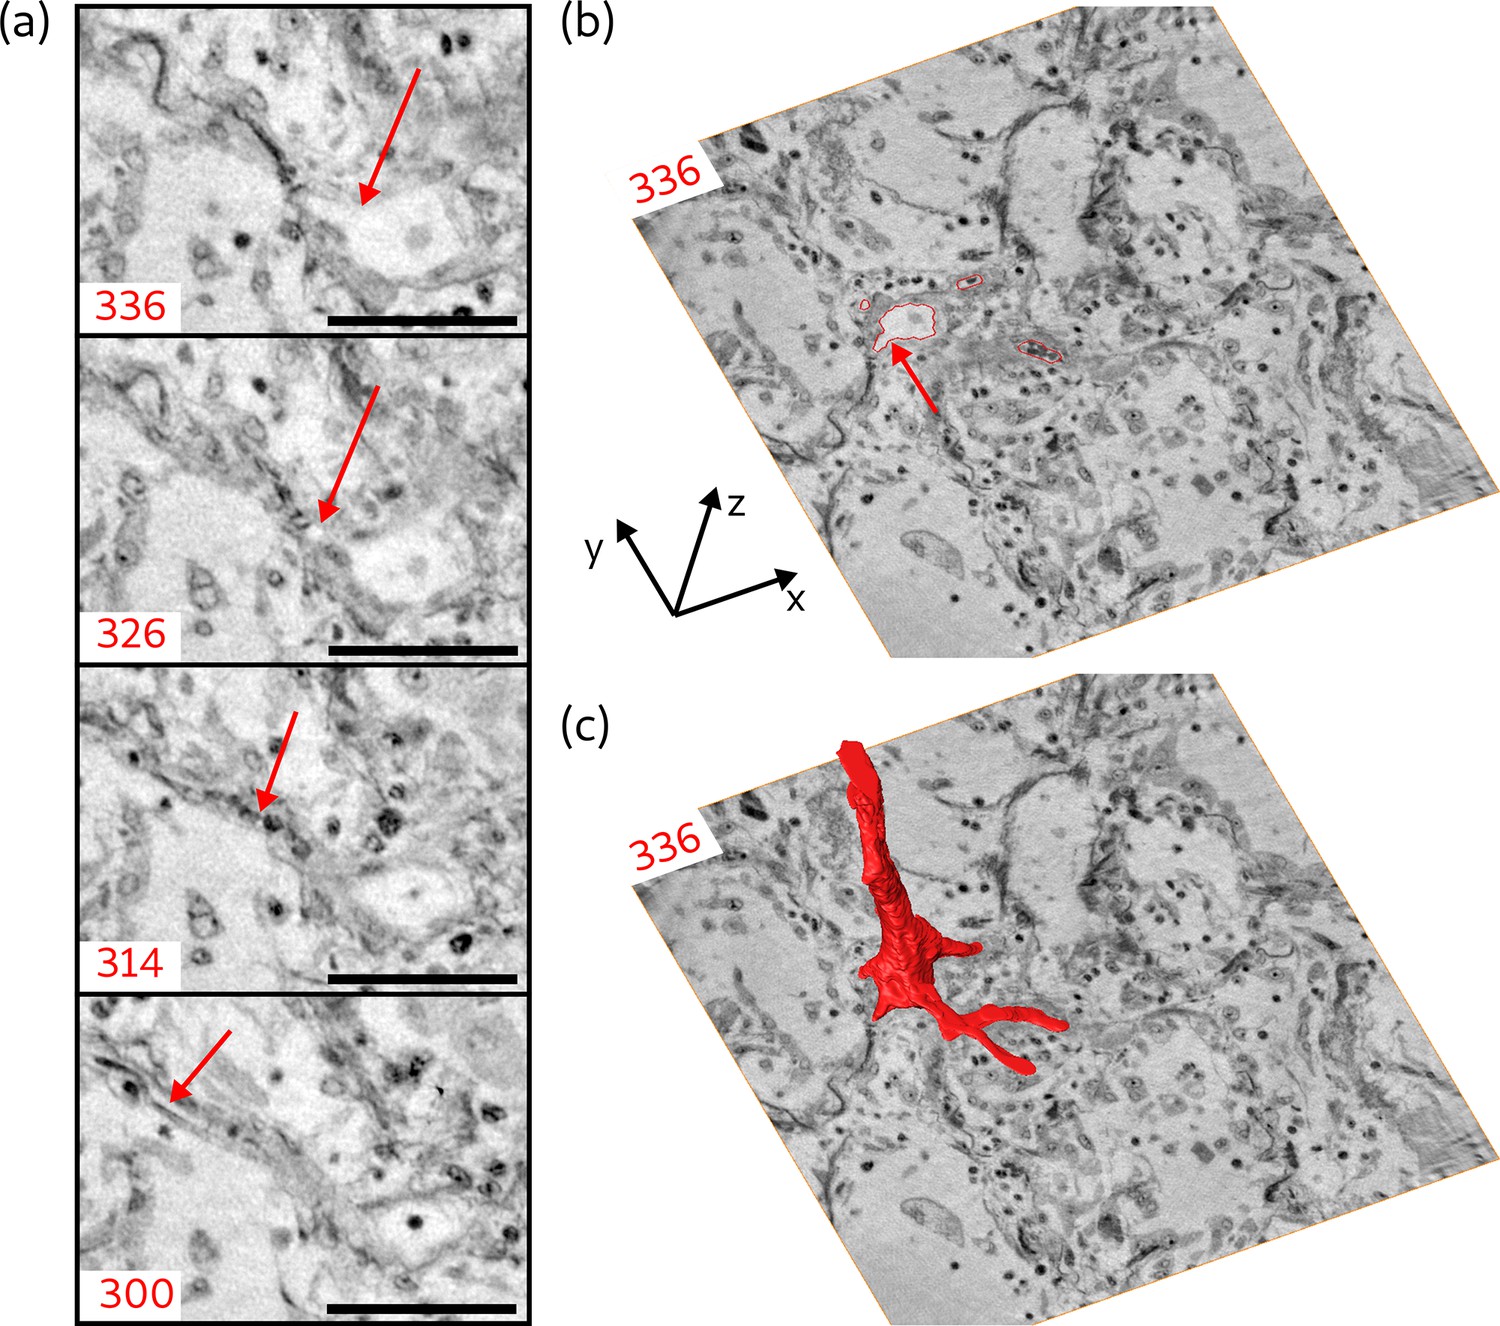
Segmentation of the blood vessel network, exemplified for biopsy (V).
(a) Series of slices in z-direction illustrate the separation of a capillary ( diameter) from a blood vessel. Red arrow marks the separating capillary. In slice 314, the capillary is entirely filled with erythrocytes. (b) Red lines in the entire virtual slice (336) represent the contours of a manual segmentation of the blood vessel network. Three capillaries already separated from the main vessel, while the fourth starts to emerge, indicated by the red arrow. (c) Segmentation illustrating the 3D structure of the blood vessel network. Scale bars: .
Appendix 1—figure 1
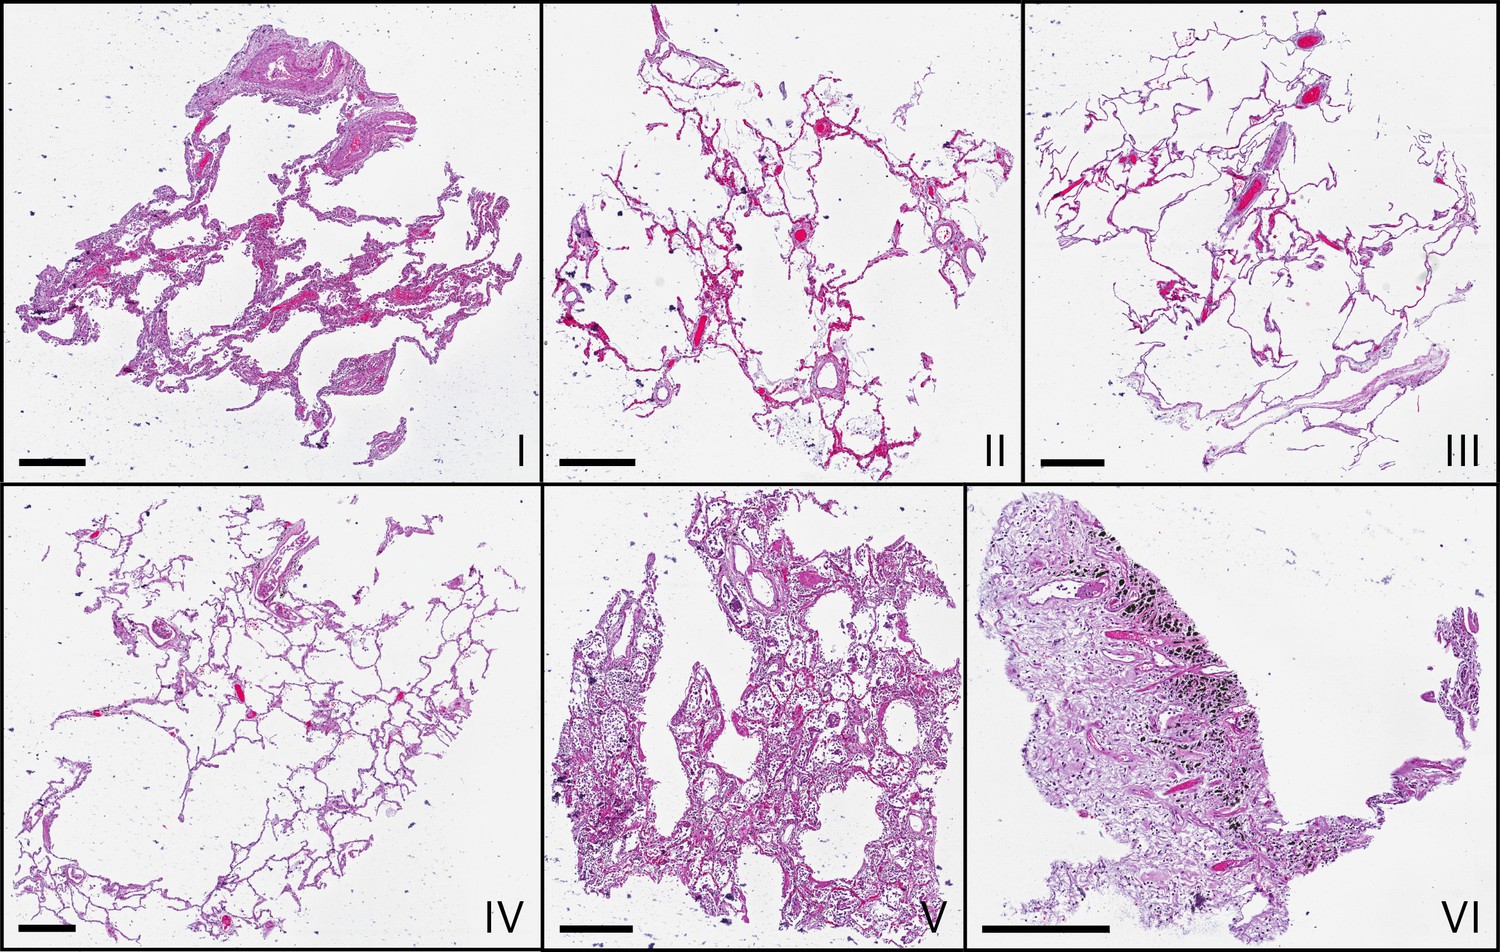
Microscopic images of HE-stained histological sections of all samples (I–VI).
Histological slices show comparable morphologies to the virtual slices in Figure 3, which represent different z-position. Scale bars: .
Appendix 1—figure 2
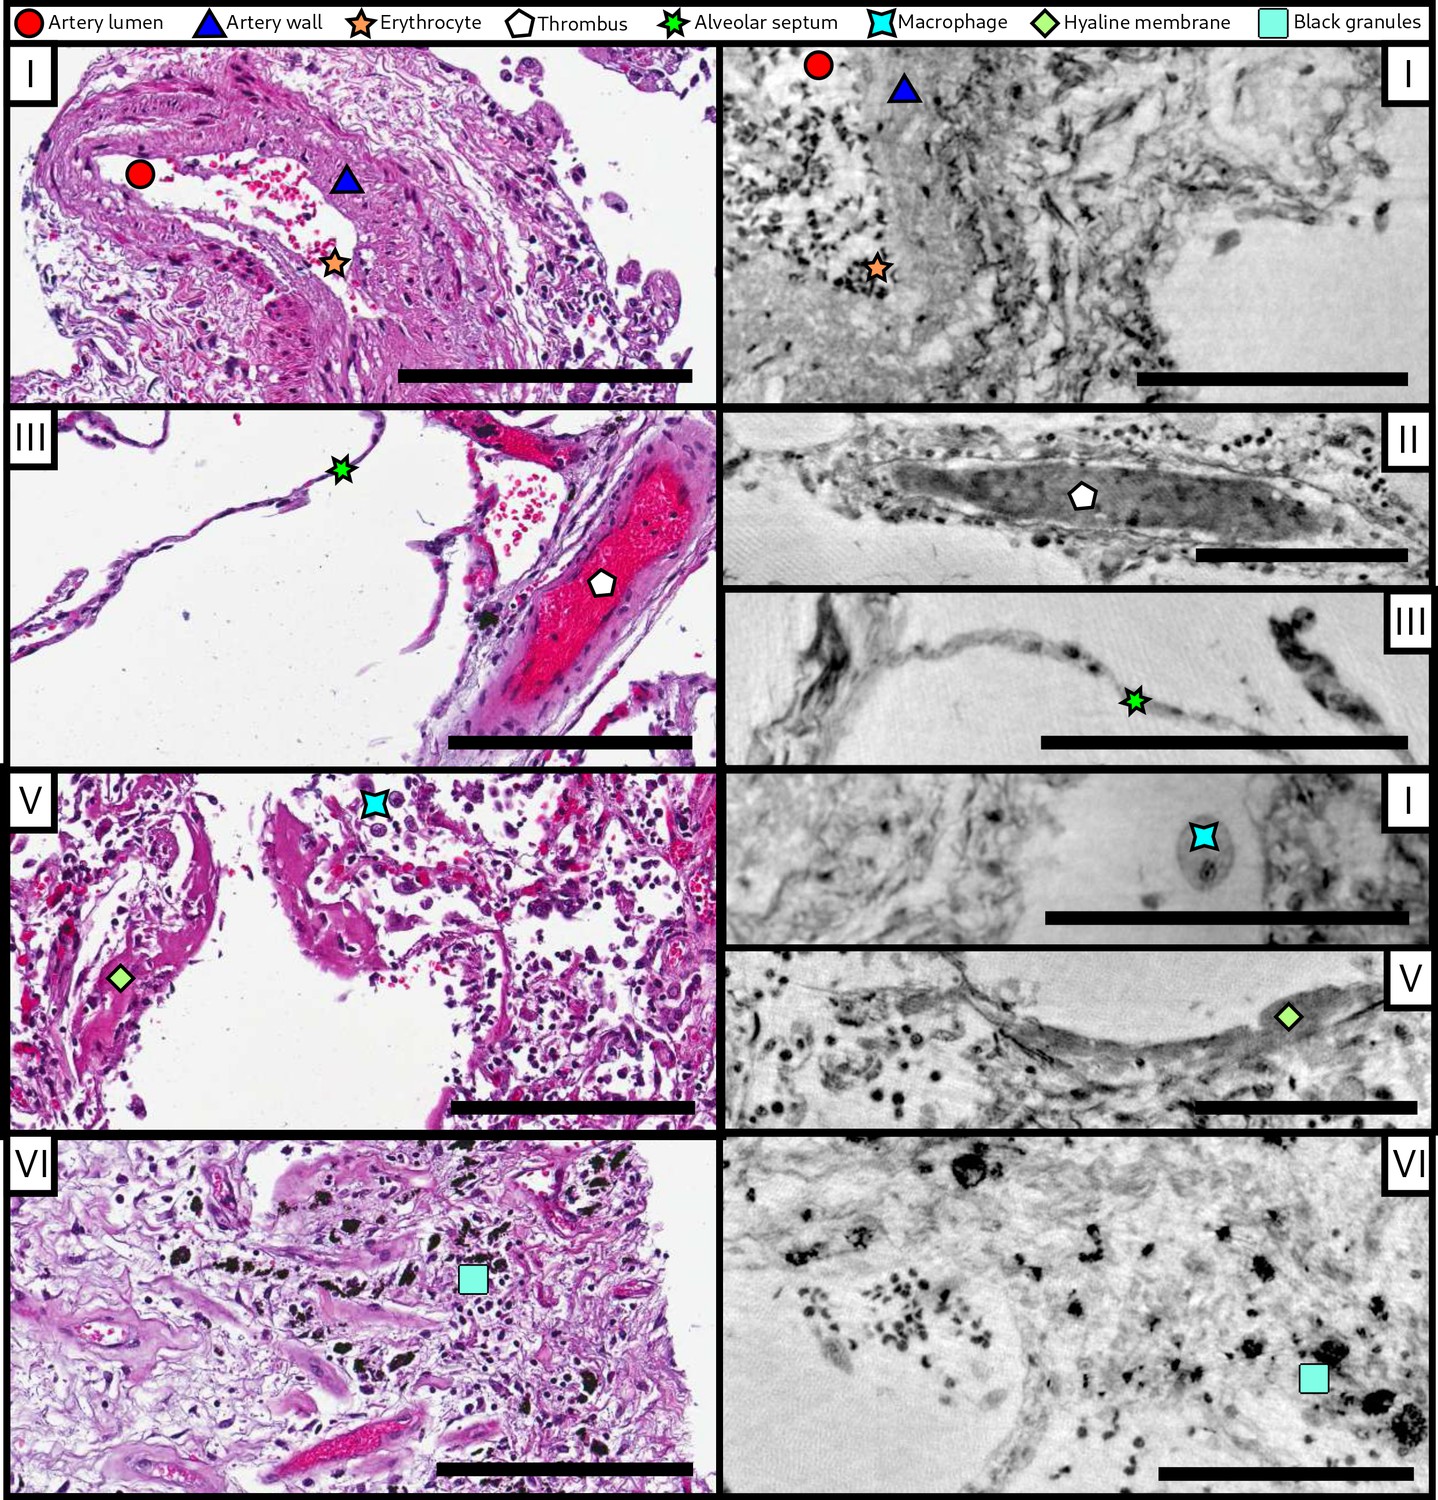
Comparison of morphological features between conventional HE histology and virtual histology.
Artery lumen, artery wall, erythrocytes, thrombus, alveolar septum, macrophage, hyaline membrane and anthracotic pigments (i.e. the black granules) are presented on exemplary slices of different samples (I–VI) for conventional (left) and virtual histology (right). Scale bars: left , right .
Appendix 1—figure 3
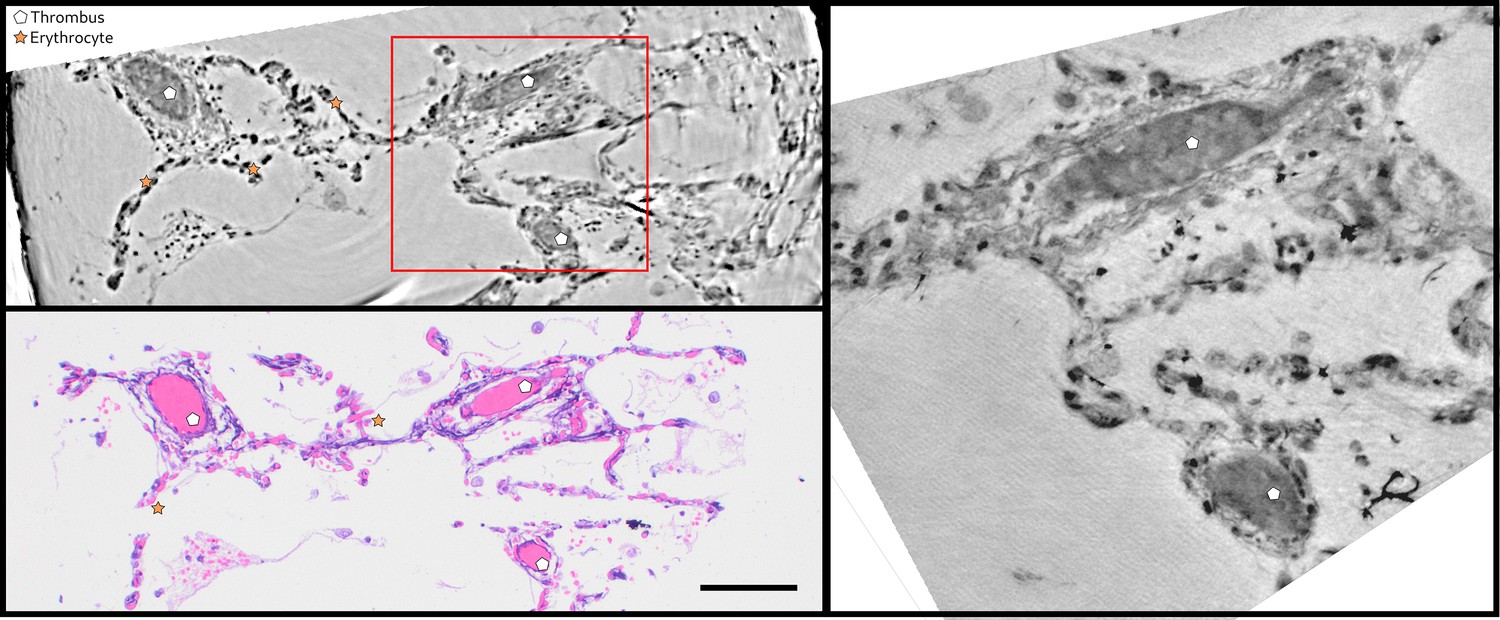
Direct comparison of virtual and HE histology for an identical slice/section.
(top left) Region of interest of the parallel beam tomogram (Sample II). (bottom left) Corresponding HE stained histology slice. Thrombi and erythrocytes can be identified in both imaging modalities. The red square marks the position of the zoom tomogram, for which the corresponding slice is shown on the right. Scale bars: .
Appendix 2—figure 1
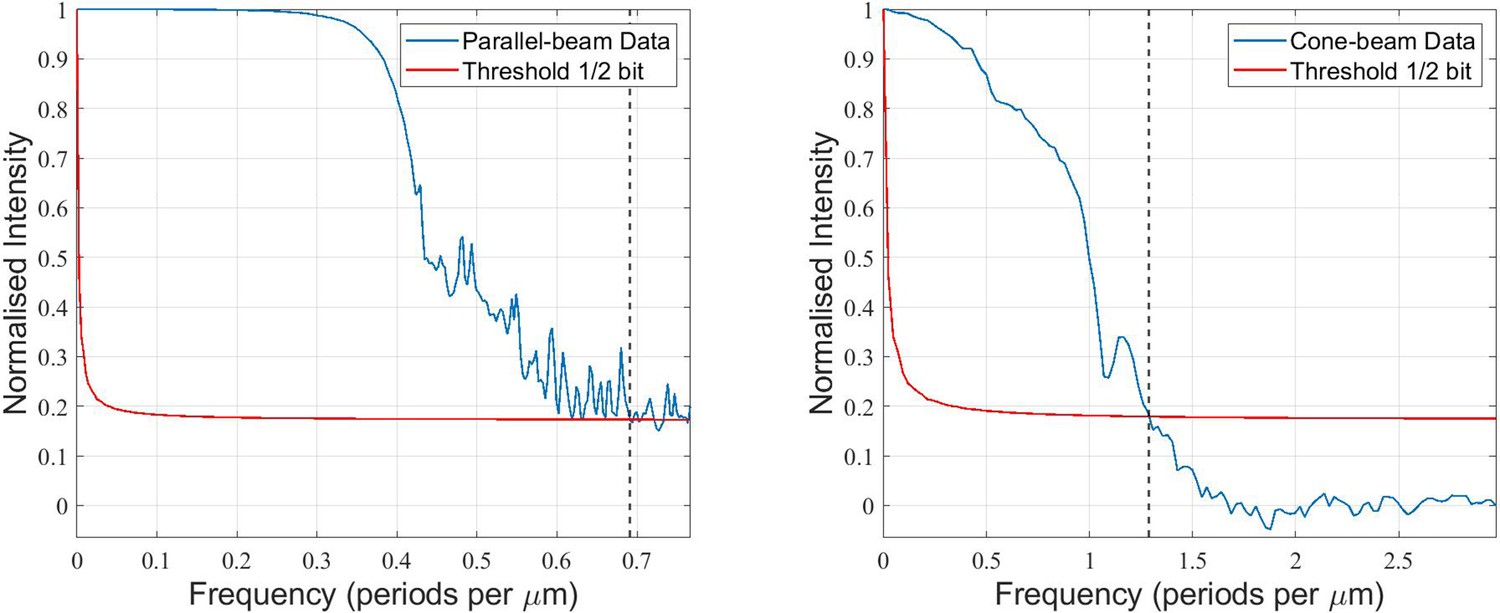
Quantification of the 3D-resolution for the example of sample V.
FSC analysis was carried out for two independent reconstructions, each from half the projections of the scan.
Appendix 3—figure 1
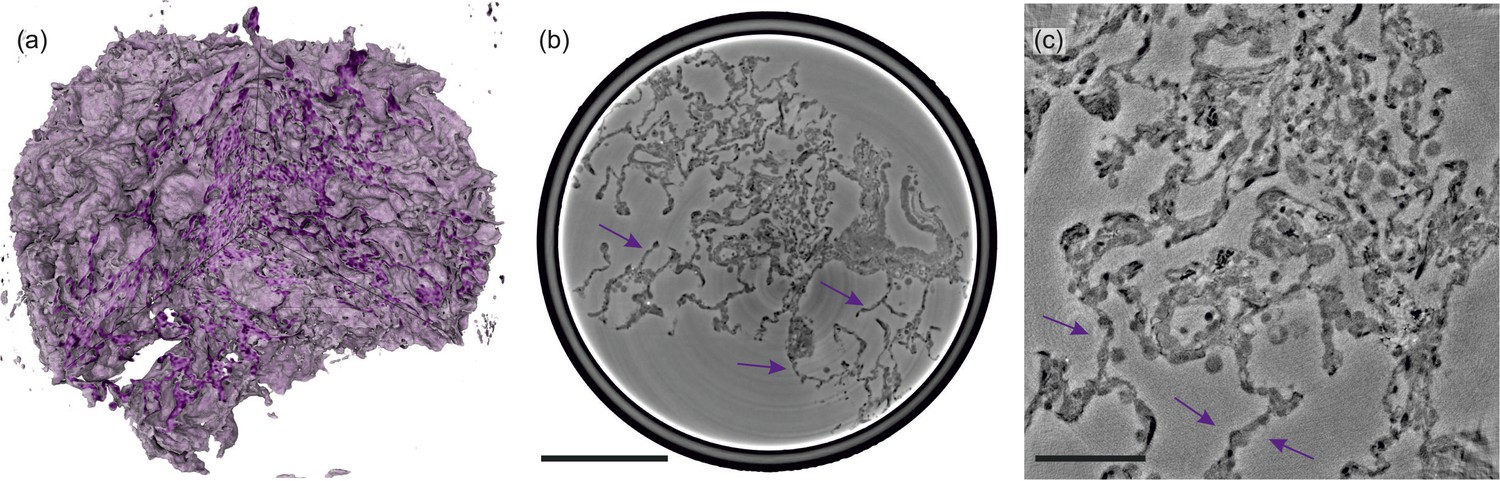
Illustrations of control lung tissue (hydrated).
(a) Volume rendering of the tissue block ( mm3) and (b) slice through the volume, examined in PB-configuration. (c) Slice from the cone-beam scan, arrows indicating the structure of a healthy septum. Particularly, macrophages and erythrocytes emerge. Scale bars: (b) and (c) .
Appendix 3—figure 2
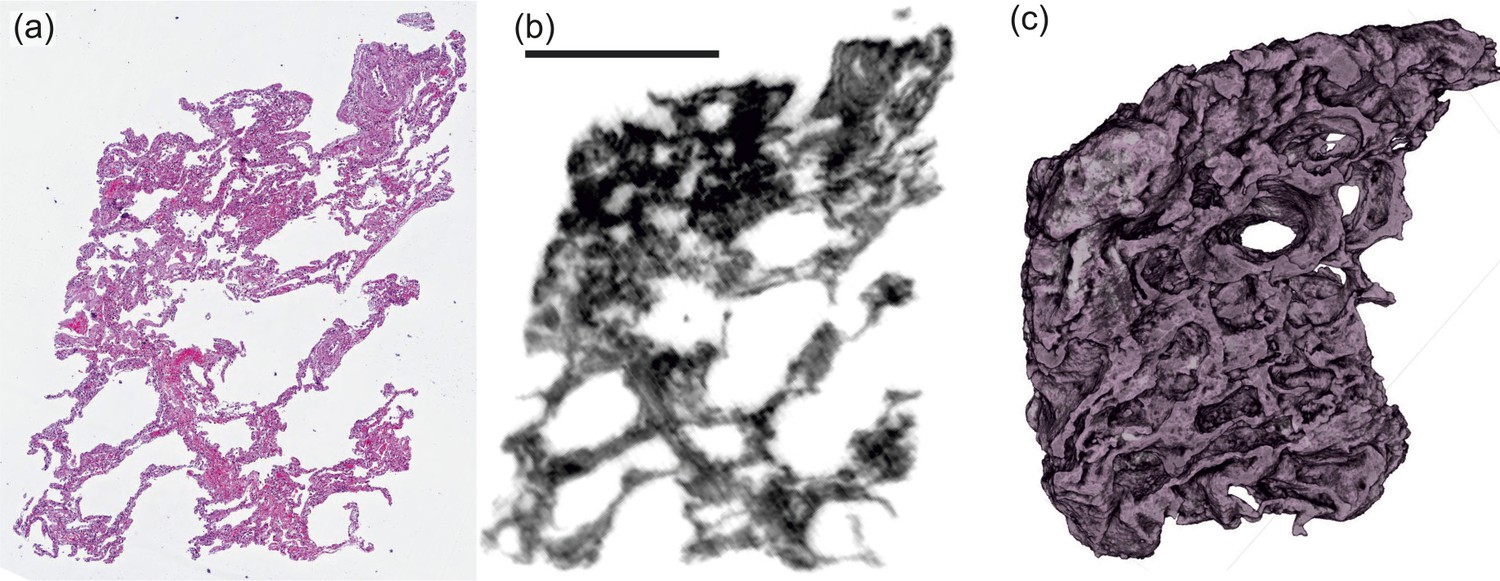
Screening with a laboratory phase-contrast μCT-setup.
(UA-stained tissue block, patient I). (a) Histological and (b) correlative virtual slice from laboratory phase-contrast tomography. (c) Volume rendering of the entire tissue block from a similar perspective. Scale bar: 1 mm.
Videos
Video 1
A video showing a fly-through the reconstruction volume of sample I.
First the parallel beam data set is shown, followed by the cone beam zoom reconstruction.
Tables
Table 1
Results of the analysis of tissue characteristics: specific surface area SV, characteristic length Lc and mean distance and standard deviation from all tissue voxels to air as well as the mean concentration of lymphocytes cl for all six Covid-19 positive samples as well as for one control sample. Colors match the distance graphs in Figure 6.
| Patient no. | SV (%) | Lc (μm) | (μm) | |
|---|---|---|---|---|
| I | 13.87 | 9.4 | 5.9±5.3 | 16.0 |
| II | 46.56 | 2.8 | 2.1±1.0 | 14.1 |
| III | 33.75 | 3.9 | 2.5±1.5 | 4.4 |
| IV | 25.90 | 5.0 | 3.2±2.3 | 7.1 |
| V | 19.28 | 6.7 | 3.6±2.1 | 4.8 |
| VI | 11.87 | 11.0 | 9.1±10 | 6.1 |
| CTRL (hyd.) | 20.04 | 6.5 | 5.0±5.1 | - |
Table 2
Sample and medical information.
Age and gender, clinical presentation with hospitalization and treatment; NIV: non-invasive ventilation, I: immunosuppression, S: smoker, GGO: ground-glass opacification, C: consolidation, DAD: diffuse alveolar damage.
| Sample no. | Age group, gender | Hospitalization, clinical, radiological, and histological characteristics |
|---|---|---|
| I | 60–70, F | 5-10d, GGO, DAD |
| II | 80–90, M | 5-10d, C, I, DAD |
| III | 90–100, M | 1-4d, GGO, C, DAD |
| IV | 70–80, M | 1-4d, NIV, S, GGO, C, DAD |
| V | 60–70, M | 5-10d, NIV, S, GGO, C, DAD |
| VI | 70–80, M | 1-4d, S, GGO, C, DAD |
| CTRL | 20–30, M | - |
Table 3
Data acquisition parameters for x-ray phase-contrast tomography measurements.
| Cone geometry | Parallel geometry | |
|---|---|---|
| FOV | 0.4 mm × 0.35 mm | 1.6 mm × 1.4 mm |
| Pixel size | 167 nm | 650 nm |
| 125 mm | - | |
| 4975 mm | 10 mm − 100 mm | |
| Regime | holographic | direct contrast |
| Rotation | start-stop | continuous |
| Exposure | 2 s | |
| Total exposure | ||
| Volumetric flowrate |
Additional files
Download links
A two-part list of links to download the article, or parts of the article, in various formats.
Downloads (link to download the article as PDF)
Open citations (links to open the citations from this article in various online reference manager services)
Cite this article (links to download the citations from this article in formats compatible with various reference manager tools)
3D virtual pathohistology of lung tissue from Covid-19 patients based on phase contrast X-ray tomography
eLife 9:e60408.
https://doi.org/10.7554/eLife.60408


