Plexin-B2 controls the timing of differentiation and the motility of cerebellar granule neurons
- Sorbonne Université, INSERM, CNRS, Institut de la Vision, France
- Pharmacology Institute, Heidelberg University, Germany
Figures
Figure 1
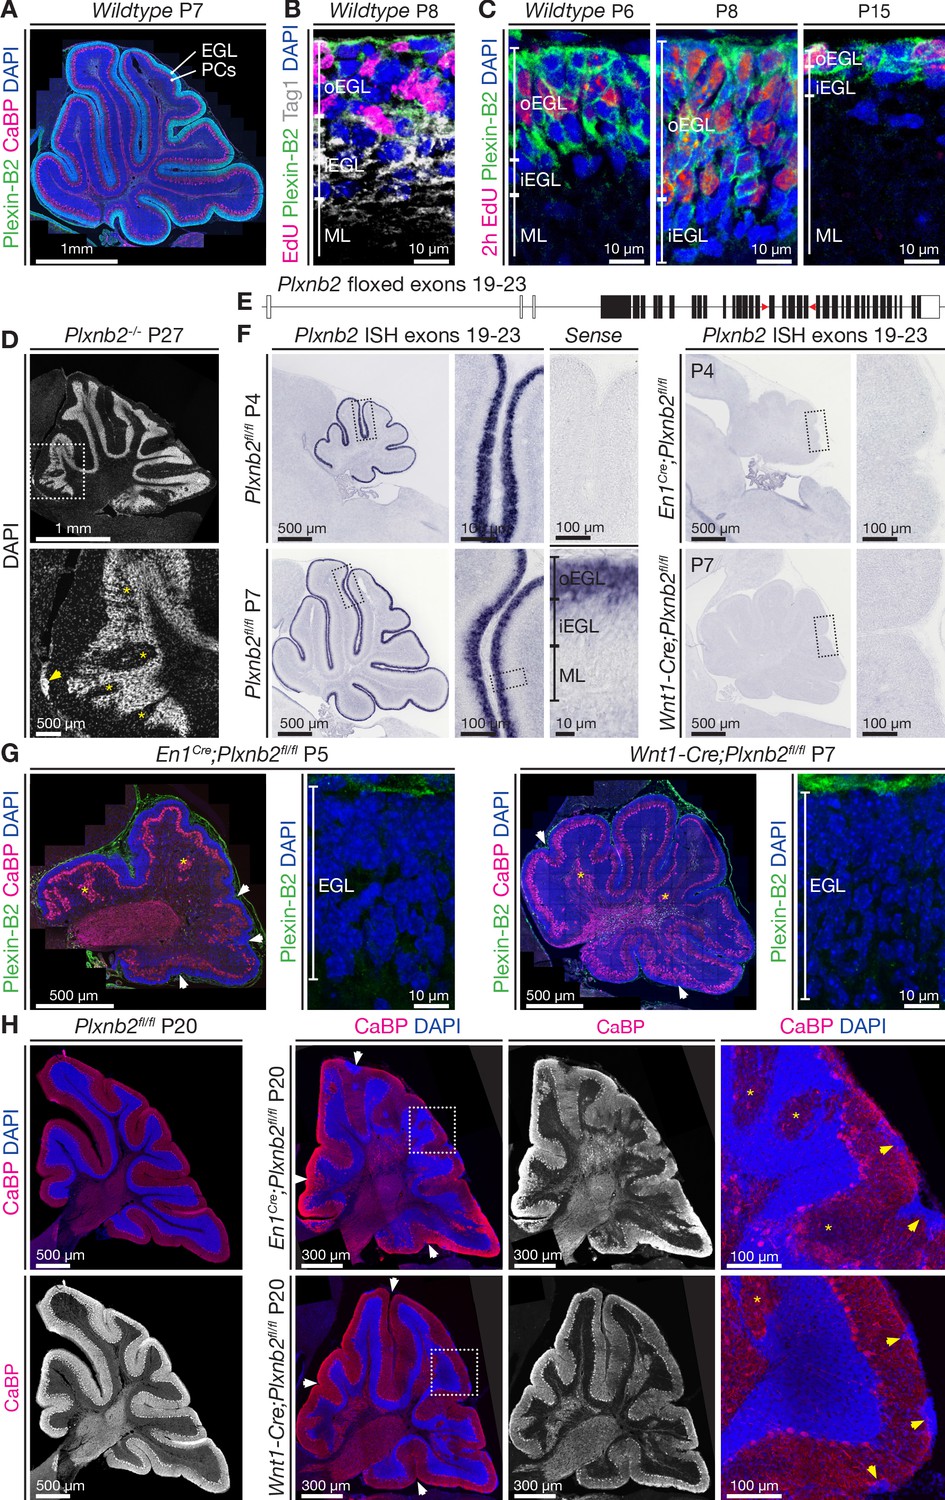
Plexin-B2 expression and generation of cerebellum-specific Plxnb2 conditional knockout models.
(A, B, C), Plexin-B2 protein distribution in the cerebellar cortex during different stages of postnatal development. (A) Plexin-B2 immunostaining on cryostat sections immunolabeled with the Purkinje cell (PC) marker Calbindin (CaBP) and counterstained with DAPI shows that Plexin-B2 is expressed in the external granule layer (EGL). (B) Plexin-B2 immunoreactivity coincides with EdU (injected 2 hr prior to fixation to visualize proliferating cells) showing that this receptor is restricted to proliferating cerebellar granule neurons (CGNs) in the outer external granular cell layer (oEGL). It is downregulated in Tag1+ postmitotic CGNs in the inner EGL (iEGL). (C) High-magnification images show Plexin-B2 expression in the oEGL (stained with EdU), which regresses between P6 and P15. (D) Sagittal section of P27 cerebellum Plxnb2-/- (full knockout) cerebellum stained with DAPI. The structure and layers of the cerebellar cortex are disorganized. Clear gaps in the internal granule layer structure can be observed (yellow asterisks), as well as patches of cells that accumulated at the cerebellar surface (arrowhead). (E) Schematic representation of the genomic Plxnb2 sequence of the conditional Plxnb2 mutant described in Deng et al., 2007. The loxP sites flanking exons 19–23 are depicted with red triangles. Plxnb2fl/fl conditional mutant mice were crossed with En1Cre or Wnt1-Cre mice. (F) In situ hybridization, on cerebellar sections at P4 and P7, with a probe recognizing the floxed exons of the Plxnb2 gene. Sections incubated with sense probe are devoid of signal. In cre-negative Plxnb2fl/fl control mice, Plxnb2 mRNA is only detected in the oEGL. In both En1Cre;Plxnb2fl/fl and Wnt1-Cre;Plxnb2fl/fl littermates, Plxnb2 mRNA is deleted from the oEGL. (G) Plexin-B2 immunostaining on sagittal cerebellar sections of En1Cre;Plxnb2fl/fl (P5) and Wnt1-Cre;Plxnb2fl/fl (P7) animals shows the absence of Plexin-B2 protein in the EGL. Sections were also labeled with anti-CaBP antibodies and DAPI. Impaired cerebellar foliation (white arrowheads) and Purkinje cell islands (yellow asterisks) are observed in both conditional knockouts. (H) P20 sagittal cerebellar sections immunostained for CaBP and counterstained with DAPI. Both En1Cre;Plxnb2fl/fl and Wnt1-Cre;Plxnb2fl/fl conditional knockouts phenocopy the cerebellar defects found in Plxnb2-/- mutants. White arrowheads mark altered foliation, whereas yellow arrowheads in the magnified panels show surface accumulations of CGNs. Yellow asterisks indicate Purkinje cell islets. En1Cre;Plxnb2fl/fl mice display the Plxnb2 phenotype to a greater extent. Scale bars: (A) 1 mm. (B, C) 10 μm. (D) Low magnification 1 mm, high magnification 500 μm. (F) Low-magnification overview panels: 500 μm, high-magnification panels: 100 μm. (G) Overview panels: 500 μm, high-magnification EGL panels: 10 μm. (H) Low-magnification panels 300 μm, high-magnification panels 100 μm.
Figure 2

Developmental time course of cerebellar Plxnb2 phenotype.
The time course of cerebellar foliation and lamination during early postnatal cerebellar development is delayed in Plxnb2 conditional knockout. (A) Pax6 immunostaining labels both pre- and postmitotic CGNs in the developing cerebellum, and Calbindin (CaBP) labels Purkinje cells. In controls, many cerebellar fissures have formed at P0, and deepen further at P2 and P4, whereas the cerebellum of En1Cre;Plxnb2fl/fl mutant displays a very shallow primary fissure (prf) at P0 and aberrant fissure development over time. Furthermore, ectopic Purkinje cell islets (arrowheads) are observed in Plxnb2 mutant internal granule layer. (B) 3D-Light sheet microscope imaging of TO-PRO-3 stained and iDISCO+ cleared (see Materials and methods) P4 cerebellum illustrating the foliation delay in Plxnb2 conditional KO. Right panels are optical sections (coronal or horizontal) through 3D-reconstructed images. Plxnb2 mutants develop aberrant shallow fissures and additional folia in different orientations. Abbreviations: pfr: primary fissure, ppf: prepyramidal fissure, sf: secondary fissure, pcn: precentral fissure, pcuf: preculminate fissure, pfl: posterolateral fissure. Scale bars: overview panels (A, B): 500 μm, magnifications in (A): 100 μm.
Figure 3 with 1 supplement
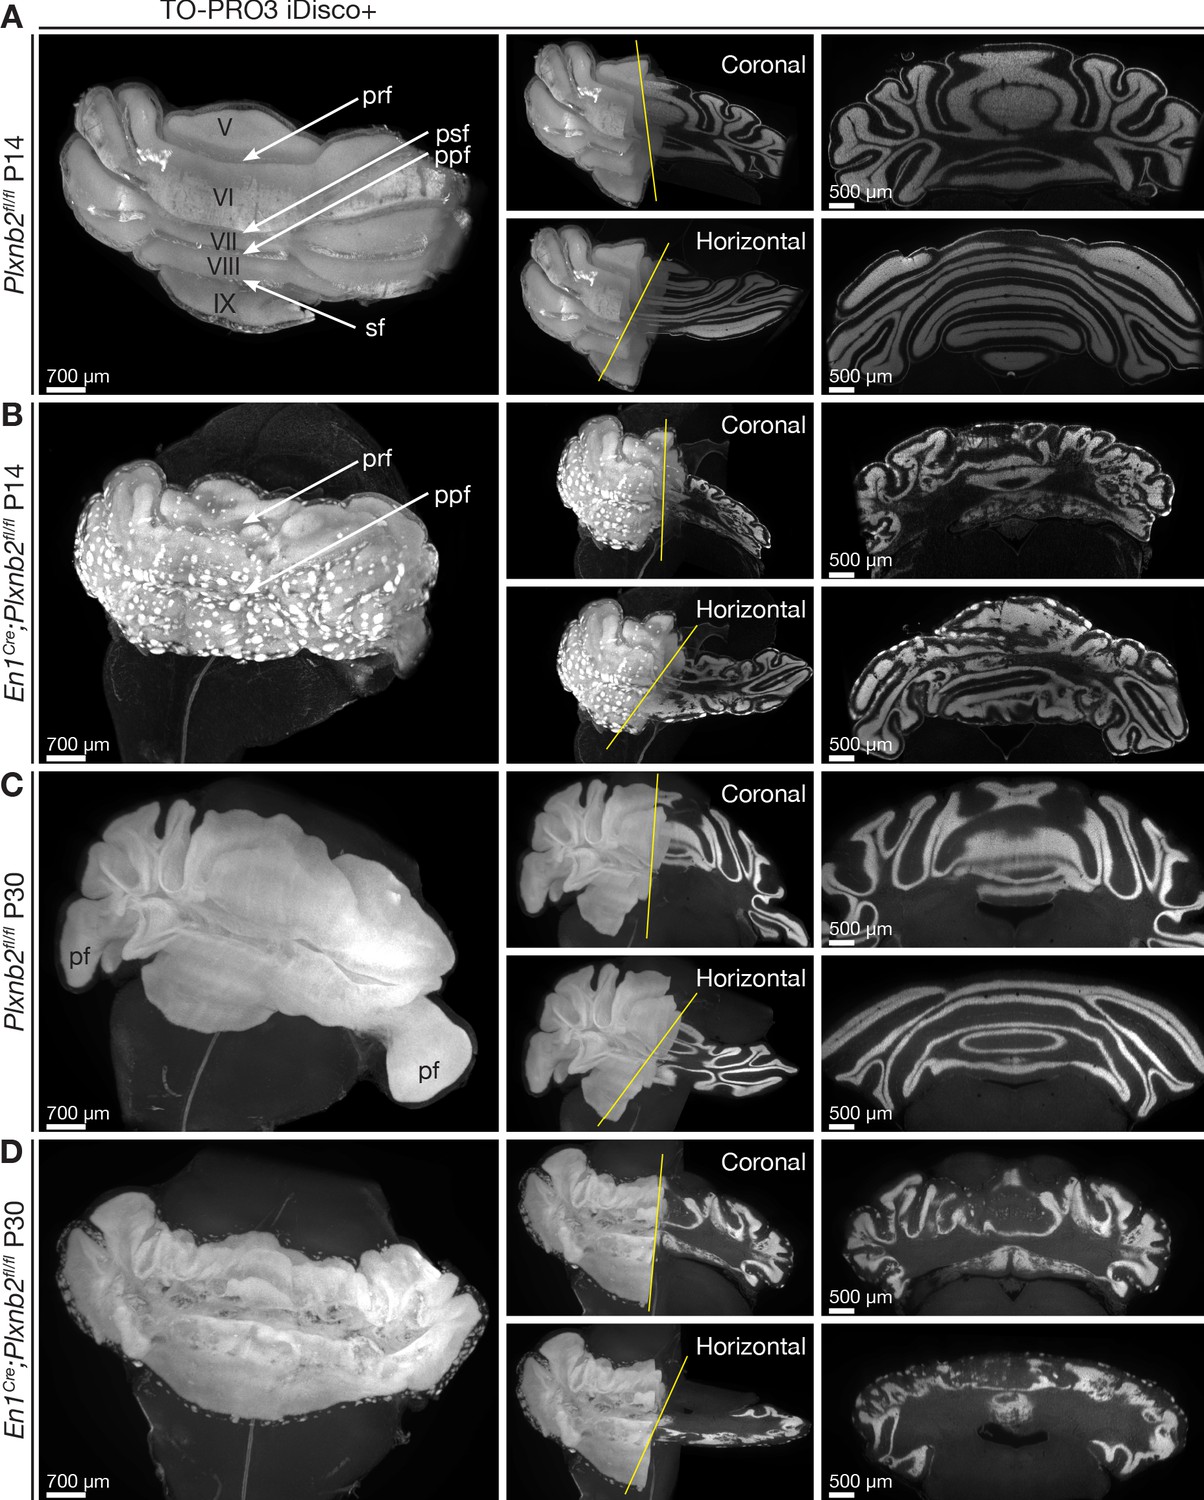
Ruffled IGL and ectopic CGN patches in cerebellum-specific Plxnb2 mutant.
(A– D) Whole-mount TO-PRO-3 staining of P14 and P30 cerebella from Plxnb2fl/fl and En1Cre;Plxnb2fl/fl littermates cleared with iDISCO+. In 3D, TO-PRO-3 staining mainly reveals the structure of the cell-dense IGL. Plxnb2fl/fl control cerebella (A) display a very smooth IGL. A thin layer of EGL remains at P14 but not at P30 (C). In P14 En1Cre;Plxnb2fl/fl mice, the regressing EGL contains ectopic clusters of CGNs (B) that remain at P30 (D). In addition, Plxnb2 mutant IGL (B, D) shows many invaginations in different directions, independent of normal fissure orientation. Although some fissures are clearly formed and visible (prf, ppf), many others are absent. The paraflocculus (pf), present in P30 control, was lost during dissection in the Plxnb2 mutant. Greek numbers indicate cerebellar lobes. Scale bars: 700 μm for the 3D images, 500 μm for the coronal and horizontal sections. Pfr: primary fissure, psf: posterior superior fissure, ppf: prepyramidal fissure, sf: secondary fissure. Figure 3—figure supplement 1A shows quantification of 3D cerebellar volume (Figure 3—figure supplement 1—source data 1).
Figure 3—figure supplement 1
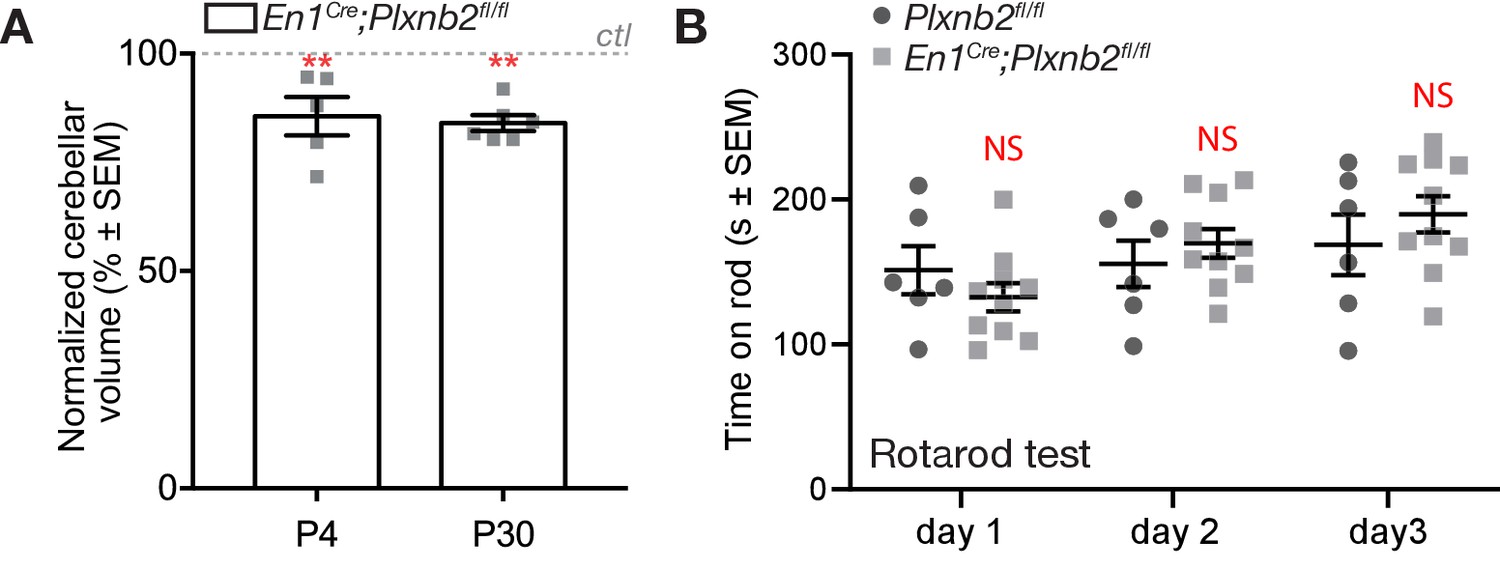
Difference in cerebellar volume but not motor function.
(A) Quantification of cerebellar volume was done by 3D segmentation of the cerebellum in Imaris. Data is normalized to control cerebellum (dotted line at 100%) P4: 85.64 ± 4.425%. Mann Whitney U (MWU) test. MWU(0) p=0.0079, N = 5 ctl and 5 mut. P30: 84.03 ± 1.808%. MWU(0) p=0.0022, N = 6 ctl and 6 mut. (Figure 3—figure supplement 1—source data 1) (B) Quantification of the time to fall in rotarod assay on three consecutive trial. Day1 ctl 151.3 ± 16.6 s vs. mut 132.6 ± 9.7 s (Not significant); Day 2 ctl 155.6 ± 16.1 s vs. mut 169.8 ± 10.0 s (Not significant); Day 3 ctl 168.8 ± 20.8 s vs. mut 189.9 ± 12.5 s (Not significant). Six controls and 10 mutant mice, 19 weeks old, were tested. (Figure 3—figure supplement 1—source data 1).
-
Figure 3—figure supplement 1—source data 1
Cerebellar volume and function.
- https://cdn.elifesciences.org/articles/60554/elife-60554-fig3-figsupp1-data1-v2.xlsx
Figure 4 with 1 supplement

Proliferating CGNs intermingle with migrating CGNs and have a longer cell-cycle.
(A) Coronal sections of P9 cerebella of Plxnb2fl/fl control and En1Cre;Plxnb2fl/fl littermates injected with EdU 2 hr before perfusion. EdU labels proliferating CGN precursors and Calbindin (CaBP) immunostaining labels Purkinje cells. Sections were counterstained with DAPI. In control, proliferating CGNs (EdU+) are restricted to the outer layer of the EGL (oEGL). In Plxnb2 mutant, EdU+ CGN precursors are found throughout the EGL. The developing molecular layer, containing CaBP+Purkinje cell dendrites, is thinner in Plxnb2 mutant. The graph shows the quantification of the thickness of the EGL, oEGL, and molecular layer (ML). Error bars represent SEM. EGL: 42.63 ± 1.19 μm in ctl vs. 43.62 ± 2.04 μm, in mut, MWU(295) p=0.77, NS: not significant. oEGL 24.78 ± 0.42 μm in ctl vs. 35.32 ± 0.76 μm in mut. MWU(70) p<0.0001. ML: 32.04 ± 0.71 μm in ctl vs. 27.44 ± 0.64 μm in mut. MWU(159) p=0.027. (Figure 4—source data 1) (B) Coronal sections of P9 cerebella from Plxnb2fl/fl control and En1Cre;Plxnb2fl/fl littermates, immunostained for Ki67 and Tag1. Ki67 labels proliferating CGN precursors in the oEGL and Tag1 postmitotic CGNs that migrate tangentially in the inner EGL (iEGL). These two populations of precursors and postmitotic neurons are strictly separated in controls, whereas they intermingle in Plxnb2 mutants. (C) Sagittal sections of P8 cerebella from Plxnb2fl/fl and En1Cre;Plxnb2fl/fl littermates injected with EdU 2 hr, or 24 hr prior to fixation. EdU+ cells were counted and averaged from three sections per animal from five ctl and five mut animals. No difference in the production of new CGNs between 2 and 24 hr of EdU were observed. Graph shows the percentage of EdU+ cells in the EGL after 24 hr compared to 2 hr (ctl 157.4 ± 12.64% vs. mut 168.8 ± 9.22%, MWU(9), p=0.55, not significant). Error bars represent SEM. (Figure 4—source data 1) Graph in Figure 4—figure supplement 1A shows that there is no difference in the raw amount of EdU+ cells per μm3 after 2 hr or 24 hr post-injection as counted from these sections (Figure 4—figure supplement 1—source data 1). (D) Immunohistochemistry of sagittal sections of P9 cerebella from Plxnb2fl/fl and En1Cre;Plxnb2fl/fl littermates injected with EdU 24 hr prior to fixation. EdU labels cells that started their division cycle in the last 24 hr while H3P staining labels dividing cells. The graph shows the amount of cells in the EGL that are both EdU and H3P positive is higher in the Plxnb2 mutant. Error bars represent SEM. Ctl: 2.44 ± 0.29% vs. mut: 6.45 ± 1.07%. MWU(0) p=0.0079. (Figure 4—source data 1) Scale bars: 50 μm in (A, B, C) and (D), 10 μm in high-magnification panels of (D).
-
Figure 4—source data 1
Layer thickness and proliferation markers in EGL.
- https://cdn.elifesciences.org/articles/60554/elife-60554-fig4-data1-v2.xlsx
Figure 4—figure supplement 1
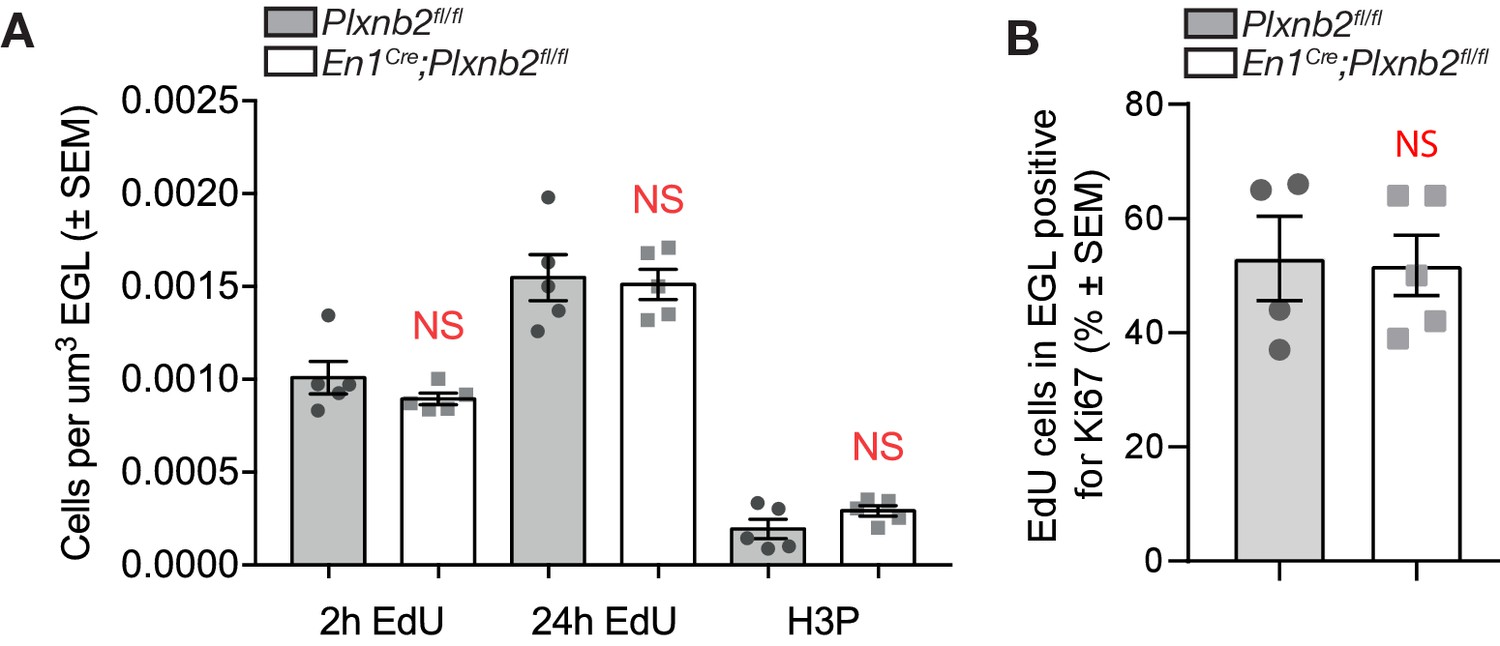
No difference in amounts of EdU+ and H3P+ CGNs in EGL.
(A) Graph shows the quantification of the amount of EdU+ cells 2 hr and 24 hr after EdU injection as described in Figure 4D, and the amount of H3P+ cells per μm3 of EGL. EdU+ and H3P+ cells were counted and averaged from three sections per animal from five ctl and five mut animals. 2 hr EdU: ctl 1,01e−3±8.76e−5 vs. mut 0.89e−3±3.06e−5 cells μm−3 EGL, MWU(8), p=0.42, not significant. 24 hr EdU: ctl 1,55e−3±12.46e−5 vs. mut 1.51e−3±8,08e−5 cells μm−3 EGL, MWU(12.5), p>0.99, not significant. H3P: ctl 0.19e−3±5.21e−5 vs. mut 0.29e−3±2.84e−5 cells μm−3 EGL, MWU(5), p=0.15. Error bars represent SEM (Figure 4—figure supplement 1—source data 1). (B) Fifty-µm-thick slices of P8 brains 2 hr after EdU injection were immunostained for EdU and Ki67 to assess CGN proliferation rate. Spot detection in Imaris software was used to count EdU- and Ki67-positive cells in comparable stretches of EGL. Three to four slices per brain were analyzed. Colocalization is represented as percentage of EdU+ spots, that are also Ki67+. Ctl 53 ± 7.36% vs. mut 51.8 ± 5.3%, MWU(8) p=0.67, data averaged from four control and five mutant brains. Error bars represent SEM. (Figure 4—figure supplement 1—source data 1).
-
Figure 4—figure supplement 1—source data 1
No difference in amounts of EdU+ and H3P+ CGNs in EGL.
- https://cdn.elifesciences.org/articles/60554/elife-60554-fig4-figsupp1-data1-v2.xlsx
Figure 5 with 2 supplements
Plxnb2 mutant CGNs display aberrant proliferative and tangential stages.
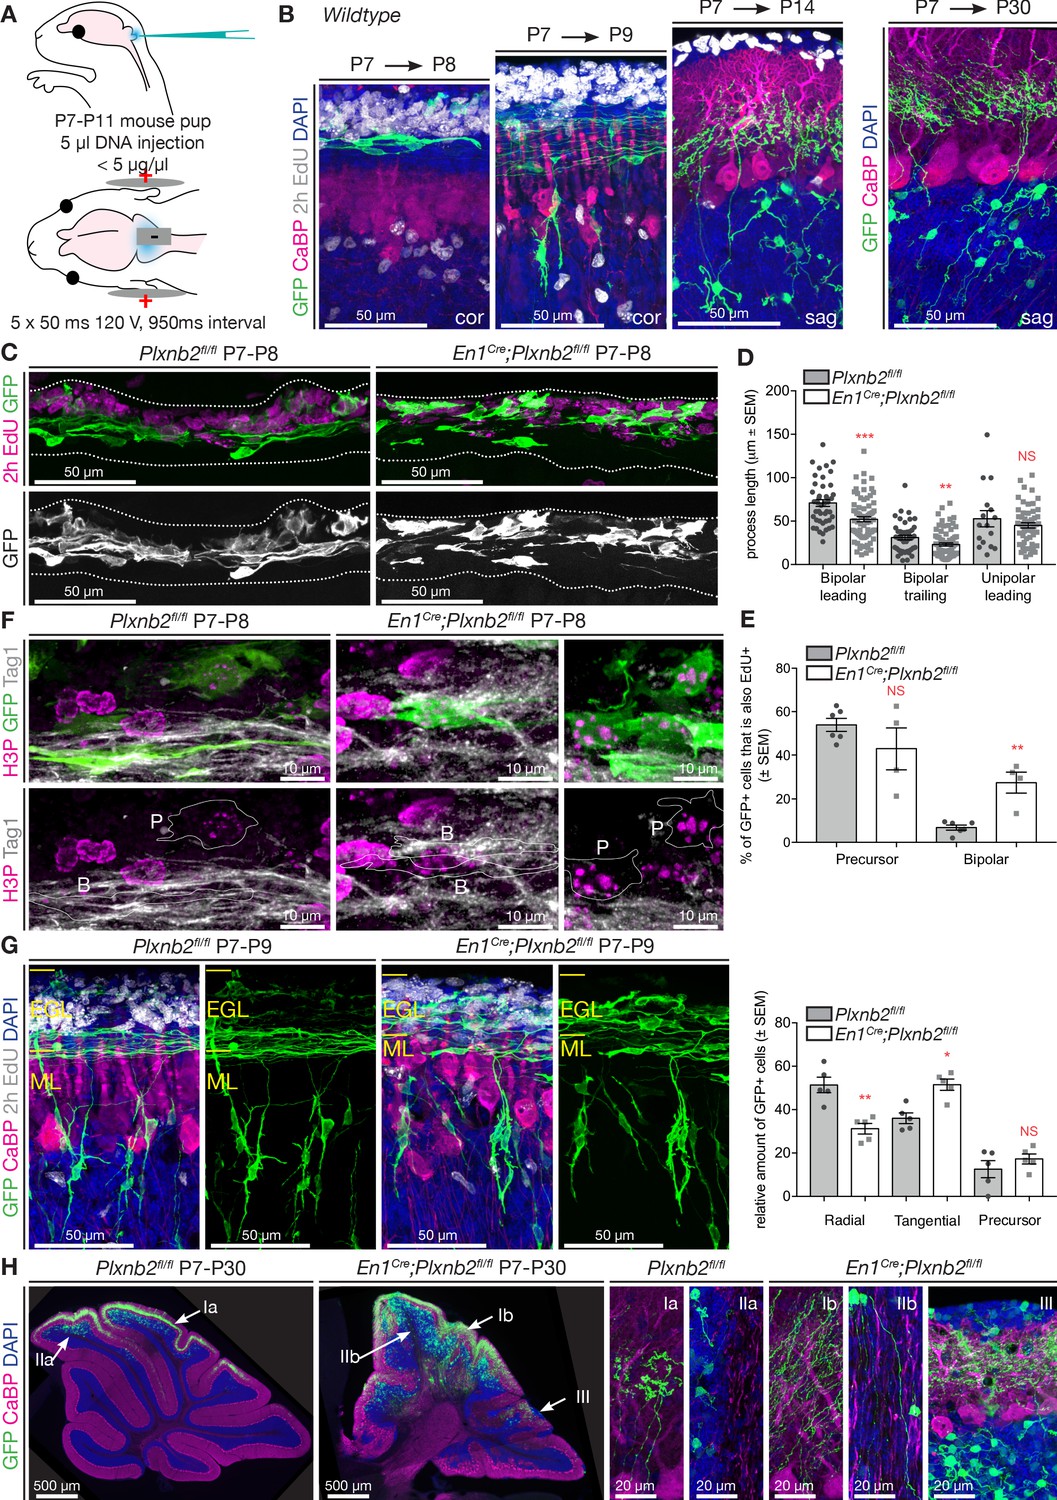
(A) Schematic representation of the in vivo cerebellum electroporation protocol. See Materials and methods for details. (B) Cerebellar sections of electroporated brains at 1 day, 2 days, 1 week and 3 weeks after electroporation at P7, to illustrate the different stages of CGN development. Sections were immunostaining for GFP, Calbindin (CaBP), to label Purkinje cells. EdU was injected 2 hr prior to fixation, to label proliferating CGNs in the oEGL. One day after electroporation, GFP+ CGNs are still proliferating or became postmitotic and initiated tangential migration. Two days after electroporation GFP+ CGNs start to migrate radially toward the IGL. One week after electroporation all GFP+ CGNs reached the IGL, where they start growing dendrites. After 3 weeks, GFP+ cells have their characteristic morphology with 3–4 claw-shaped dendrites. (C) Immunohistochemistry of coronal sections of cerebellum 1 day post-electroporation. GFP shows the electroporated CGNs and EdU, which was injected 2 hr before fixation, labels proliferating CGNs. Both the distribution and the morphology of migrating Plxnb2 mutant GFP+ CGNs are altered. (D) The graph shows aberrant process length of tangentially migrating CGNs in En1Cre;Plxnb2fl/fl pups. Error bars represent SEM. Bipolar leading process (longest process): ctl 70.86 ± 3.94 μm vs. mut 52.12 ± 2.92 μm, MWU(955) p=0.0002. Bipolar trailing process: ctl 31.1 ± 2.68 μm vs. mut 23.1 ± 1.84 μm, MWU(1117) p=0.0057. Unipolar leading process: ctl: 52.71 ± 9.32 μm vs. mut 45.07 ± 3.02 μm. MWU(416) p=0.75 (not significant). Forty-four wildtype bipolar cells and 73 mutant bipolar cells, and 16 wildtype unipolar and 66 mutant unipolar cells of 6 wildtype and 4 Plxnb2 mutant animals were quantified. (Figure 5—source data 1) (E) Quantification of the % of EdU+ and GFP+ GCNs. In Plxnb2 mutants, many bipolar GFP+ GCNs are also EdU+, unlike in controls (see Figure 5—figure supplement 1). By contrast the % EdU+/GFP+ GCN precursors is similar in Plxnb2fl/fl controls and En1Cre;Plxnb2fl/fl mutants. A total of 447 ctl and 297 mutant precursors, and 451 ctl and 533 mutant bipolar CGNs were counted, from 6 wildtype and 4 Plxnb2 mutant animals. Error bars represent SEM. Precursors: ctl 53.91 ± 3.01% vs. mut 42.97 ± 9.51%, MWU(8) p=0.48 (not significant). Bipolar cells: ctl 6.82 ± 1.17% vs. mut 27.53 ± 4.86%, MWU(0) p=0.0095 (Figure 5—source data 1). (F) P8 coronal sections of the cerebellum, 1 day post-electroporation. Mitotic CGNs in the EGL are immunostained with anti-H3P antibodies. At this stage, GFP+ cells are either in a precursor state (outlined and marked P) or display a clear bipolar morphology (outlined and marked B) and express Tag1, a marker of tangentially migrating CGNs. In controls, only CGN precursor cells express H3P, whereas in Plxnb2 mutants, H3P is found in precursors but also in some Tag1+ bipolar CGNs. (G) Coronal sections of the cerebellum 2 days post-electroporation. GFP immunostaining labels the electroporated CGNs, and EdU (injected 2 hr before fixation) stains proliferating CGNs. Calbindin (CaBP) labels Purkinje cells. GFP+ cells were counted and grouped in radial, tangential and precursor cell stages based on their morphology. In controls, most CGNs have reached radial stage 2 days after electroporation. By contrast, many GFP+ CGNs are still in the tangential phase in Plxnb2 mutants. Radial CGNs are not labeled by EdU. Graph shows that in Plxnb2 mutants, more cells are in the radial stage (ctl 50 ± 2.77% vs. mut 38.28 ± 2.37%, MWU(1) p=0.0159) and less cells in the tangential stage (ctl 34 ± 1.33% vs. mut 47.85 ± 2.37%, MWU(0) p=0.0079). There is no significant difference in cells still in the precursor stage (ctl 16 ± 1.98% vs. mut 13.9 ± 1.71%. MWU(10) p=0.65). Error bars represent SEM. 899 ctl and 744 mutant CGNs were counted, from five animals per genotype (Figure 5—source data 1). (H) Sagittal sections of the cerebellum more than 3 weeks after electroporation with GFP. Electroporated CGNs are stained with GFP, Purkinje cells with Calbindin (CaBP) and sections were counterstained with DAPI. Three different types of defects are seen in Plxnb2 mutants: (I) Parallel fibers that usually occupy a thin part within the molecular layer (Ia) disperse through the entire molecular layer in the mutant (Ib); (II) Whereas the white matter of control cerebella is devoid of parallel fibers (IIa), some mutant CGNs send their axons into the cerebellar white matter (IIb); and (III) ectopic patches of CGNs accumulate at the cerebellar. Ectopic CGNs still acquire their characteristic morphology. Scale bars: (B, C, E): 50 μm; D: 10 μm; (F) overview panels: 500 μm, high-magnification panels: 20 μm.
-
Figure 5—source data 1
CGN morphology in vivo and colocalization with proliferation markers.
- https://cdn.elifesciences.org/articles/60554/elife-60554-fig5-data1-v2.xlsx
Figure 5—figure supplement 1
Identity of electroporated cells and quantification of morphological features.
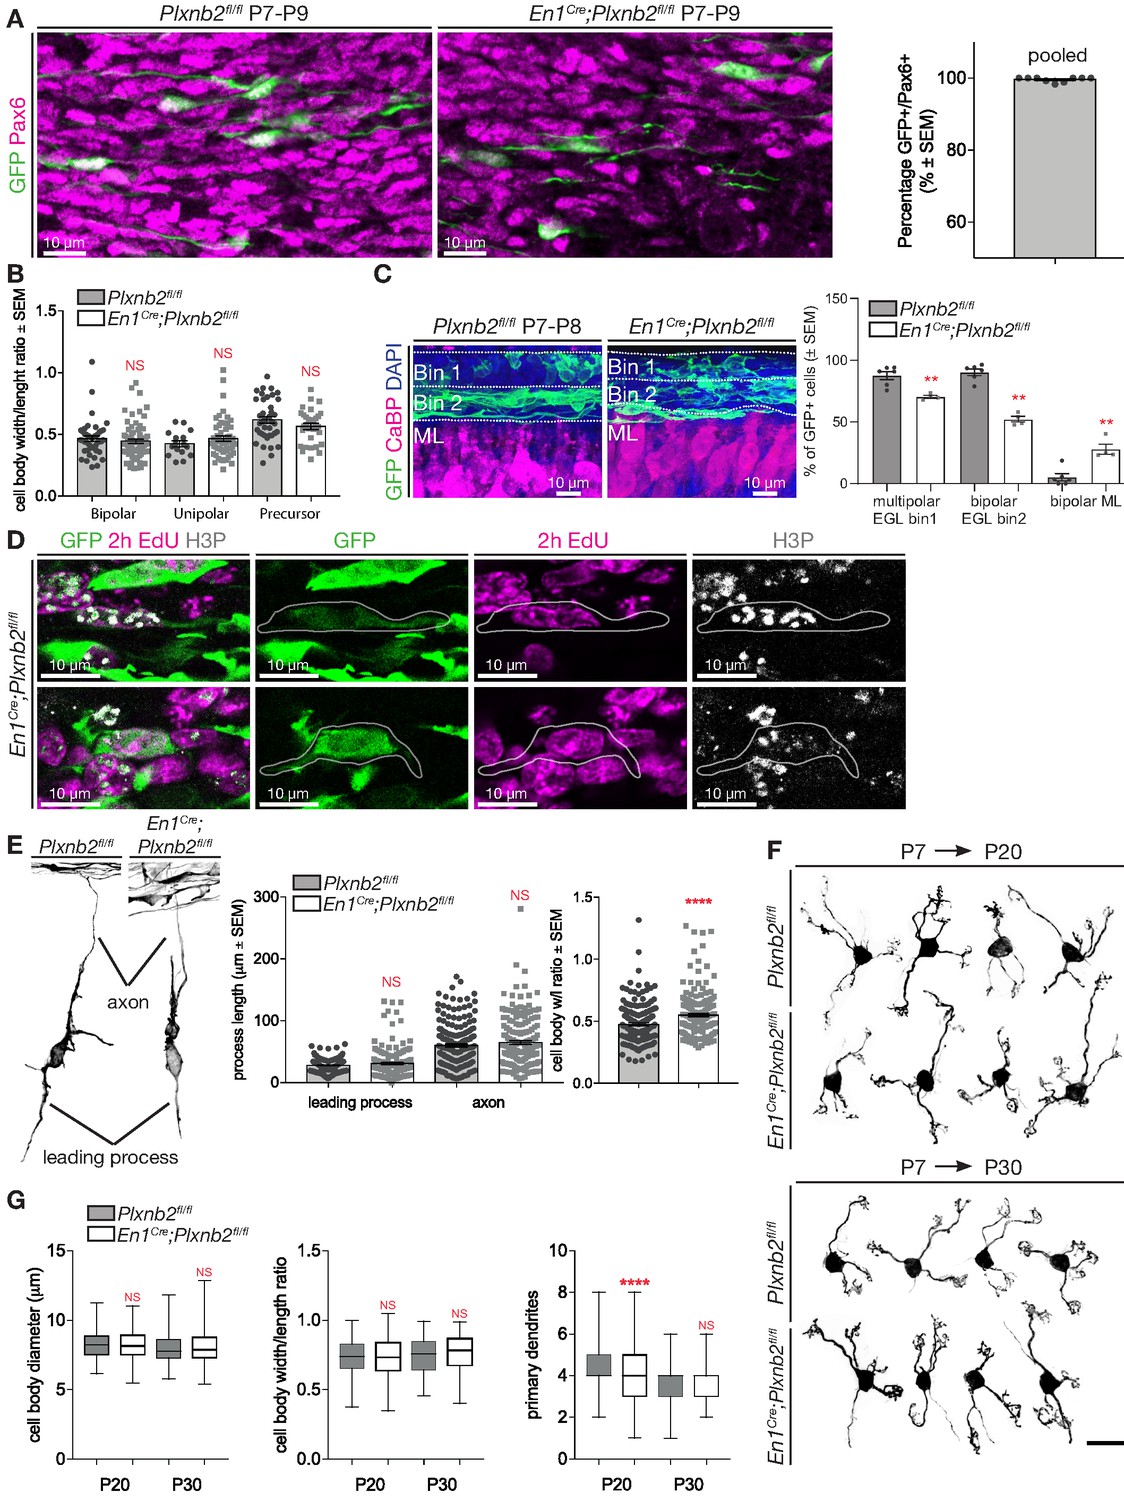
(A) Immunohistochemistry of coronal sections of cerebellum 2 days post-electroporation. GFP shows the electroporated cells and Pax6 marks pre- and post-mitotic CGNs. Graph shows that 99.6 ± 0.21% of all GFP+ cells are also Pax6+. Error bars represent SEM. 198 ctl and 382 mutant GFP+ cells were counted and pooled from four animals. (Figure 5—figure supplement 1—source data 1) (B) Graph shows quantification of cell body measurements of GFP+ CGNs 1-day-post-electroporation as shown in Figure 5C. Cells can be classified as precursors, of CGNs with unipolar or bipolar morphologies. No difference is seen between controls and Plxnb2 mutants. Width/length ratio of 74 ctl and 159 mut CGNs from three different pups per genotype were calculated. Bipolar cells: ctl 0.47 ± 0.02 vs. mut 0.45 ± 0.02, MWU(1400) p=0.25; Unipolar cells: ctl 0.42 ± 0.03 vs. mut 0.47 ± 0.02, MWU(382) p=0.43; Precursors: ctl 0.62 ± 0.03 vs. mut 0.57 ± 0.03, MWU(509) p=0.26. Error bars represent SEM. (Figure 5—figure supplement 1—source data 1) (C) EGL of cerebella electroporated 24 hr before isolation at P8 were equally divided in two bins. Six control and four mutant brains were analyzed. All GFP+ cells were counted and quantified as multipolar or bipolar. CGN-appearance per bin was then analyzed as a percentage of total CGNs in that morphology. Percentage of all multipolar cells residing in bin 1 ctl 87.5 ± 3.19% vs. mut 70.41 ± 1.2% MWU(0) p=0.0095; Percentage of all bipolar cells residing in bin 2 ctl 90.22 ± 2.64% vs. mut 52.24 ± 2.34% MWU(0) p=0.0095; Bipolar in ML ctl 5.19 ± 2.84% vs. 27.89 ± 4.17% MWU(0) p=0.0095. Error bars represent SEM. (D) High magnification images of Immunohistochemical staining of En1Cre;Plxnb2fl/fl P8 brains showing bipolar GFP+-CGNs that bear both proliferation markers EdU (injected 2 hr before brain isolation) and H3P. (E) Representative examples of Plxnb2fl/fl and En1Cre;Plxnb2fl/fl CGNs 2 days post-electroporation. Axons and leading processes are pointed out. Graphs show axon and leading process lengths, and ratio of cell body width and length. Error bars represent SEM. No significant difference is found in process length (leading process: ctl 28.11 ± 0.72 μm vs. mut 30.86 ± 1.67 μm, MWU(17024) p=0.27; axon length: ctl 60.07 ± 2.5 μm vs. mut 64.98 ± 3.0 μm, MWU(17380) p=0.44). Plxnb2 mutant CGNs in their radial phase appear slightly rounder (width/length ratio ctl 0,47 ± 0.01 vs. mut 0.55 ± 0.01, MWU(13379) p<0.0001). A total of 199 ctl and 183 mut CGNs were analyzed from at least three different pups per genotype. (Figure 5—figure supplement 1—source data 1) (F) Representative examples of Plxnb2fl/fl and En1Cre;Plxnb2fl/fl CGNs, 2 and 3 weeks after electroporation. (G) Whisker plots show quantification results from cells as in (F). In P20 En1Cre;Plxnb2fl/fl mutants, more CGNs have acquired their characteristic mature morphology, with 3–4 claw-shaped dendrites. 198 ctl and 251 mutant CGNs at P20, and 204 ctl and 213 mutant CGNs at P30 were analyzed from at least three different pups from each age and genotype. No significant difference was found in cell body measurements at P20 and P30, and the number of dendrites was also similar at P30. However, at P20 a higher portion of mutant CGNs, electroporated at P7 with GFP, already pruned their dendrites to the amount of 4 (MWU(21308) p<0.0001) (Figure 5—figure supplement 1—source data 1). Scale bar (A, C, D): 10 μm.
-
Figure 5—figure supplement 1—source data 1
Identity of electroporated cells in vivo, morphology of electroporated CGNs.
- https://cdn.elifesciences.org/articles/60554/elife-60554-fig5-figsupp1-data1-v2.xlsx
Figure 5—figure supplement 2
Misplaced and misprojecting CGNs keep their identity.
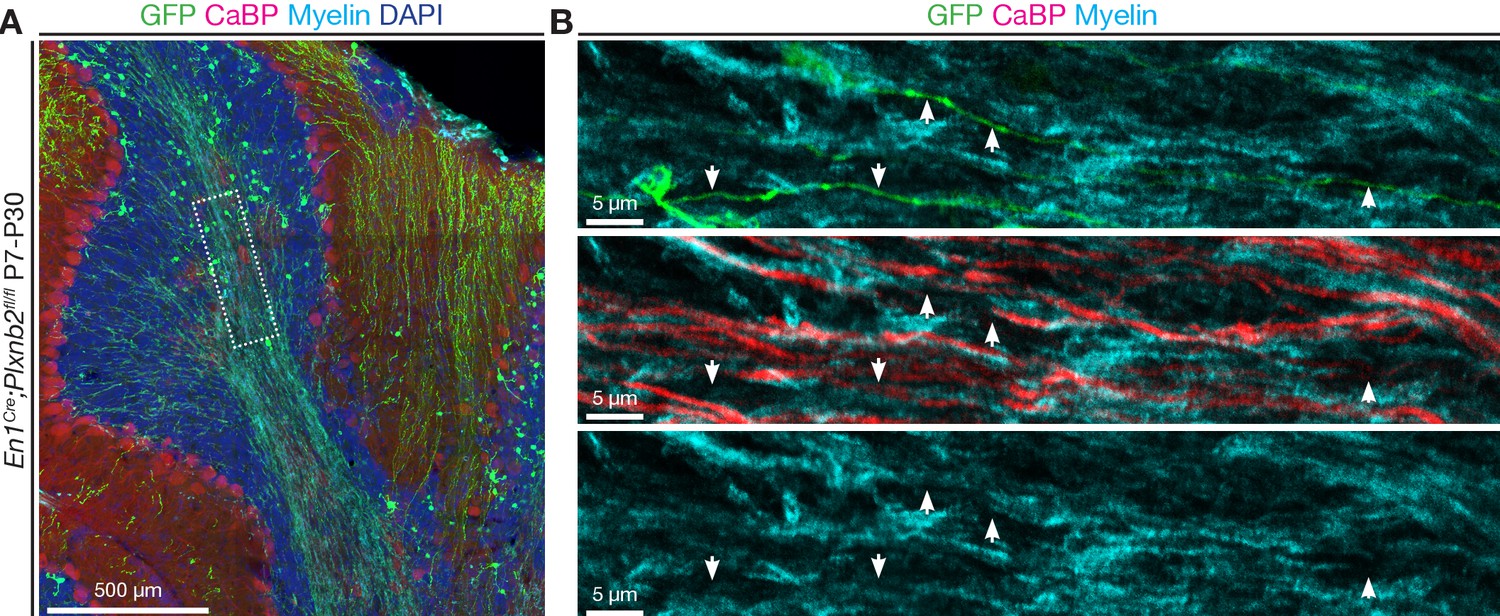
(A) Immunohistochemistry of a sagittal section from an En1Cre;Plxnb2fl/fl cerebellum, more than 3 weeks after electroporation with GFP. GFP labels electroporated CGNs, Calbindin (CaBP) stains Purkinje cells, MOG stains myelin, and sections were counterstained with DAPI. (B) High magnification of the framed region in (A) showing that CGN axons misprojecting in the white matter are not myelinated, similar to parallel fibers in control cerebella. Scale bars: (A): 500 μm; (B): 5 μm.
Figure 6 with 1 supplement
Abnormal parallel fiber layering in Plxnb2 mutants.
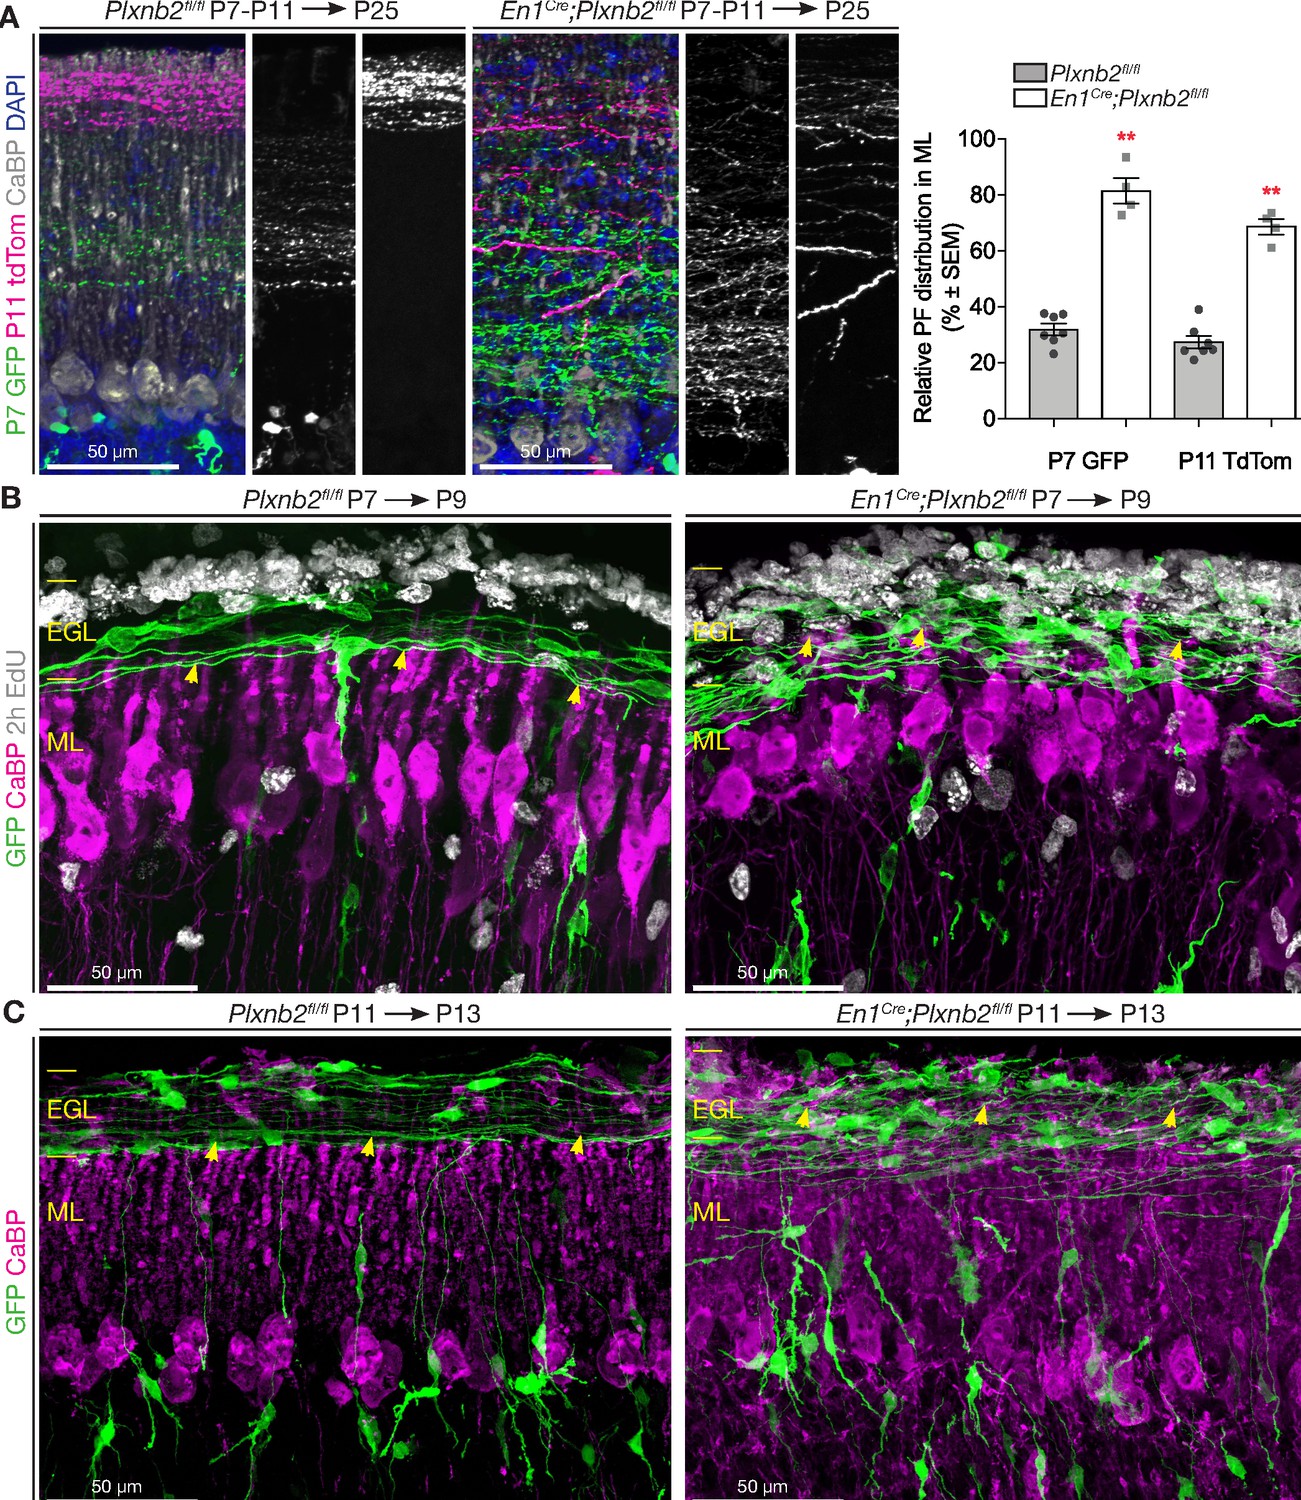
(A) Coronal sections of the cerebellum of P25 mice electroporated with GFP at P7 and re-electroporated with tdTomato (tdTom) at P11. Double immunostaining for GFP and tdTomato. In control (left) the parallel fibers of CGNs that became postmitotic early (GFP+) are at the bottom of the molecular layer, whereas the CGNs that became postmitotic later (tdTom+) extend parallel fibers at the surface of the molecular layer. In En1Cre;Plxnb2fl/fl mutants, there is an important overlap in the molecular layer, between parallel fibers of early and late-born CGNs. The graph shows a quantification of the portion of the molecular layer that is occupied by parallel fibers of either early (GFP+) or late (tdTom+) CGNs (eg. (GFP+ width / ML total width) x 100%). Error bars represent SEM. The molecular layer measurements and its double-electroporated parallel fiber content was averaged from three different points per cerebellum from 7 Plxnb2fl/fl and 4 En1Cre;Plxnb2fl/fl cerebella. P7 GFP ctl: 31.96 ± 2.07% vs. mut: 81.48 ± 4.53% (MWU(0) p=0.0061) and P11 tdTom ctl: 27.45 ± 2.26% vs. mut: 68.74 ± 2.75% (MWU(0) p=0.0061). (Figure 6—source data 1) (B) Coronal sections of cerebella electroporated at P7 and collected at P9 (EdU was injected 2 hr before termination). Sections were stained for GFP, CaBP, and EdU. In controls (left panel), nascent parallel fibers normally extend at the base of the iEGL, just above the tips of developing Purkinje dendritic arbors (yellow arrowheads). However, in Plxnb2 mutant (right panel) parallel fibers extend throughout the EGL and cross the Purkinje dendrites in the ML (yellow arrowheads indicate the tips of Purkinje dendrites). (C) The abnormal presence of young GFP+ parallel fibers deep in the molecular layer is also seen on coronal sections of cerebella electroporated at P11 and collected at P13 (Control, left panel and Plxnb2 mutant, right panel). Scale bars 50 μm.
-
Figure 6—source data 1
Parallel fiber distribution.
- https://cdn.elifesciences.org/articles/60554/elife-60554-fig6-data1-v2.xlsx
Figure 6—figure supplement 1
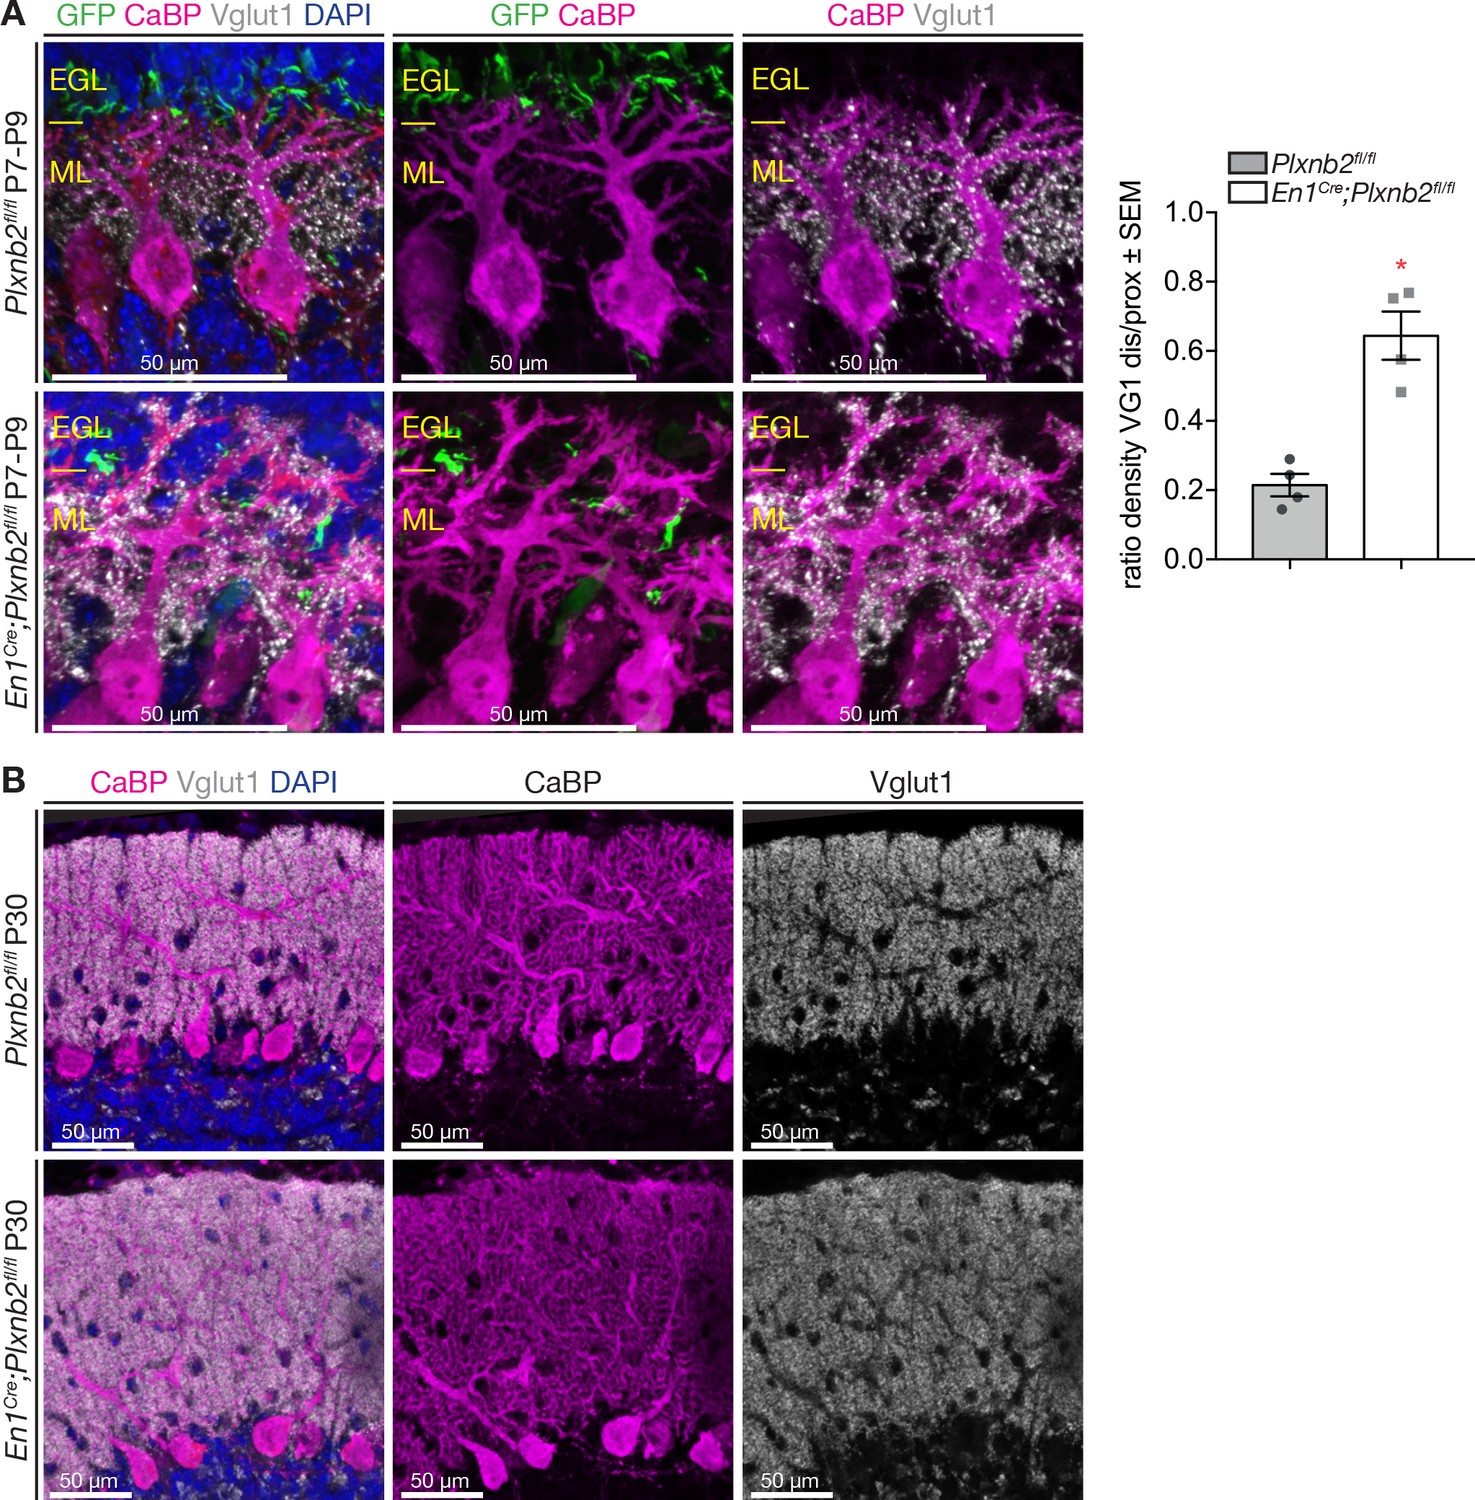
Abnormal localization of parallel fiber synapses in Plxnb2 mutant.
(A) Mice were electroporated with GFP at P7 and their cerebellum collected at P9. Sagittal sections were incubated with antibodies against GFP (to label CGNs and parallel fibers), Calbindin (CaBP, Purkinje cells), and Vglut1 (parallel fiber synapses). In Controls, the density of VGlut1+ synapses is high along the proximal regions of Purkinje cell dendrites and low at their tips. In the molecular layer of Plxnb2 mutants, GFP+ fibers are disorganized, and there is a high density of Vglut1 puncta on both proximal and distal CaBP+ dendritic branches. Graph shows the quantification of the ratio between the fluorescent integrated density of distal and proximal Vglut1-labeling. Ctl: 0.21 ± 0.03 vs. mut 0.64 ± 0.07, MWU(0) p=0.028. Vglut1 integrated density was measured and averaged from 5 distal and 5 proximal 10 × 10 μm squares taken from different Purkinje cells per animal, from four animals for both genotypes. Error bars represent SEM (Figure 6—figure supplement 1—source data 1). (B) Sagittal sections of the cerebellum at P30, immunolabeled for Calbindin (Purkinje cells) and Vglut1 (parallel fibers/Purkinje Cell synapses). The synaptic distribution of Vglut1+ synapses appears similar in control and Plxnb2 mutants. Scale bars (A, B, C): 50 μm.
-
Figure 6—figure supplement 1—source data 1
Synaptogenesis between parallel fibers and Purkinje cells.
- https://cdn.elifesciences.org/articles/60554/elife-60554-fig6-figsupp1-data1-v2.xlsx
Figure 7 with 2 supplements
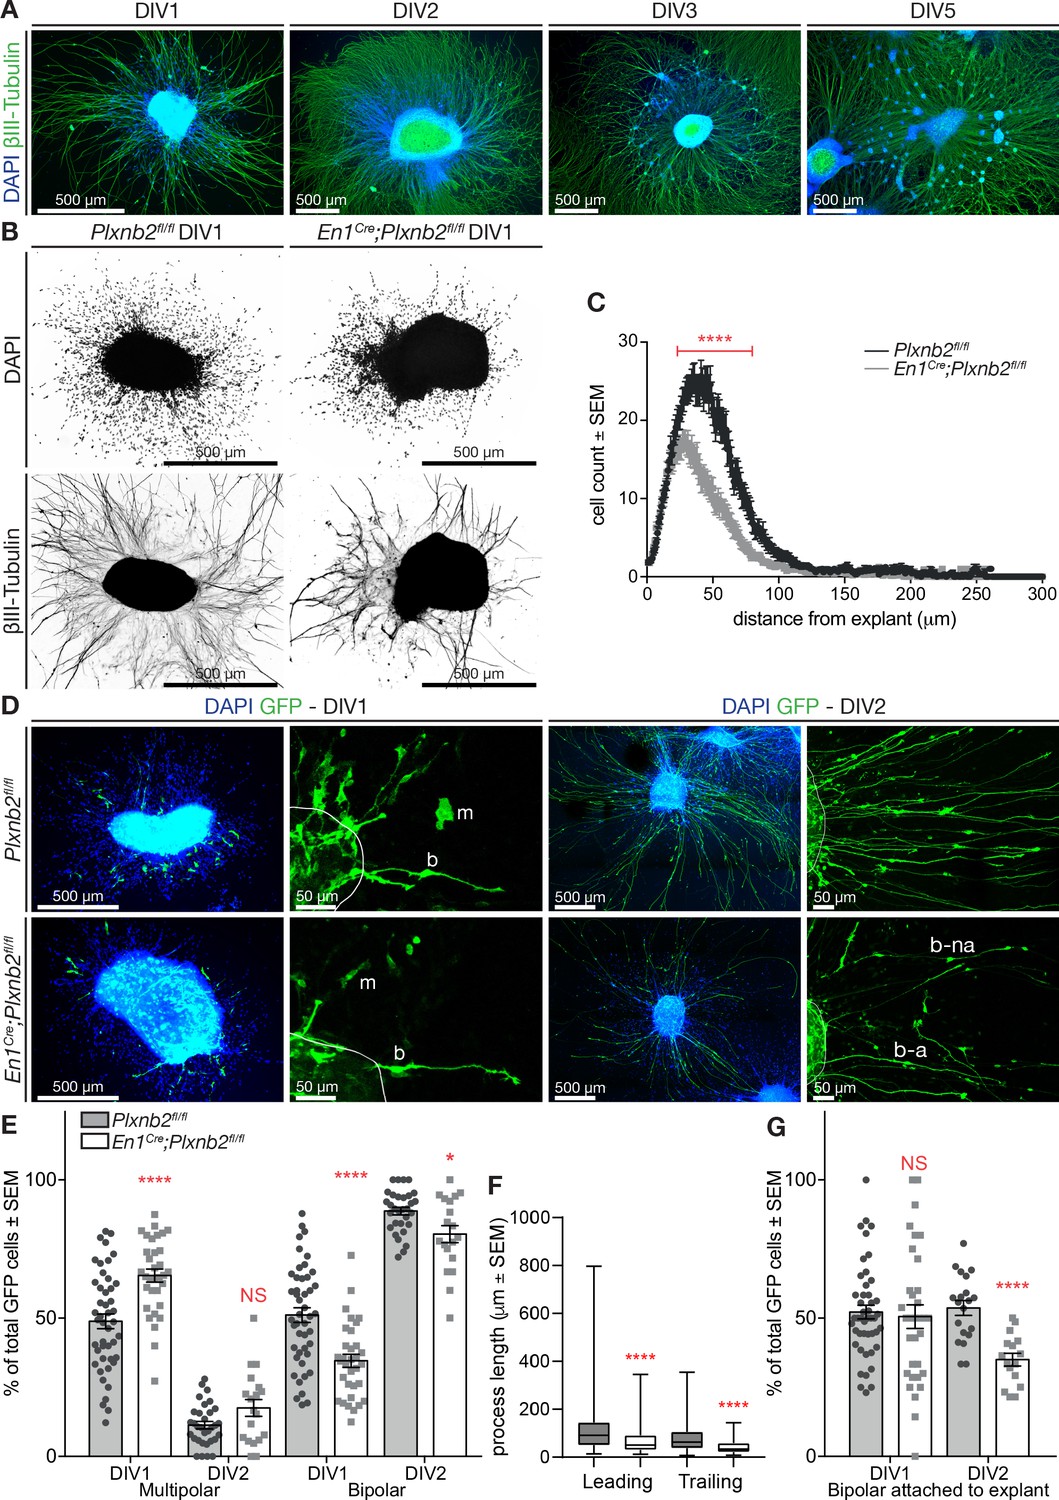
Plxnb2 CGNs recapitulate in vitro the developmental defects found in vivo.
(A) EGL explants from P4-P5 wildtype cerebella, fixed after 1, 2, 3, and 5 days in vitro (DIV). Immunocytochemistry for βIII-tubulin and DAPI shows that cells migrate away from the explant and extend long neurites. After DIV2, cells start accumulating in clusters around the original explant. (B) EGL explants from P4-P5 Plxnb2fl/fl and En1Cre;Plxnb2fl/fl cerebella at DIV1. Cultures were stained for DAPI and βIII-tubulin. Plxnb2 mutant explants show DAPI+ nuclei closer to the explant and different neurite outgrowth. (C) DAPI+ nuclei around the explant were counted and their migration was assessed using a Sholl-analysis. Graph shows that less cells migrate from En1Cre;Plxnb2fl/fl explants and that they stay closer to the explant. Multiple t-test with the Holm-Sidak method were applied to the mean intersections of DAPI+ nuclei with the Sholl circles. p<0.0001. A total of 36 controls and 34 mutant explants were analyzed from three different experiments. Error bars represent SEM. (Figure 7—source data 1) (D) EGL explants from cerebella electroporated ex vivo with GFP and fixed at DIV1 and DIV2. Immunocytochemistry for GFP and DAPI shows the morphology of migrating cells. GFP+ CGNs have either a multipolar (m) or a bipolar (b) shape. After DIV2, almost all GFP+ cells have a bipolar morphology, with their trailing process attached (b–a) or not (b–na) to the explant. (E) Quantification of the proportion of GFP+ CGNs with multipolar or bipolar morphologies. Data is expressed as percentage from total number of GFP+ cells per explant ± SEM. DIV1 multipolar: ctl 48.88 ± 2.65% vs. mut 65.42 ± 2.37%, MWU(353) p<0.0001. DIV1 bipolar: ctl 51.12 ± 2.65% vs. mut 34.58 ± 2.37%, MWU(353) p<0.0001. DIV2 multipolar ctl 11.36 ± 1.33% vs. mut 17.58 ± 3.02%, MWU(226) p=0.13, not significant. DIV2 bipolar ctl 88.67 ± 1.37% vs. mut 80.31 ± 3.07%, MWU(189) p=0.03. All GFP+ cells (amounts between brackets) were counted from 46 ctl (2728) and 33 mut (835) explants (DIV1) and 32 ctl (2284) and 19 mut (617) explants (DIV2) from at least three different experimental repeats. (Figure 7—source data 1) (F) Quantification (Box-plots) of leading and trailing process length of bipolar GFP+ CGNs at DIV1. Leading ctl 106 ± 3.9 μm vs. mut 67.6 ± 5.62 μm, MWU(11147) p<0.0001; trailing ctl 79.5 ± 3.4 μm vs. mut 40.9 ± 2.76 μm, MWU(68833) p<0.0001. A total of 385 ctl and 93 mut cells were analyzed from 29 ctl and 13 mut explants from three experimental repeats (Figure 7—source data 1). (G) Proportion of bipolar GFP+ CGNs attached to the explant. DIV1 attached: ctl 52.19 ± 2.49% vs. mut 50.55 ± 4.27%, (MWU(709.5)) p=0.63, not significant. DIV2 attached: ctl 53.63 ± 2.69% vs. mut 34.92 ± 2.31%, MWU(36.5) p<0.0001. All GFP+ cells (amounts between brackets) were counted from 46 ctl (2728) and 33 mut (835) explants (DIV1) and 32 ctl (2284) and 19 mut (617) explants (DIV2) from at least three different experimental repeats (Figure 7—source data 1). Scale bars: overviews 500 μm (A, B, D); magnifications in (D): 50 μm.
-
Figure 7—source data 1
EGL explants: in vitro CGN morphology.
- https://cdn.elifesciences.org/articles/60554/elife-60554-fig7-data1-v2.xlsx
Figure 7—figure supplement 1
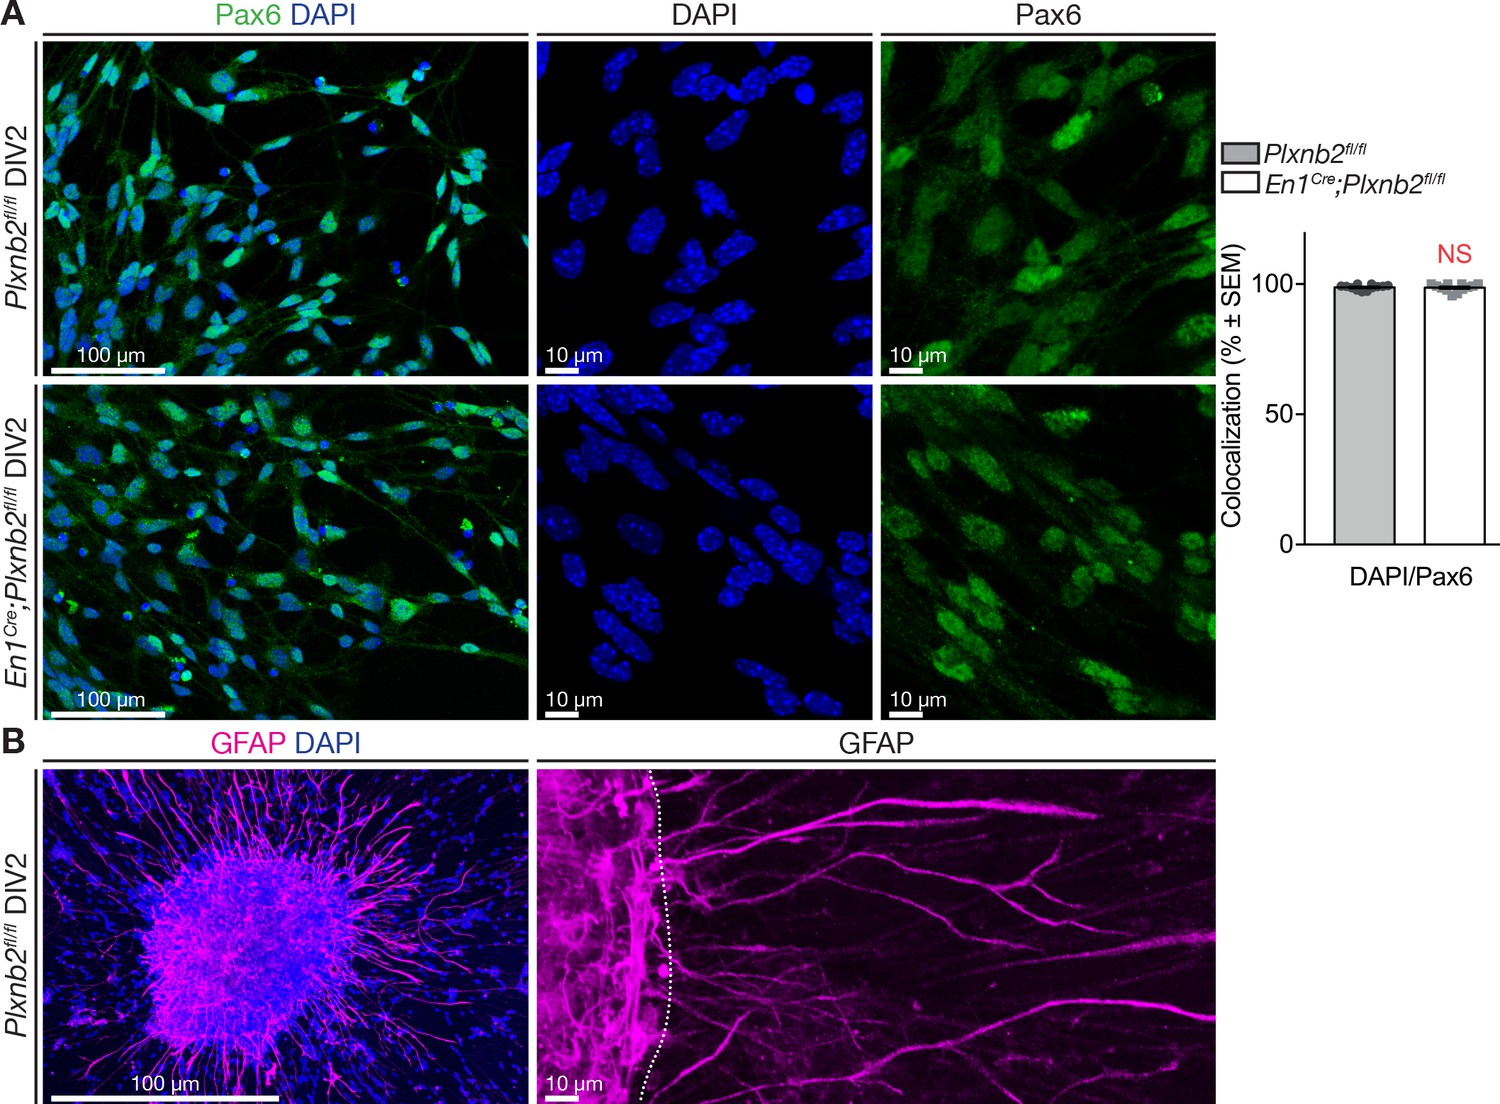
Migrating cells have a CGN identity.
(A) Immunocytochemistry of DIV2 EGL explants for Pax6 (pre- and postmitotic CGNs) with DAPI counterstaining. Cells were counted in 400 × 400 pixel squares close to the explant. Almost all migrating cells are Pax6+ in controls (Pax6+/DAPI+ ctl 98.78 ± 0.28%) and Plxnb2 mutants (98.64 ± 0.43%, MWU(68) p=0.83, not significant). In total 2412 and 2361 DAPI+ cells were counted from 19 ctl and 18 mut explants respectively from three different experiments at DIV1 and DIV2 (Figure 7—figure supplement 1—source data 1). (B) Immunocytochemistry of EGL explants at DIV2 for GFAP (glia) with DAPI staining. Explants contain glia but their cell bodies do not exit the explant. Scale bars: low magnifications 100 μm, high magnifications 10 μm.
-
Figure 7—figure supplement 1—source data 1
Identity of electroporated cells migrating out of EGL explants.
- https://cdn.elifesciences.org/articles/60554/elife-60554-fig7-figsupp1-data1-v2.xlsx
Figure 7—figure supplement 2
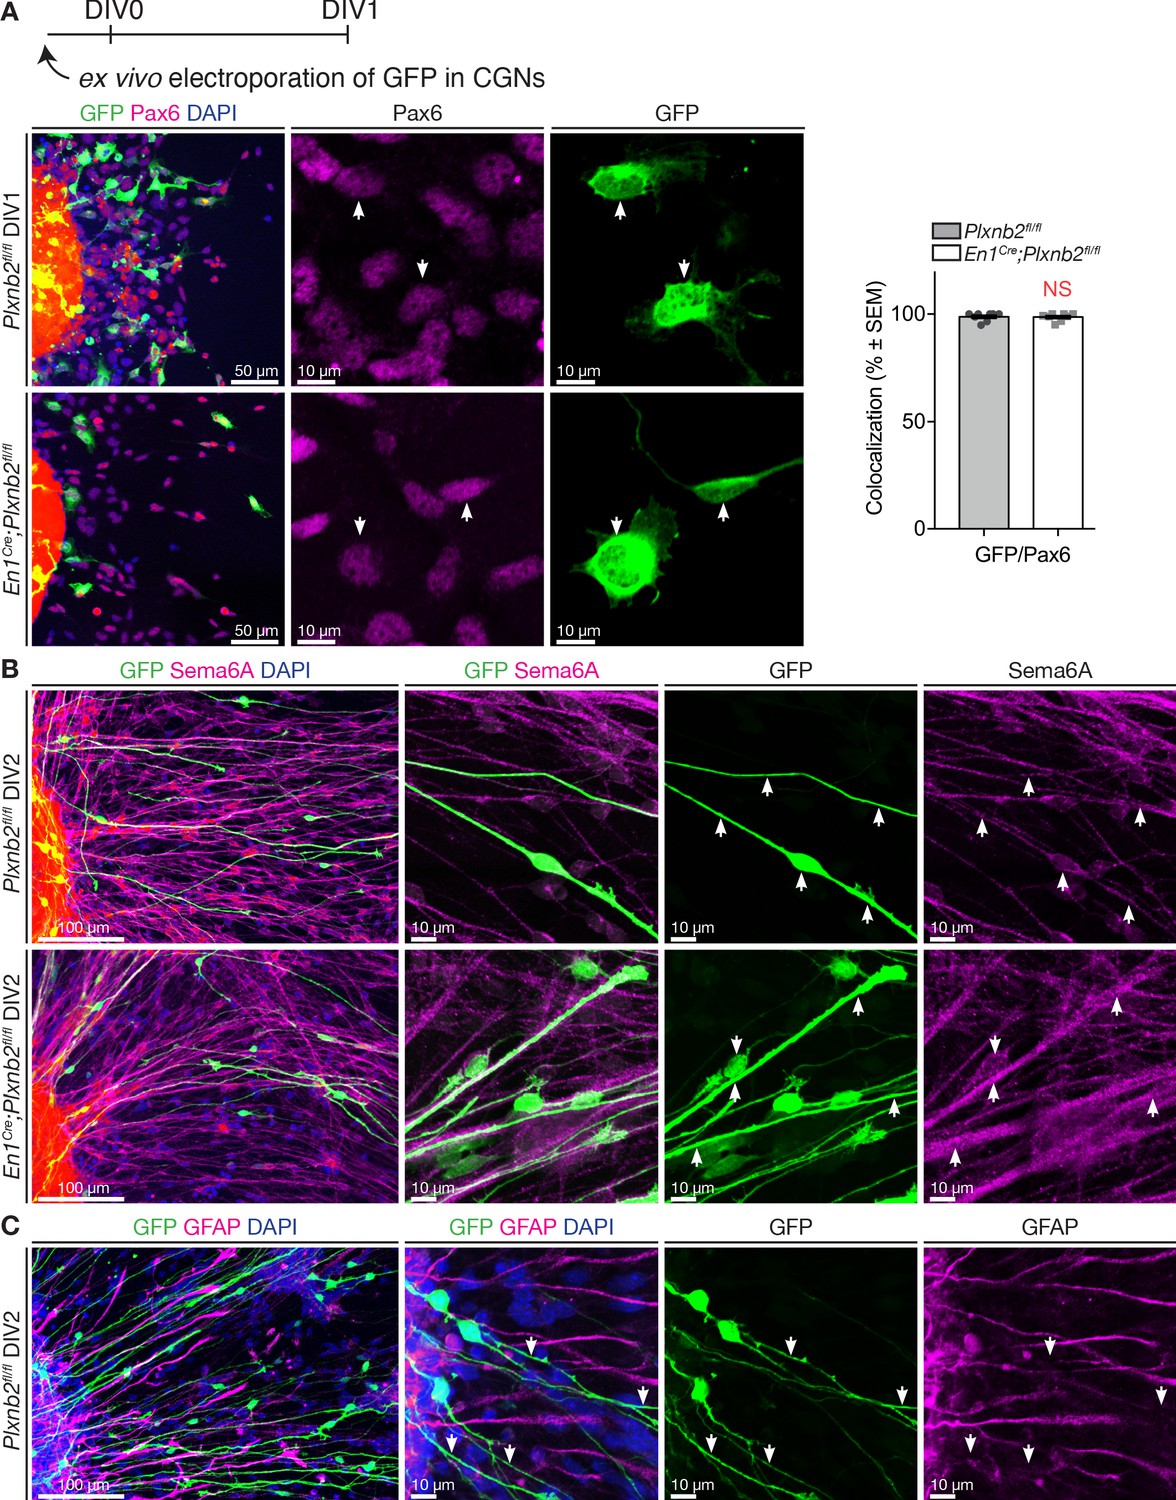
Electroporated cells migrating away from EGL explants have CGN identity.
(A) EGL explants from P4-P5 cerebella electroporated ex vivo with GFP just before culture. Immunocytochemistry for GFP and Pax6 with DAPI staining shows that in both controls and Plxnb2 mutants (almost) all GFP+ cells are also Pax6+ (white arrows; Pax6+/GFP+ ctl 98.77 ± 0.70% vs. mut 98.61 ± 0.64%, MWU(28.5) p=0.72, not significant). Error bars represent SEM. Cells were counted from 8 DIV1 explants from both genotypes (667 ctl and 348 mut cells) (Figure 7—figure supplement 2—source data 1). (B) Ex vivo GFP-electroporated EGL explants at DIV2 immunostained for GFP and Sema6A (tangentially migrating CGNs) and counterstained with DAPI. High magnifications show that GFP+ cells co-express Sema6a. (C) Ex vivo GFP electroporated EGL explants at DIV2 immunostained for GFP and GFAP and counterstained with DAPI. High magnifications show that GFP+ cells are not positive for glial markers. Scale bars: (A): 50 μm; (B, C): overview panels 100 μm, high magnifications 10 μm.
-
Figure 7—figure supplement 2—source data 1
Identity of cells migrating out of EGL explants.
- https://cdn.elifesciences.org/articles/60554/elife-60554-fig7-figsupp2-data1-v2.xlsx
Figure 8
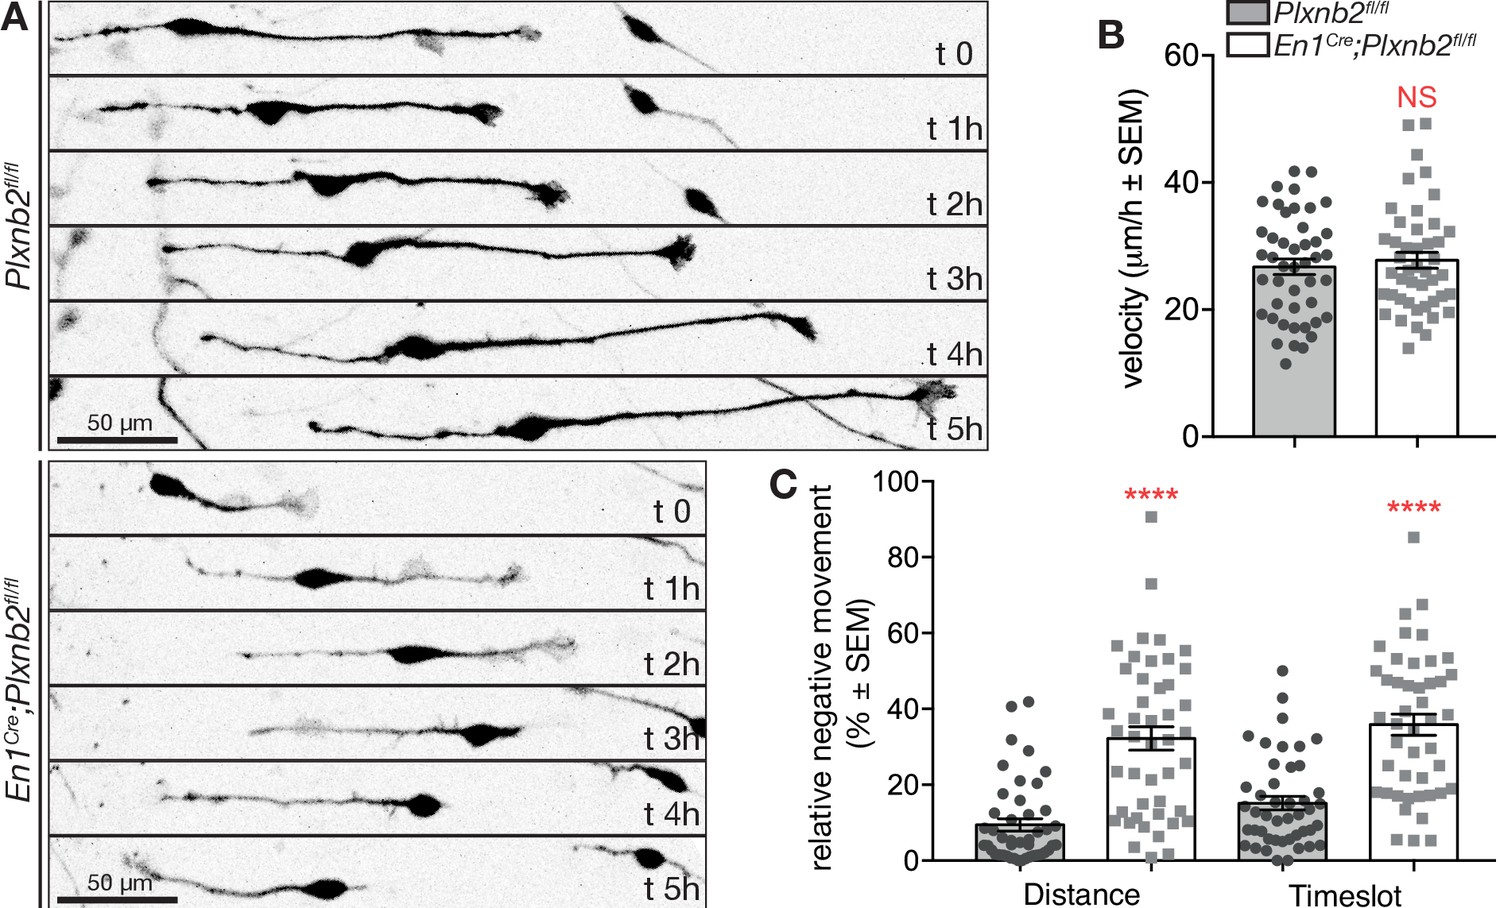
Plxnb2 mutant CGNs in culture display aberrant tangential migration.
(A) 15-minute-time-lapse confocal still images at t 0, 1, 2, 3, 4, and 5 hr showing GFP+ CGNs migrating from a DIV1 explant (located on the left side of the images). Scale bars 50 μm. (B) Bipolar CGNs migrate at an equal speed. (ctl: 26.75 ± 1.23 μm/h vs. mut: 27.77 ± 1.25 μm/h, MWU(973) p=0.75, not significant). Forty-five bipolar cells were tracked for each condition, from 13 ctl and 11 mut cultures from five independent experiments. Error bars represent SEM. (C) En1Cre;Plxnb2fl/fl CGNs cover more distance (ctl 9.42 ± 1.60% vs. mut 32.21 ± 3.10%, MWU(306) p<0.0001) and spend more time (ctl 15.15 ± 1.77% vs. mut 35.86 ± 2.80%, MWU(352.5) p<0.0001) going in negative direction (toward instead of away from the explant). Forty-five bipolar cells were tracked for each condition, from 13 ctl and 11 mut cultures. Error bars represent SEM. (Figure 8—source data 1).
-
Figure 8—source data 1
EGL explants: live imaging of bipolar CGN migration.
- https://cdn.elifesciences.org/articles/60554/elife-60554-fig8-data1-v2.xlsx
Figure 9
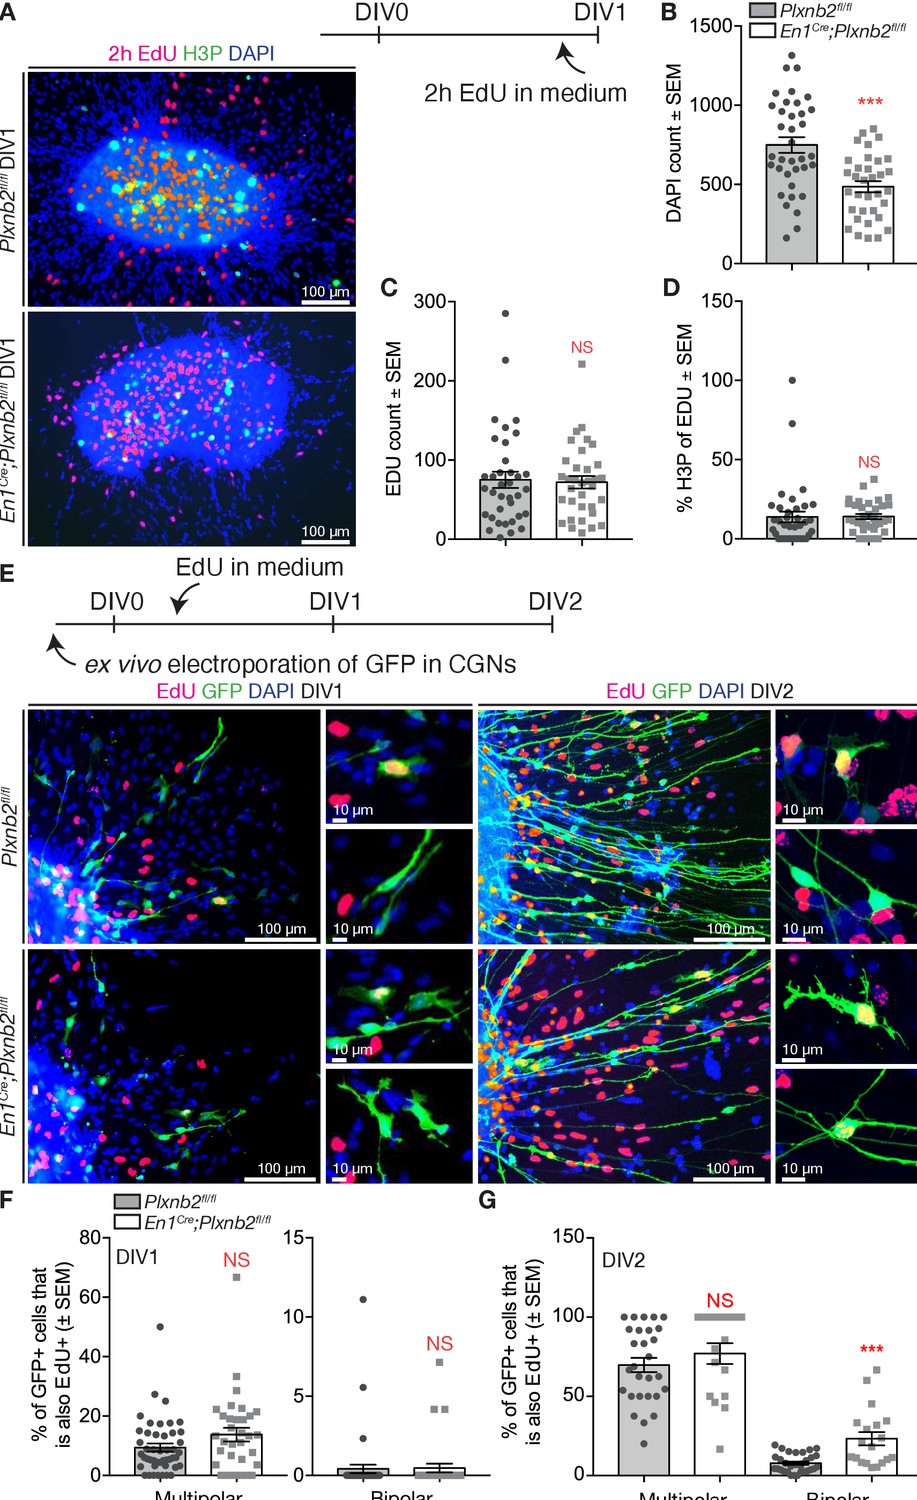
Aberrant proliferation of CGN precursors in Plxnb2 mutant explants.
(A) EGL explants from P4-P5 cerebella at DIV1. Two hr prior to fixation, 10 μM EdU was added to the culture medium. Cultures were stained for EdU, H3P, and DAPI. (B) The number of DAPI+ nuclei/migrating cells around DIV1 explants, is significantly decreased in Plxnb2 mutants (485.79 ± 34.77 cells) compared to controls (748.89 ± 53.54 cells; MWU(290.5) p=0.0001). Error bars represent SEM. 36 ctl and 34 mut explants were analyzed from three different experiments. (Figure 9—source data 1) (C) At DIV1, there is no significant difference in the total amount of EdU+ cells (that incorporated EdU in the last 2 hr) per explant. Ctl 75.19 ± 11.28 vs. mut 72.03 ± 7.85 cells (MWU(596.5) p=0.86. Error bars represent SEM. Thirty-six ctl and 34 mut explants were analyzed from three different experimental replicates (Figure 9—source data 1). (D) Likewise, the portion of EdU+ cells also positive for H3P (an M-phase marker) at the moment of fixation) is similar in controls (13.77 ± 3.80%) and mutants (14.10 ± 0.93%, MWU(477) p=0.11). Error bars represent SEM. Thirty-six ctl and 34 mut explants were analyzed from three different experimental repeats (Figure 9—source data 1). (E) EGL explants from P4-P5 cerebella electroporated with GFP ex vivo. Ten μM EdU was added to the medium after 6 hr of culture. Explants were fixed at DIV1 or DIV2 and EdU incorporation was quantified in multipolar and bipolar GFP+ cells. (F) Quantification of the proportion of multipolar and bipolar GFP+ CGNs that have taken up EdU in the past 18 hr at DIV1 (EdU administered from 6 to 24 hr after plating). Multipolar ctl: 9.394 ± 1.35% vs. mut 13.75 ± 2.31%, MWU(595) p=0.10, not significant; bipolar ctl: 0.41 ± 0.27% vs. mut 0.47 ± 0.27%, MWU(740) p=0.78, not significant. Error bars represent SEM. 2814 ctl and 890 mut GFP+ CGNs were counted from 47 ctl and 33 mut explants from three experimental replicates (Figure 9—source data 1). (G) Quantification of the proportion of multipolar and bipolar GFP+ CGNs that have taken up EdU in the past 42 hr at DIV2 (EdU administered from 6 to 48 hr after plating). Multipolar ctl: 69.81 ± 4.50% vs. mut 77.03 ± 6.55%, MWU(189) p=0.25, not significant. Bipolar ctl: 7.76 ± 1.00% vs. mut 23.3 ± 4.20%, MWU(113) p=0.0001. Error bars represent SEM. 2284 ctl and 617 mut GFP+ cells were counted from 32 ctl and 20 mut explants from three experimental repeats (Figure 9—source data 1). Scale bars 100 μm, high magnifications 10 μm.
-
Figure 9—source data 1
EGL explants: in vitro proliferation.
- https://cdn.elifesciences.org/articles/60554/elife-60554-fig9-data1-v2.xlsx
Figure 10 with 1 supplement
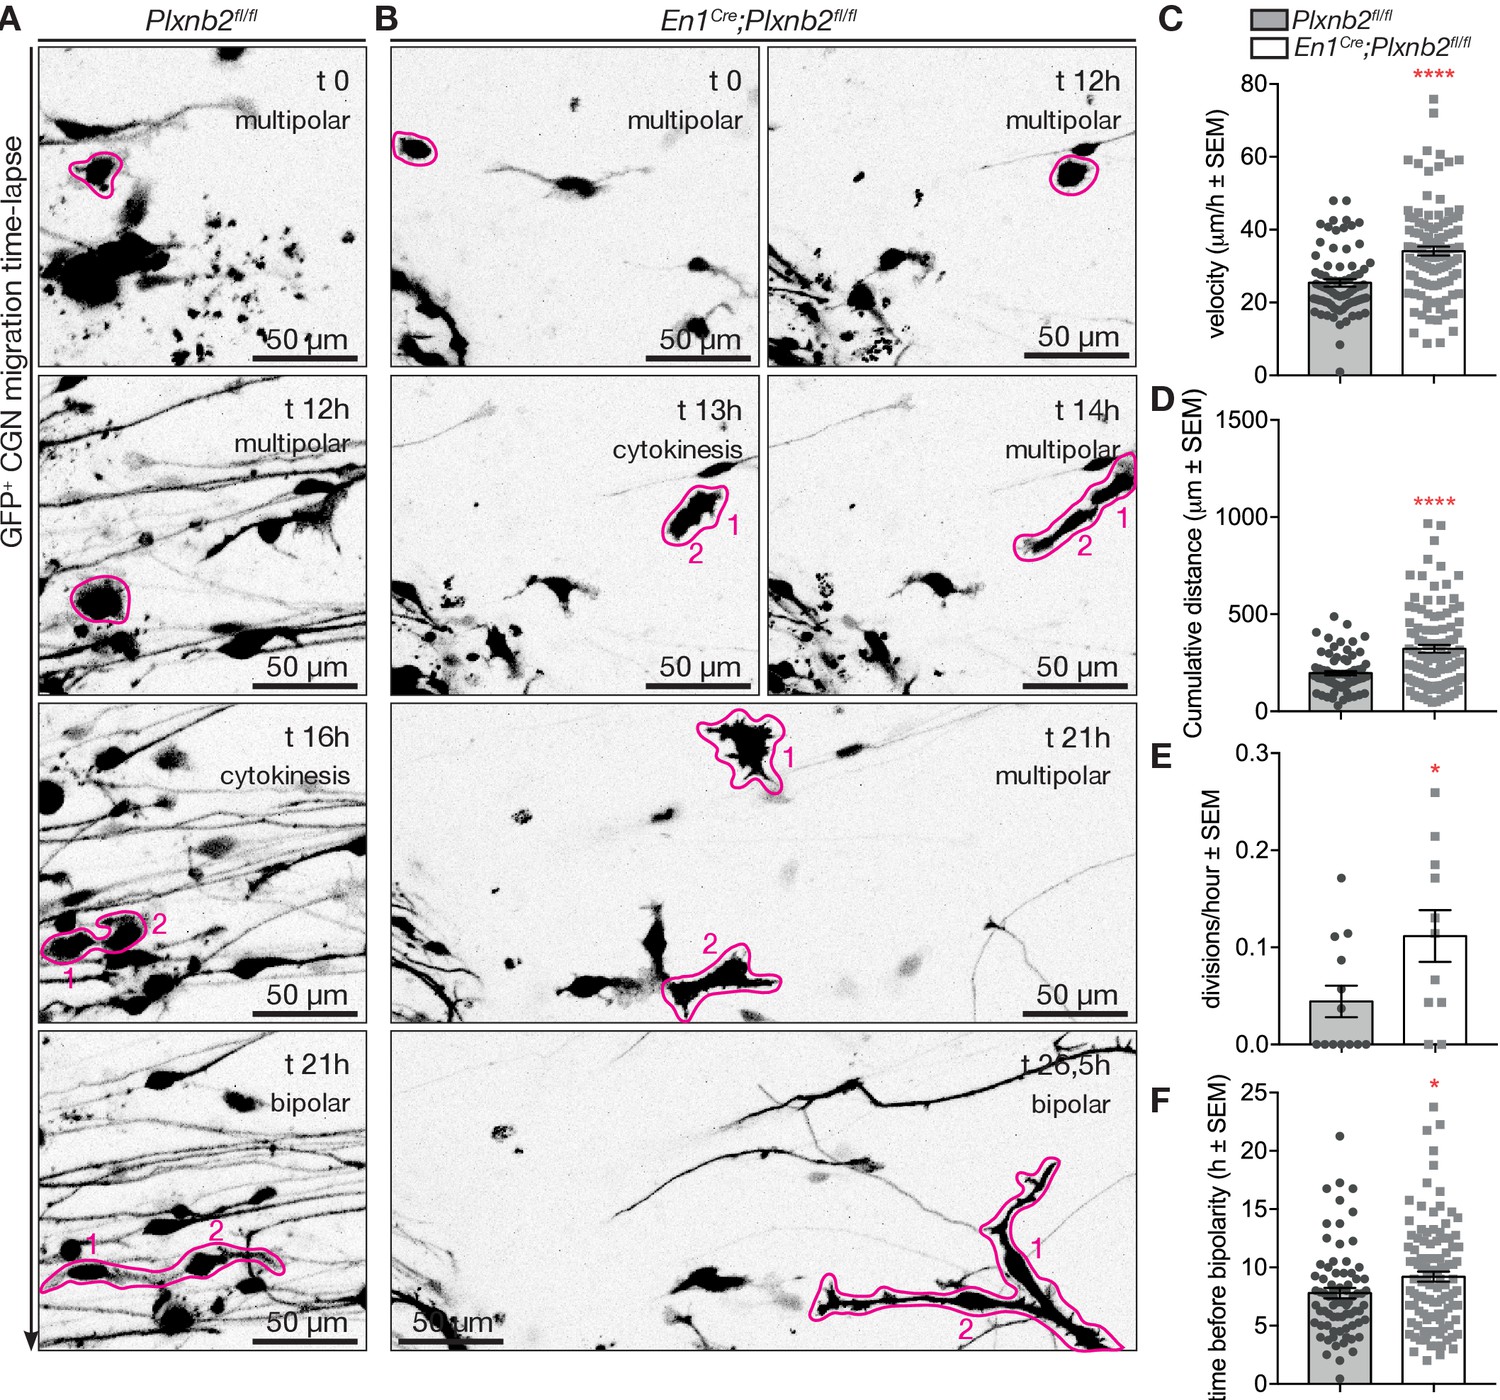
Aberrant CGN (precursor) motility before and after division in Plxnb2 mutant explants.
(A, B) Time-lapse confocal imaging series (21 hr) of GFP+ multipolar CGNs in control (A) and Plxnb2 mutant explants at DIV1. (A) In a control, a multipolar cell (outlined in pink at t 0 hr) divides (cytokinesis, t 16 hr) to give rise to two daughter cells (1 and 2) which later adopt a bipolar morphology. (B) In a Plxnb2 mutant, multipolar cells (outlined in pink) are more motile and the transition to the bipolar stage is delayed. Scale bars 50 μm. (C–F) Quantifications of multipolar cell velocity, cumulative distance before cytokinesis, time that daughter cells take to become bipolar after cytokinesis, and the amount of visible divisions of GFP+ cells per hour. Error bars represent SEM. 75 ctl and 107 mut multipolar GFP+ CGNs were tracked from 13 ctl and 11 mutant explants from five different experimental repeats. (C) Velocity ctl 25.41 ± 1.04 μm/h vs. mut 34.11 ± 1.24 μm/h, MWU(2279) p<0.0001 (Figure 10—source data 1). (D) Cumulative distance ctl 196.3 ± 11.08 μm vs. mut 321.8 ± 19.73 μm, MWU(2516) p<0.0001 (Figure 10—source data 1). (E) Time before bipolarity ctl 7.80 ± 0.45 hr vs. 9.21 ± 0.44 hr, MWU(3254) p=0.0298 (Figure 10—source data 1). (F) Divisions per hour ctl 0.044 ± 0.016 vs. mut 0.11 ± 0.027, MWU(36) p=0.034. (Figure 10—source data 1).
-
Figure 10—source data 1
EGL explants: live imaging of multipolar CGNs.
- https://cdn.elifesciences.org/articles/60554/elife-60554-fig10-data1-v2.xlsx
Figure 10—figure supplement 1
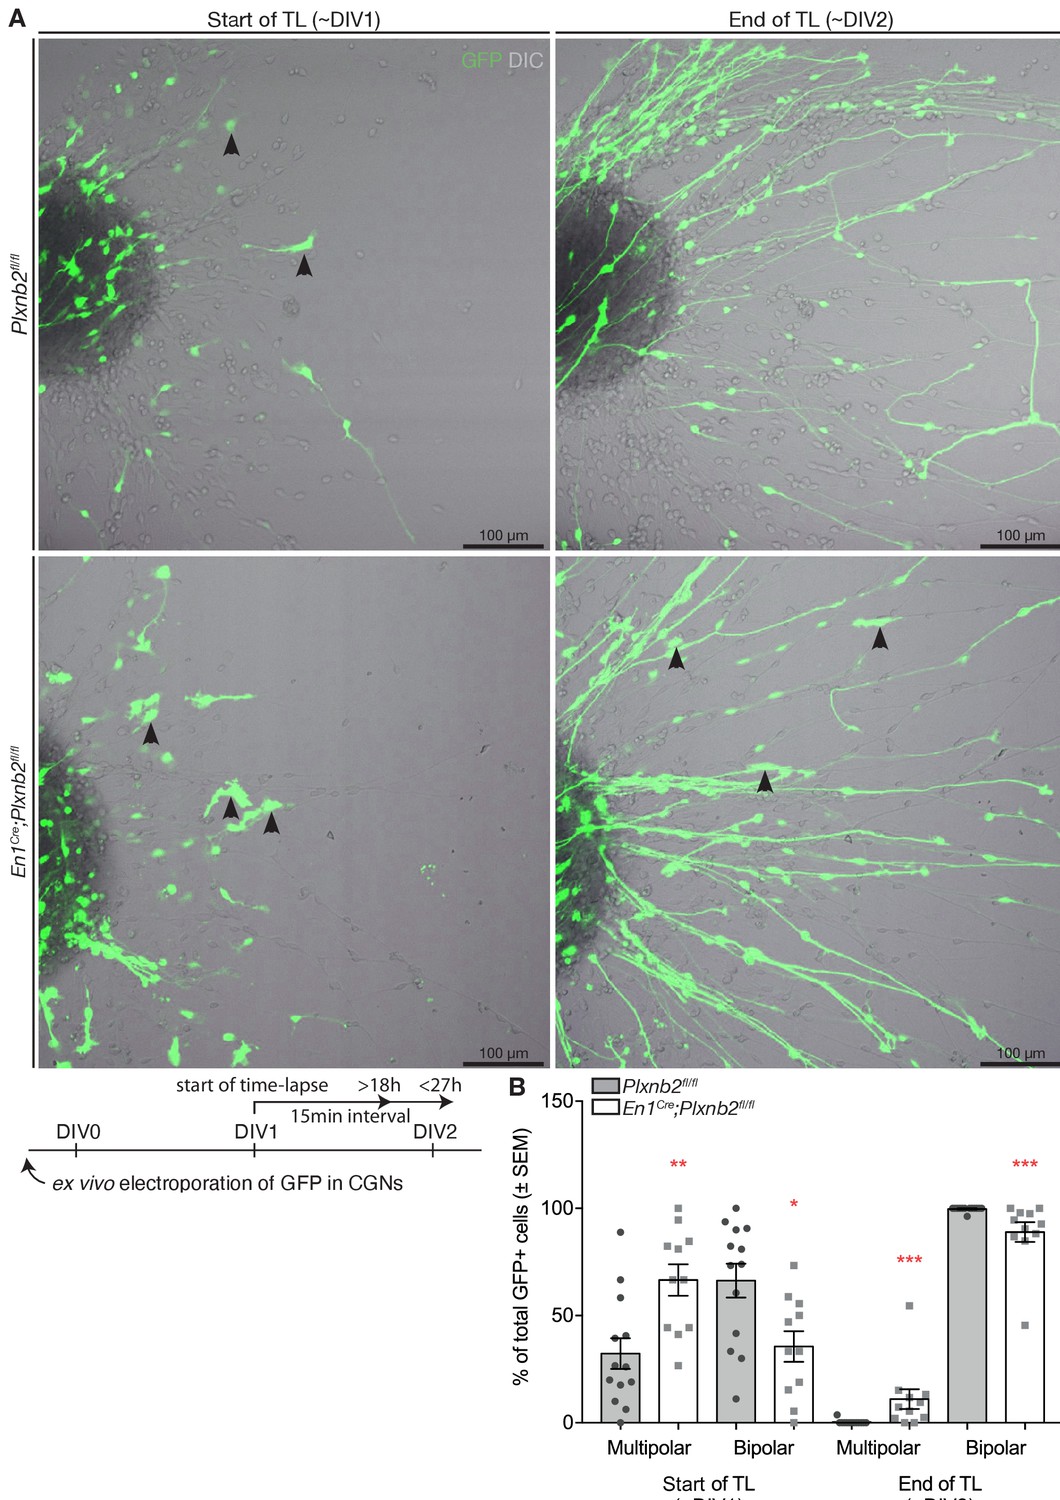
Quantification of the distribution of multi- and bipolar CGNs during time-lapse.
(A) Still images at the beginning (t = 0 hr, DIV1) and at the end (t = 18 hr, DIV2) of a time-lapse imaging series of migrating GFP+ CGNs in EGL explants. Plxnb2 mutant explants show relatively more multipolar-shaped CGNs (arrowheads) compared to controls. After 18 hr of imaging, when all CGNs that exited control explants turned bipolar, mutant explants still contain multipolar CGNs (arrowheads). Schematic shows experimental design. Fifteen min time-lapse recordings were performed from 24 hr (DIV1) after plating (t 0), and continued for 18–27 hr. (B) Quantification of the percentages of multipolar- or bipolar-shaped GFP+ cells at the beginning and at the end of time-lapse. Beginning of time-lapse (DIV1) multipolar ctl 32.28 ± 7.17% vs. mut 66.61 ± 7.33%, MWU(20.5) p=0.002; bipolar ctl 66.27 ± 7.89% vs. mut 35.56 ± 7.12%, MWU(28.5) p=0.0111. End of time-lapse (DIV2) multipolar ctl 0.28 ± 0.28% vs. mut 11.04 ± 4.63%, MWU(16) p=0.0001; bipolar ctl 99.72 ± 0.28% vs. mut 88.96 ± 4.63%, MWU(16) p=0.0001. 745 ctl and 414 mut GFP+ cells were counted at the end of recordings from 13 ctl and 11 mut explants from five experimental repeats. (Figure 10—figure supplement 1—source data 1) Scale bars: 100 μm.
-
Figure 10—figure supplement 1—source data 1
Morphology of CGNs during live imaging.
- https://cdn.elifesciences.org/articles/60554/elife-60554-fig10-figsupp1-data1-v2.xlsx
Videos
Video 1
3D movie of P4 iDISCO+ cleared Plxnb2fl/fl and En1Cre;Plxnb2fl/fl cerebella.
All cell nuclei are stained with TO-PRO-3, Pax6 and FoxP2-staining is used to visualize CGNs and Purkinje cell bodies, respectively.
Video 2
3D movie of P14 iDISCO+ cleared Plxnb2fl/fl and En1Cre;Plxnb2fl/fl cerebella.
All cell nuclei are stained with TO-PRO-3.
Video 3
3D movie of P30 iDISCO+ cleared Plxnb2fl/fl and En1Cre;Plxnb2fl/fl cerebella.
All cell nuclei are stained with TO-PRO-3.
Video 4
3D movie of P20 iDISCO+ cleared En1Cre;Plxnb2fl/fl cerebellum stained with TO-PRO-3 for all cell nuclei and FoxP2 to visualize Purkinje cell bodies.
Video 5
3D movie of P65 iDISCO+ cleared Plxnb2fl/fl cerebellum electroporated at P7 with GFP.
Whole mount immunostaining was performed with GFP to stain electroporated CGNs, FoxP2 to visualize Purkinje cell bodies, and TO-PRO-3 to stain all cell nuclei and visualize cerebellar anatomy.
Video 6
3D movie of P65 iDISCO+ cleared En1Cre;Plxnb2fl/fl cerebellum electroporated at P7 with GFP.
Whole mount immunostaining was performed with GFP to stain electroporated CGNs, FoxP2 to visualize Purkinje cell bodies, and TO-PRO-3 to stain all cell nuclei and visualize cerebellar anatomy.
Video 7
Representative examples of confocal time-lapse recording of EGL explant cultures of P4-P5 Plxnb2fl/fl and En1Cre;Plxnb2fl/fl cerebella with 15 min interval, starting from DIV1.
Cerebella were electroporated ex vivo with GFP to visualize individual CGNs and follow their migration over time (some striking examples are pseudo-colored). Control CGNs with a bipolar morphology migrate away from the explant in a straight direction. Plxnb2 mutant CGNs change their direction of migration multiple times and cover long distances in reverse direction (back to the explant).
Video 8
Representative examples of confocal time-lapse recording of EGL explant cultures of P4-P5 Plxnb2fl/fl and En1Cre;Plxnb2fl/fl cerebella with 15-min interval, starting from DIV1.
Cerebella were electroporated ex vivo with GFP to visualize individual CGNs and follow their migration over time.
Tables
Key resources table
| Reagent type (species) or resource | Designation | Source or reference | Identifiers | Additional information |
|---|---|---|---|---|
| Strain; strain background (Mus musculus) | En1Cre (C57BL/6J) | DOI:10.1101/gad.14.11.1377 | En1tm2(cre)Wrst/J RRID:IMSR_JAX:007916 | |
| Strain; strain background (Mus musculus) | Wnt1-Cre (C57BL/6J) | DOI:10.1002/dvdy.20611 | B6.Cg-E2f1tg(Wnt1-cre)2Sor/J RRID:IMSR_JAX:022501 | |
| Strain; strain background (Mus musculus) | Plxnb2-/- | DOI:10.1523/JNEUROSCI.4710-06.2007 | Plxnb2tm1Matl RRID:MGI:4881705 | Gift from Roland Friedel |
| Strain; strain background (Mus musculus) | Plxnb2 cKO | DOI:10.1523/JNEUROSCI.5381-06.2007 | ||
| Antibody | Anti-Calbindin D-28k (Rabbit antiserum) | Swant | Cat# CB38, RRID:AB_2721225 | IF(1:1000), |
| Antibody | Anti-Calbindin D-28k (Mouse monoclonal) | Swant | Cat# 300, RRID:AB_10000347 | IF(1:1000) |
| Antibody | Anti-Foxp2 (N16) (Goat polyclonal) | Santa Cruz | Cat# sc-21069, RRID:AB_2107124 | IF(1:1000) |
| Antibody | Anti-Glial fibrillary acidic protein (GFAP) (Mouse monoclonal) | Millipore | Cat# MAB360, RRID:AB_11212597 | IF(1:500) |
| Antibody | Anti-Green Fluorescent Protein (GFP) (Rabbit polyclonal) | ThermoFisher Scientific | Cat# A-11122, RRID:AB_221569 | IF(1:2000) |
| Antibody | Anti-Green Fluorescent Protein (GFP) (Chicken polyclonal) | Aves | Cat# GFP-1010, RRID:AB_2307313 | IF(1:2000) |
| Antibody | Anti-Phospho-Histone H3(Ser10) (Rabbit polyclonal) | Cell Signaling | Cat# 9701; RRID:AB_331535 | IF(1:1000) |
| Antibody | Anti-Ki67 (Rabbit polyclonal) | Abcam | Cat# Ab15580; RRID:AB_443209 | IF(1:500) |
| Antibody | Anti-Olig-2 (Rabbit monoclonal) | Millipore | Cat# AB9610; RRID:AB_10141047 | IF(1:500) |
| Antibody | Anti-Pax6 (Rabbit polyclonal) | Millipore | Cat# AB2237; RRID:AB_1587367 | IF(1:1000) |
| Antibody | Anti-Plexin-B2 (Armenian Hamster monoclonal) | Novus | Cat# NBP1- 43310; RRID:AB_10006672 | IF(1:1000) |
| Antibody | Anti-Sema6A (Goat polyclonal) | R and D systems | Cat# AF1615; RRID:AB_2185995 | IF(1:500) |
| Antibody | Anti-Contactin-2/TAG1 (Goat polyclonal) | R and D systems | Cat# AF4439; RRID:AB_2044647 | IF (1:500) |
| Antibody | Anti- beta-Tubulin III (Rabbit polyclonal) | Sigma-Aldrich | Cat# T2200; RRID:AB_262133 | IF (1:1000) |
| Antibody | Anti- VGLUT1 (Guinea pig polyclonal) | Millipore | Cat# AB5905; RRID:AB_2301751 | IF (1:3000) |
| Antibody | Donkey Anti-Rabbit IgG (H + L) Alexa Fluor 488 | Jackson Immunoresearch | Cat# 711-545-152; RRID:AB_2313584 | IF (1:750) |
| Antibody | Donkey Anti-Rabbit IgG (H + L) Cy3 | Jackson Immunoresearch | Cat# 711-165-152; RRID:AB_2307443 | IF (1:750) |
| Antibody | Donkey Anti-Rabbit IgG (H + L) Alexa Fluor 647 | Jackson Immunoresearch | Cat# 711-605-152; RRID:AB_2492288 | IF (1:750) |
| Antibody | Bovine Anti-Goat IgG (H + L) Alexa Fluor 647 | Jackson Immunoresearch | Cat# 805-605-180; RRID:AB_2340885 | IF (1:750) |
| Antibody | Donkey Anti-Goat IgG (H + L) Cy3 | Jackson Immunoresearch | Cat# 705-165-147; RRID:AB_2307351 | IF (1:750) |
| Antibody | Donkey Anti-Mouse IgG (H + L) Alexa Fluor 647 | Jackson Immunoresearch | Cat# 715-605-150; RRID:AB_2340862 | IF (1:750) |
| Antibody | Donkey Anti-Chicken IgG (H + L) Alexa Fluor 488 | Jackson Immunoresearch | Cat# 703-545-155; RRID:AB_2340375 | IF (1:750) |
| Antibody | Donkey Anti-Chicken IgY (H + L) Cy3 | Jackson Immunoresearch | Cat# 703-165-155; RRID:AB_2340363 | IF (1:750) |
| Antibody | Goat Anti-Armenian Hamster IgG (H + L) Alexa Fluor 488 | Jackson Immunoresearch | Cat# 127-545-160; RRID:AB_2338997 | IF (1:750) |
| Antibody | Goat Anti-Armenian Hamster IgG (H + L) Cy3 | Jackson Immunoresearch | Cat# 127-165-160; RRID:AB_2338989 | IF (1:750) |
| Antibody | Donkey Anti-Guinea Pig IgG (H + L) FITC | Jackson Immunoresearch | Cat# 706-095-148; RRID:AB_2340453 | IF (1:750) |
| Antibody | Donkey Anti-Guinea Pig IgG (H + L) Cy3 | Jackson Immunoresearch | Cat# 706-165-148; RRID:AB_2340460 | IF (1:750) |
| Antibody | Donkey Anti-Goat IgG (H + L) Alexa Fluor 488 | Thermo Fisher Scientific | Cat# A-11055; RRID:AB_25341020 | IF (1:750) |
| Antibody | Donkey Anti-Goat IgG (H + L) Alexa Fluor 555 | Thermo Fisher Scientific | Cat# A21432; RRID:AB_2535853 | IF (1:750) |
| Antibody | Donkey Anti-Mouse IgG (H + L) Alexa Fluor 488 | Thermo Fisher Scientific | Cat# A21202; RRID:AB_141607 | IF (1:750) |
| Other | Hoechst 33342 | Thermo Fisher Scientific | Cat# H3570 | IF (1:1000) |
| Commercial assay or kit | Click-iT EdU Cell Proliferation Kit for Imaging,Alexa Fluor 647 dye | Thermo Fisher Scientific | Cat# C10340 | |
| Chemical compound, drug | Gelatin | VWR Chemicals | Cat# 24350.262 CAS Number: 9000-70-8 | |
| Chemical compound, drug | Thimerosal | Sigma-Aldrich | Cat# T8784-5g CAS Number: 54-64-8 | |
| Chemical compound, drug | TritonX-100 | Sigma-Aldrich | Cat# X100-500ml CAS Number: 9002-93-1 | |
| Chemical compound, drug | SYBR Gold nucleic acid stain | Thermo Fisher Scientific | Thermo Fisher Scientific:S11494 | |
| Software, algorithm | Fiji | NIH | RRID:SCR_002285 | Analysis |
| Software, algorithm | GraphPad Prism | GraphPad | RRID:SCR_002798 | Analysis |
| Software, algorithm | Imaris | Oxford Instruments | RRID:SCR_007370 | Analysis |
| Software, algorithm | iMovie | Apple | http://www.apple.com/fr/imovie/ | Analysis |
Additional files
Download links
A two-part list of links to download the article, or parts of the article, in various formats.
Downloads (link to download the article as PDF)
Open citations (links to open the citations from this article in various online reference manager services)
Cite this article (links to download the citations from this article in formats compatible with various reference manager tools)
Plexin-B2 controls the timing of differentiation and the motility of cerebellar granule neurons
eLife 10:e60554.
https://doi.org/10.7554/eLife.60554


