Light-regulated allosteric switch enables temporal and subcellular control of enzyme activity
- Department of Pharmacology and Regenerative Medicine, The University of Illinois at Chicago, College of Medicine, United States
- Wallace H. Coulter Department of Biomedical Engineering, Georgia Institute of Technology and Emory University School of Medicine, United States
- The David H. Koch Institute for Integrative Cancer Research, Massachusetts Institute of Technology, United States
- Center for Precision Cancer Medicine, Massachusetts Institute of Technology, United States
- Department of Biological Engineering, Massachusetts Institute of Technology, United States
- Program in Computational and Systems Biology, Massachusetts Institute of Technology, United States
- University of Illinois Cancer Center, The University of Illinois at Chicago, United States
- Division of Cardiology, Department of Medicine, The University of Illinois, College of Medicine, United States
- Marsico Lung Institute, Cystic Fibrosis Center and Department of Medicine, University of North Carolina, United States
Figures
Figure 1 with 3 supplements
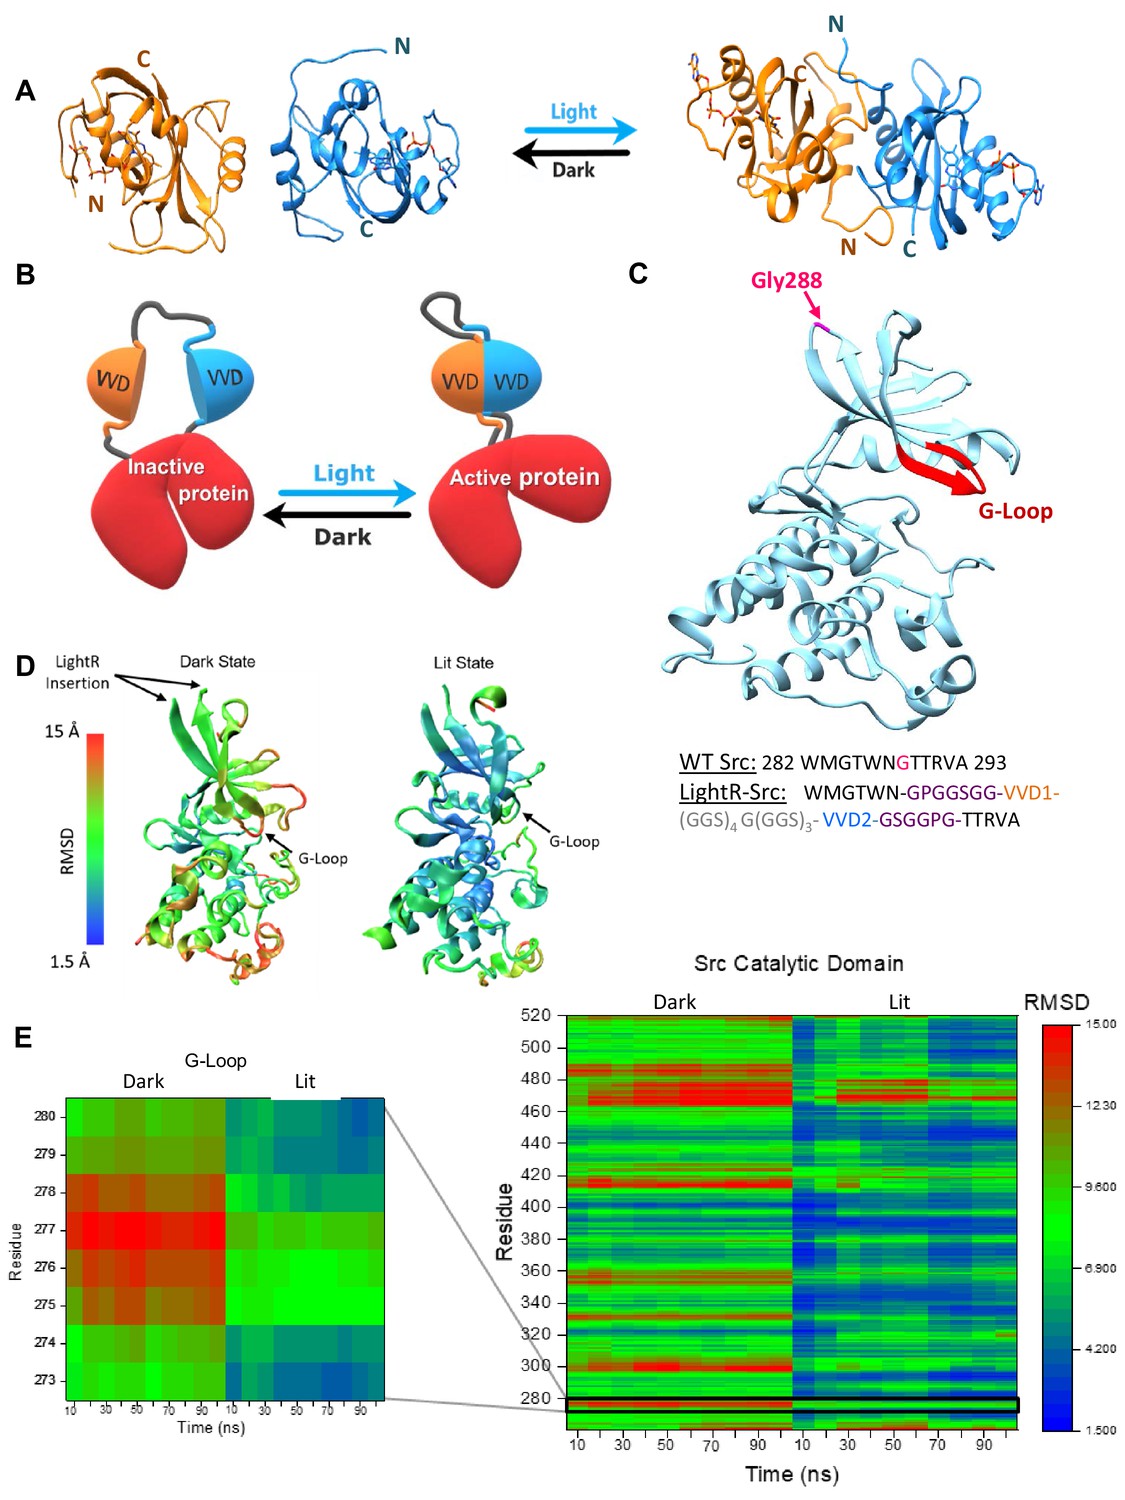
LightR-Src design and molecular dynamics simulations.
(A) Crystal structures of two Vivid monomers in the dark state (PDB: 2PD7), and the dimer in the lit state (PDB: 3RH8). (B) Cartoon representation of LightR design. Two tandemly connected VVD photoreceptors inserted in the catalytic domain disrupt the catalytic activity of the protein in the dark. Dimerization of VVD in response to blue light restores the protein activity. (C) Crystal structure of c-Src catalytic domain (PDB:1Y57) with the insertion site G288 in magenta. The insertion site is connected to the catalytically important G-loop , highlighted in red, by a β-strand. Schematic below shows the amino acid sequence of the wild type Src residues around the insertion site and the resulting construct with LightR insertion. Insertion site G288 in WT Src is shown in magenta, asymmetric flexible GPGGSGG and GSGGPG linkers are depicted in purple, VVD proteins are shown in orange and blue, and 22-residue flexible linker is shown in grey. (D, E) Computational modeling of structural changes in the catalytic domain of LightR-Src. Color scale reflects the degree of deviation from the position in the crystal structure of Src (PDB: 1Y57). (D) Structural models reflecting the average RMSD of each residue for the dark and the lit states. (E) Comparative heat map of RMSD values for each residue over the course of the simulation for Src catalytic domain in lit and dark states. Zoomed-in insert shows changes in the G-loop. RMSD values represent an average from three independent 100 ns simulations for each state, lit and dark.
-
Figure 1—source data 1
Supplementary source data for Figure 1D,E, and Figure 1—figure supplements 1–3.
- https://cdn.elifesciences.org/articles/60647/elife-60647-fig1-data1-v3.xlsx
Figure 1—figure supplement 1
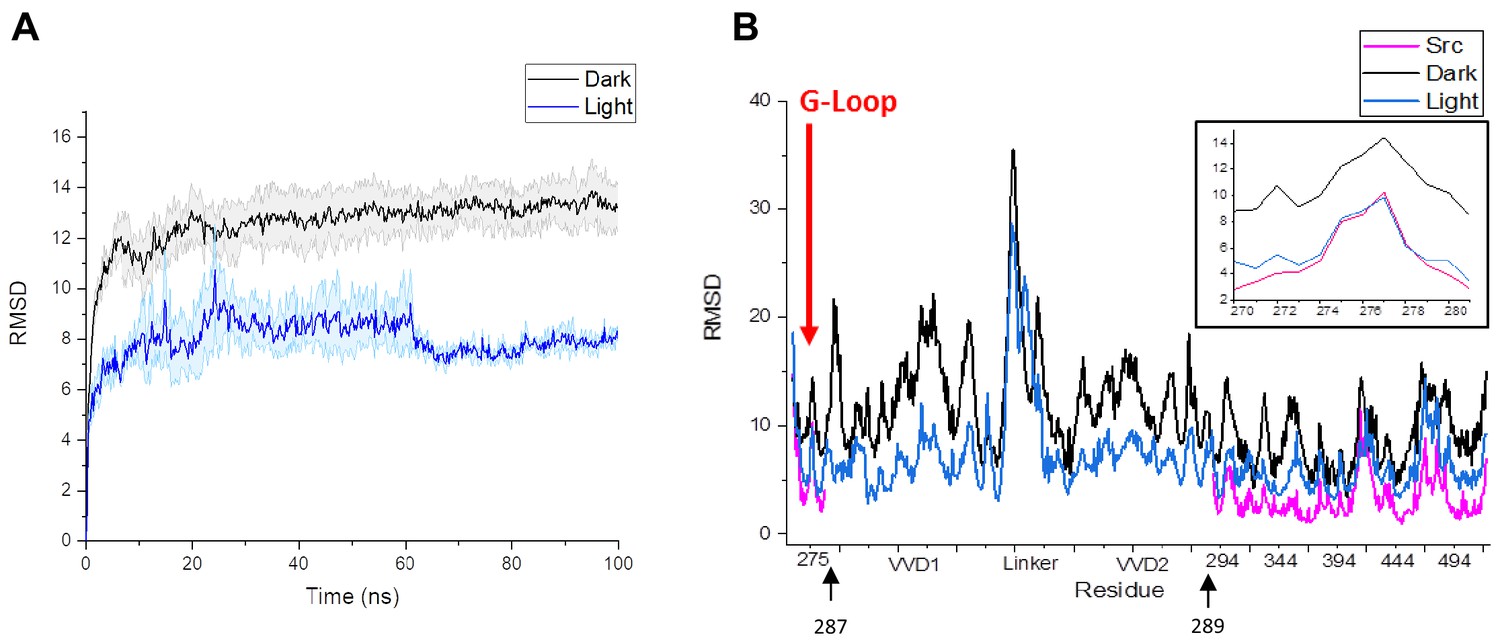
Comparison of RMSD values for residues in LightR-Src and wild type Src.
(A) Plot of average RMSD of the backbone for the three lit and dark state simulations, demonstrating equilibration of the system. Error bars represent standard error of the mean. (B) Comparison of average RMSD of all catalytic domain residues in the lit and dark state of LightR-Src, as well as the wild type active Src. The insert in the figure magnifies the G-Loop RMSD, marked with red arrow. Black arrows indicate that LightR domain was inserted between amino acids 287 and 289 in Src.
Figure 1—figure supplement 2

Cross-correlation maps of the dark and lit state of LightR-Src.
Cross-correlation maps of the lit and dark state of LightR-Src. Residues with uncorrelated motion have a correlation of 0 while perfectly correlated motion has a value of 1. Lower heat maps represent the correlation between G-loop residues and all other residues within LightR-Src catalytic domain in the lit and dark states. Black arrows indicate that LightR domain was inserted between amino acids 287 and 289 in Src.
Figure 1—figure supplement 3
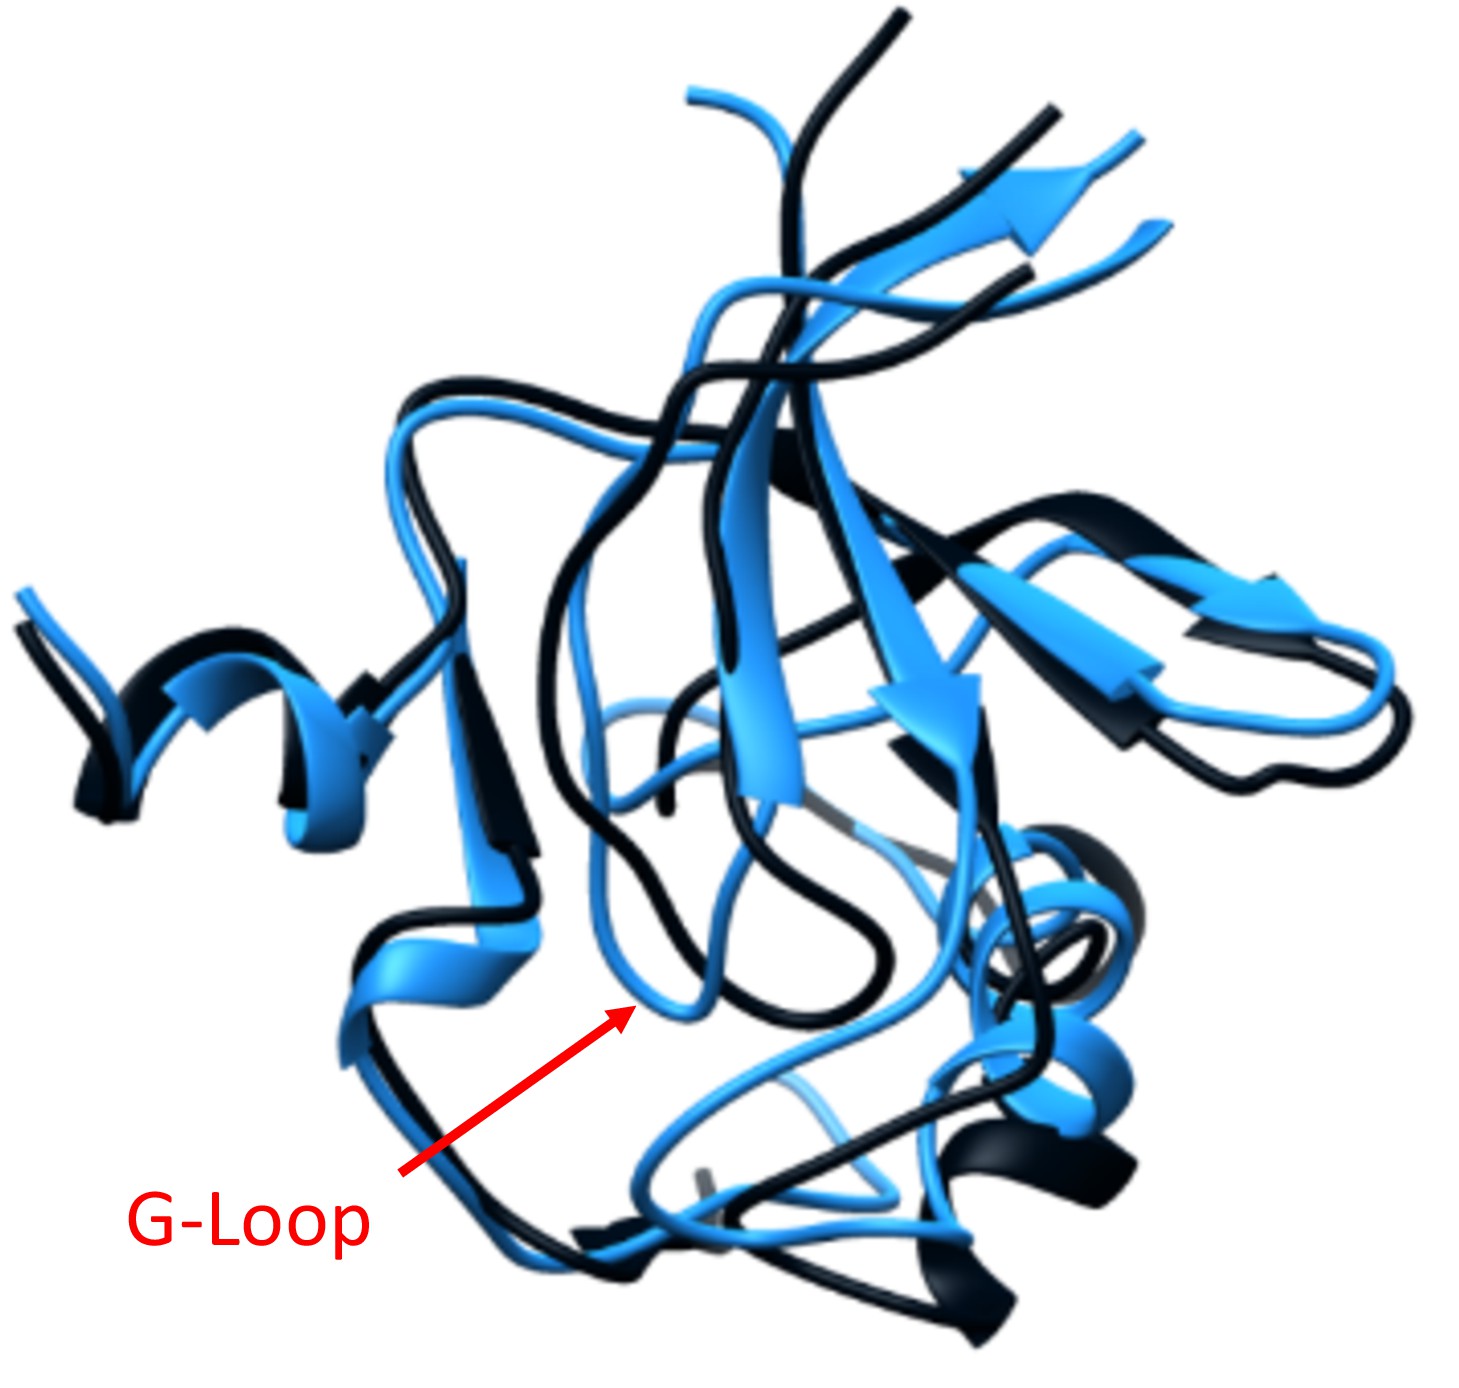
G-Loop displacement caused by the LightR switch in the dark.
Overlay of the averaged structures of the N-Lobe of Src catalytic domain in the lit (blue) and dark (dark grey) states from the MD simulations. The G-Loop is indicated with an arrow; showing displacement of the G-Loop position in the dark state.
Figure 2 with 4 supplements
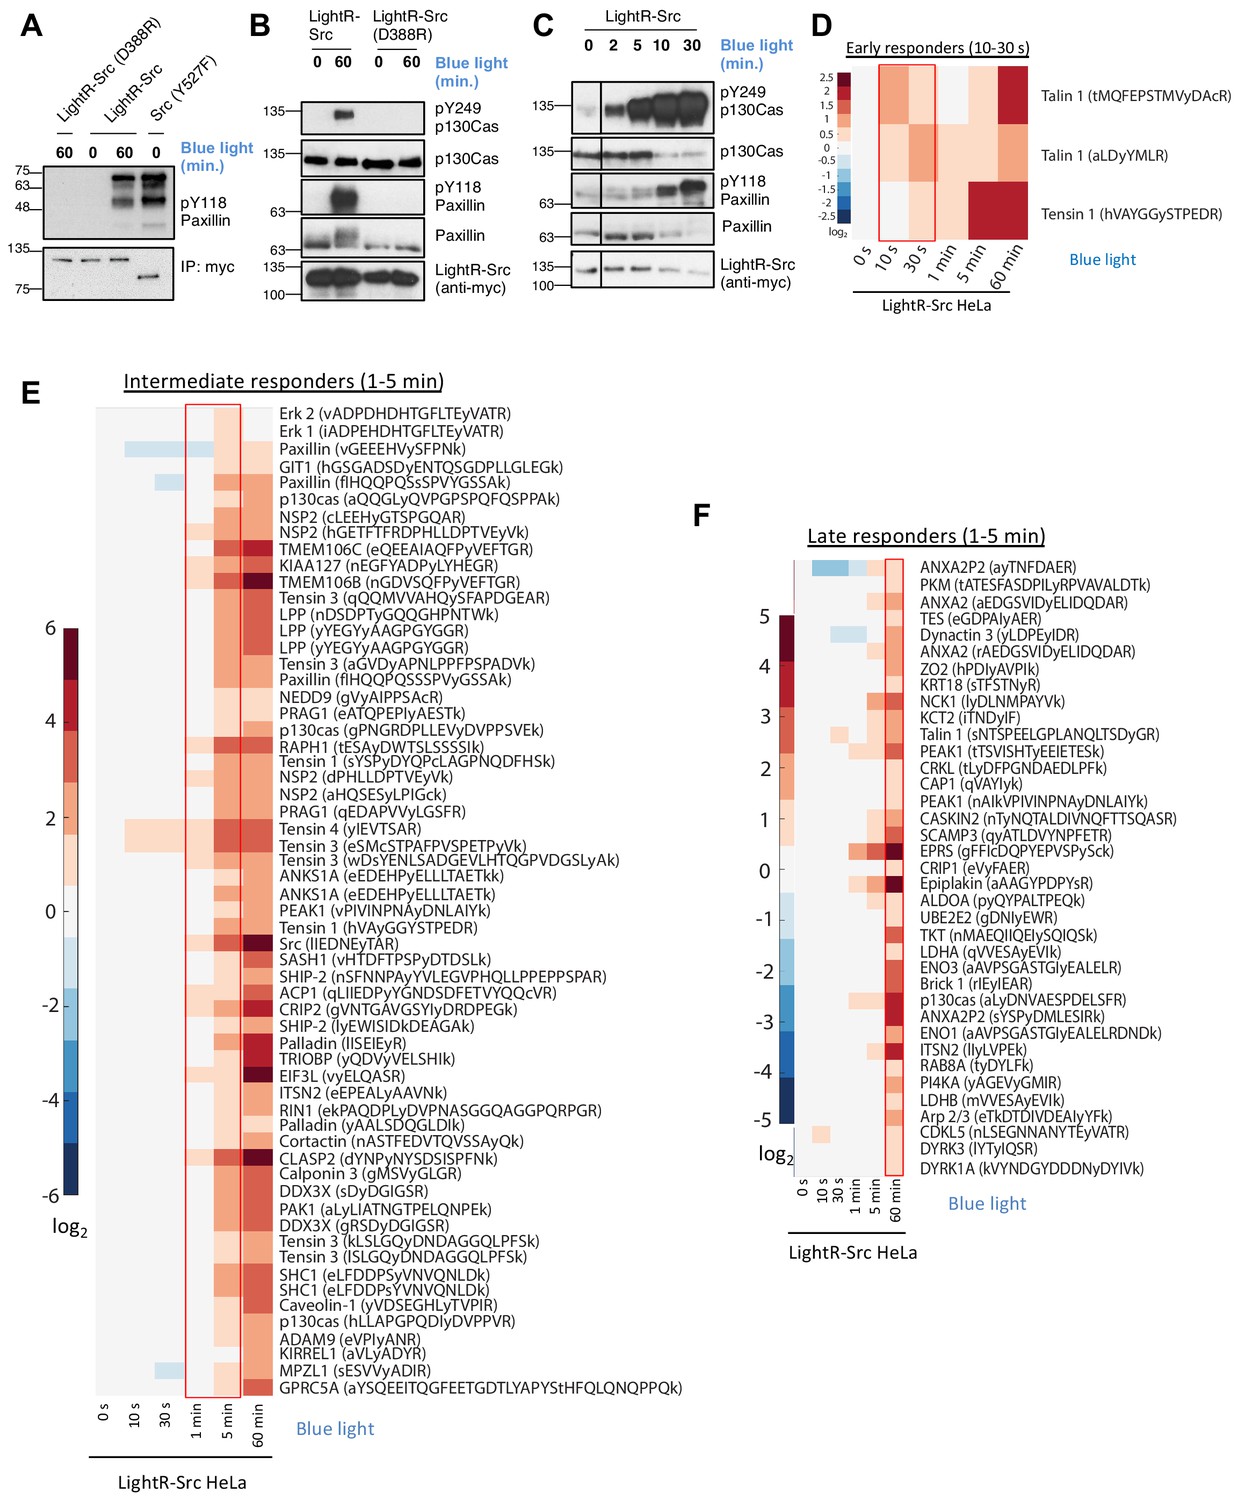
Characterization of LightR-Src.
(A) Analysis of LightR-Src using in vitro kinase assay. LinXE cells transiently expressing the indicated Src constructs bearing an mCherry and a myc tag at the C-terminus were exposed to continuous blue light for 60 min where indicated. Src constructs were immunoprecipitated and their ability to phosphorylate purified N-terminal fragment of paxillin was assessed using an in vitro kinase assay. (B, C) Phosphorylation of endogenous paxillin and p130Cas in response to activation of LightR-Src in living cells. LinXE cells transiently expressing indicated LightR-Src construct bearing a tandem mCherry-myc tag at the C-terminus were continuously illuminated with blue light for the specified periods of time. Cell lysates were probed for phosphorylation of Src substrates, paxillin and p130Cas. All experiments were repeated at least three times with similar results. (D-F), Phosphoproteomics analysis of temporal changes in protein phosphorylation induced by LightR-Src activation in HeLa cells stably expressing LightR-Src-mCherry-myc. Heatmaps represent three categories defined by the initial time of upregulation: Early responders (D, 10–30 s), Intermediate responders (E, 1–5 min), and Late responders (F, 1 hr). Phosphopeptides are clustered using the correlation distance metric. Columns represent relative abundances of a phosphopeptide at given timepoints normalized to 0 s. Data shows average of three independent experiments.
-
Figure 2—source data 1
Supplementary source data for Figure 2D–F and Figure 2—figure supplements 2–4.
- https://cdn.elifesciences.org/articles/60647/elife-60647-fig2-data1-v3.xlsx
Figure 2—figure supplement 1
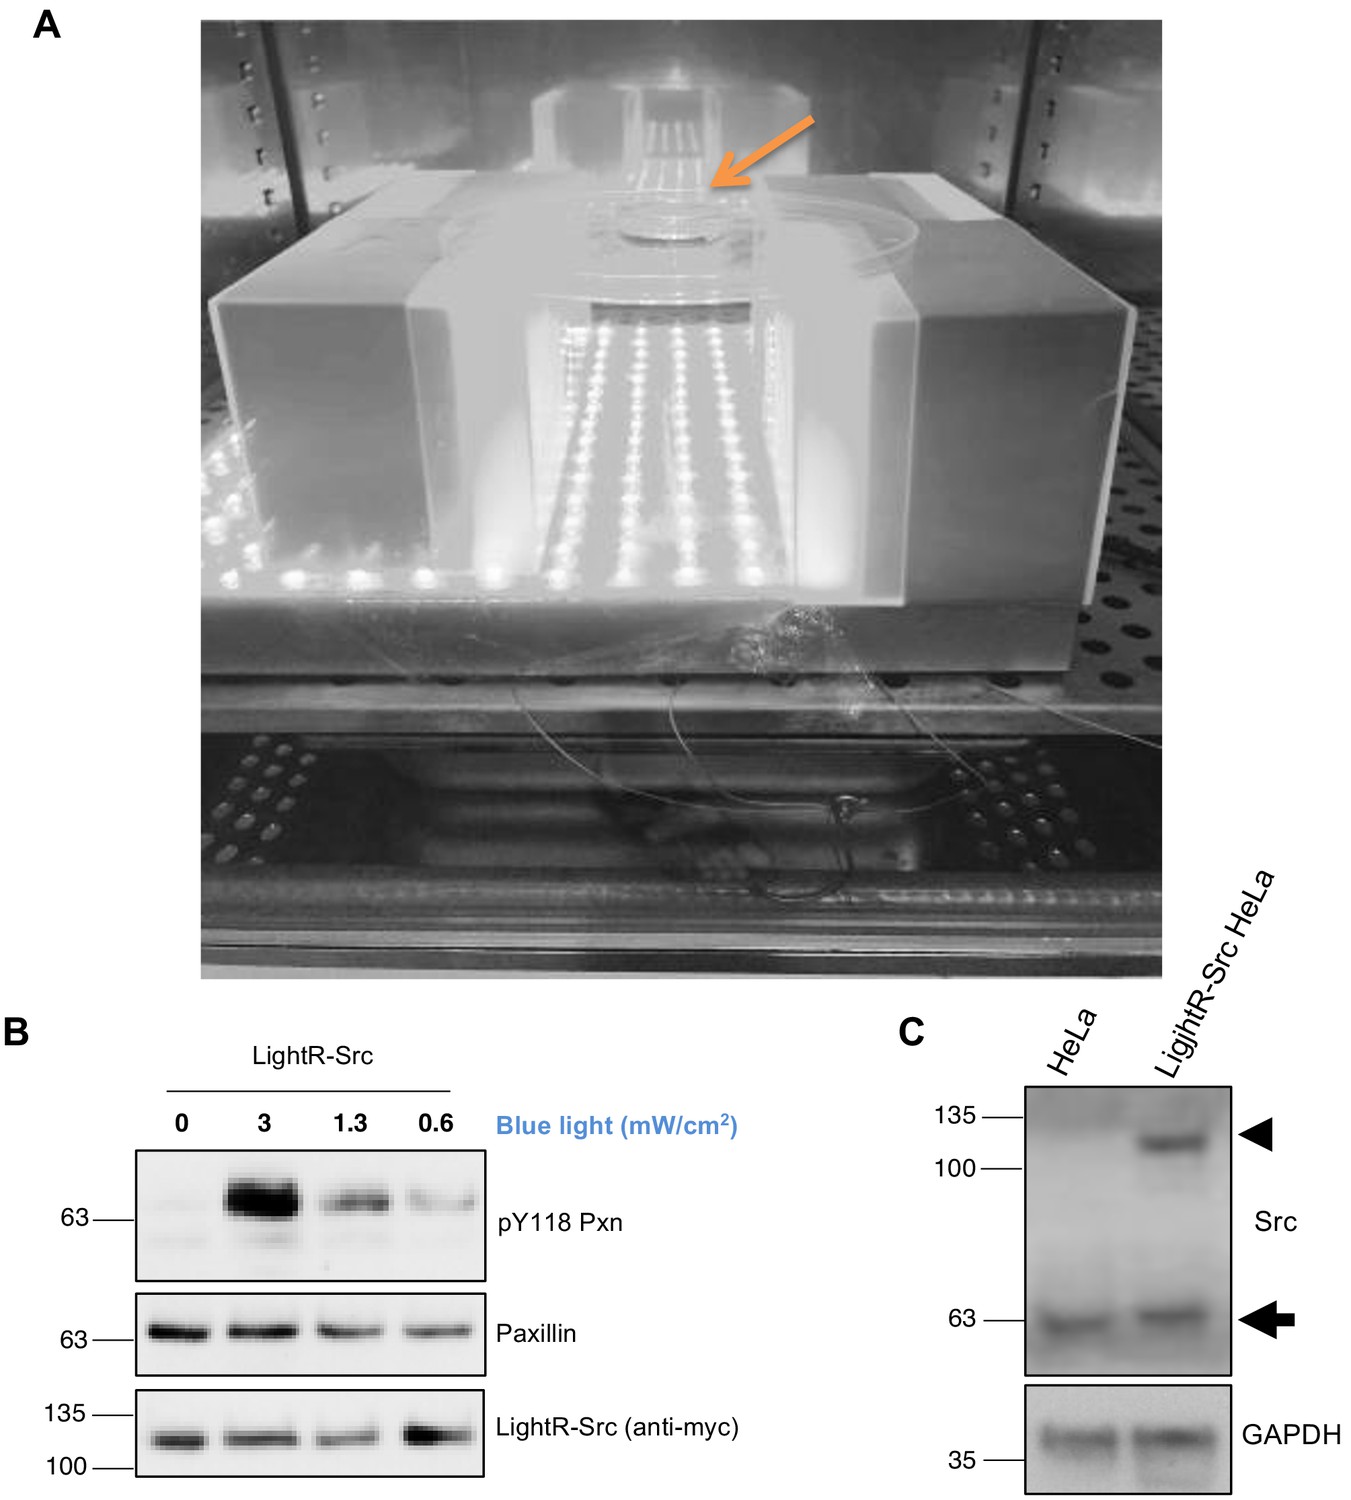
Characterization of LightR-Src regulation and expression.
(A) Blue light setup used for illumination of cells. A grey scale picture of the blue light setup placed inside a tissue culture incubator. Orange arrow points at the cells in a 3 cm dish placed 10 cm above the light panel. (B) Regulation of LightR-Src activity level with different intensity of light. LinXE cells transiently expressing LightR-Src-mCherry-myc were exposed to different blue light intensities for fifteen minutes continuously. Cell lysates were probed for phosphorylation of endogenous paxillin on Y118. (C) Western blot analysis of total cell lysates collected from control HeLa cells and from HeLa cells stably expressing LightR-Src probed with anti-Src antibody. Endogenous Src band is indicated with an arrow, and LightR-Src-mCherry-myc with an arrowhead.
Figure 2—figure supplement 2
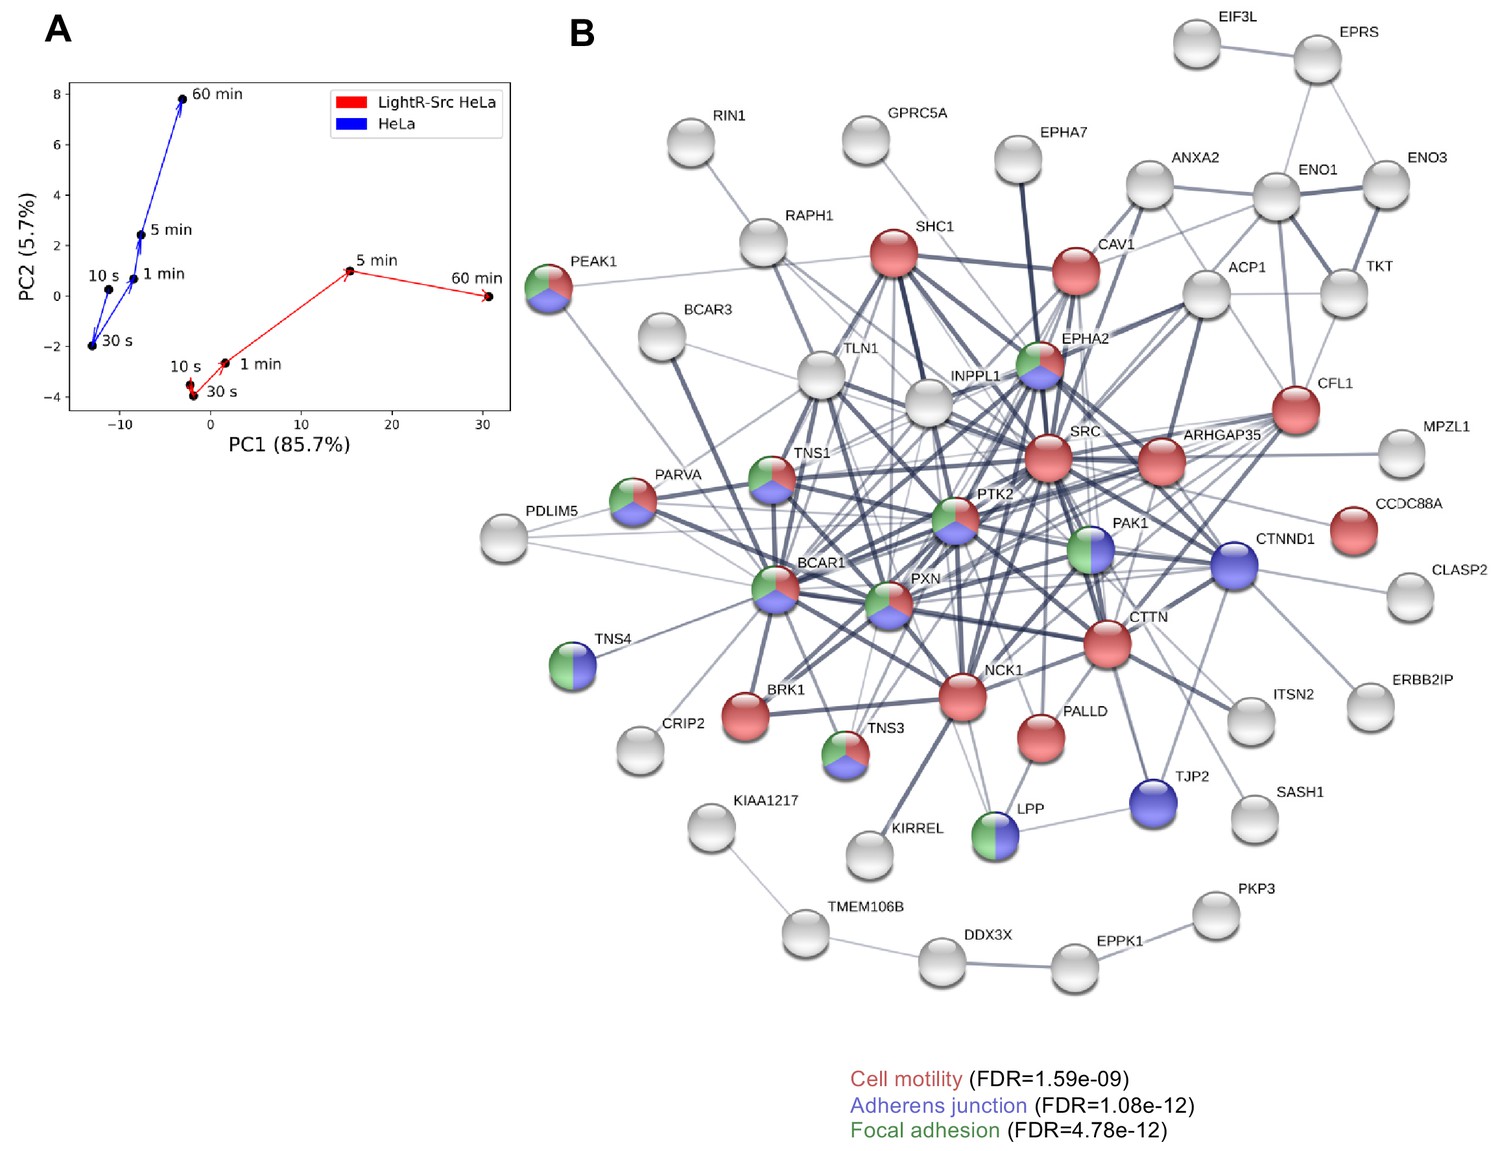
Principal component analysis and STRING biological network analysis of changes in phosphoproteome caused by activation of LightR-Src.
(A) Principal component analysis (PCA) of phosphoproteomic responses to light exposure in HeLa cells with and without LightR-Src construct. (B) STRING biological network analysis on phosphopeptides with high weight in principal component 1 (PC1), colored by several highly enriched biological processes related to cell motility and adhesion.
Figure 2—figure supplement 3
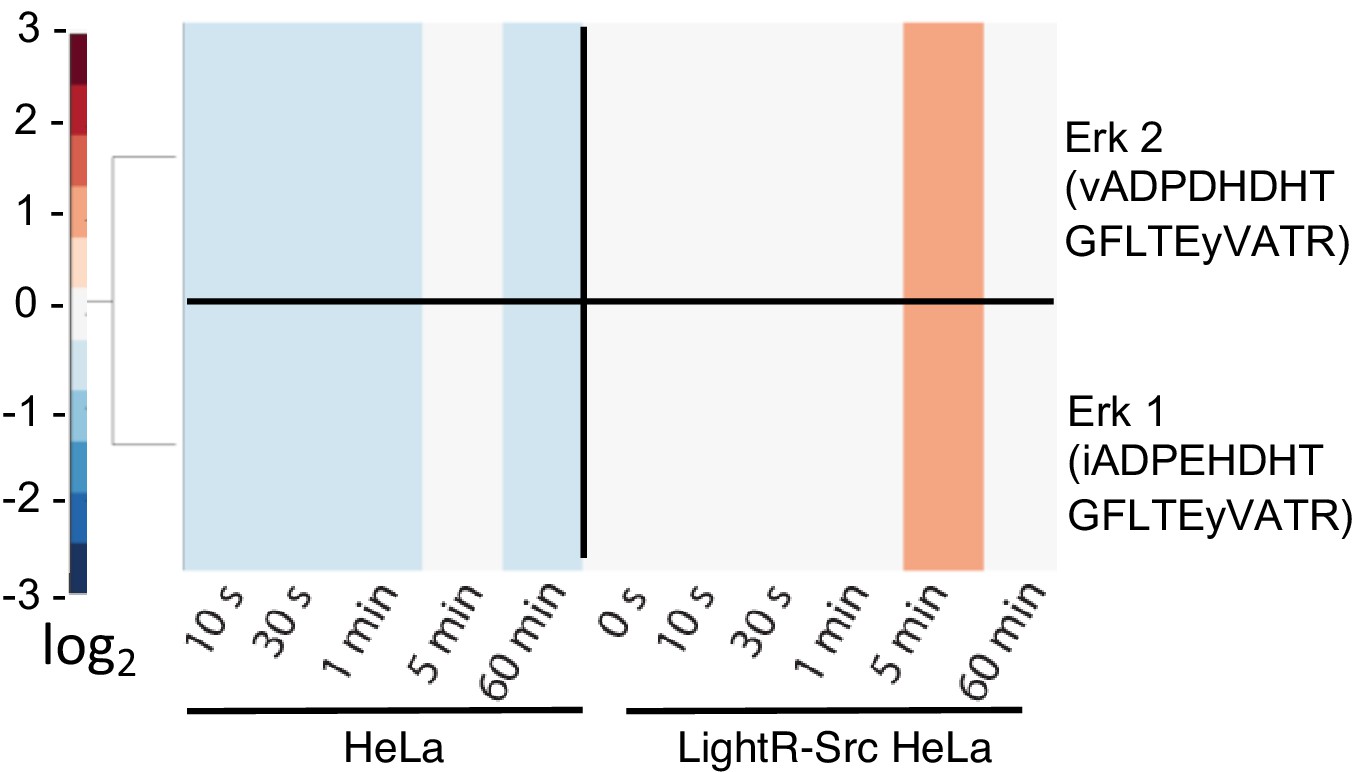
Transient phosphorylation of ERK kinases induced by activation of LightR-Src.
A zoom-in from the heatmap presented in Figure 2E of ERK1 and ERK2 phosphorylation in HeLa cells with and without LightR-Src construct following illumination with light for the indicated periods of time.
Figure 2—figure supplement 4
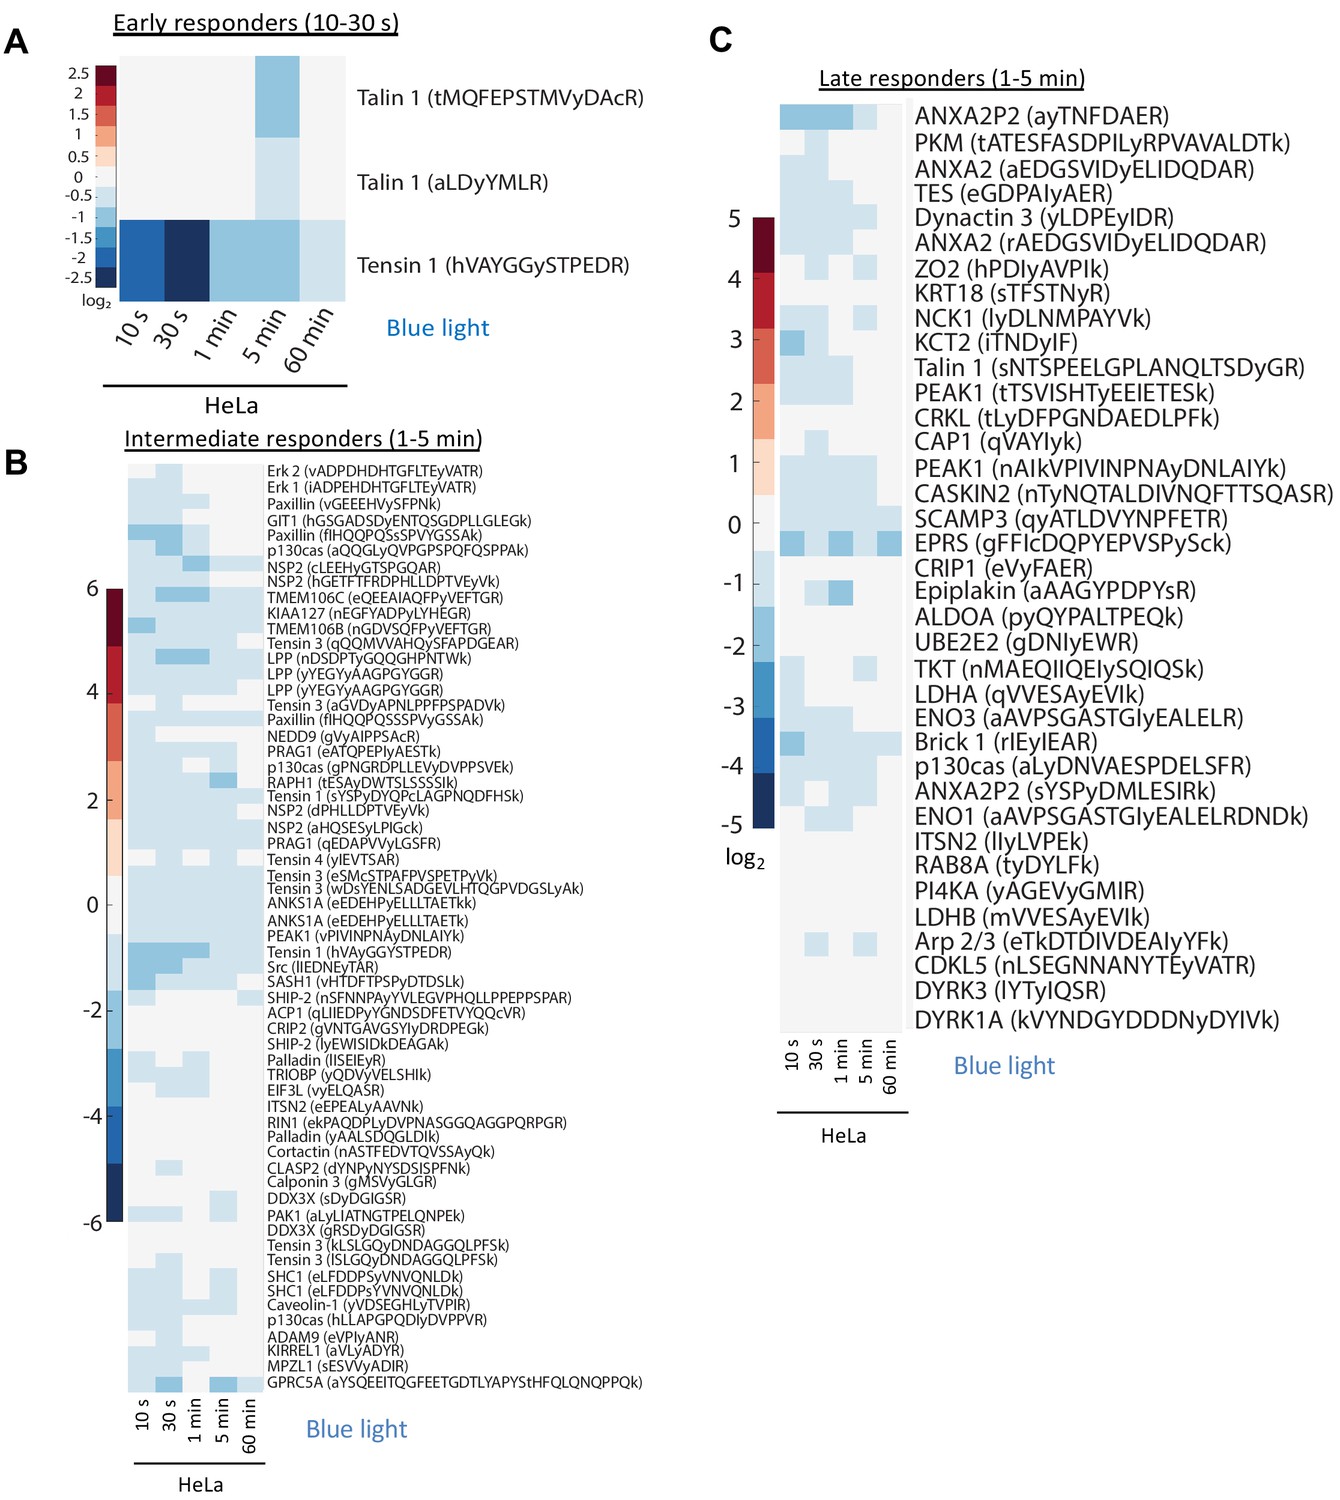
Phosphoproteomic analysis of temporal changes in protein phosphorylation for control HeLa cells exposed to blue light for the indicated times.
(A–C) Phosphoproteomic analysis of temporal changes in protein phosphorylation for HeLa cells exposed to blue light for the indicated times. These heatmaps represent the negative control experiments that were performed simultaneously with the studies presented in Figure 2D–F. Columns represent relative abundances of a phosphopeptide at given timepoints normalized to 0 s LightR-Src-HeLa. Individual heatmaps represent average abundances of phosphopeptides across three independent mass spectrometry runs.
Figure 3 with 1 supplement
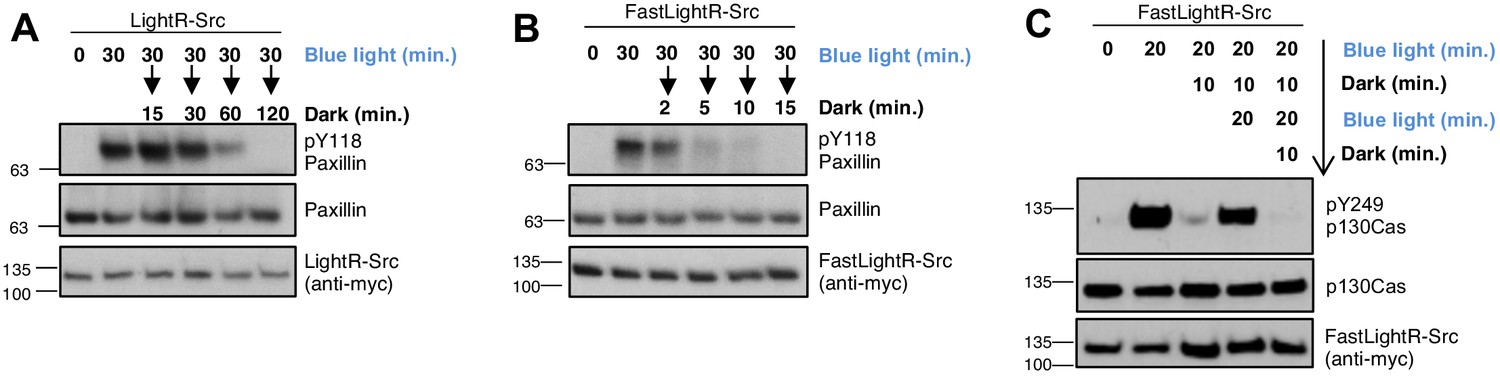
Reversibility of LightR- and FastLightR-Src.
LinXE cells transiently expressing the indicated Src constructs bearing tandem mCherry-myc tag at the C-terminus were continuously exposed to blue light for specified times and then either placed in the dark for different periods of time (A, B) or repeatedly incubated in the dark for 10 min and in the light for 20 min (C). Cell lysates were collected and probed for phosphorylation of Src substrates. All experiments were repeated at least three times with similar results.
Figure 3—figure supplement 1
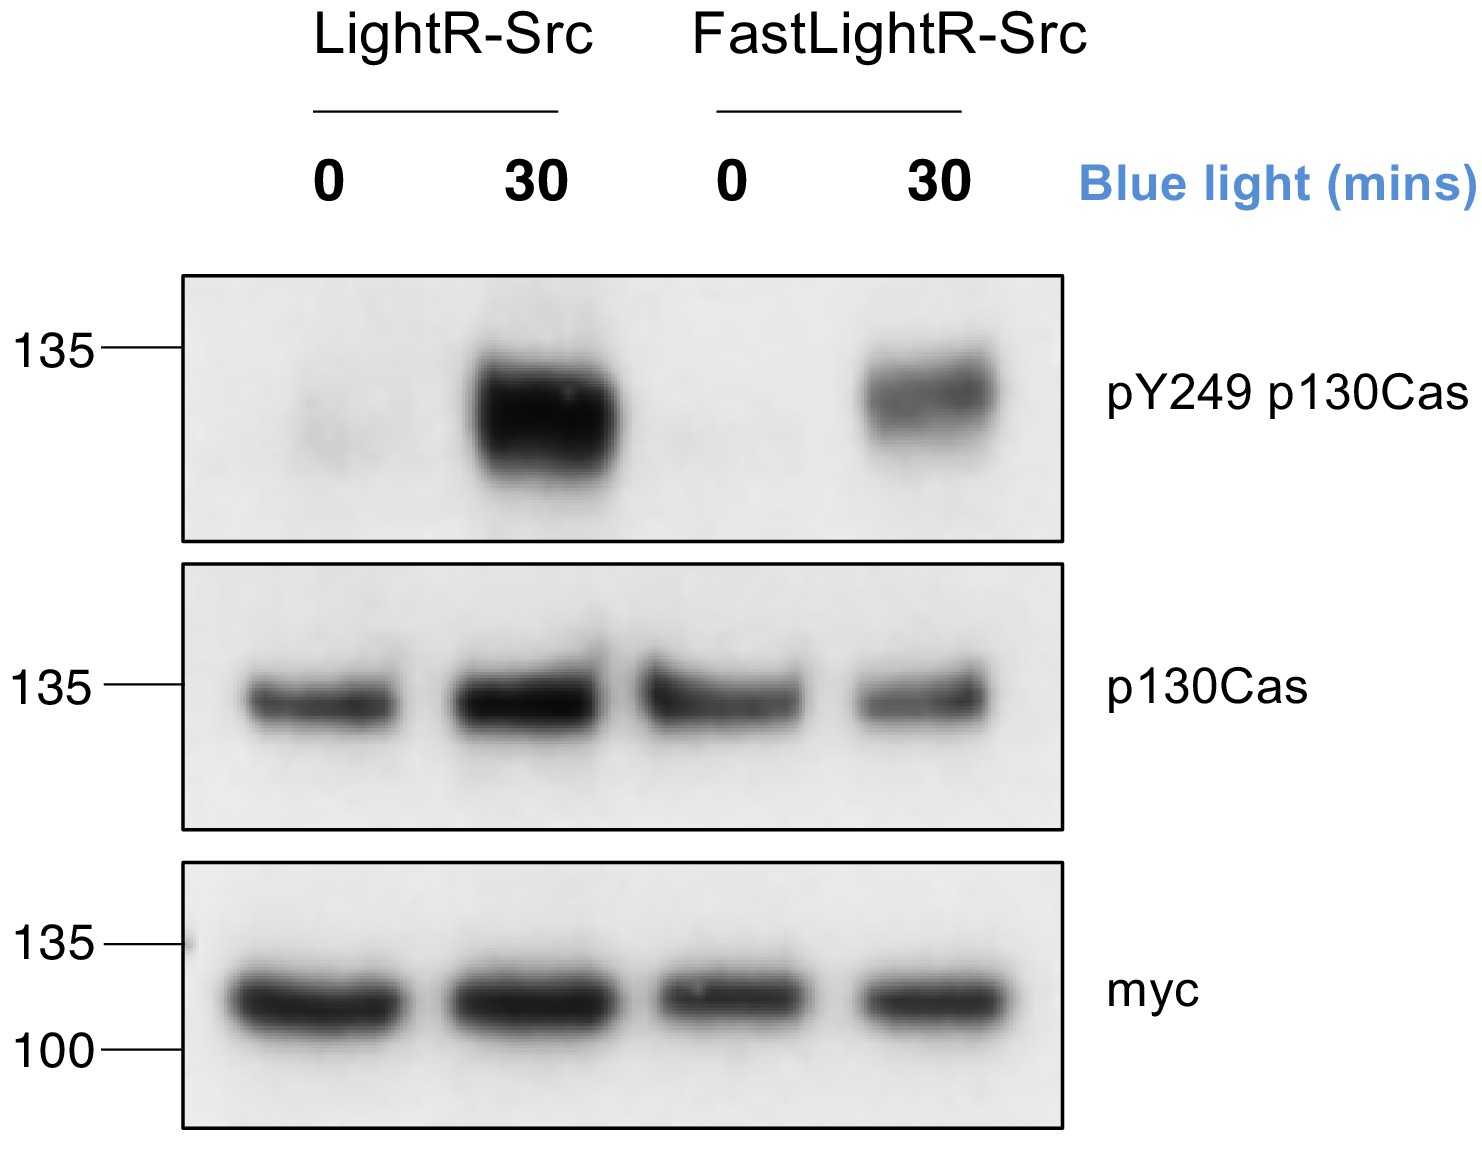
Comparison of LightR-Src and FastLightR-Src activity.
LinXE cells transiently expressing the indicated constructs bearing tandem mCherry-myc tag at the C-terminus were exposed to continuous blue light for the indicated time. Total cell lysate was probed for phosphorylation of endogenous p130cas on Y249.
Figure 4
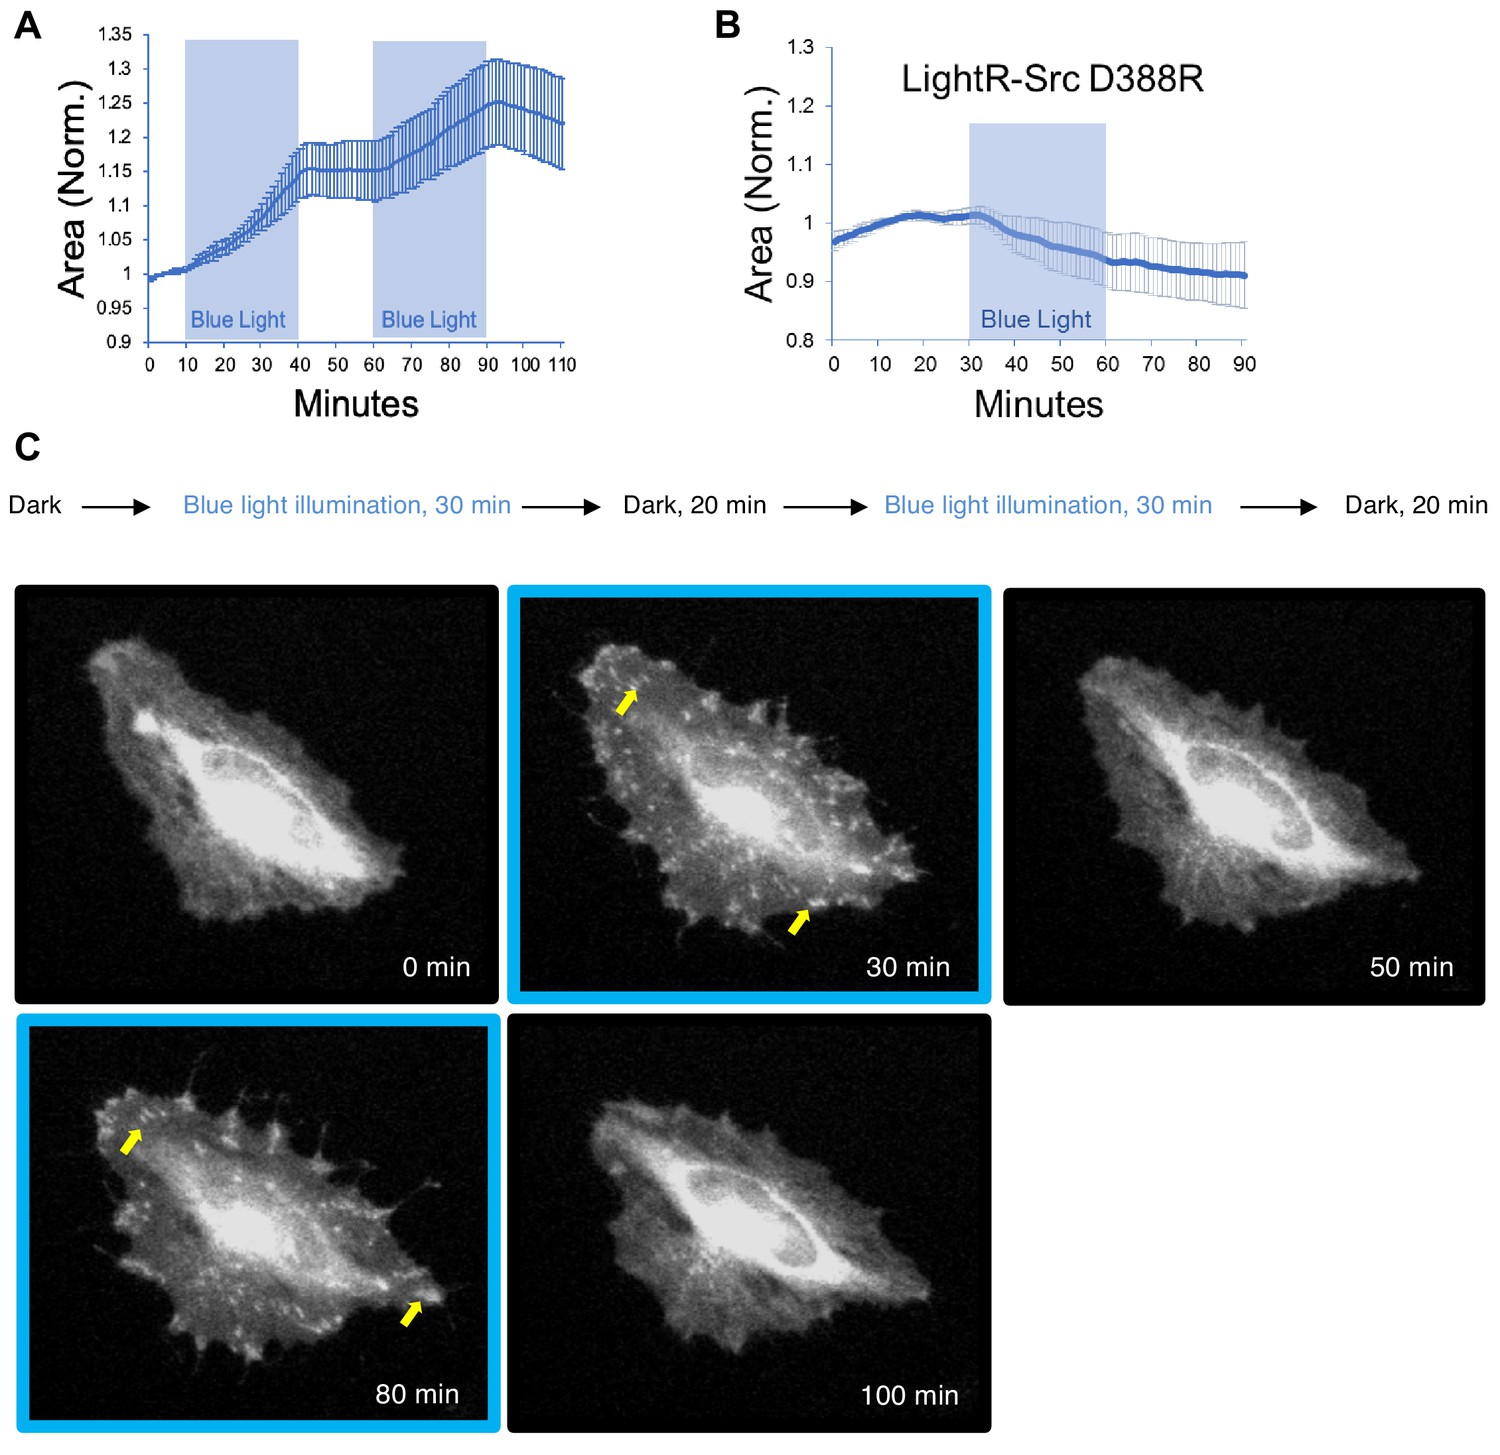
Regulation of cell morphology and LightR-Src localization by light.
HeLa cells transiently co-expressing FastLightR-Src-mCherry-myc (N = 10 cells) or catalytically inactive LightR-Src (D388R)-mCherry-myc (N = 9 cells) with stargazin-iRFP670 (plasma membrane marker) were imaged live every minute while illuminated for indicated periods of time (blue rectangles). (A, B) Quantification of changes in cell area induced by activation of LightR-Src. Graphs represent mean ±90% confidence intervals. (C) Representative images of a HeLa cell showing changes in LightR-Src localization upon illumination with blue light (see Video 1). Yellow arrows point to FastLightR-Src localization at structures resembling focal adhesions.
-
Figure 4—source data 1
Supplementary source data for Figure 4A.
- https://cdn.elifesciences.org/articles/60647/elife-60647-fig4-data1-v3.xlsx
-
Figure 4—source data 2
Supplementary source data for Figure 4B.
- https://cdn.elifesciences.org/articles/60647/elife-60647-fig4-data2-v3.xlsx
Figure 5 with 2 supplements
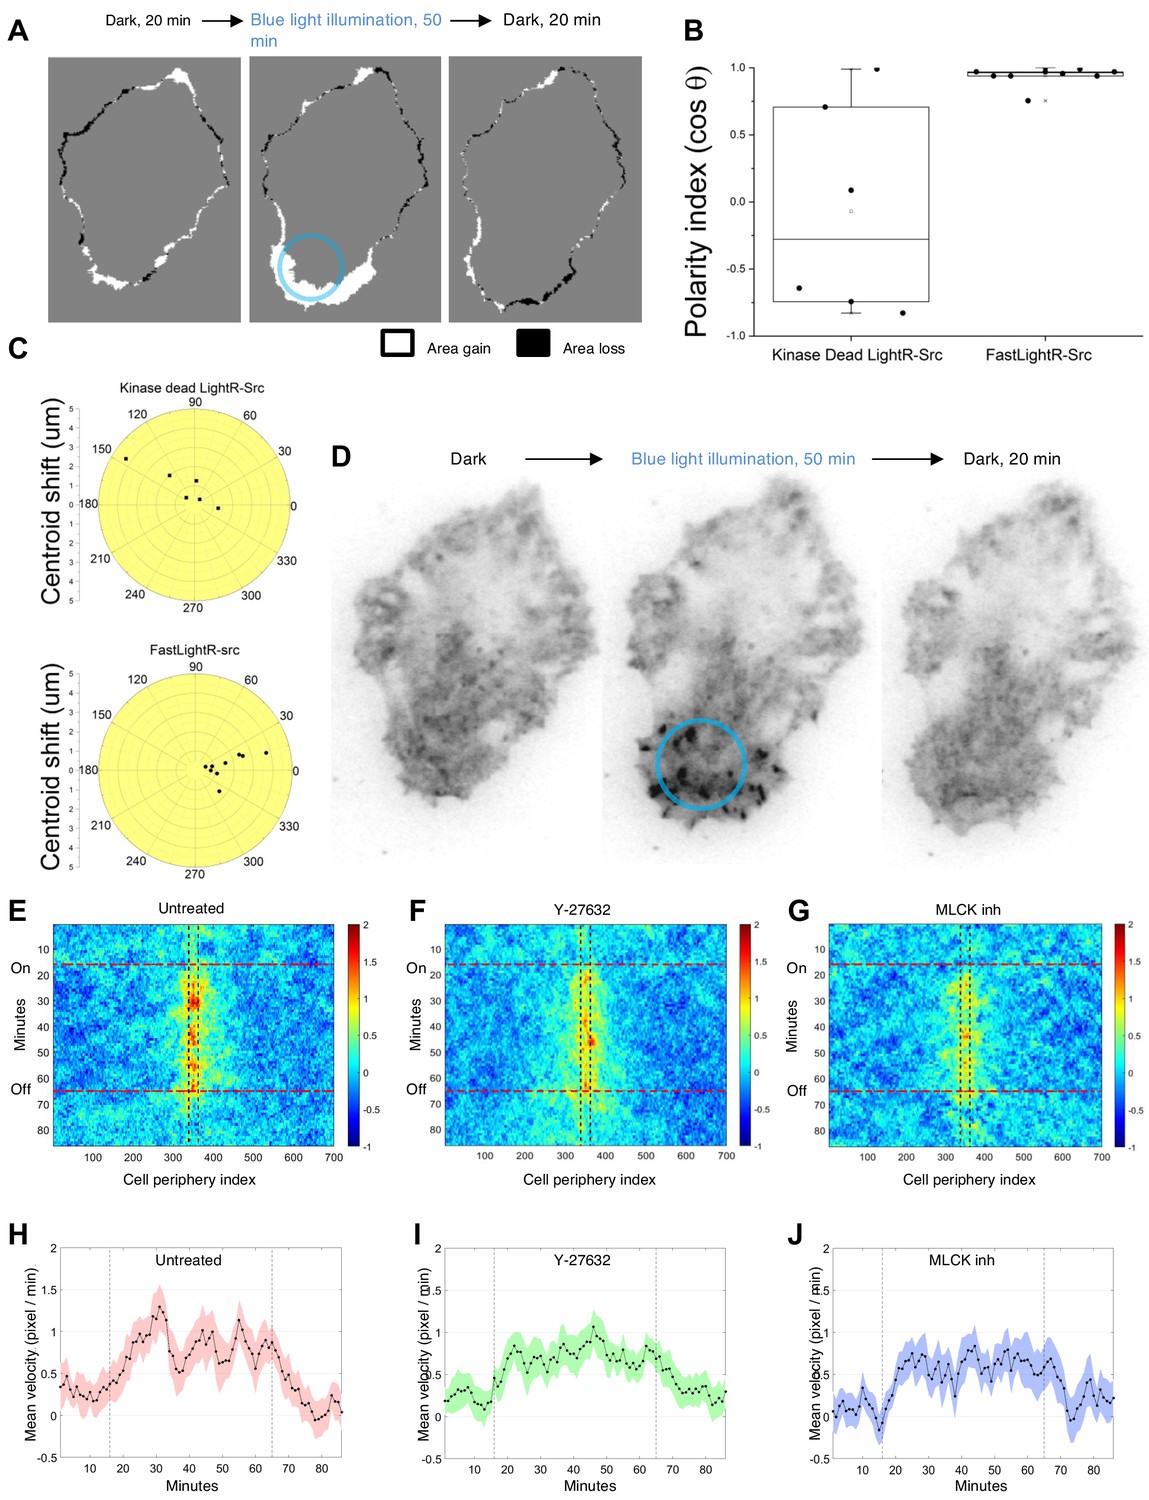
Local regulation of LightR-Src at a subcellular level.
HeLa cells transiently co-expressing FastLightR-Src-mCherry-myc and Stargazin-iRFP670 (plasma membrane marker) were imaged every minute and illuminated with blue light for indicated periods of time. (A) Representative cell projection images showing protrusions formed between indicated time points. Blue circle outlines illuminated area. (B) Polarity index calculated for cells expressing catalytically inactive LightR-Src D388R (N = 6 cells) or FastLightR-Src (N = 10 cells). Box indicates the range percentile (25, 75); whiskers indicate the range outlier (1.5 Coef.) (C) Polar plot for cells in B representing the centroid’s migration distance and angle of deviation (θ) relative to local blue light illumination. Black dots represent individual cells. (D) Inverted contrast images of FastLightR-Src-mCherry acquired at indicated time points. (E-G) Average cell-edge velocity kymograph for untreated cells (E, N = 20 cells), cells pretreated with Y-27632 (F, 10 μM, N = 24 cells), or MLCK Inhibitor Peptide 18 (G, 100 μM, N = 20 cells). Vertical lines indicate the region illuminated with blue light. Horizontal lines indicate the time of blue light illumination. (H-J) Mean velocity of the cell membrane region closest to the center of illumination spot. Vertical lines indicate the time of blue light illumination. Error bars represent 90% confidence interval.
-
Figure 5—source data 1
Supplementary source data for Figure 5B,C.
- https://cdn.elifesciences.org/articles/60647/elife-60647-fig5-data1-v3.xlsx
Figure 5—figure supplement 1
Local regulation of LightR-Src.
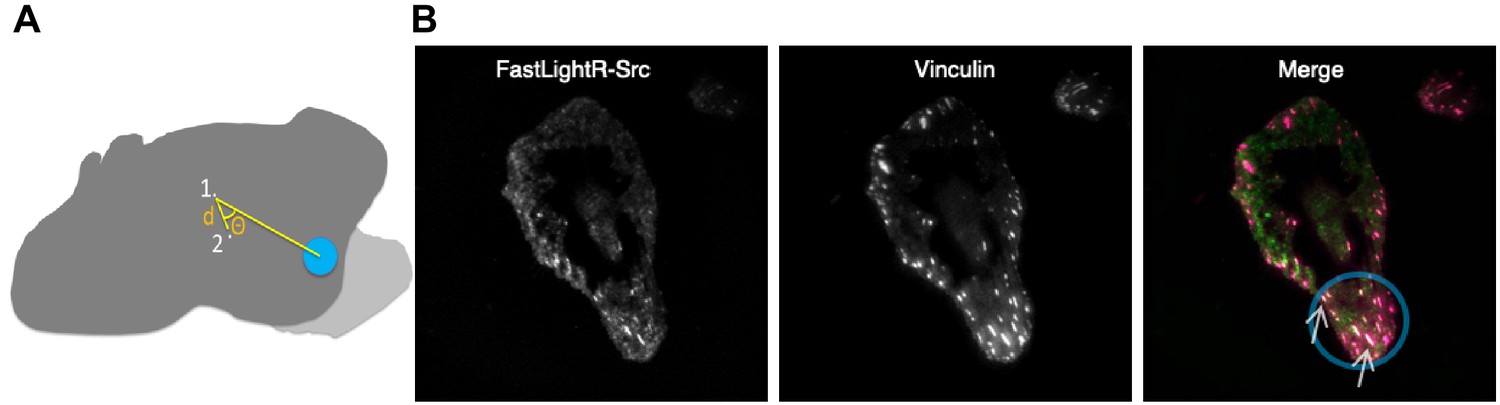
(A) A diagram showing the centroid shift distance (d) traveled by the centroid of the cell between the onset of local blue light stimulation (1) and the end of stimulation (2). The angle of deviation (θ) represents the extent of divergence of the cell’s centroid movement direction from the location of blue light. Light grey represents the area protruded by the cell in response to local LightR-Src stimulation. (B) Local translocation of engineered Src to focal adhesion. Images of a HeLa cell transiently co-expressing FastLightR-Src-mCherry-myc and Vinculin-Venus acquired using a total internal reflection fluorescence microscope (60X objective) after local exposure to blue light (area inside blue circle) for twenty-seven minutes. The merged image represents FastLightR-Src in green and Vinculin in magenta, with colocalization represented in white color and indicated with arrows.
Figure 5—figure supplement 2
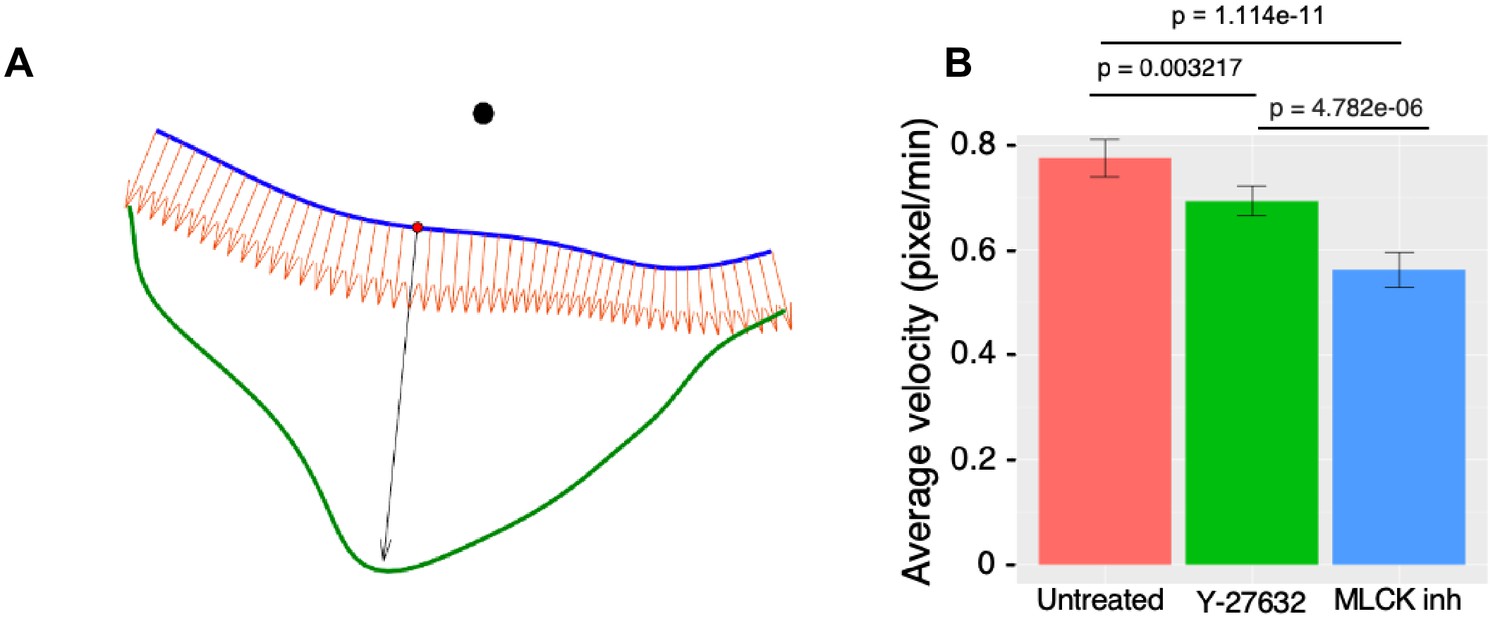
Quantification of cell edge dynamics in response to local LightR-Src activation.
(A) Illustration referred to in the Materials and methods section under quantification of cell edge dynamics (alignment of kymograph rows). Alignment of velocity kymograph rows. This is an illustration that describes the 'alignment of kymograph rows' explained in the Materials and methods section. The smoothed cell boundaries at time and are shown in blue and green, respectively. The position of the laser beam is indicated by the black circle. The normal vectors to the blue curve are shown as orange arrows. The largest distance between the boundaries along the normal vector is indicated by the black arrow and defines the position on the blue boundary (red dot) that corresponds to the middle position in the velocity kymograph for the time . (B) Average cell-edge velocity of Figure 5H-J during FastLightR-Src activation period. Error bars represent 90% confidence interval; p values ≤ 0.05 indicate significance.
Figure 6 with 2 supplements
The broad applicability of LightR approach.
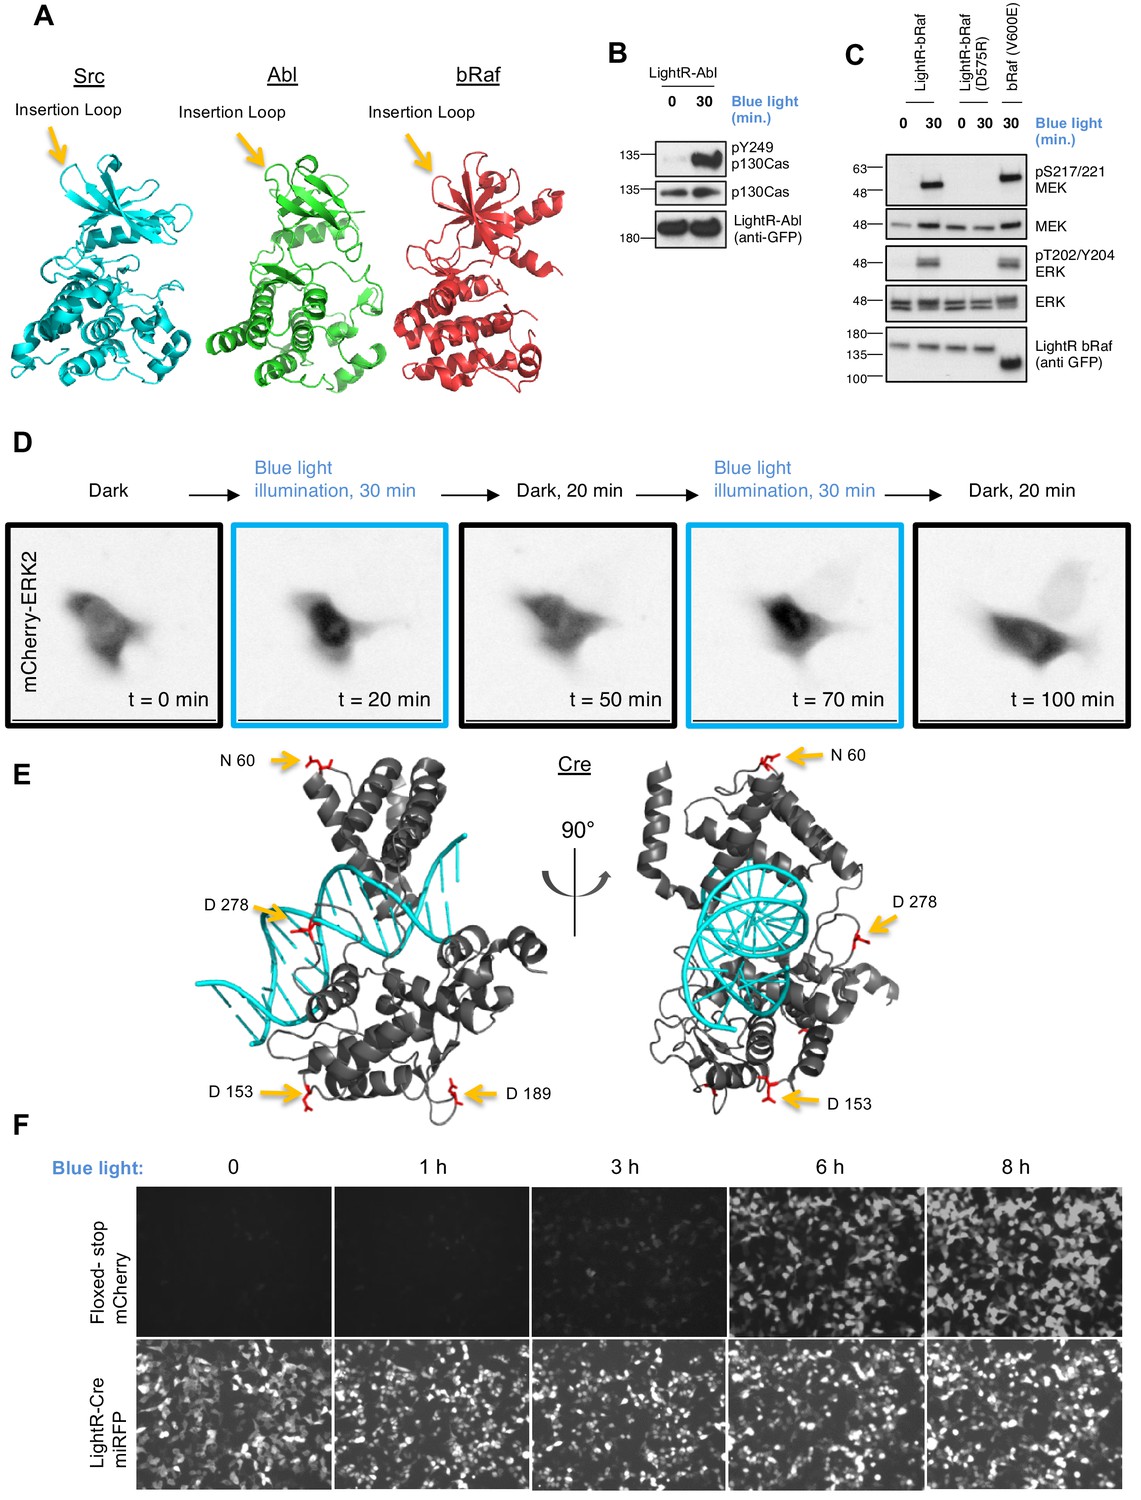
(A) Crystal structures of Src (PDB 1Y57), Abl (PDB 3CS9), and bRaf (PDB 4MNF) catalytic domains. Yellow arrows indicate LightR insertion site. (B, C) Regulation of LightR-Abl and LightR-bRaf. LinXE cells transiently expressing GFP-LightR-Abl, LightR-bRaf-Venus, or bRaf (V600E)-Venus were exposed to continuous blue light for the specified period of time. Cell lysates were probed for the phosphorylation of indicated proteins. (D) LinXE cell transiently co-expressing FastLightR-bRaf-Venus and mCherry-ERK2 were imaged live while illuminated with blue light (as shown in the top diagram). Representative images of mCherry-ERK2 were taken at the indicated time points. (E) Orthogonal view of Cre recombinase structure (PDB 1MA7) indicating LightR insertion sites (yellow arrows) of the four different LightR-Cre variants. (F) LinXE cells transiently co-transfected with floxed-stop-mCherry reporter (upper panels) and LightR-Cre-miRFP (LightR inserted at D153, lower panels) were irradiated with pulses of blue light (2 s on 10 s off) for the indicated times. Images for all time points of each channel were acquired under the same settings and adjusted to the same brightness/contrast levels to allow for comparison of expression levels between samples. All experiments were done at least three times with similar results.
Figure 6—figure supplement 1
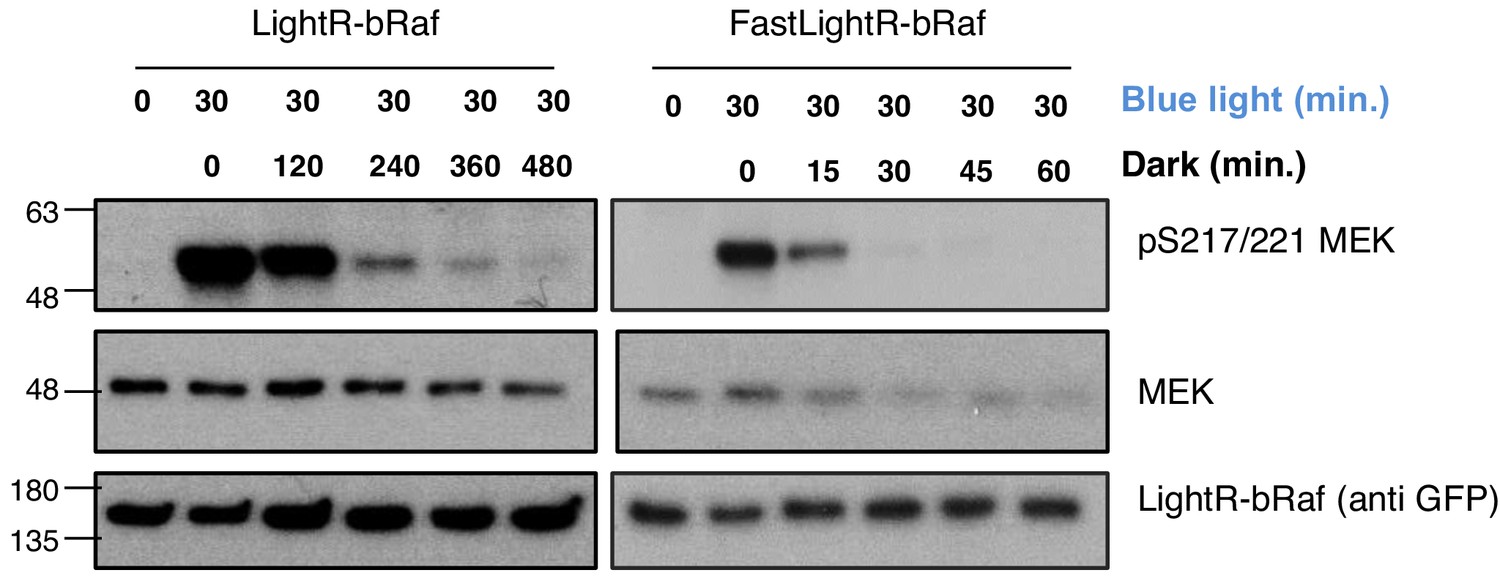
Inactivation kinetics of LightR-bRaf constructs.
LinXE cells transiently expressing LightR-bRaf-Venus or FastLightR-bRaf-Venus variant were continuously exposed to blue light for 30 min, and subsequently incubated in the dark for the indicated times. Cell lysates were probed for phosphorylation of MEK1 as indication of bRaf activity.
Figure 6—figure supplement 2
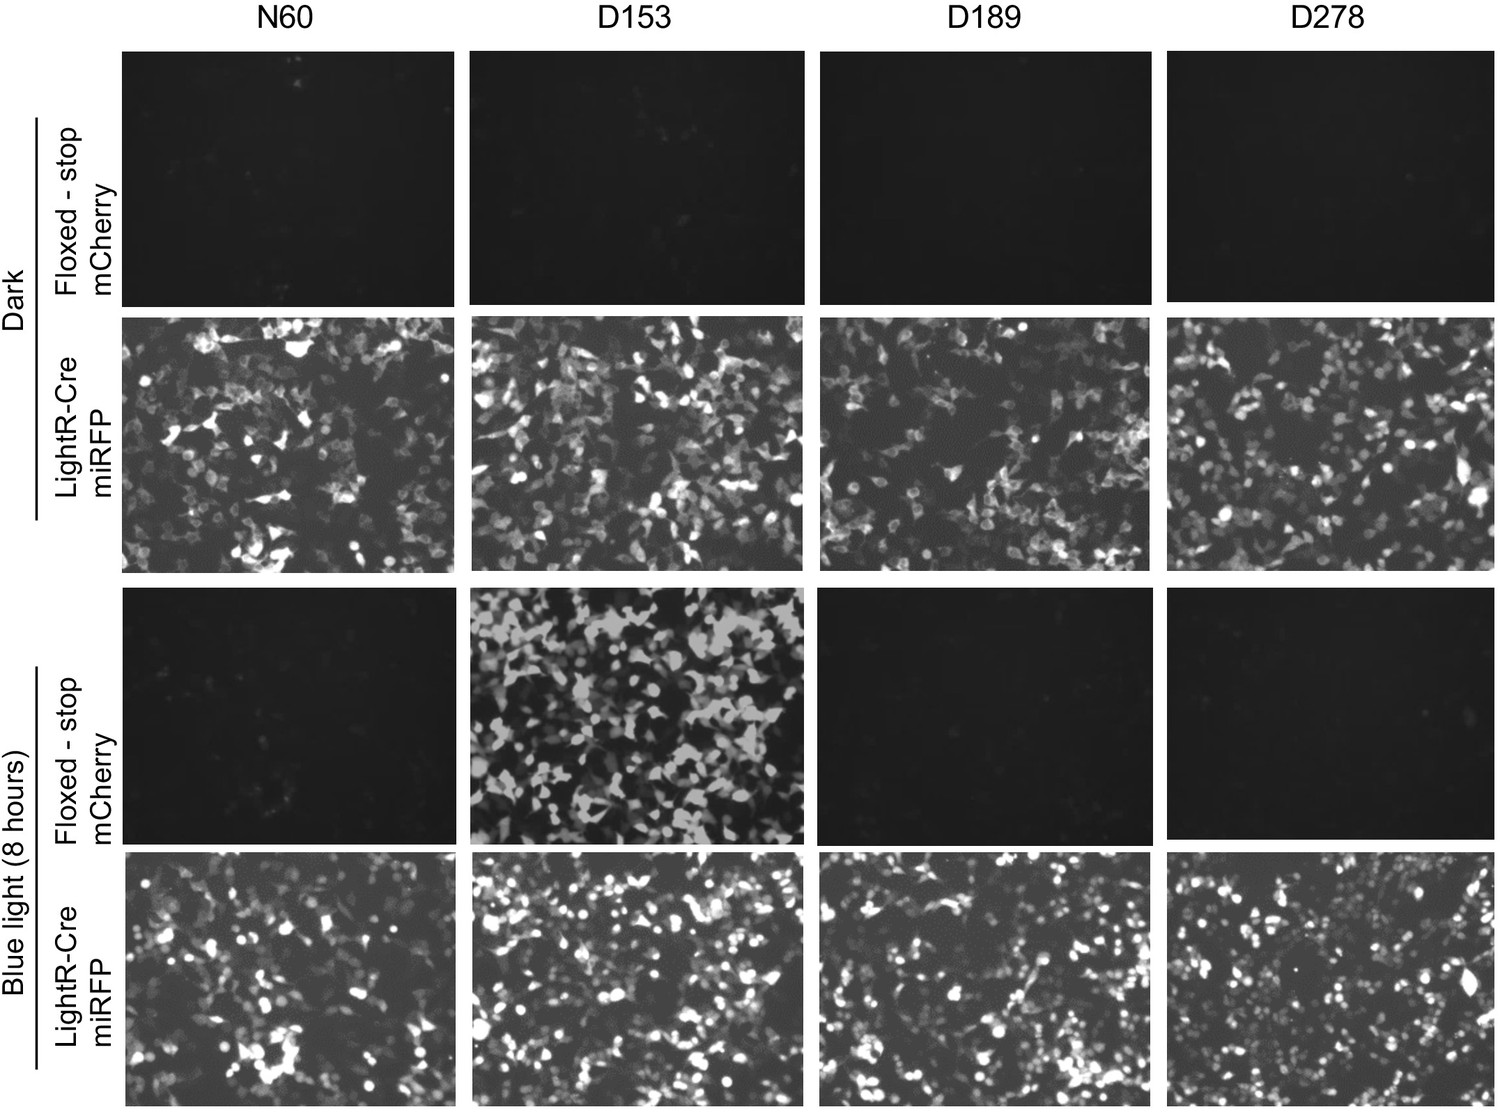
Analysis of LighR-Cre variants.
LinXE cells transiently co-transfected with floxed-stop-mCherry reporter and one of LightR-Cre-miRFP variants were either kept in the dark or illuminated with pulsing blue light (2 s on 10 s off) for 8 hr. The variants differ in their indicated insertion site (N60, D153, D189 or D278) of LightR domain in Cre recombinase, depicted in Figure 6E. Images for all timepoints of each channel were acquired under same settings and adjusted to the same brightness/contrast levels to allow for comparison of protein expression levels between samples. Experiment was done at least three times with similar results.
Videos
Video 1
Time-lapse of HeLa cell co-expressing stargazin-iRFP (membrane marker, left panel) and FastLightR-Src-mCherry (right panel) imaged every minute using widefield fluorescence microscopy.
Cell was globally illuminated with blue light (50 ms pulses every second, 50 pulses per minute) as indicated. Time displayed in minutes.
Video 2
Time-lapse showing HeLa cell expressing FastLightR-Src-mCherry illuminated locally with blue light (blue circle).
Images were taken every minute using total internal reflection fluorescence microscopy (60X objective). Time is displayed in minutes. Images are shown as inverted contrast image representation.
Video 3
Inverted contrast time-lapse images of mCherry-ERK2 expressed in LinXE cell co-expressing FastLightR-bRaf-Venus.
Images were taken every minute and cell was globally stimulated with blue light (ten seconds every minute) as indicated. Time is displayed in minutes.
Additional files
-
Supplementary file 1
DNA sequences for LightR and LightR constructs.
- https://cdn.elifesciences.org/articles/60647/elife-60647-supp1-v3.docx
-
Transparent reporting form
- https://cdn.elifesciences.org/articles/60647/elife-60647-transrepform-v3.docx
Download links
A two-part list of links to download the article, or parts of the article, in various formats.
Downloads (link to download the article as PDF)
Open citations (links to open the citations from this article in various online reference manager services)
Cite this article (links to download the citations from this article in formats compatible with various reference manager tools)
Light-regulated allosteric switch enables temporal and subcellular control of enzyme activity
eLife 9:e60647.
https://doi.org/10.7554/eLife.60647


