Mutational analysis to explore long-range allosteric couplings involved in a pentameric channel receptor pre-activation and activation
- Institut Pasteur, Université de Paris, CNRS UMR 3571,Channel-Receptors Unit, France
- Sorbonne Université, Collège doctoral, France
- Institut de Biologie Physico-chimique, Fondation Edmond de Rothschild, PSL Research University, France
- Laboratoire de Biochimie Théorique, CNRS, Université de Paris, UPR 9080, France
Figures
Figure 1 with 2 supplements

Electrophysiological and fluorescence characterization of the quenching pairs of GLIC.
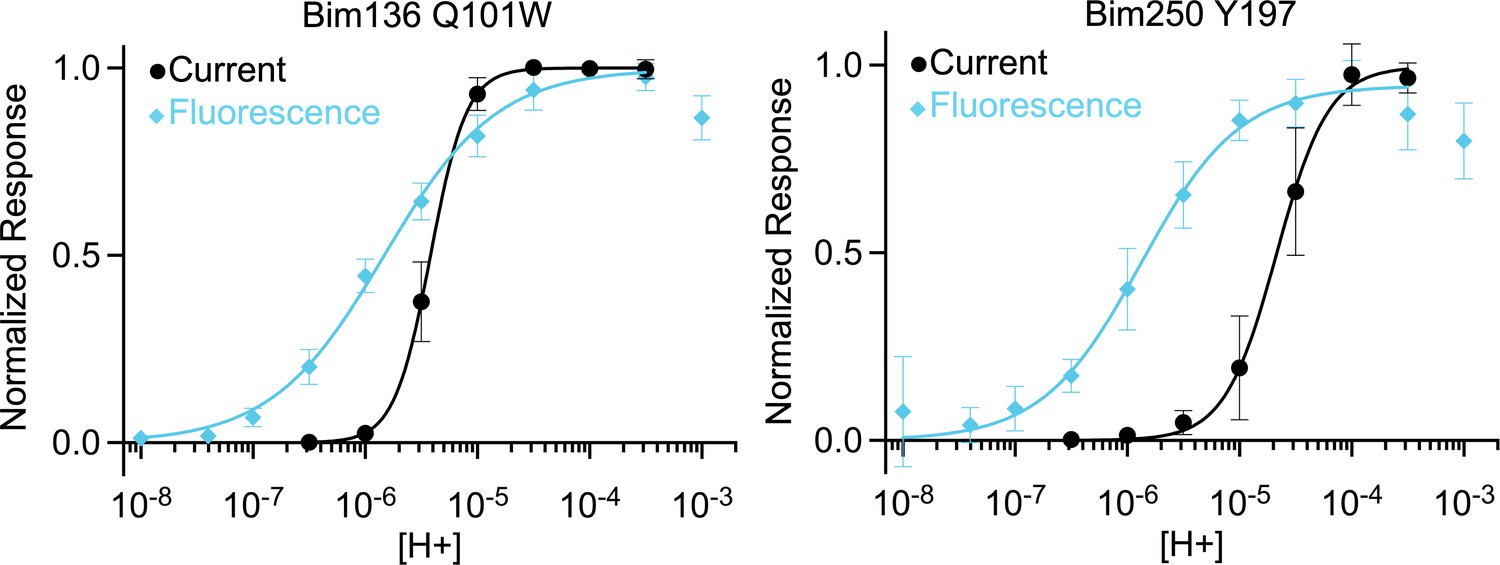
(A) Scheme for GLIC activation, showing first a pre-activation step involving full compaction of the ECD and motion of the M2-M3 loop as monitored by fluorescence, followed by a pore opening step. Blue spheres indicate the location of sensors Bim136-Q101W and Bim250-Y197 used thereafter in this study. (B) GLIC-pH 4 (pdb code 4HFI) structure side view, the light blue rectangle represents the position of the membrane. Quenching pairs generated in our previous study (Menny et al., 2017) are highlighted: blue spheres show the Cα of the residues that were mutated into cysteines and bimane labeled (Bim33, Bim133, Bim135, Bim136, and Bim250), black spheres show the Cα of the quenchers (W160, L103W, W72, Q101W, and Y197). (C) pH-dependent response curves of Bim136-Q101W and Bim250-Y197 sensors, by electrophysiology after labeling (top panel) and with bimane fluorescence quenching (lower two panels). Fluorescence data are shown normalized to the fluorescence of the denatured protein (FSDS), bimane fluorescence is shown without quencher (○) and in presence of the quencher (●). ECD, extracellular domain.
-
Figure 1—source data 1
Fluorescence quenching and electrophysiological current measurements of the different mutants tested.
- https://cdn.elifesciences.org/articles/60682/elife-60682-fig1-data1-v2.xlsx
Figure 1—figure supplement 1
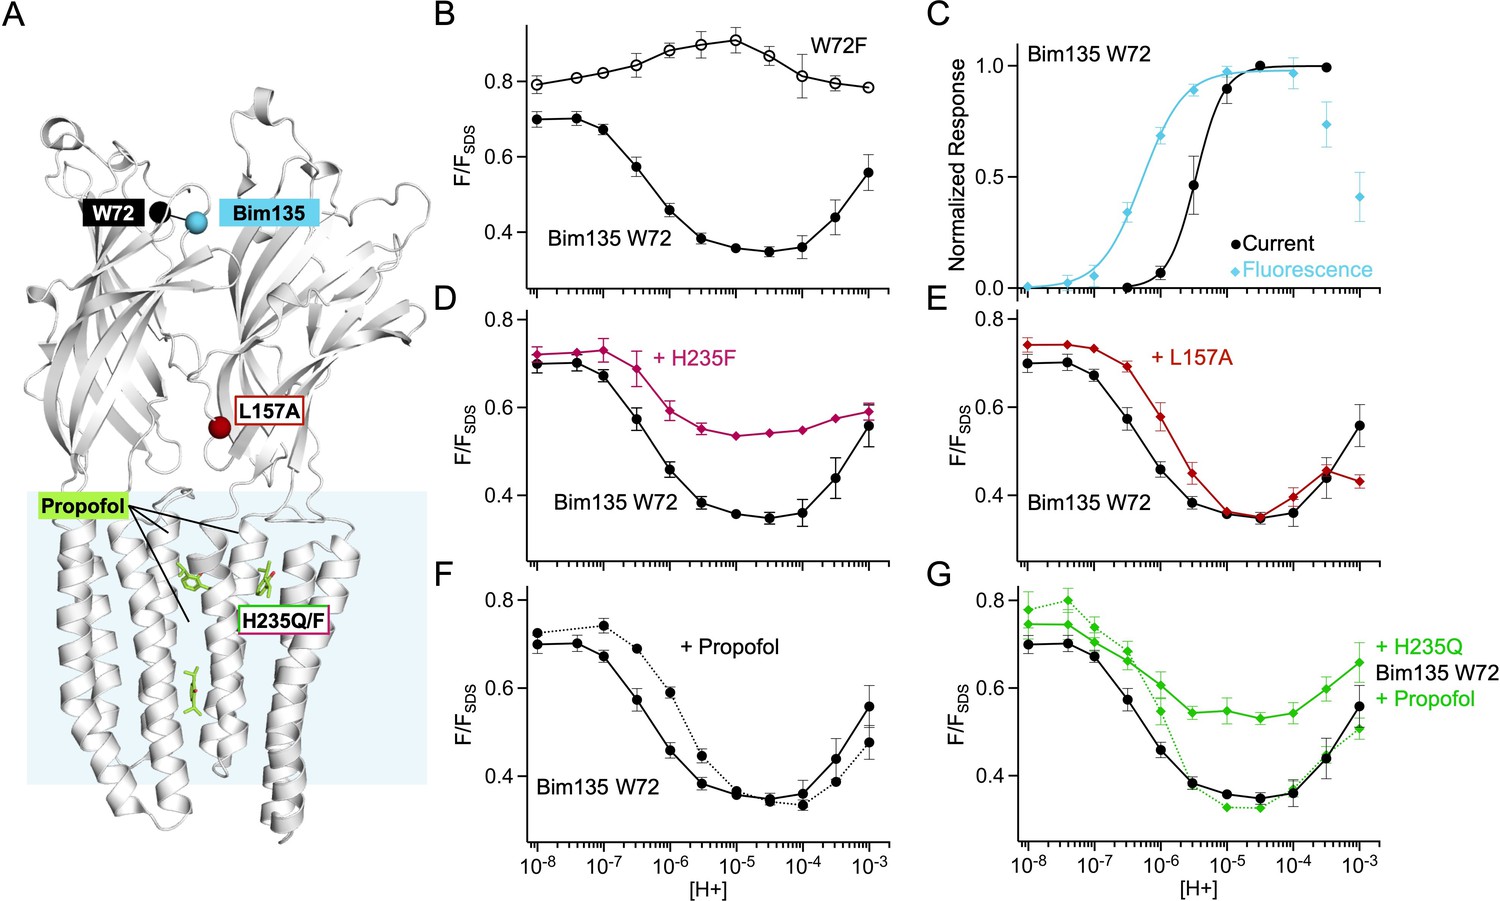
Fluorescence quenching data from mutants with the Bim135 W72 sensor.
(A) Structure of two monomers of GLIC pH 4 showing in spheres the position of the sensor Bim135-W72 and of the different mutants tested. Propofol is shown in sticks in its known binding sites. (B) pH-dependent response in fluorescence quenching of Bim135 in presence (●) and absence (○) of the quencher W72 demonstrating it is the main cause of Bim135 quenching. (C) Normalized pH-dependent curves in electrophysiological response (black, ●) and fluorescence quenching (blue, ◆) showing that fluorescence pH50 is higher than current pH50 as in the other sensors shown in Figure 1—figure supplement 2. (D) and (E) show the effect of H235F and L157A mutations (◆) on Bim135-W72 fluorescence quenching. (F) and (G) show the effect of propofol on Bim135-W72 (●) and H235Q mutant (◆) fluorescence quenching. Conclusion on Bim135-W72: We unambiguously identify here Trp72 as the endogenous quenching residue of Bim135 since the mutant Bim135-W72F is functional in electrophysiology, but does not undergo pH-dependent quenching. The pH-dependent changes in fluorescence show a bell-shaped curve suggesting complex changes in distances at this level. When combined with Bim135-W72, L157A shows a decrease in pH50 of the first quenching component, and a diminished amplitude of the second unquenching component. Combined with Bim135-W72, H235F, and H235Q display a phenotype with a notably much smaller amplitude of the first component. On Bim135-W72, propofol causes a decrease in pH50 for the first quenching component. On Bim135-W72-H235Q, propofol restores a WT-like pH-dependent quenching curve. The observed global lower amplitude of the Bim135-W72 H235Q/F quenching curves may either result from a decrease in the extent of the reorganization responsible for the amplitude of the first component, or a rightward shift of the curve resulting in an overlap which would result in an averaging of the bimane quenching and unquenching curves. Therefore, the fluorescence data related to the Bim135-W72 pair cannot be interpreted in simple terms, although they further document the strong allosteric coupling between mutations and propofol binding and the upper part of the ECD. ECD, extracellular domain.
Figure 1—figure supplement 2
pH-dependent curves comparison.
Normalized pH-dependent curves in electrophysiological response (black, ●) and fluorescence quenching (blue, ◆) showing that fluorescence pH50 is higher than current pH50 for both sensors Bim136-Q101W and Bim250-Y197. For the fluorescence quenching data, the value at neutral pH is set to 0 and values are then normalized to the value displaying the maximal change in fluorescence.
Figure 2

Allosteric coupling within the ECD.
(A) Structure of two monomers of GLIC pH 4 (4HFI) showing positions of the fluorescence sensor (Bim136-Q101W) and the two mutated residues at the bottom of the ECD resulting in a partial loss of function. The lower panel shows a zoom on the interface with E26 and Y28 residues and their interactions with surrounding residues and a network of water molecules (blue spheres). (B) Electrophysiological recordings in oocytes of the mutants labeled with bimane showing shifted responses to higher proton concentrations in comparison with GLIC Bim136-Q101W. pH applications are shown above each trace and the horizontal scale represents 1 min of recording. Graphs represent pH-dependent curves showing a shift to higher proton concentrations in electrophysiological responses (C) and fluorescence quenching responses (D) for both mutants. ECD, extracellular domain.
Figure 3
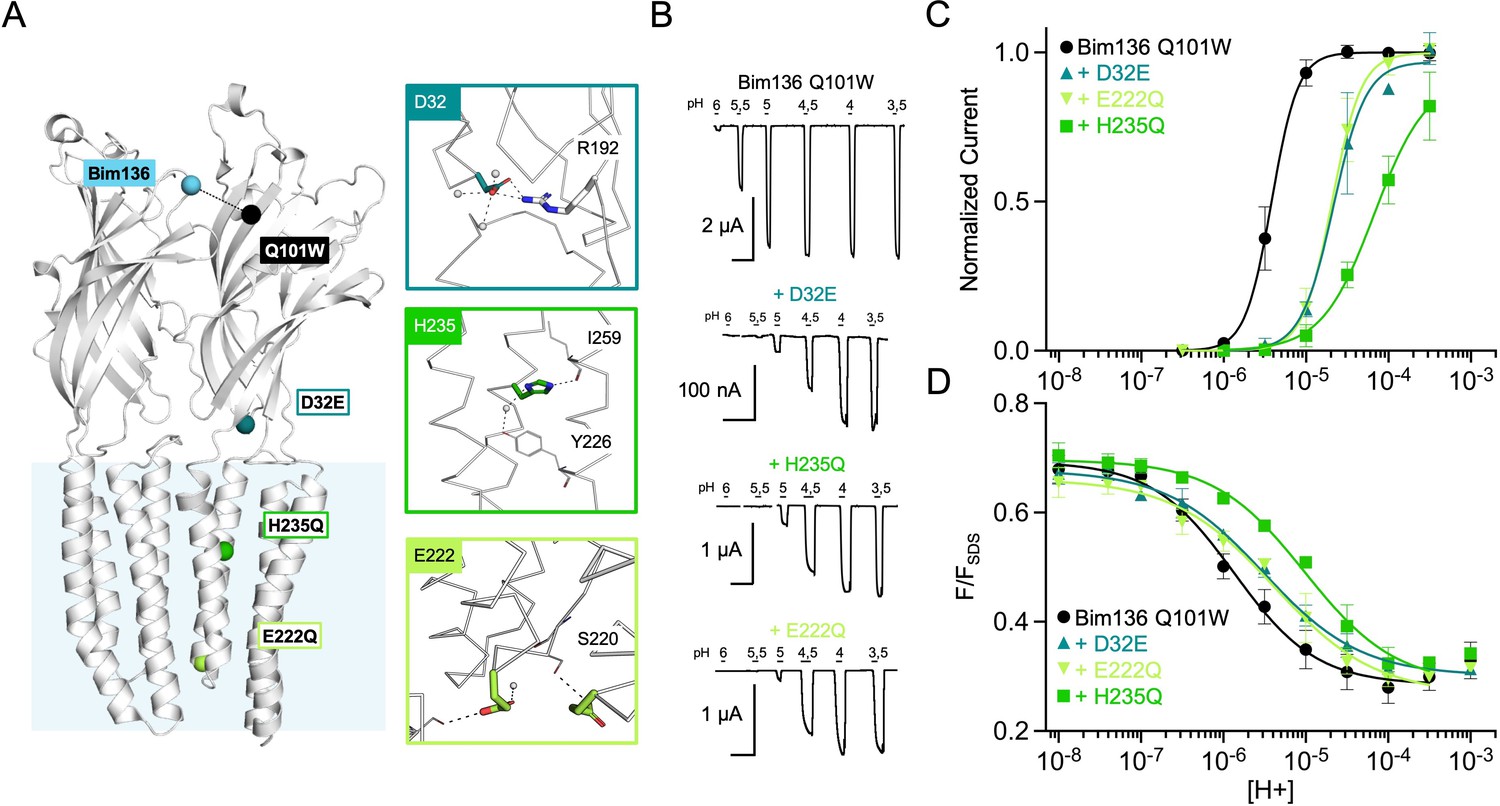
Allosteric coupling between the top of the ECD and the TMD.
(A) Structure of two monomers of GLIC pH 4 (4HFI) showing positions of the fluorescence sensor (Bim136-Q101W) at the top of the ECD and three mutations distributed along the protein. Right panels show zooms on important interactions with the mutated residues. (B) Electrophysiological recordings of the three mutants in oocytes, labeled with bimane. Recording of GLIC Bim136-Q101W is shown for comparison. pH applications are shown above each trace and the horizontal scale represents 1 min of recording. pH-dependent curves for electrophysiological response (C) and fluorescence quenching (D) for the three mutants in comparison with Bim136-Q101W showing a shift to higher proton concentrations of the response for all three mutants. ECD, extracellular domain; TMD, transmembrane domain.
Figure 4 with 1 supplement
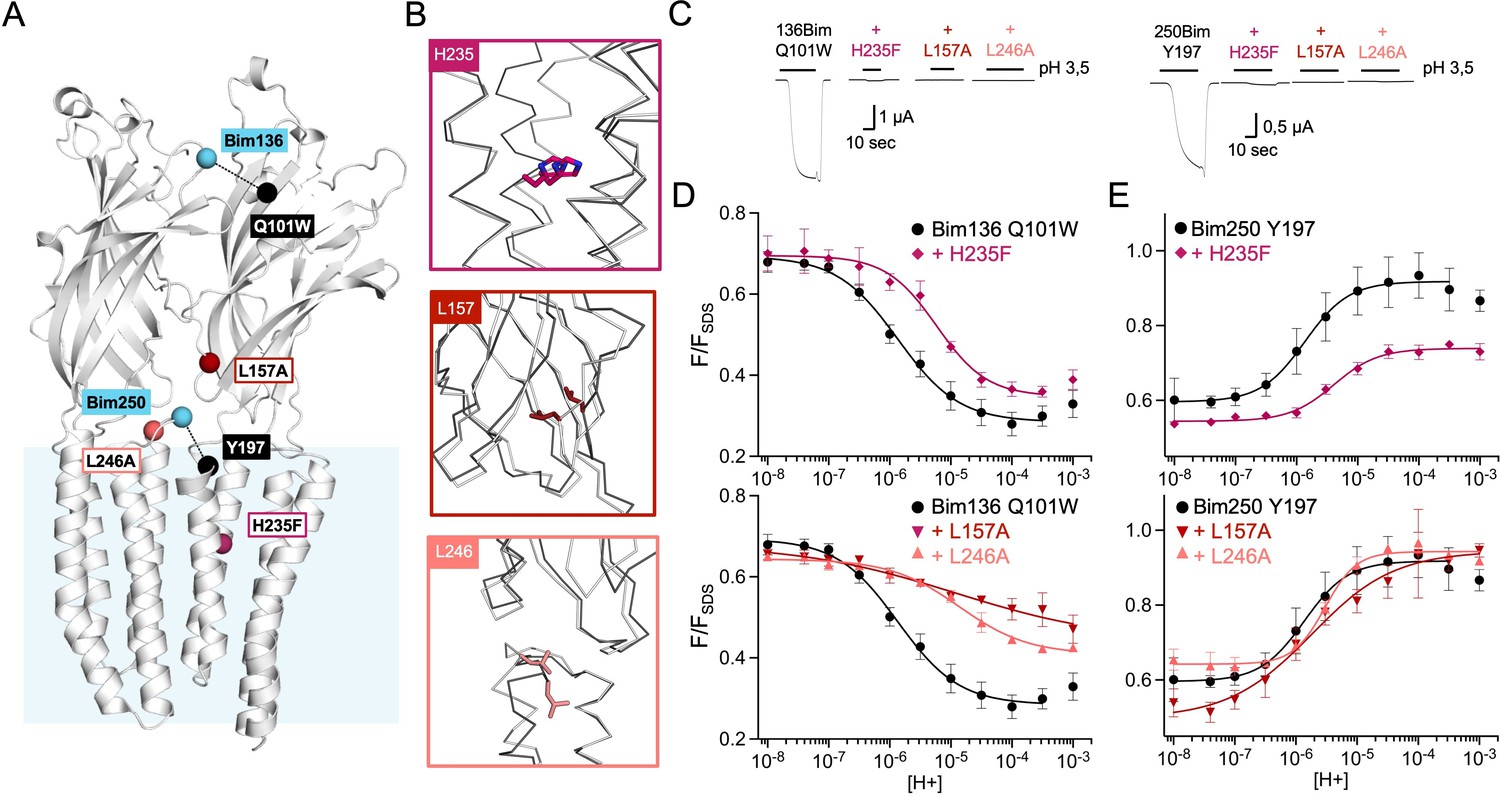
Non-functional mutants differentially alter ECD and TMD motions.
(A) Structure of two monomers of GLIC pH 4 showing the position of the fluorescence sensors (Bim136-Q101W and Bim250-Y197) and three mutations causing a total loss of function. (B) Zooms on important re-organizations of the mutated residues between structures at pH 4 (4HFI-gray) and pH 7 (4NPQ-black). (C) Electrophysiological recordings in oocytes of the three mutants labeled with bimane showing no current in comparison with GLIC presenting sensor mutations only. pH-dependent curves in fluorescence for the three mutants with the sensor Bim136-Q101W (D) and Bim250-Y197 (E). ECD, extracellular domain; TMD, transmembrane domain.
Figure 4—figure supplement 1
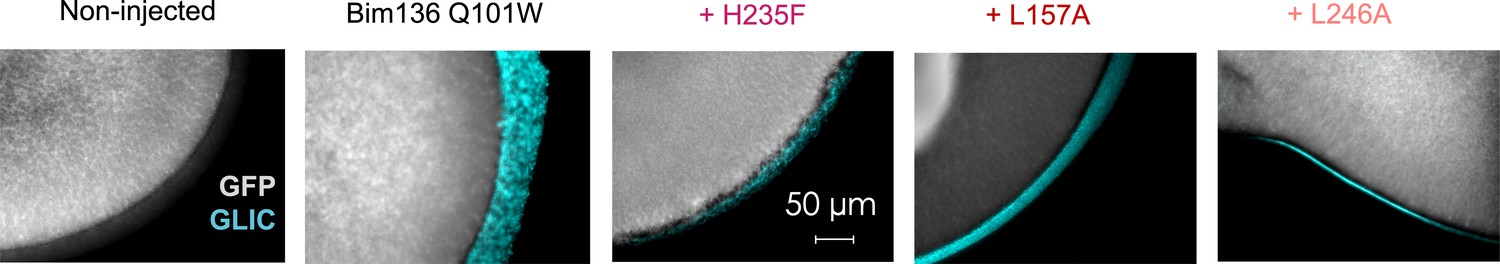
Immunofluorescence microscopy data showing GLIC expression at the oocytes surface.
In gray is the GFP fluorescence and in blue the fluorescence resulting from GLIC immunolabeling via anti-HA antibody. The scale and exposure time are the same for all images.
Figure 5
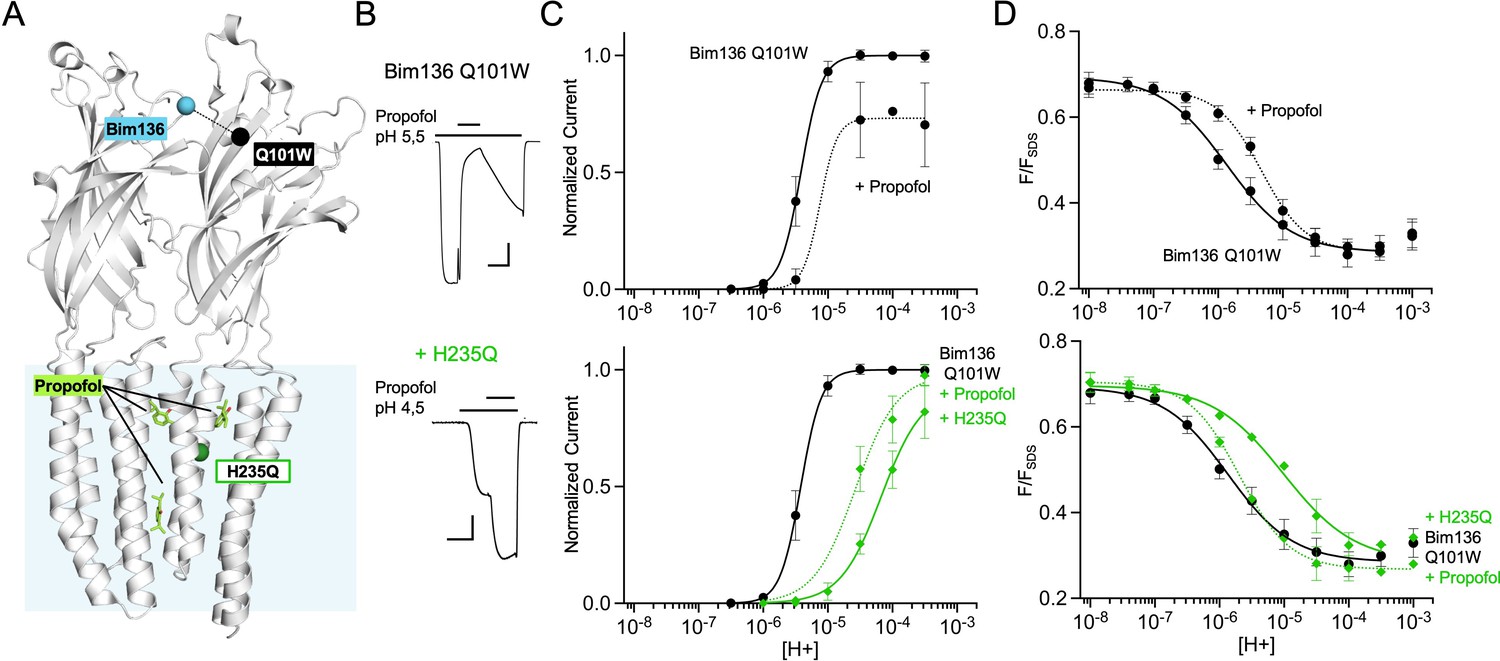
Allosteric coupling between the top of the ECD and propofol binding.
(A) Structure of two monomers of GLIC pH 4 showing positions of the fluorescence sensor Bim136-Q101W at the top of the ECD and three propofol binding sites intra, inter-subunit, and in the pore identified by X-ray crystallography (Fourati et al., 2018). (B) Example of electrophysiological response to 100 μM propofol during a low pH application (scale bars represent 100 nA and 30 s). (C) Electrophysiological pH-dependent curves of Bim136-Q101W with (◆) and without (●) the H235Q mutation showing inhibition and potentiation, respectively. (D) Effect of 100 μM propofol on fluorescence quenching without (top panel) and with H235Q mutation (lower panel) for the Bim136-Q101W sensor. ECD, extracellular domain.
Figure 6 with 2 supplements
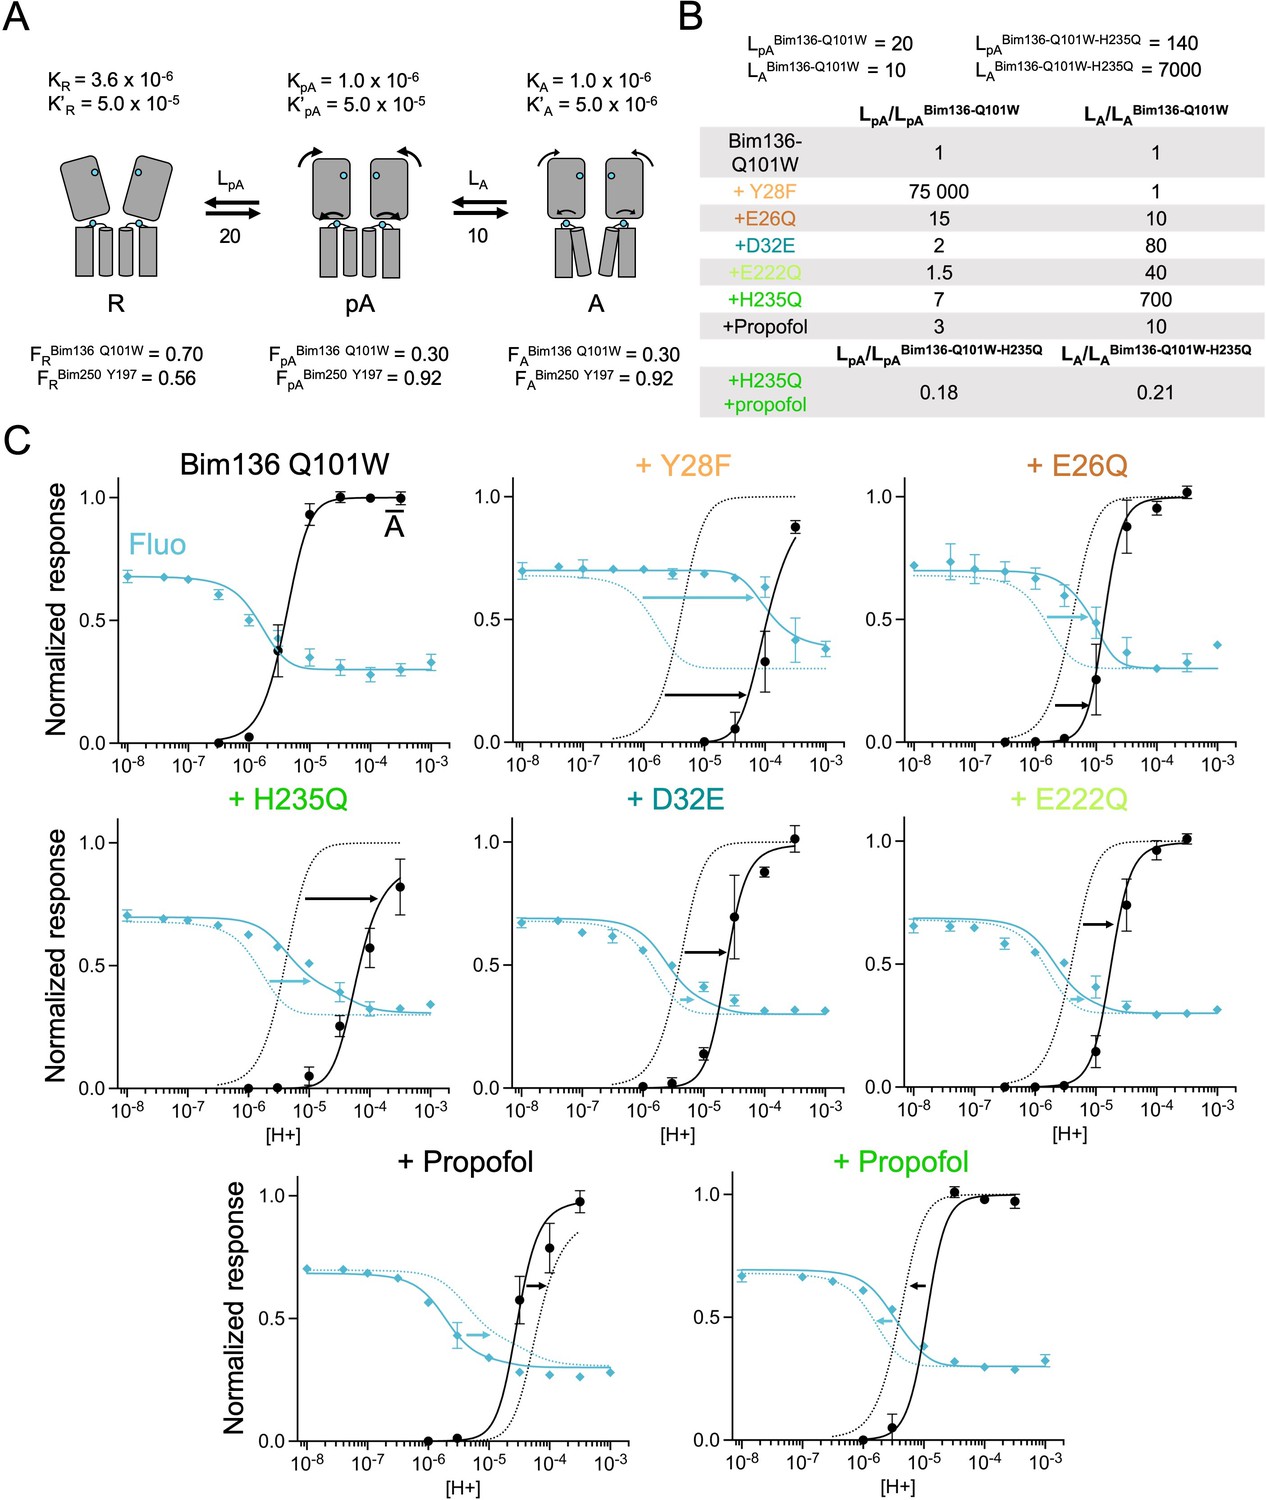
The three-state MWC model fits experimental data for Bim136Q101W mutants.
(A) Scheme showing the three states and parameters of the model. (B) Table with multiplication factors of isomerization constants for pre-activation and activation as compared to Bim136-Q101W. For the Bim136-Q101W-H235Q in presence of propofol, the multiplication factors are given in comparison with Bim136-Q101W-H235Q. Isomerization constants of Bim136-Q101W and Bim136-Q101W-H235Q are shown above the table (see full table in Figure 6—figure supplement 2—source data 1). (C) Superposition of experimental data points and theoretical curves. Data points shown as spheres correspond to fluorescence intensities normalized on FSDS (blue, ◆), and to electrophysiological response normalized to the maximal current in (black, ●) except H235Q without propofol for which values were normalized to the values in the presence of propofol. Theoretical curves: the population of A state is shown in black lines and the fluorescence curve (blue line) is calculated from the sum of the three states’ fractional populations weighted by their intrinsic fluorescence intensity (see formula in Materials and methods section). For each mutant, the fit from Bim136-Q101W (Bim136-Q101W-H235Q for the last panel) is shown in dotted blue and black lines for a visual comparison and arrows are illustrating the shift in pH50. MWC, Monod-Wyman-Changeux.
Figure 6—figure supplement 1
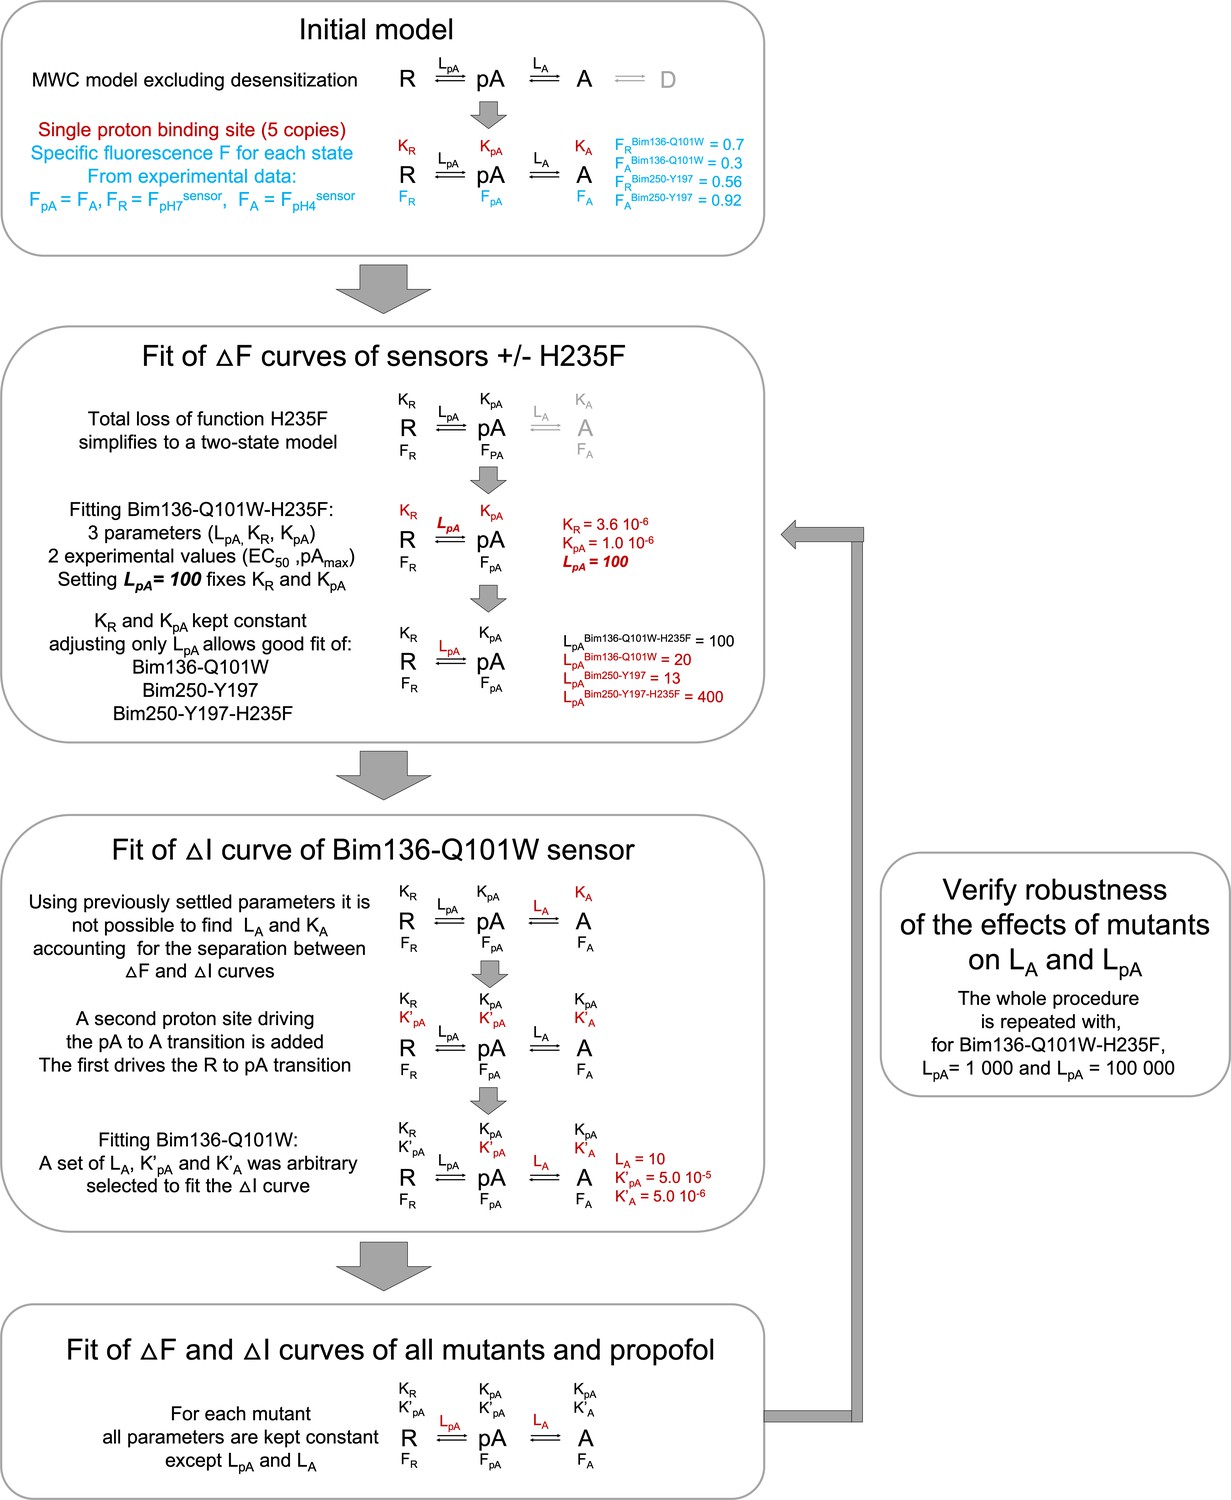
Workflow for fitting experimental data using the MWC model.
The chart is showing the main assumptions and steps to establish parameters of the MWC model in order to fit the data. MWC, Monod-Wyman-Changeux.
Figure 6—figure supplement 2
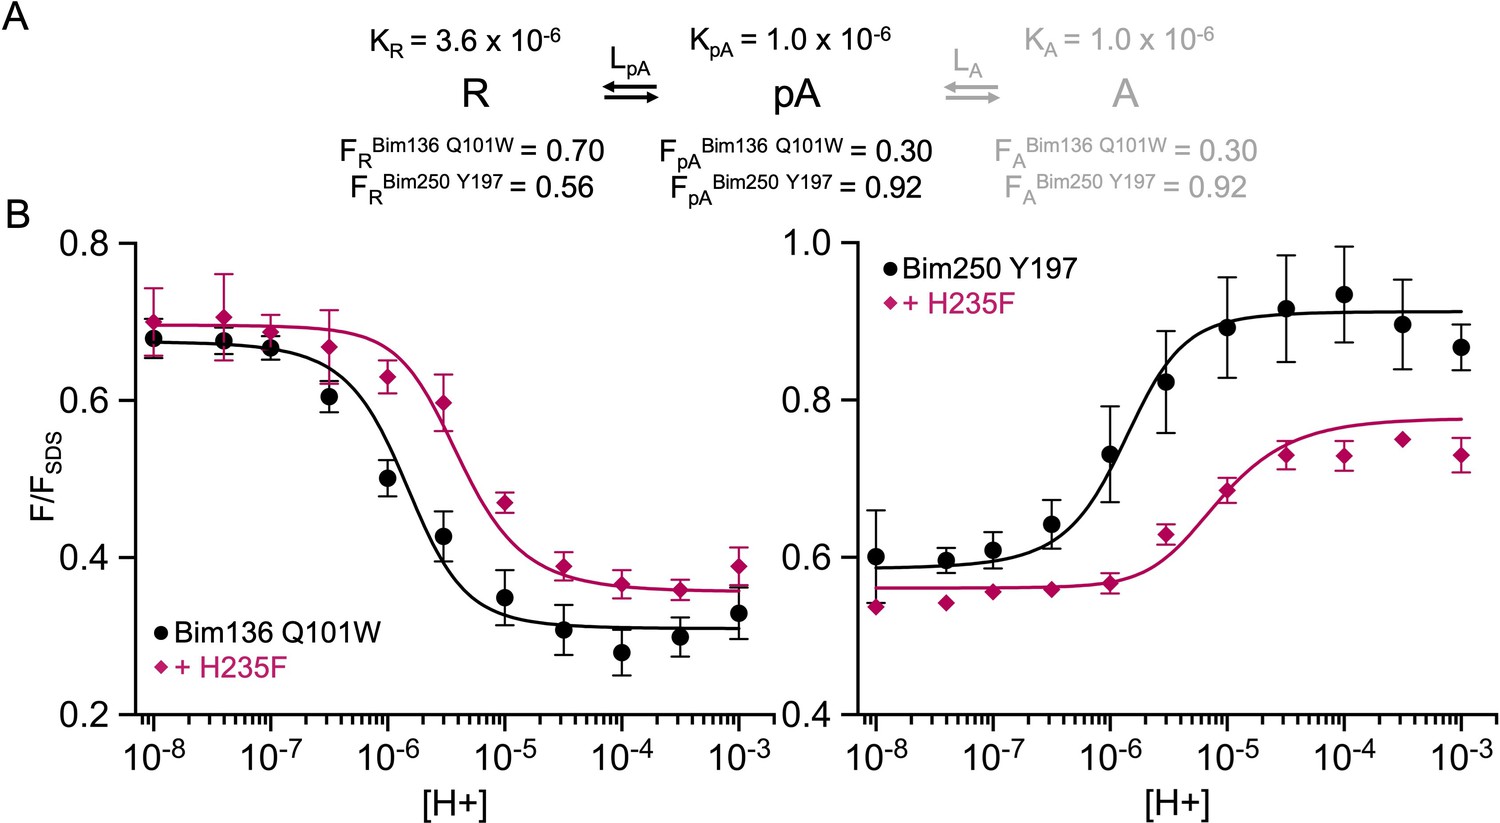
A simplified two-state MWC model to fit the total loss of function mutant H235F.
(A) Two-state model and parameters used in the model and their fixed values. (B) Superposition of experimental data points (fluorescence quenching normalized on FSDS), and theoretical fluorescence curve calculated from the two states weighted by their intrinsic fluorescence intensity. MWC, Monod-Wyman-Changeux.
-
Figure 6—figure supplement 2—source data 1
Summary of isomerization constant set for each mutant.
To test the robustness of the fitting, the model was tested starting with the isomerization constant of LpA from Bim136-Q101W-H235F set at 100, 1000, or 100,000. The multiplication factor is calculated in comparison with Bim136-Q101W constants except for H235Q + propofol (compared to Bim136-Q101W-H235Q) and mutations on Bim250-Y197 sensor background (compared to Bim250-Y197). LpA constant was averaged on the 3 LpA values. Affinity constants used for the second binding site were K’R=5×10⁻⁵, K’pA=5×10⁻⁵, and K’A=5×10⁻⁶, affinity constants of the first binding site are shown in the table for the different LpA values and fluorescence values for each state are indicated in Figure 6—figure supplement 2. To assess how well our model fits the experimental values, the determination coefficient (R2) was calculated for each mutant with the different LpA and corresponding affinities. R2 was calculated for both fluorescence quenching (R2 Fluo) and electrophysiological response (R2 current).
- https://cdn.elifesciences.org/articles/60682/elife-60682-fig6-figsupp2-data1-v2.xlsx
Figure 7
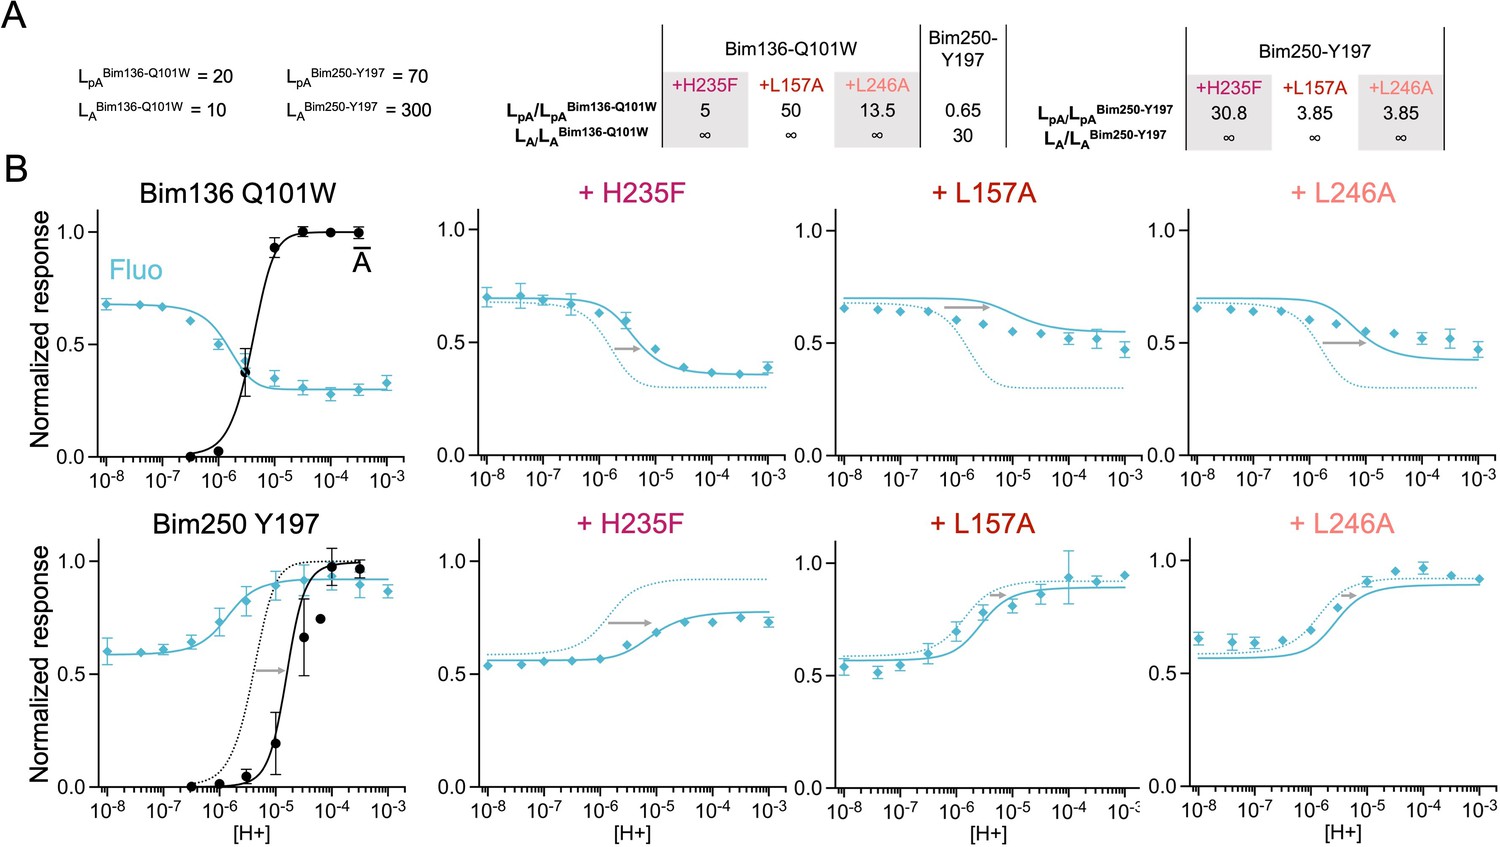
The three-state MWC model fits experimental data for total loss of function mutants.
Data are presented as in Figure 6. (A) Multiplication factors of isomerization constants for pre-activation and activation of total loss of function mutants as compared to sensors Bim136-Q101W and Bim250-Y197. (B) Superposition of experimental data points and theoretical curves. Data points (in spheres) correspond to fluorescence intensities normalized on FSDS (blue ◆), and to electrophysiological response normalized to the maximal current (black, ●). Theoretical curves: the population of A state is shown in black lines for sensors and the fluorescence curve (blue line) is calculated from the sum of the three states’ fractional populations weighted by their intrinsic fluorescence intensity. For each mutant, the fit from the associated sensors (Bim136-Q101W or Bim250 Y197) is shown in dotted lines for a visual comparison and arrows are illustrating the shift in pH50. MWC, Monod-Wyman-Changeux.
Figure 8
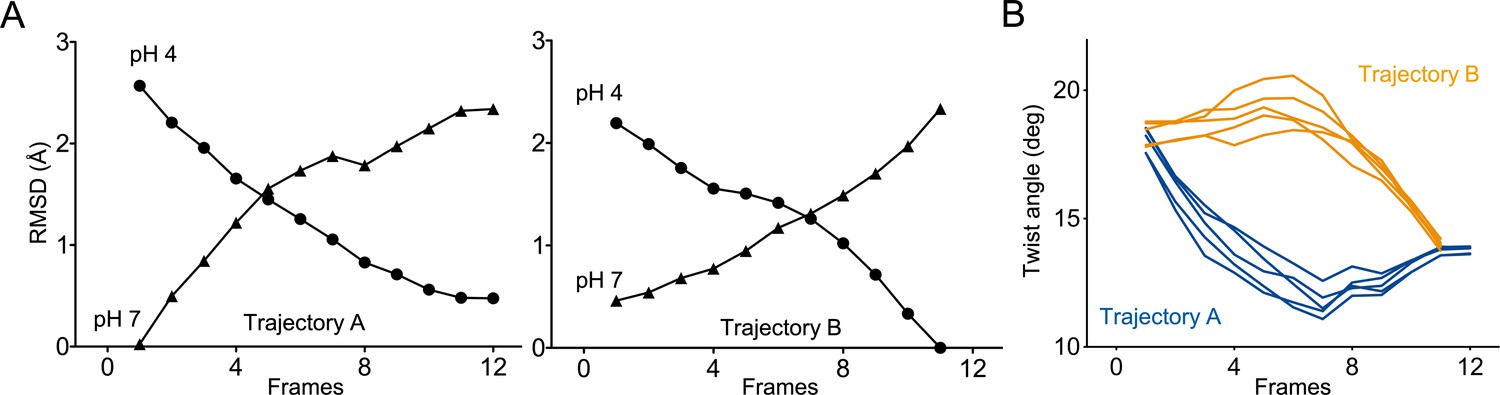
Two distinct trajectories for GLIC activation computed using iMODfit.
(A) RMSD evolution throughout the frames of trajectories A and B against GLIC structures at pH 4 (●); pH 7 (▲), pdb codes are 4HFI and 4NPQ, respectively. Both trajectories are shown with frame one being the closest to GLIC-pH 7. (B) Twist angle measured throughout the frames on both trajectories. The twist angle is measured by the angle formed between vectors from the centers of mass of the ECD and TMD as defined in Calimet et al., 2013. Each trace corresponds to the trajectory of a single subunit within the pentamer.
Figure 9
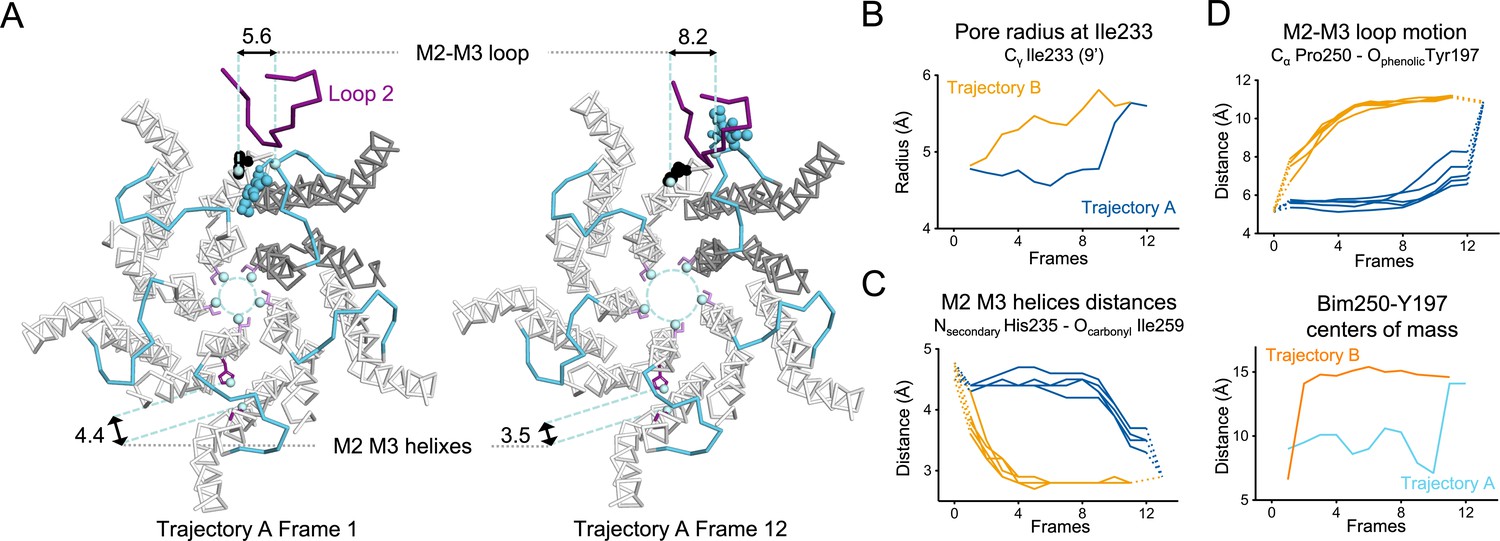
Key TMD motions in trajectories A and B.
(A) Snapshots of GLIC TMD top view in the first and last frame of the trajectory A with a Bim250-Y197 quenching pair modeled at one interface. Bimane is shown in blue and Y197 in black spheres. One subunit is shown in gray, the others are in white, the M2-M3 loop is shown in blue, and the loop 2 from ECD is shown in purple for one subunit. Atoms used for measurements are shown in pale blue spheres and distances are indicated in angstroms. (B) Pore radius measured at the Ile233 level. (C) Intra-subunit separation of M2 and M3 helices measured between atoms indicated. Points at positions 0 and 13 are the distances measured in pH 4 and pH 7 X-ray structures. (D) Inter-subunit distances showing M2-M3 loop outward motion at the Pro250-Tyr197 level (top panel) and between bimane and Tyr197 centroids (bottom panel) in both trajectories A and B. ECD, extracellular domain; TMD, transmembrane domain.
Figure 10 with 3 supplements
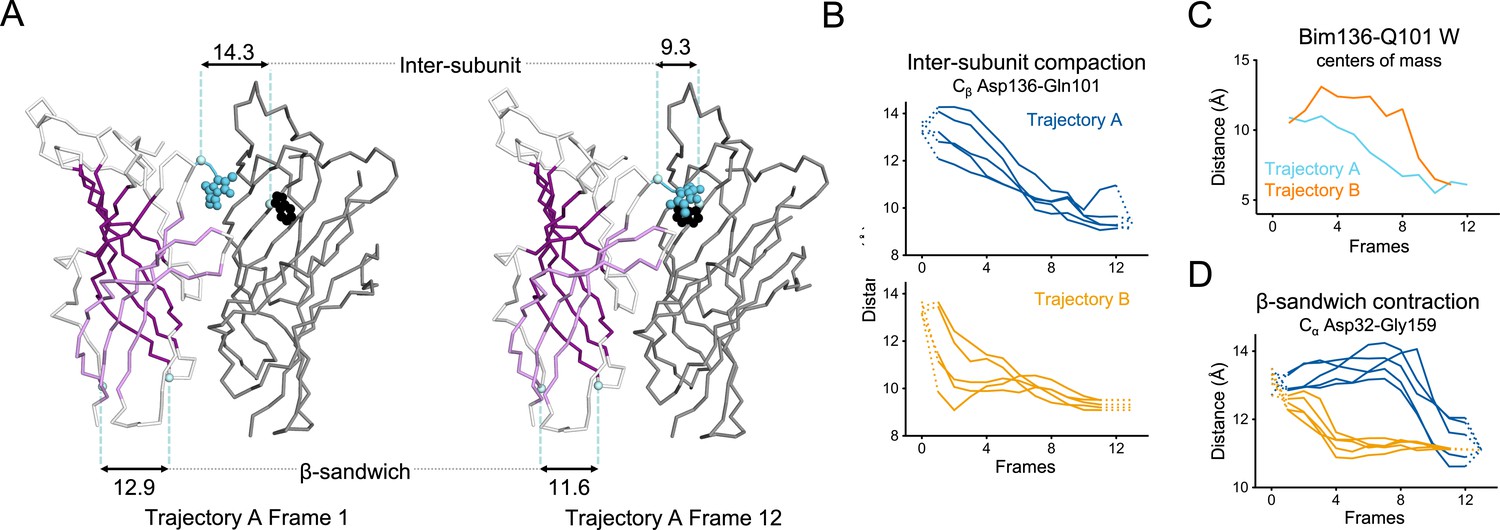
Key ECD motions in trajectories A and B.
(A) Snapshots of two subunits of GLIC ECD in the first and last frame of the trajectory A with a Bim136-Q101W quenching pair modeled at the interface. One subunit is shown in gray, the other in white with sheets of the β-sandwich shown in dark and light purple; bimane is shown in blue and Trp101 in black spheres; Cα and Cβ atoms used for measurements are shown in pale blue spheres and distances are indicated in angstroms. Inter-subunit distances showing ECD compaction measured at the Asp136-Gln101 level (B) and between bimane and Q101W centroids (C) in both trajectories A and B. Points at frames 0 and 13 are the distances in pH 4 and pH 7 X-ray structures. (D) Intra-subunit distance showing contraction at the bottom of the β-sandwich measured by Cα distances between Asp32 and Gly159. ECD, extracellular domain.
Figure 10—figure supplement 1
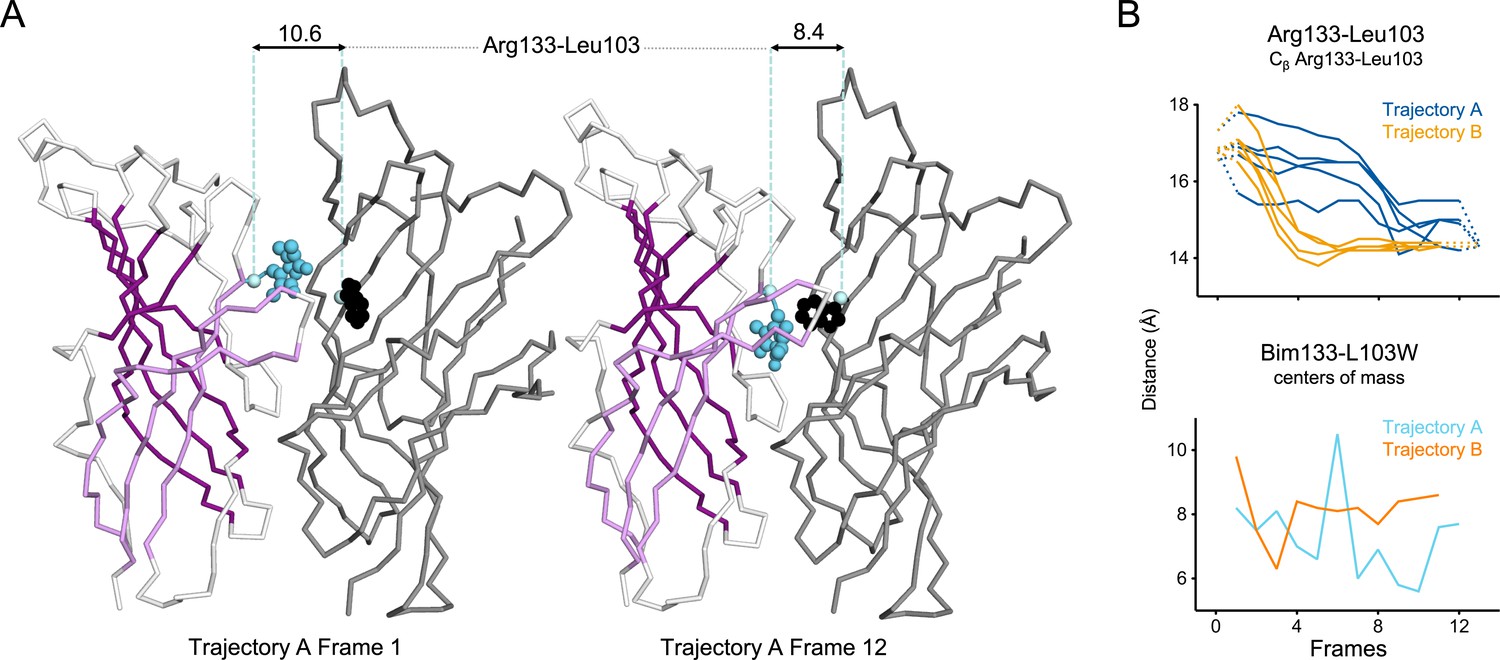
Evolution of ECD inter-subunits distance Arg133-Leu103 at the top of the ECD in iMODfit trajectories.
(A) Snapshots of two subunits of GLIC ECD in the first and last frame of the trajectory A with a Bim133-L103W quenching pair modeled. One subunit is shown in gray, the other in white with β-sheets forming the β-sandwich shown in dark and light purple; bimane is shown in blue and quencher in black spheres; Cβ atoms used for measurements are shown in pale blue spheres and distances are indicated in angstroms. (B) Inter-subunit distances showing ECD compaction at the Arg133-Leu103 level (top panel) and between bimane and L103W centers of mass (bottom panel) in both trajectories A and B. Points at frames 0 and 13 are the distances in pH 4 and pH 7 structures subunits interfaces. ECD, extracellular domain.
Figure 10—figure supplement 2
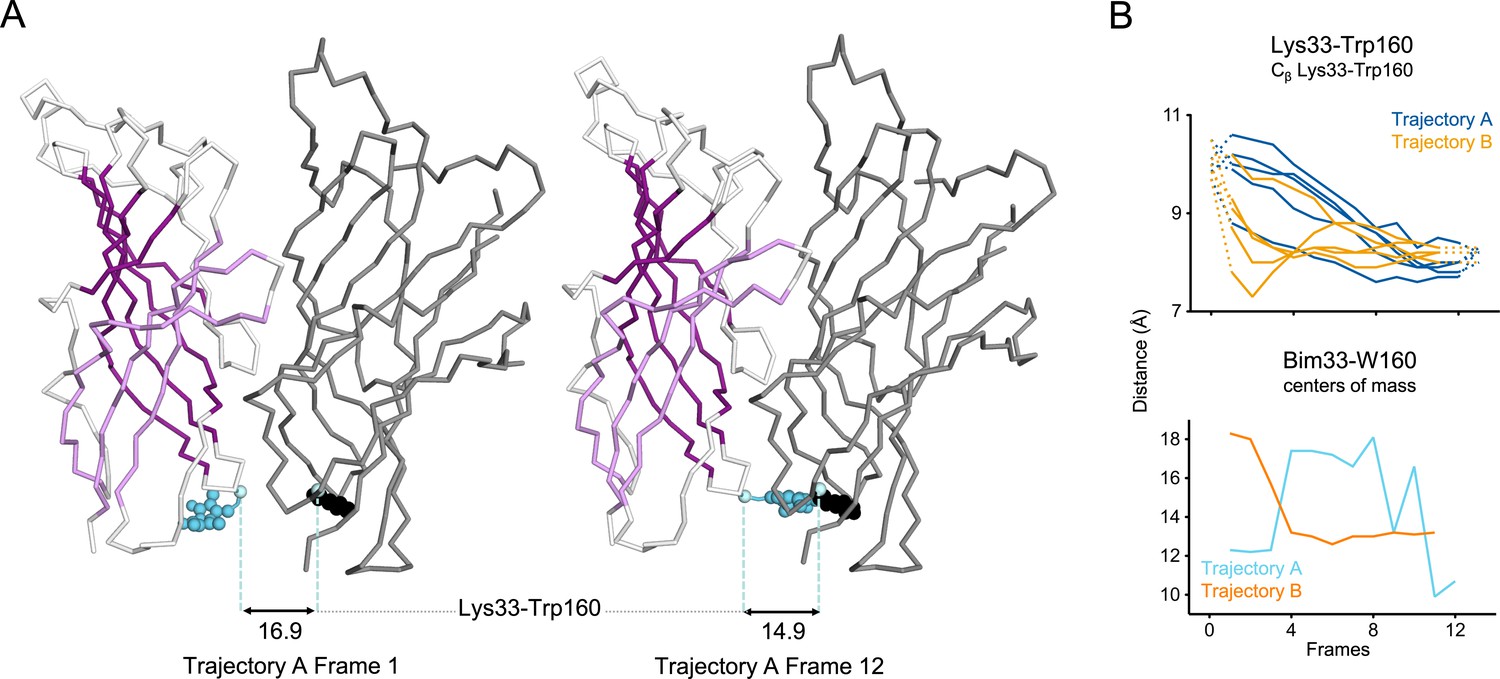
Evolution of ECD inter-subunits distance Lys33-Trp160 at the bottom of the ECD in iMODfit trajectories.
(A) Snapshots of two subunits of GLIC ECD in the first and last frame of the trajectory A with Bim33-W160 quenching pair modeled. One subunit is shown in gray, the other in white with β-sheets forming the β-sandwich shown in dark and light purple; bimane is shown in blue and quencher in black spheres; Cβ atoms used for measurements are shown in pale blue spheres and distances are indicated in angstroms. (B) Inter-subunit distances showing ECD compaction at the Lys33-Trp160 level (top panel) and between bimane and W160 centers of mass (bottom panel) in both trajectories A and B. Points at frames 0 and 13 are the distances in pH 4 and pH 7 structures subunits interfaces. ECD, extracellular domain.
Figure 10—figure supplement 3
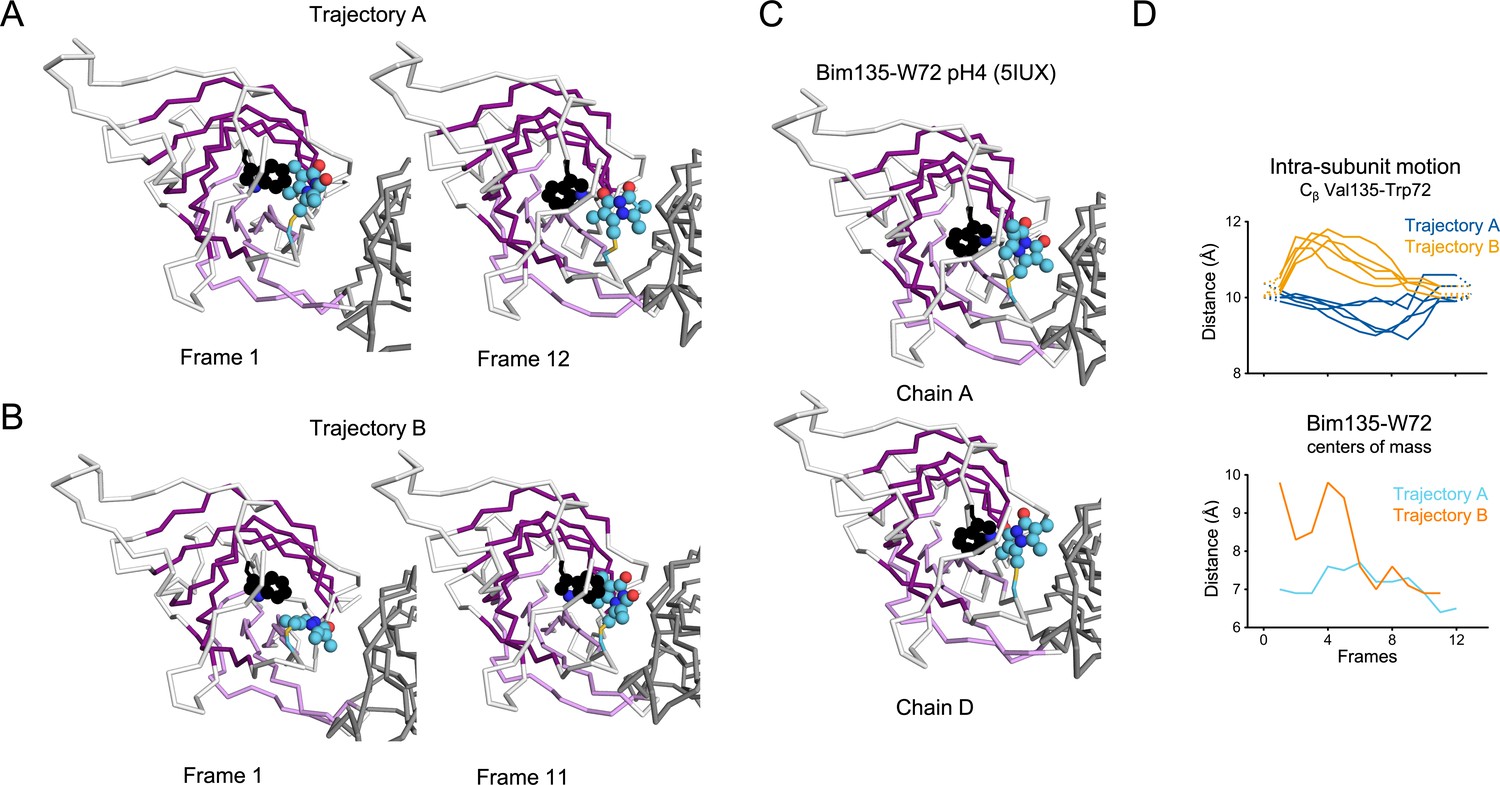
Evolution of Bim135-W72 orientation at the ECD intra-subunits in iMODfit trajectories.
(A) Snapshots of one subunit of GLIC ECD, top view in the first and last frame of the trajectory A with Bim135-W72 quenching pair modeled. The adjacent subunit is shown in gray, and the main subunit is shown in white with β-sheets forming the β-sandwich shown in dark and light purple; bimane is shown in blue and quencher in black spheres. (B) Snapshots for the trajectory B. (C) Similar representation from the structure resolved by X-ray of Bim135-W72 at pH 4 (5IUX). Bimane was resolved in two out of five chains and showed a similar orientation to the one found in the last frames of both trajectories (A and B right panels). (D) Intra-subunit Cβ distances between Val135 and Trp72 (top panel) and between Bim135 and Trp72 centers of mass (bottom panel) along the trajectories. Conclusion for Bim135-W72, the distances between the centers of mass of the bimane and indole moieties are not correlated with the distances between the residue’s backbone. Since at this position bimane occupies a rather buried location within the protein structure, we suggest that these discrepancies come from local reorganization of surrounding residues that are not directly correlated with the movement of the backbone. Interestingly, we previously solved the X-ray structure of Bim135-W72 at pH 4 by crystallography, which shows a similar location of the bimane moiety with that of our docking in GLIC-pH 4. ECD, extracellular domain.
Figure 11
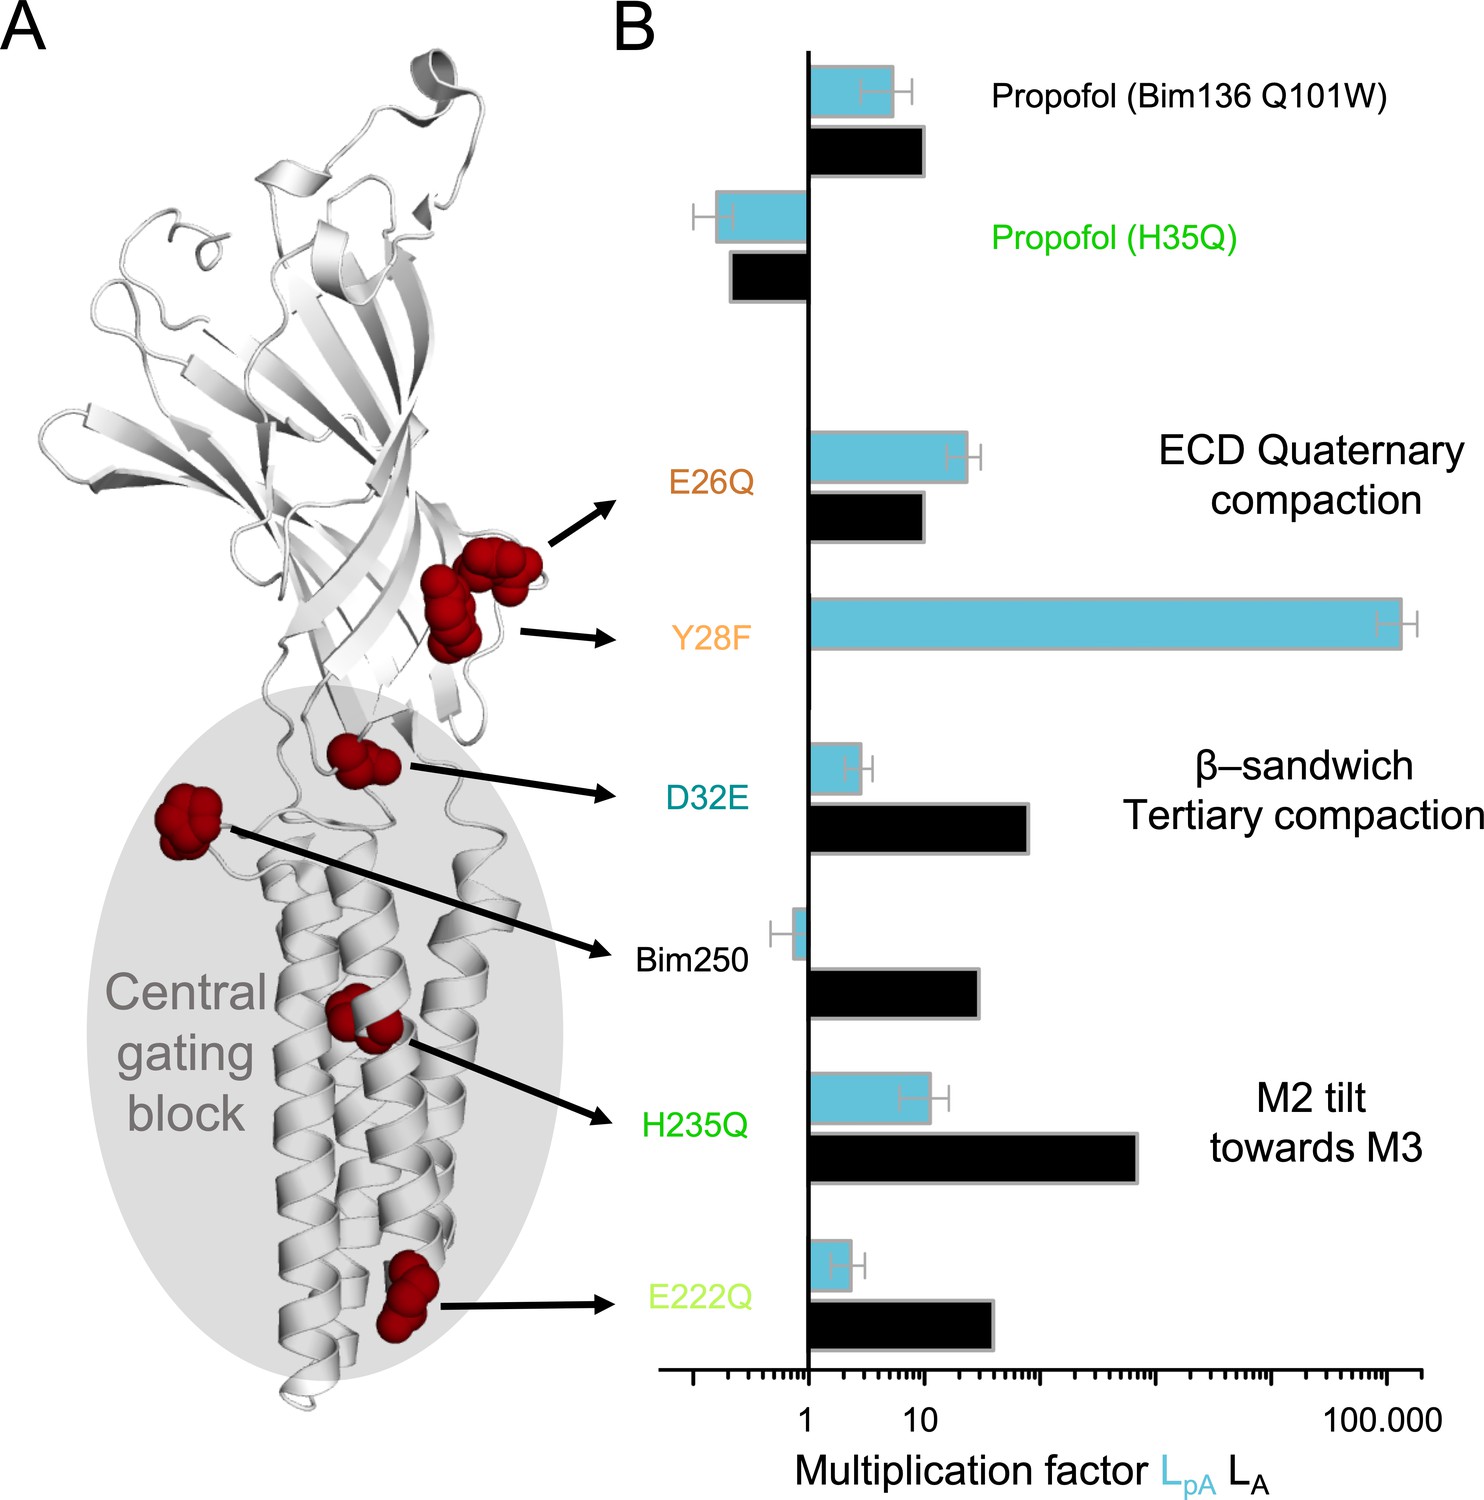
Effect of mutations on pre-activation and activation.
(A) One subunit of GLIC showing the positions of tested mutations in red spheres, with in gray the region involved in the central gating pathway identified by iModFit. (B) Multiplication factor shown on a log scale for each mutant to visualize how isomerization constants LpA and LA were modified in comparison with Bim136-Q101W, or for propofol (H235Q) in comparison with the same mutant without propofol.
Tables
Table 1
pH-dependence of electrophysiological and fluorescence quenching responses.
pH50 and Hill coefficient nH average and standard deviation values are shown after individual fitting of each measurement. n corresponds to the number of oocytes for electrophysiology and the number of fluorescence measurements, each measurement including values for a full pH range. F0 corresponds to the initial fluorescence value at pH 7/8 and ∆Fmax is the maximum variation in fluorescence amplitude within the pH range (absolute values). To reasonably fit Bim136-Q101W + propofol current and Bim136-Q101W-Y28F fluorescence, Hill coefficients have been constrained to 2.5 and below 3 respectively. ∆pH50s are calculated between mutants and their parent construct Bim136-Q101W or Bim250-Y197 (labeled Ref). Their significance was calculated with a one-way ANOVA test using a Dunnett’s multiple comparisons test. The p-value is significantly different with p-value≤0.0001 (****), ≤ 0.001 (***), ≤0.01(**), ≤0.05 (*) or not significantly different when p-value>0.05 (ns). NF stands for non-functional and ND for not determined. To compare electrophysiological pH50 and fluorescence pH50 for each mutant (right column), unpaired t-tests were done with two-tailed p-value and 95% confidence intervals.
Mutant | Electrophysiological response bimane labeled | Fluorescence quenching response | Fluorescence/ | |||||||||||||
|---|---|---|---|---|---|---|---|---|---|---|---|---|---|---|---|---|
| in detergent solution | electrophysiology | |||||||||||||||
| pH50 | nH | n | ∆pH50 | pH50 | F0 | ∆FMAX | nH | n | ∆pH50 | ∆pH50 | ||||||
| Bim136-Q101W C27S | 5.42±0.08 | 2.68±0.33 | 10 | Ref | 5.85±0.21 | 0.71±0.03 | 0.45±0.06 | 0.77±0.18 | 17 | Ref | – | 0.43 | *** | |||
| + E26Q | 4.83±0.12 | 2.98±0.64 | 6 | −0.59 | **** | 5.28±0.34 | 0.53±0.02 | 0.22±0.02 | 1.13±0.27 | 4 | −0.57 | ** | – | 0.45 | * | |
| + Y28 F | 3.88±0.08 | 2.63±0.68 | 3 | −1.54 | **** | 3.68±0.34 | 0.70±0.01 | 0.38±0.09 | <3 | 3 | −2.17 | **** | – | −0.2 | *** | |
| + Y28 F & C27 | 5.34±0.11 | 2.03±0.12 | 6 | −0.08 | ns | ND | ND | ND | ND | – | – | – | – | |||
| + D32E | 4.65±0.12 | 2.62±1.51 | 6 | −0.77 | **** | 5.52±0.05 | 0.68±0.02 | 0.38±0.01 | 0.75±0.05 | 3 | −0.33 | ns | – | 0.87 | *** | |
| + E222Q | 4.68±0.09 | 2.51±0.33 | 5 | −0.74 | **** | 5.36±0.14 | 0.66±0.03 | 0.40±0.04 | 0.74±0.18 | 3 | −0.49 | * | – | 0.68 | *** | |
| + H235Q | 4.04±0.21 | 1.19±0.31 | 6 | −1.38 | **** | 5.00±0.09 | 0.70±0.01 | 0.42±0.01 | 0.78±0.10 | 3 | −0.85 | **** | – | 0.96 | *** | |
| + Propofol | 5.16±0.13 | =2.5 | 3 | −0.26 | * | 5.33±0.06 | 0.67±0.02 | 0.38±0.01 | 1.21±0.21 | 4 | −0.52 | ** | – | 0.17 | ns | |
| + H235 Q & propofol | 4.71±0.15 | 1.53±0.48 | 6 | −0.71 | **** | 5.67±0.14 | 0.70±0.01 | 0.43±0.01 | 1.25±0.04 | 3 | −0.18 | ns | – | 0.96 | *** | |
| + H235 F | NF | NF | 3 | – | 5.25±0.08 | 0.70±0.05 | 0.38±0.04 | 1.06±0.17 | 3 | −0.60 | ** | – | – | |||
| + L157 A | NF | NF | 3 | – | 5.42±0.65 | 0.67±0.01 | 0.19±0.09 | 0.71±0.46 | 4 | −0.43 | * | – | – | |||
| + L246 A | NF | NF | 3 | – | 4.87±0.14 | 0.65±0.01 | 0.24±0.01 | 0.79±0.12 | 3 | −0.98 | **** | – | – | |||
| Bim250-Y197 | 4.66±0.18 | 2.20±0.54 | 12 | −0.76 | **** | 5.83±0.17 | 0.59±0.04 | 0.33±0.09 | 1.19±0.28 | 8 | −0.02 | ns | Ref | 1.17 | *** | |
| + H235 F | NF | NF | 3 | – | 5.40±0.13 | 0.54±0.01 | 0.20±0.01 | 1.16± 0.15 | 4 | – | −0.43 | ** | – | |||
| + L157 A | NF | NF | 3 | – | 5.81±0.19 | 0.49±0.06 | 0.45±0.07 | 0.64±0.19 | 3 | – | −0.02 | ns | – | |||
| + L246 A | NF | NF | 3 | – | 5.53±0.03 | 0.64±0.01 | 0.30±0.01 | 1.69±0.29 | 3 | – | −0.3 | * | – | |||
Key resources table
| Reagent type (species) or resource | Designation | Source or reference | Identifiers | Additional information |
|---|---|---|---|---|
| Gene (Gloeobacter violaceus) | glvI, GLIC | UniProt | Q7NDN8 | |
| Strain, strain background (Escherichia coli) | BL21(DE3) C43 | Sigma-Aldrich | CMC0019 | Chemically competent cells |
| Biological sample (Xenopus laevis) | Xenopus oocytes | Centre de Ressources Biologiques Xénopes (Rennes- France) and Ecocyte Bioscience (Dortmund-Germany) | ||
| Antibody | Anti-HA Tag (rabbit) | Euromedex | HA-1A1-20 µL | (1:200) |
| Antibody | Anti-rabbit – Alexa Fluor 645 (goat) | Molecular probes | A21246 | (1:1000) |
| Recombinant DNA reagent | Pet20b-MBP-GLIC | Bocquet et al., 2007 | ||
| Recombinant DNA reagent | pMT3-GLIC-HAtag | Nury et al., 2011 | ||
| Recombinant DNA reagent | Pmt3-GFP | Nury et al., 2011 | ||
| Chemical compound, drug | Monobromo-Bimane | Thermo Fisher Scientific | M1378 | |
| Chemical compound, drug | Bunte salt Bimane | Menny et al., 2017 | ||
| Chemical compound, drug | Propofol | Sigma-Aldrich | Y0000016 | |
| Software algorithm | iMODfit | Lopéz-Blanco and Chacón, 2013 | ||
| Software algorithm | MOLEonline | Pravda et al., 2018 | ||
| Software algorithm | Clampfit | Molecular devices | ||
| Software algorithm | AxoGraph X | https://axograph.com/ |
Additional files
Download links
A two-part list of links to download the article, or parts of the article, in various formats.
Downloads (link to download the article as PDF)
Open citations (links to open the citations from this article in various online reference manager services)
Cite this article (links to download the citations from this article in formats compatible with various reference manager tools)
Mutational analysis to explore long-range allosteric couplings involved in a pentameric channel receptor pre-activation and activation
eLife 10:e60682.
https://doi.org/10.7554/eLife.60682


