The heteromeric PC-1/PC-2 polycystin complex is activated by the PC-1 N-terminus
- Department of Physiology, University of California, San Francisco, United States
- Department of Biochemistry, University of Utah School of Medicine, United States
- Division of Nephrology, Department of Medicine, University of Maryland School of Medicine, United States
Figures
Figure 1 with 1 supplement
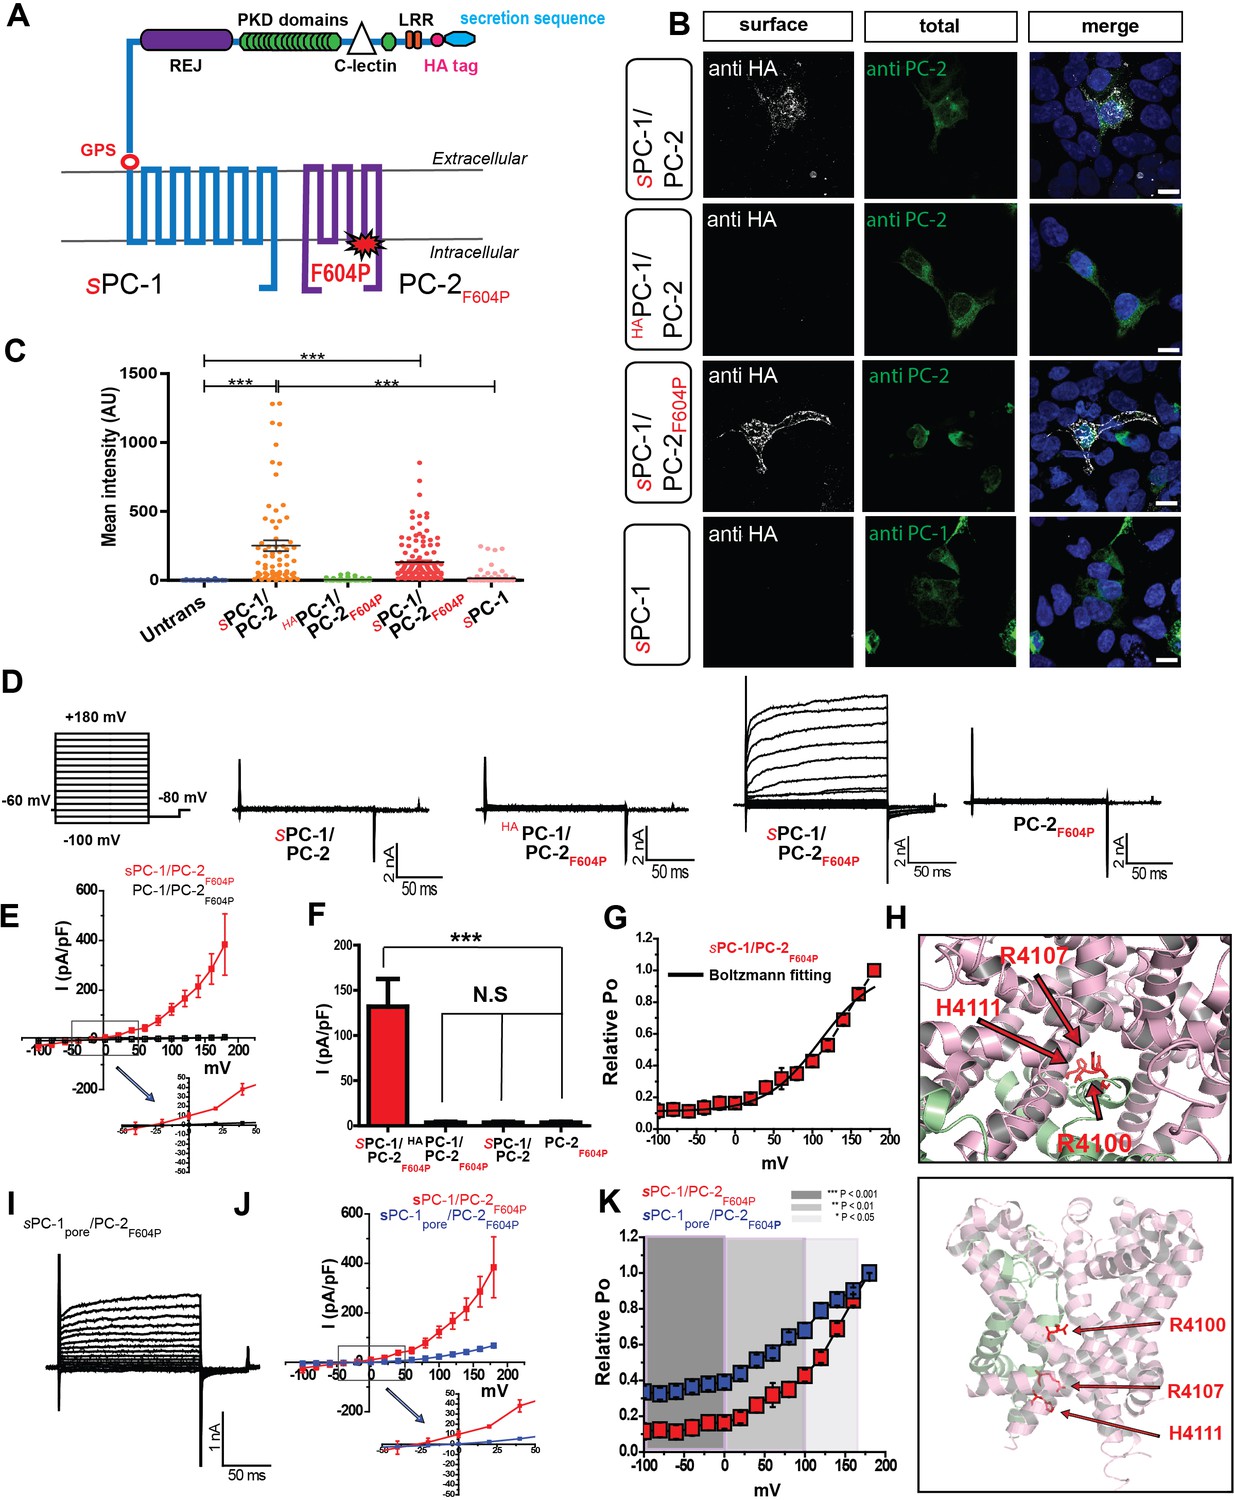
PC-1 and PC-2 form functional channels in the plasma membrane.
(A) Illustration of PC-1 and PC-2F604P topology highlighting extracellular HA and secretion sequence (indicated with an s prefix) in PC-1. (B) Expression and immunostaining of HEK293 cells transfected with sPC-1/PC-2, HAPC-1/PC-2 with endogenous leader sequence, sPC-1/PC-2F604P, and sPC-1 alone. Left column, representative images of HA surface staining (see methods). Middle column, total staining for PC-2 or PC-1. Right column, merged images. Scale bar: 10 μm. (C) Quantification of relative anti-HA surface staining shown in B. ***: p<0.0001. (D) Representative currents from each construct recorded in the whole cell patch clamp configuration in response to voltage step pulses (left). (E) Whole-cell I-V relationship of sPC-1/PC-2F604P (n = 6, red) and PC-1/PC-2F604P (n = 10, white). Arrow indicates the expanded view of I-V relationship between membrane potentials of −50 mV and +50 mV. (F) Current densities for sPC-1/PC-2F604P, HAPC-1/PC-2F604P, sPC-1/PC-2, and PC-2F604P alone at +100 mV. (G) Relative open probability of sPC-1/PC-2F604P at −80 mV calculated using a Boltzmann distribution fitted to I/Imin of tail current amplitudes, black line (n = 6, red). (H) Top view of the human PC-1/PC-2 polycystin complex using pymol (Su et al., 2018). Positively charged R4100, R4107, and H4111 are highlighted in red and displayed in stick shape (top). Side view of selectivity filter showing the location of three positively charged amino acids on PC-1 TM-11 (bottom). (I) Representative whole cell currents of sPC-1pore/PC-2F604P. (J) I-V relationship of sPC-1/PC-2F604P (n = 6, red) and sPC-1pore/PC-2F604P (n = 6, blue). Arrow indicates the expanded view of I-V relationship between −50 mV and +50 mV. Current densities of sPC-1/PC-2F604P and sPC-1pore/PC-2F604P were compared at +100 mV holding potential. (K) Relative open probability analysis of sPC-1/PC-2F604P (n = 6, red) and sPC-1pore/PC-2F604P (n = 6, blue) during a −80 mV tail pulse. Statistical significance is indicated by the background. ***p<0.001 (dark gray), **p<0.01 (gray), *p<0.05 (light gray). Statistical analysis was computed using student t-test unpaired one-pair.
Figure 1—figure supplement 1
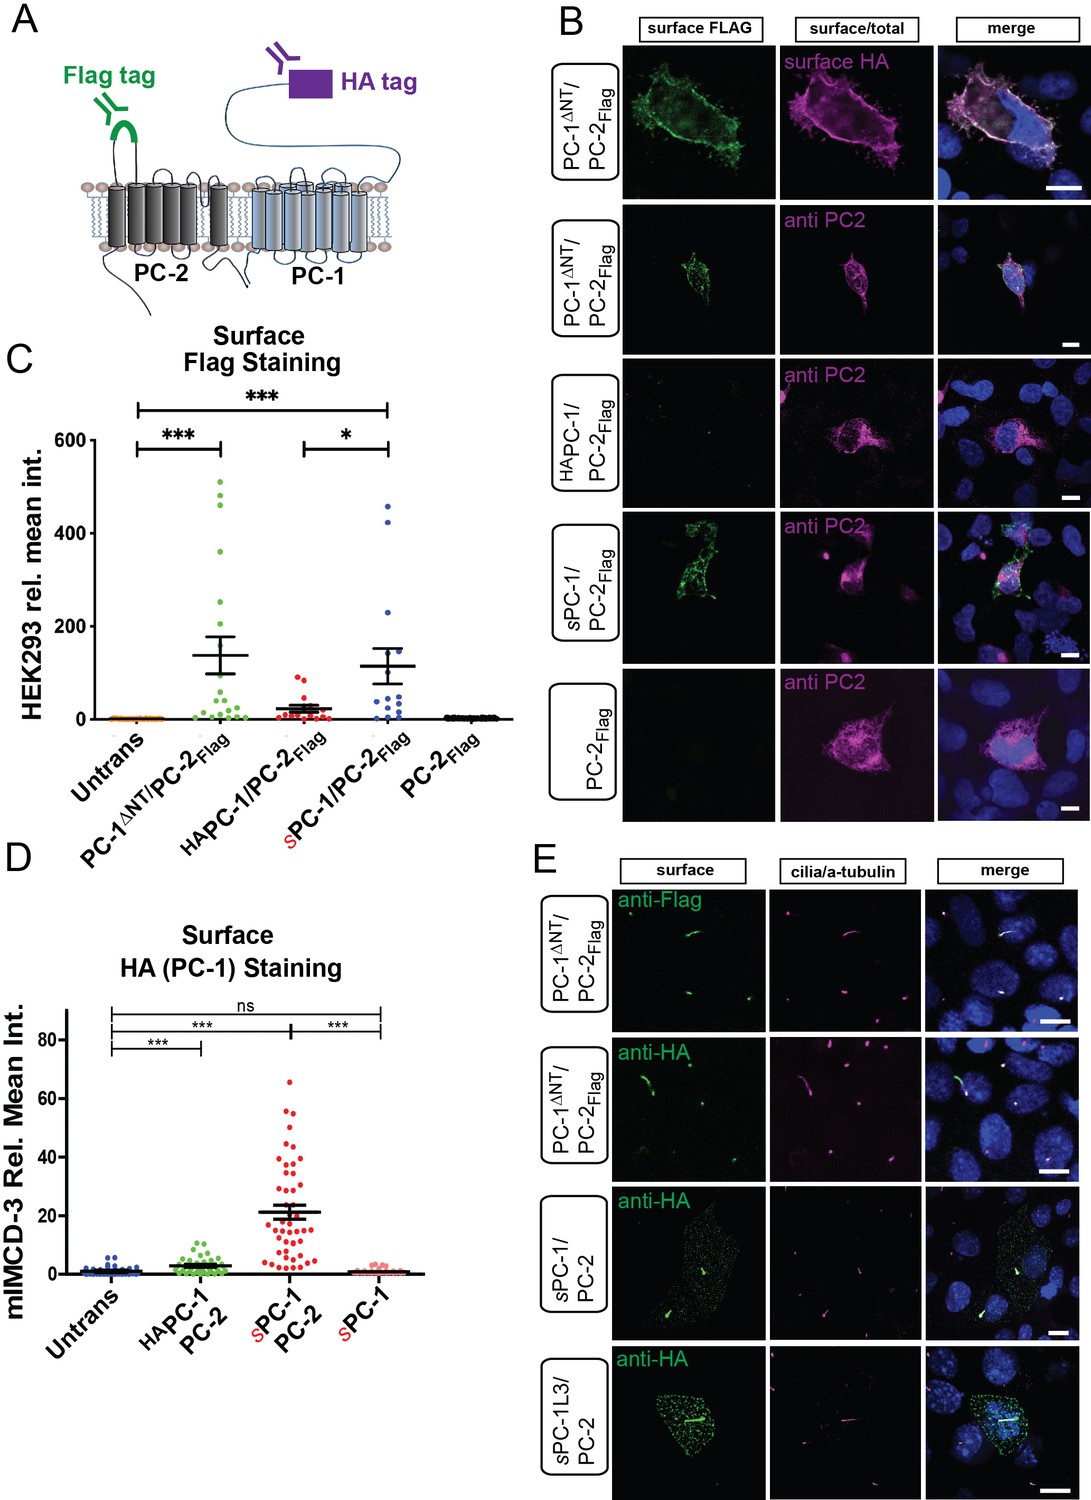
Surface expression of PC-1, PC-2FLAG, and PC-1L3 in HEK293 and mIMCD3 cells.
(A) Illustration of PC-1 and PC-2 with extracellular HA (magenta) and Flag tag (green), respectively. (B) Representative images of PC-1ΔNT/PC-2Flag, HAPC-1/PC-2Flag, sPC-1/PC-2Flag, and PC-2Flag surface expression in HEK 293 cells. Live HEK293 cells were labeled with anti-Flag and anti-HA (only top row) antibodies. After fixation and permeabilization, cells were labeled with anti-PC-2 antibody. (C) Quantification of relative mean fluorescence intensity of anti-Flag staining for constructs shown in B. (D) Quantification of relative mean fluorescence intensity for anti-HA antibody-labeled plasma membrane in the absence of primary cilium of mIMCD-3 cells. (E) Images of PC-1ΔNT/PC-2Flag, sPC-1/PC-2, and sPC-1L3/PC-2 transfected mIMCD-3 cells. Live cells were stained with anti-Flag (top row) or anti-HA antibody (second row form top) and cilia labeled using anti acetylated tubulin after permeabilization. PC-1ΔNT/PC-2Flag, sPC-1/PC-2, andsPC-1L3-PC-2 enrich in primary cilia when present.
Figure 2 with 1 supplement
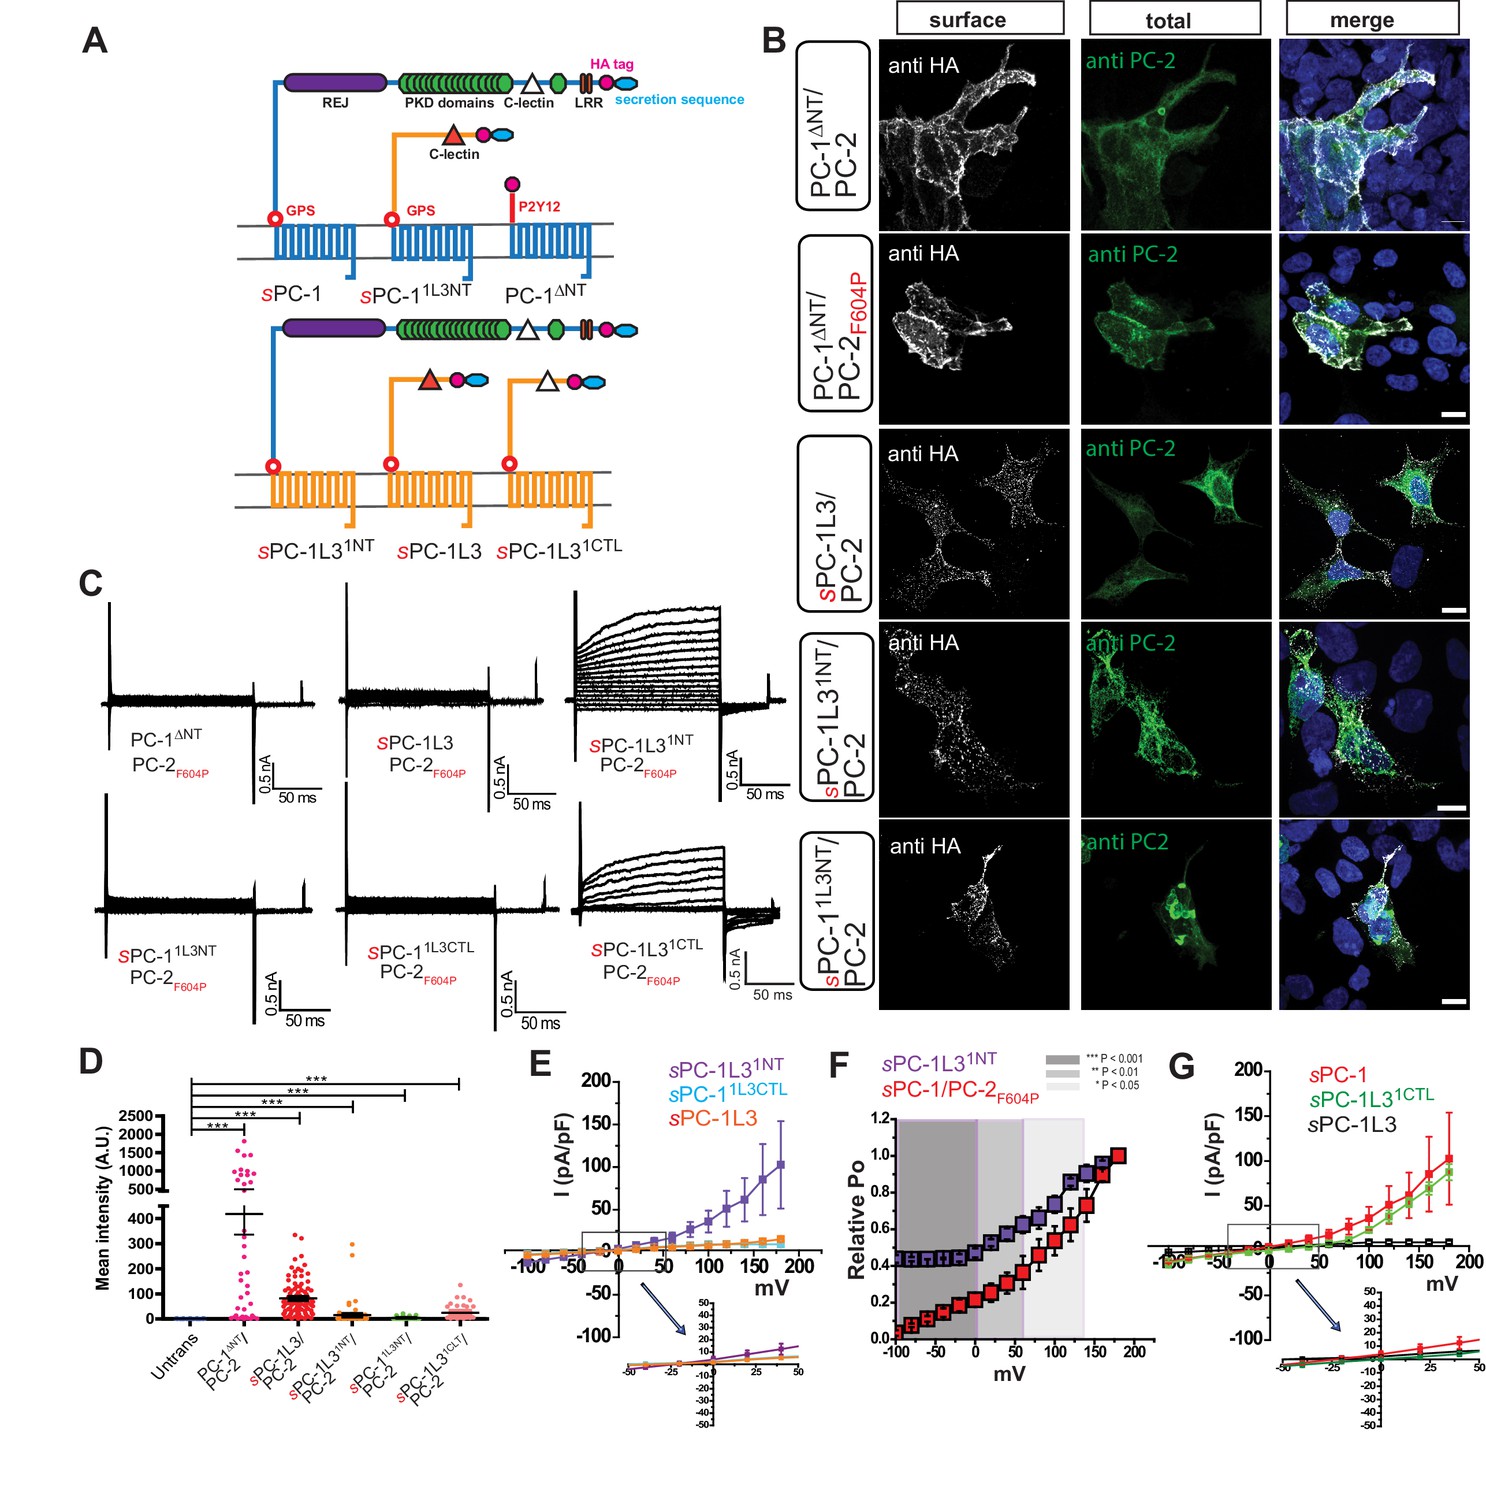
The PC-1 N-terminus is essential for polycystin complex activation.
(A) Schematic diagram illustrating topology of PC-1 (blue) and PC-1L3 (yellow), including PC-1ΔNT (top), PC-1 N-terminal chimeras (top), and PC-1L3 N-terminal chimeras (bottom). (B) Immunostaining of HEK293 cells transfected with indicated chimera. Left, representative images of anti-HA surface staining. Middle, total staining for PC-2. Right, merged images. Scale bar: 10 μm. (C) Representative whole cell current traces of each construct obtained from the voltage step pulses shown in Figure 1D. (D) Quantification of anti-HA surface staining of each construct shown in (B). ***p<0.001. (E) I-V relationships for N-terminal chimeras sPC-1L31NT/PC-2F604P (n = 5, purple), sPC-11L3CTL/PC-2F604P (n = 10, light blue) and sPC-1L3/PC-2F604P (n = 12, orange). (F) Relative open probabilities for sPC-1L31NT/PC-2F604P (n = 5, purple) and sPC-1/PC-2F604P (n = 6, red, dataset from Figure 1E) obtained during tail pulses at −80 mV. Statistical significance is indicated by the background. ***p<0.001 (dark gray), **p<0.01 (gray), *p<0.05 (light gray). Statistical analysis was computed using student t-test unpaired one-pair. (G) I-V relationships for sPC-1/PC-2F604P (n = 6, red), sPC-1L31CTL/PC-2F604P (n = 5, green), and sPC-1L3/PC-2F604P (n = 12, black).
Figure 2—figure supplement 1
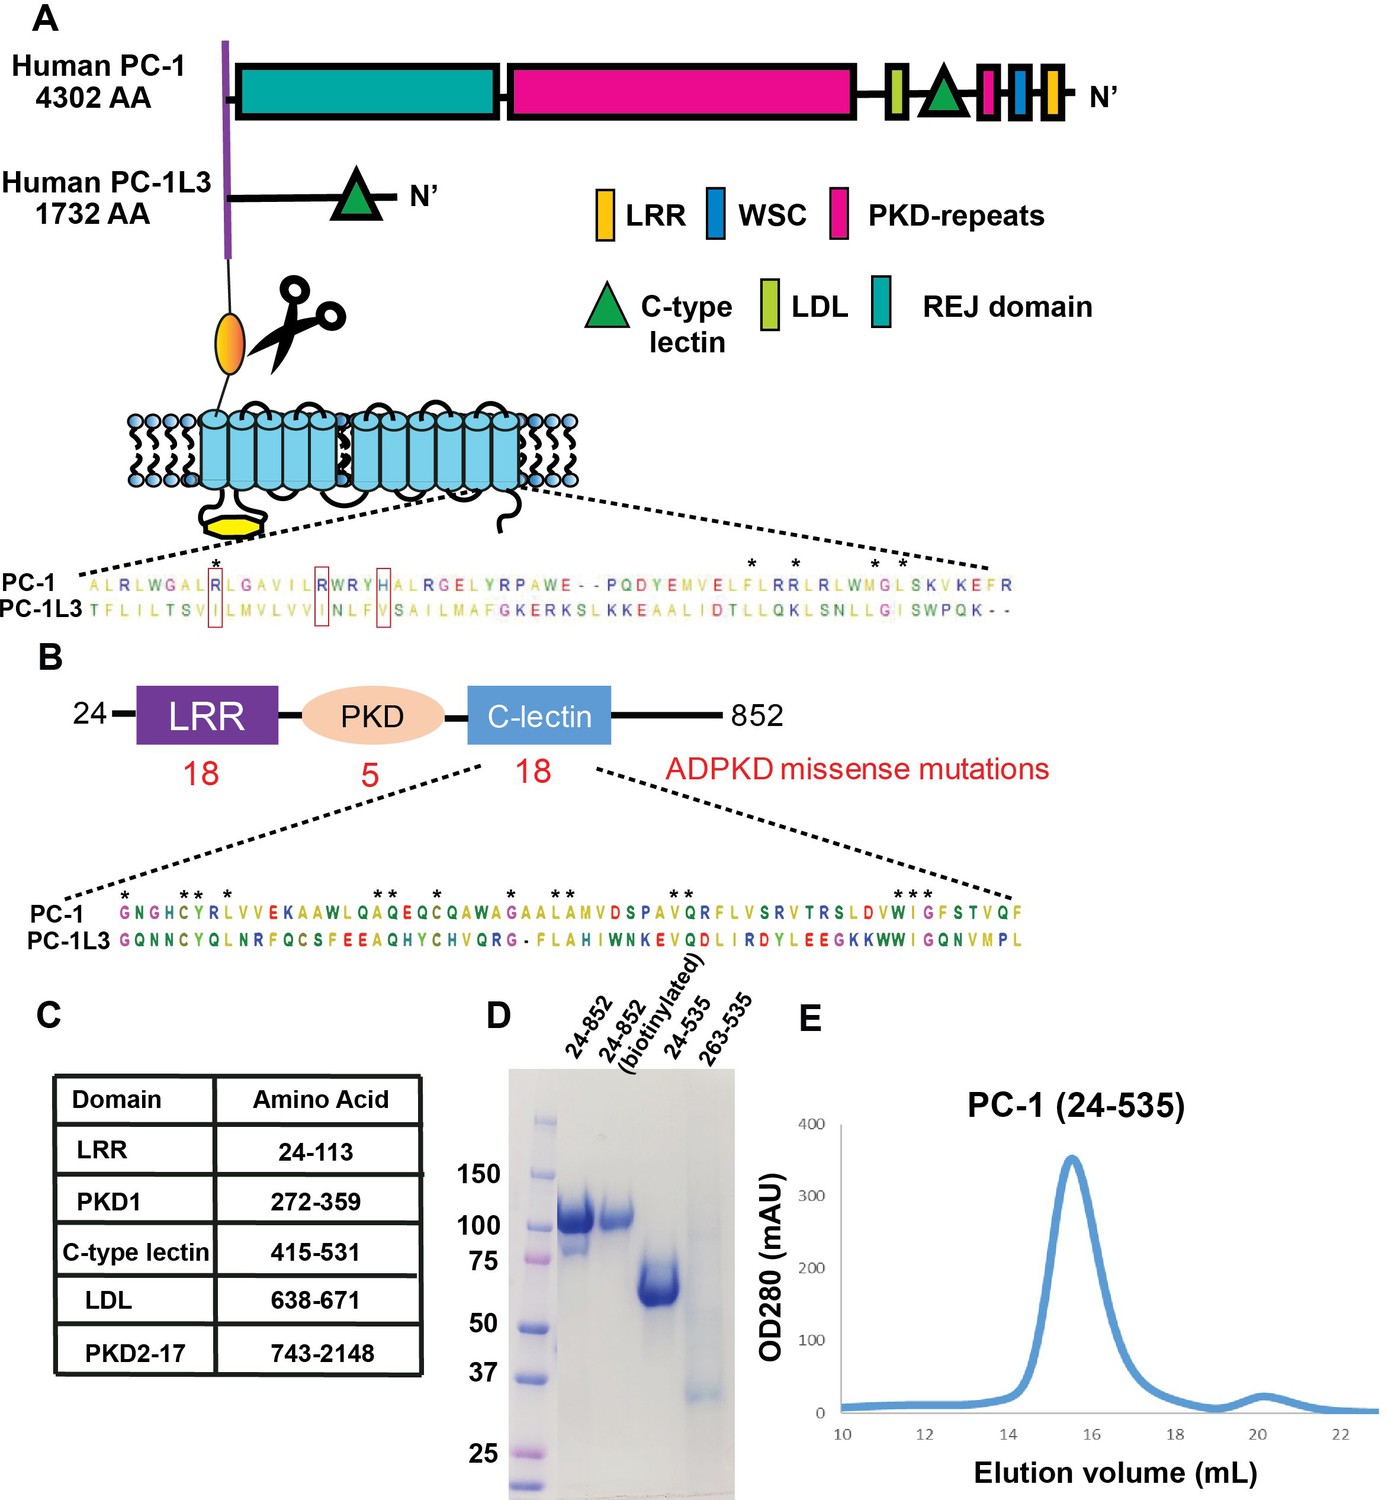
Protein purification of PC-1 N-terminal fragments.
(A) Schematic domain illustration of PC-1 and PC-1L3 comparing the organization of adhesion domains within the ectodomain and 11 TM domains. Sequence alignment for the pore region from human PC-1 and PC-1L3. Uniprot IDs are 98161 for hPC-1 and Q7Z443 for hPC-1L3, respectively. The sequences were aligned using Mega6 (Tamura et al., 2013). * indicates 100% conserved amino acid residues. (B) Adhesion domains present in NTF25-853 and the number and location of ADPKD-causing mutations reported to date (18 mutations have been reported for the CTL domain [Dong et al., 2019]). Sequence alignment of the CTL domain from human PC-1 and PC-1L3. (C) Table of relevant PC-1 N-terminal domains. (D) Coomassie blue staining for purified PC-1 N-terminal fragments separated by SDS-PAGE in a 20% polyacrylamide gel and visualized. Alexa-647 labeling may cause the PC-1 263–535 fragment to have weaker and slightly smeared staining. (E) Size exclusion chromatography analysis of unlabeled 24–535 fragments.
Figure 3
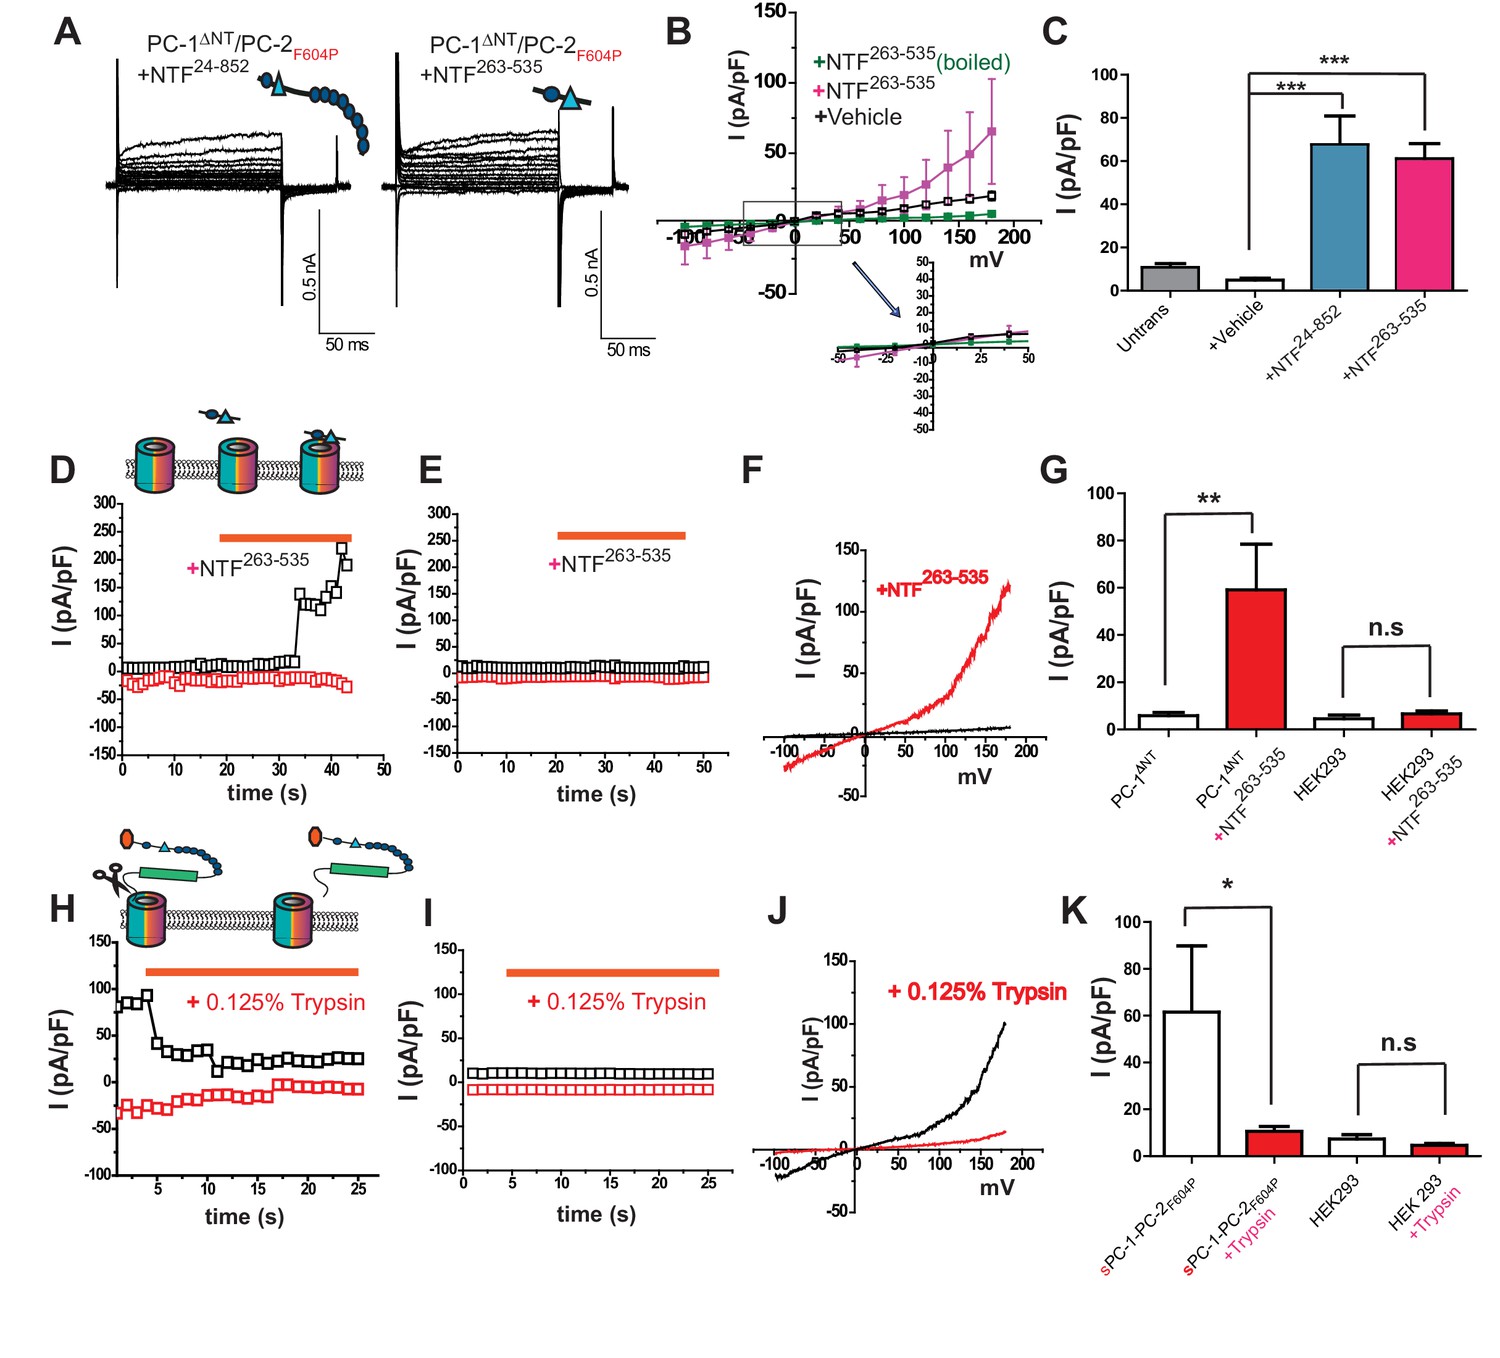
Polycystin activation depends on the C-Type lectin domain.
(A) Representative whole cell currents of PC-1ΔNT/PC-2F604P after application of PC-1 NTF24-852 (left) or NTF263-535 (right). (B) I-V relationships of PC-1ΔNT/PC-2F604P with addition of NTF263-535 (n = 6, pink), PC-1ΔNT/PC-2F604P with addition of heat-inactivated fragment (n = 8, black), and PC1ΔNT/PC-2F604P alone (n = 8, green). (C) Current densities of untransfected cells (gray) and PC-1ΔNT/PC-2F604P after addition of control medium (n = 7, white), NTF24-852 (n = 5, blue) and NTF263-535, (n = 6, pink). ***, p<0.001. (D) Time course of PC-1ΔNT/PC-2F604P transfected cells in response to NTF263-535. Currents are recorded at +180 mV (black) and −100 mV (red). Orange bar indicates addition of NTF. (E) Time course of untransfected cells in response to NTF263-535. Conditions are identical to D. (F) I-V relationships obtained by voltage ramp pulse for PC-1ΔNT/PC-2F604P before (black) or after (red) NTF263-535 application. (G) Current densities at +100 mV potential from PC-1ΔNT/PC-2F604P (n = 7) or untransfected cells (n = 9) before (blank) or after application (red) of NTF263-535. (H) Time course of sPC-1/PC-2F604P transfected cells in response to application of 0.125% trypsin. Currents are recorded at +180 mV (black) and −100 mV (red). Orange bar indicates addition of trypsin. (J) I-V relationships for sPC-1/PC-2F604P before (black) and after (red) 0.125% trypsin application. (K) Current densities at +100 mV potential from for sPC-1/PC-2F604P (n = 6) and untransfected cells (n = 5) before (blank) or after (red) 0.125% trypsin application.
Figure 4
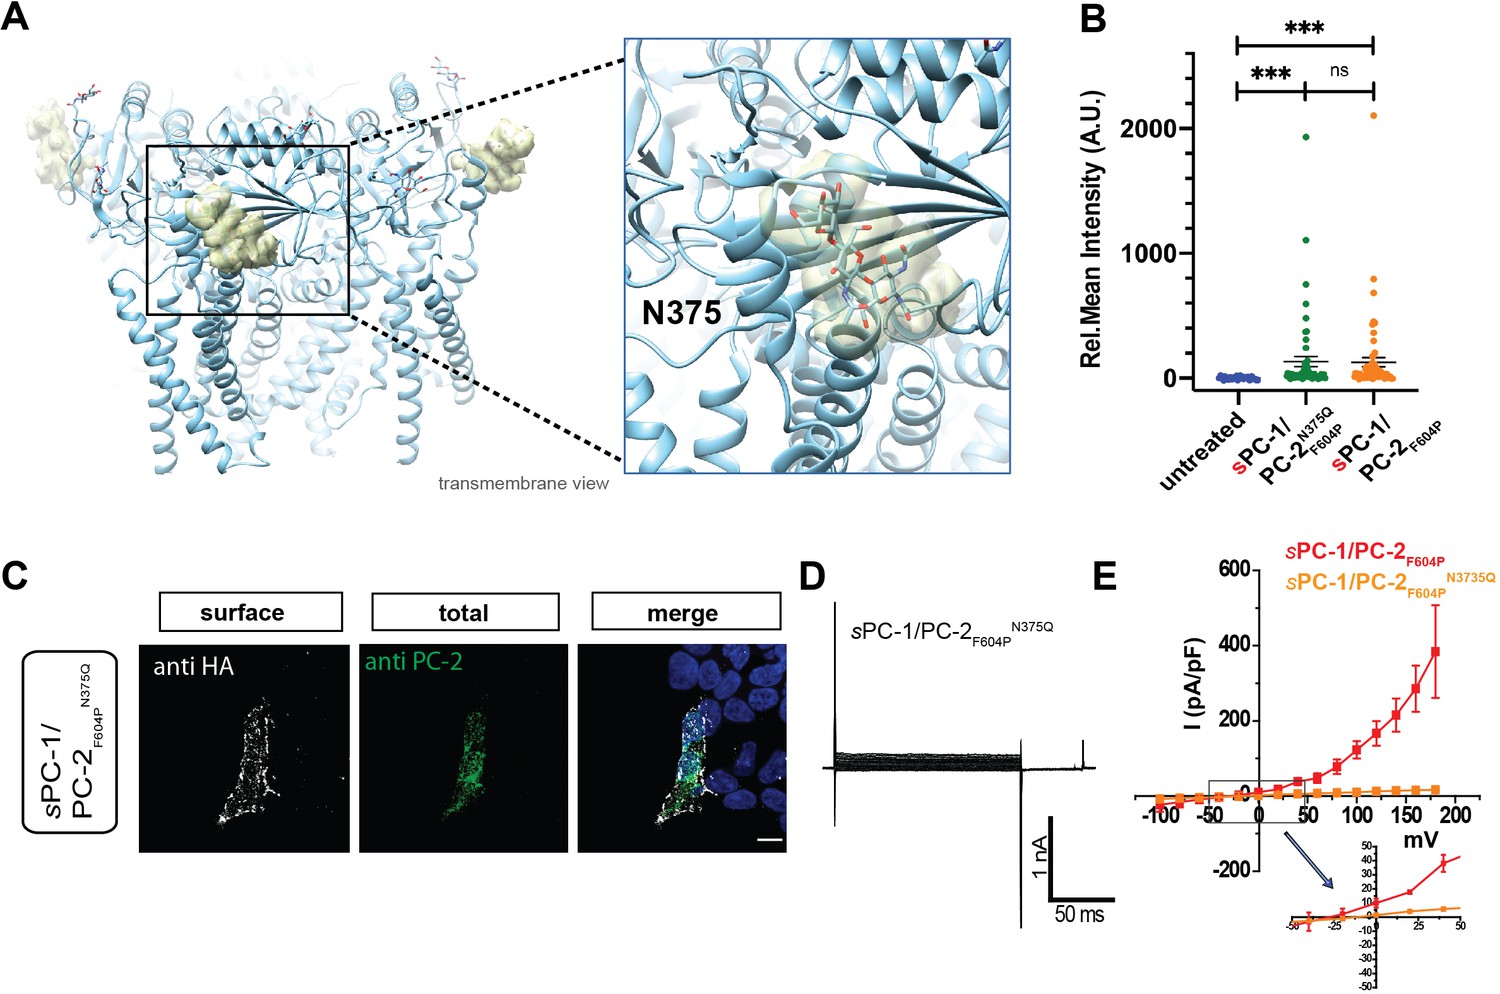
C-type lectin binds to the TOP domain of PC-2.
(A) Location of carbohydrates (yellow mesh) bound to N375 in the TOP domain of the PC-2 channel (protein data bank ID: 5T4D). Right, expanded view of carbohydrate binding to N375 site. (B) Quantification of anti-HA surface staining of sPC-1/PC-2F604P and sPC-1/PC-2F604PN375Q compared to untransfected cells. ***p<0.001. (C) Immunostaining of HEK293 cells transfected with sPC-1/PC-2F604PN375Q. Scale bar: 10 μm. (D) Representative whole cell current traces of sPC-1/PC-2F604PN375Q. (E) I-V relationships for sPC-1/PC-2F604PN375Q (n = 11, orange) and sPC-1/PC-2F604P (n = 6, red, dataset from Figure 1E).
Figure 5 with 2 supplements
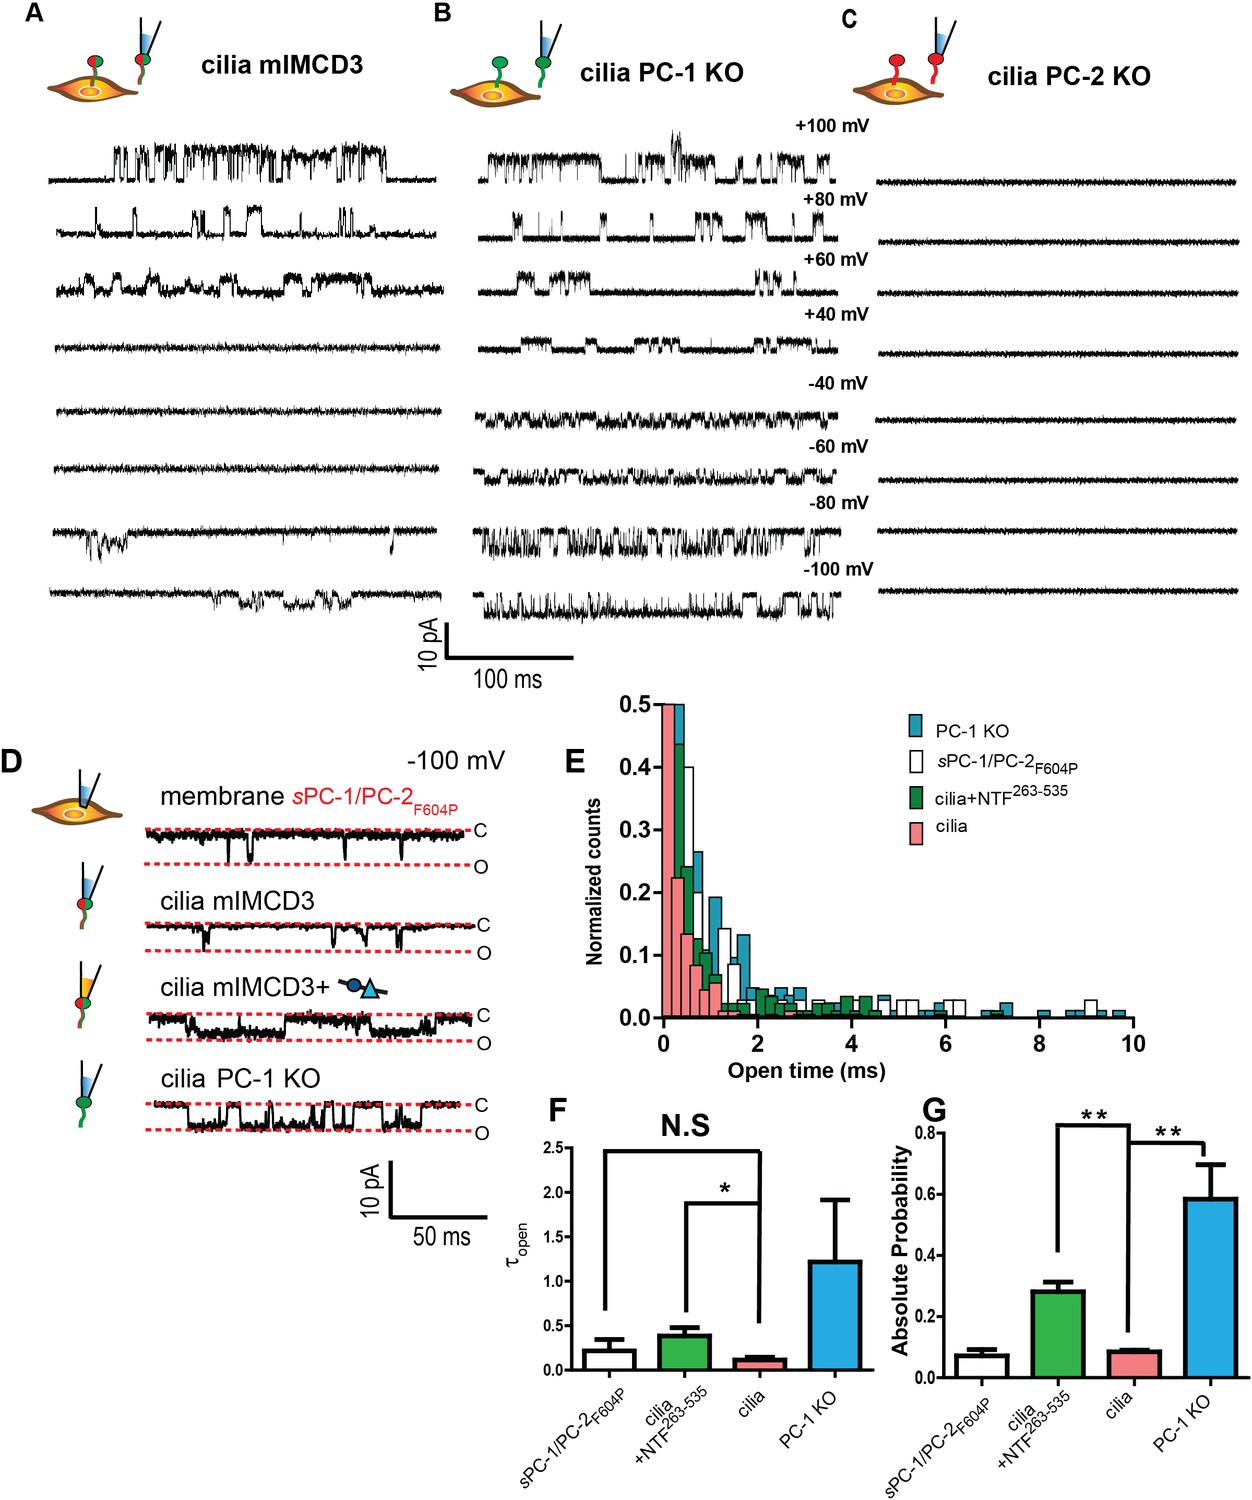
An N-terminal PC-1 fragment activates ciliary polycystin complexes.
(A, B, C) Excised ciliary inside-out patch clamp recordings of channels from mIMCD-3 cells (left), PC-1 knockout mIMCD-3 cells (middle), and PC-2 knockout mIMCD-3 cells (right). (D) Single channel patch clamp recordings at −100 mV in cell attached configuration for sPC-1/PC-2F604P (top) and excised inside-out ciliary patches for mIMCD-3, mIMCD-3 with addition of NTF263-535 in pipette solution, and PC-1 knockout cells (rows 2–4, respectively). (E) Open time histogram of channel openings at −100 mV holding potential. (F) Time constants of open time distributions in E obtained using one decay equation, *p<0.05 (n = 7/38 for mIMCD-3 cilia, n = 4/13 for PC-1 KO, n = 4/23 for mIMCD-3 cilia + NTF263-535, and n = 6 for sPC-1/PC-2F604P). (G) Absolute open probabilities for recordings shown in A, B, and C, **p<0.01.
Figure 5—figure supplement 1

Ciliary recordings in mIMCD-3.
(A) Western blot with rat monoclonal E8 antibody directed against C-terminal fragment (CTF) of PC-1 confirms a lack of PC-1 protein in both Pkd1 CRISPR knockout IMCD3 lines (A1 and C2) when compared to a Wt control which shows both full length (FL) and CTF bands. * denotes a nonspecific band. (B) Differential interference contrast (DIC) images of the mIMCD-3 ciliary-attached patch configuration. The glass pipette is sealed to the primary cilium expressing Arl13B-EGFP (green). (C) Single channel recordings at +100 mV holding potential for sPC-1/PC-2F604P (cell attached, top), and wt mIMCD-3, wt mIMCD-3 with addition of NTF263-535, and PC-1 knockout (ciliary recordings, rows 2–4, respectively). (D) Open time histogram of channel opening events at +100 mV holding potentials. (E) Time constant, and (F) absolute open probabilities for recordings shown in B (n = 4, for all conditions), *p<0.05, **p<0.01, ***p<0.001. (G, H) Amplitudes obtained from excised ciliary patch clamp recording of PC-1 knockout cells (n = 3, red) and mIMCD-3 cilia (n = 5, blue). Conductance (ϒ) was fitted to a linear equation.
Figure 5—figure supplement 2
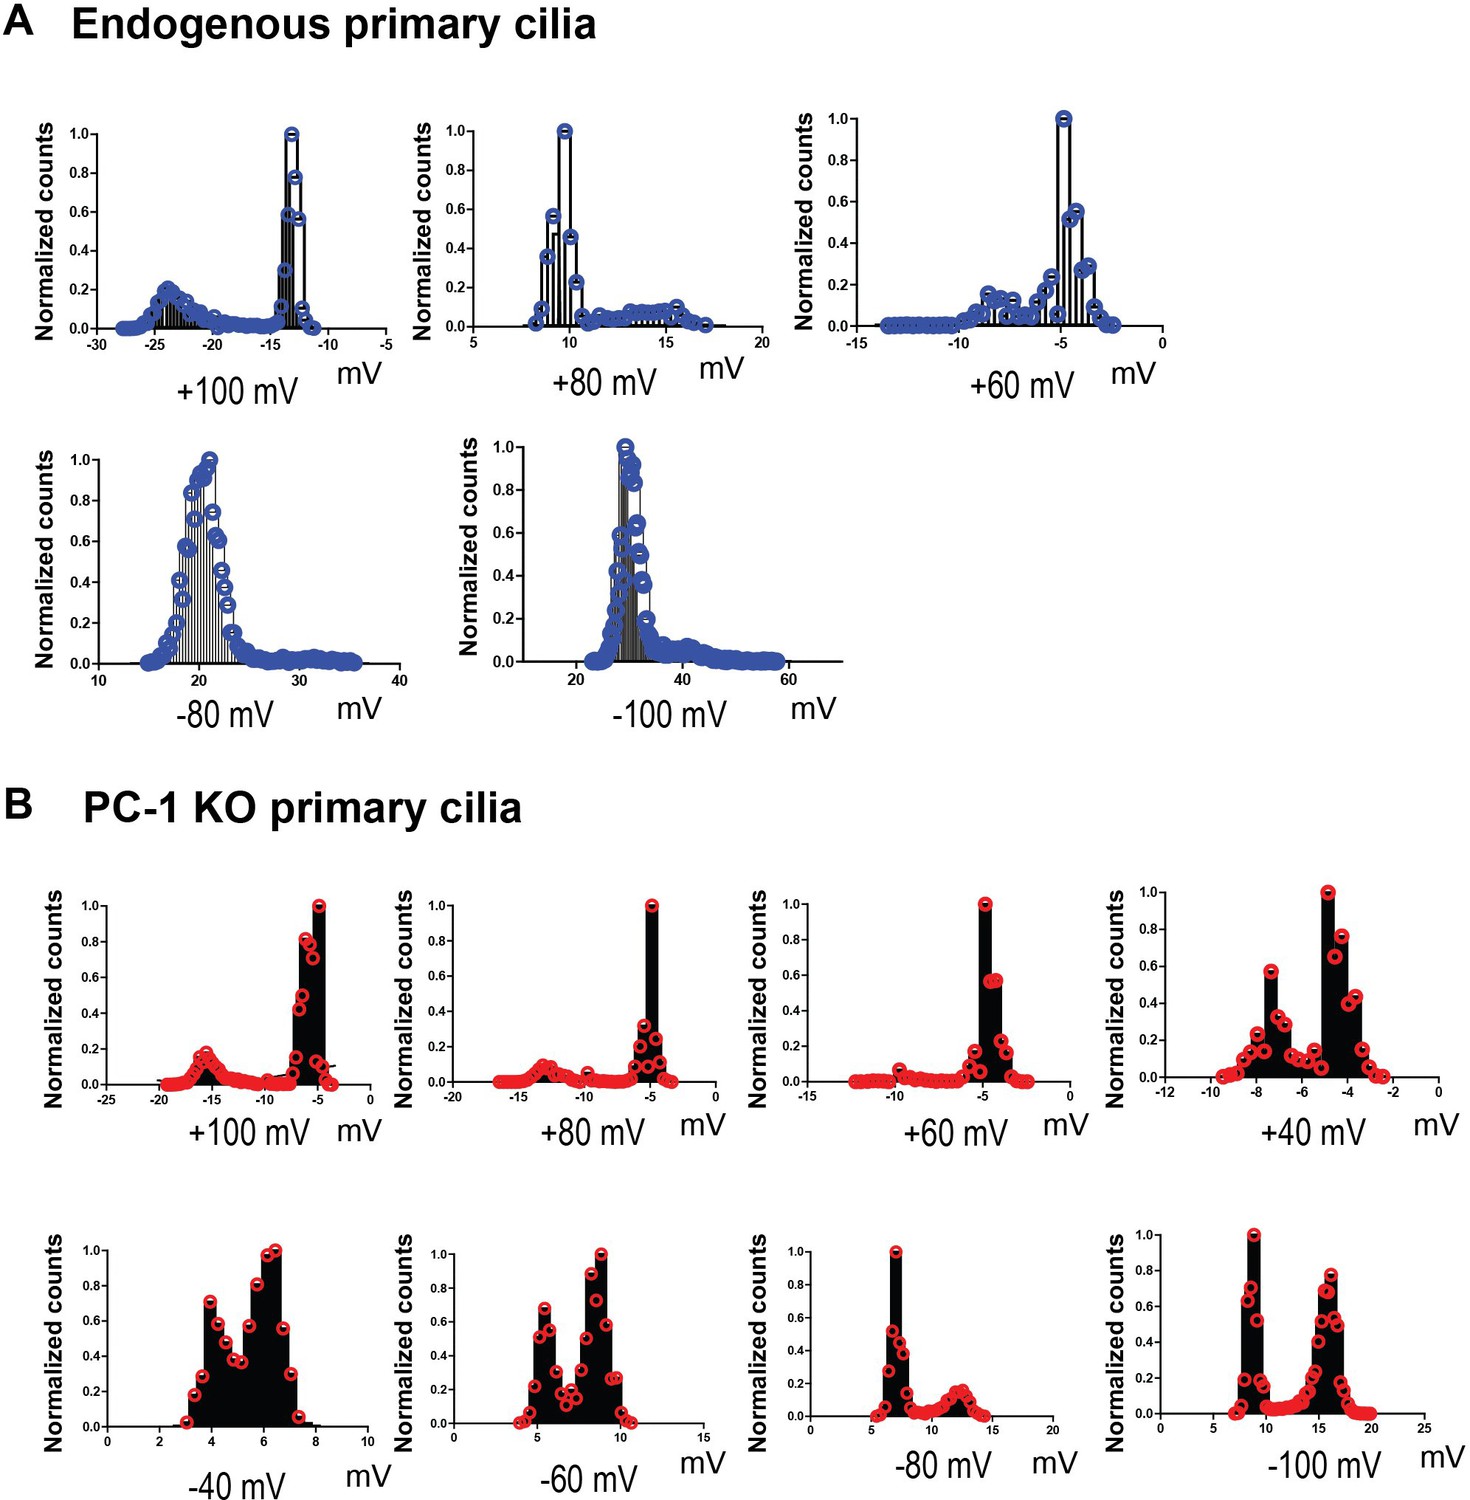
Amplitude histograms for excised ciliary patch clamp recordings of mIMCD-3 cilia and PC-1 knockout cilia.
(A, B) All-points amplitude histogram of excised ciliary patch clamp recordings for mIMCD-3 cilia (blue) and PC-1 knockout cilia (red), respectively. Amplitudes for mIMCD-3 cilia were obtained at +100 mV, +80 mV, +60 mV depolarizing membrane potentials and −80 mV and −100 mV hyperpolarizing membrane potentials. Amplitudes for PC-1 knockout cilia were obtained at +100 mV, +80 mV, +60 mV, +40 mV depolarizing membrane potentials and −40 mV, −60 mV, −80 mV, −100 mV hyperpolarizing membrane potentials.
Figure 6
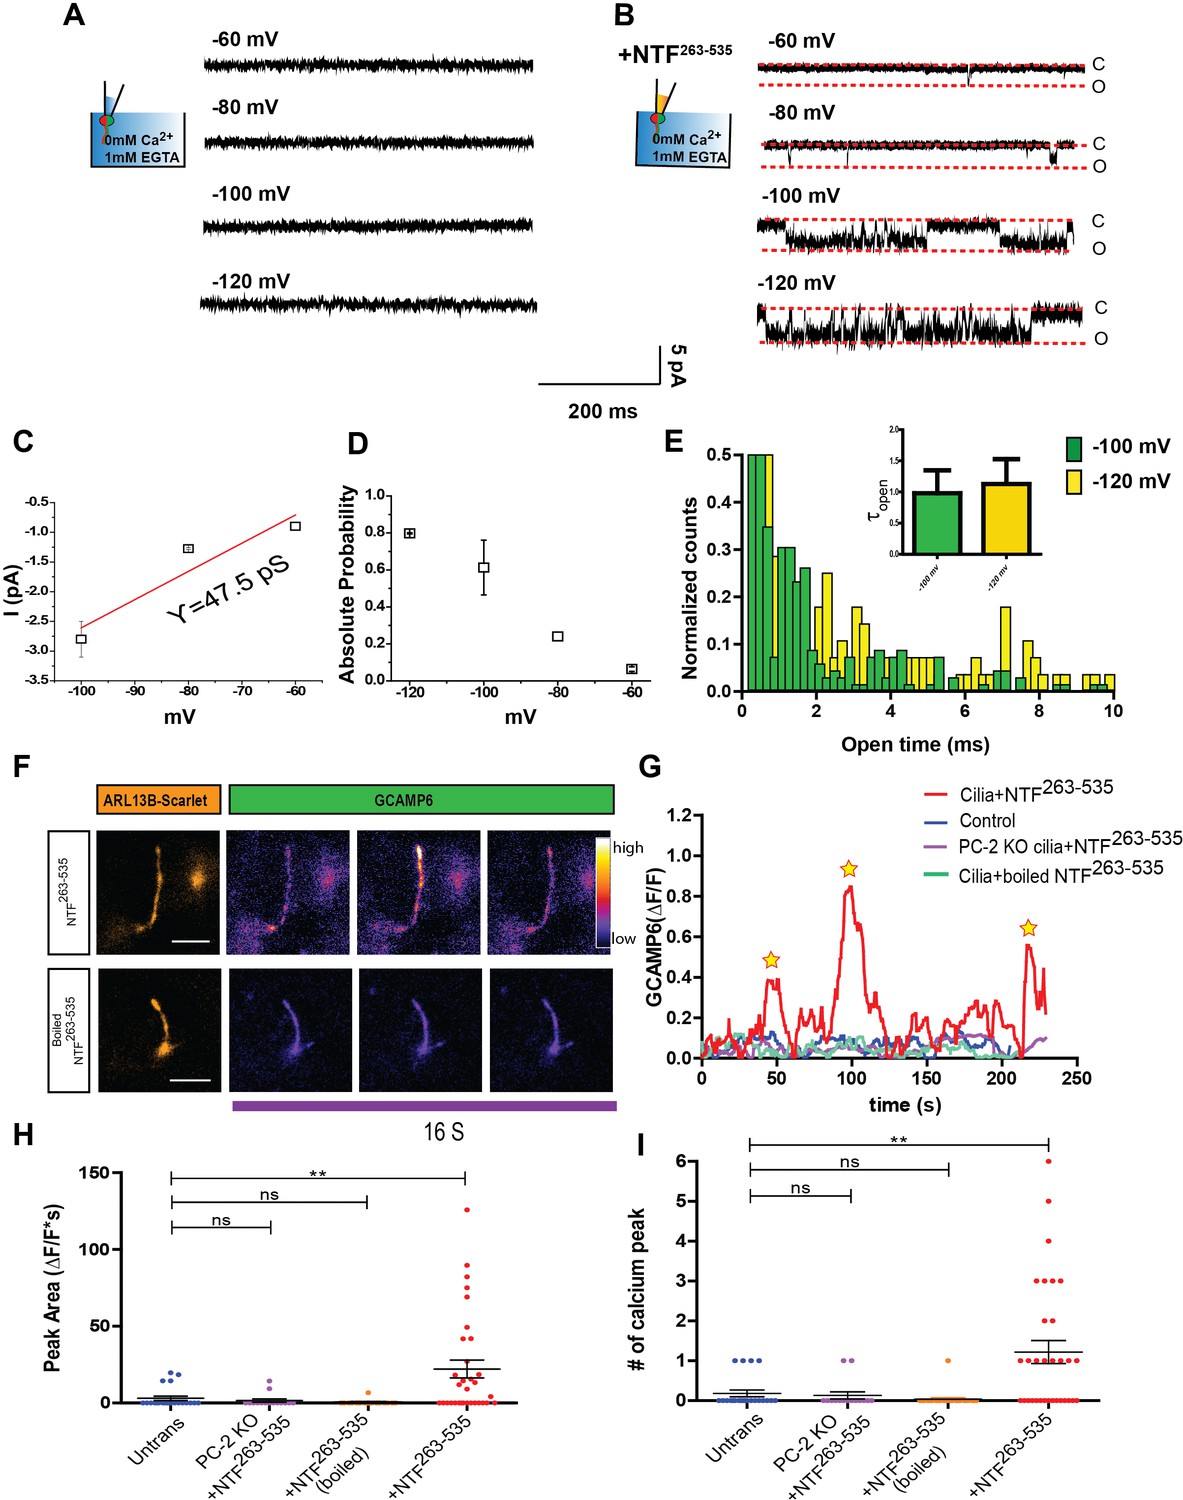
NTF263-535 activates Ca2+ influx into primary cilia.
(A) Excised inside-out patch single channel recordings of mIMCD-3 cilia with 2 mM CaCl2 and 10 mM HEPES in pipette solution at membrane potentials between −60 mV and −120 mV. (B) Excised inside-out patch single channel recordings from mIMCD-3 cilia with 0.7 µg/mL of NTF263-535 in the pipette. Membrane potentials held between −60 mV and −120 mV. (C) I-V relationship obtained from ciliary excised patch clamp recordings from mIMCD-3 cilia with NTF263-535 (n = 3/16). Red line indicates linear fitting. (D) Absolute open probabilities obtained at membrane potentials between −60 mV and −120 mV (n = 3/16). (E) Open time histogram of channel opening events after NTF263-535 application at −100 and 120 mV. Small bar graph indicates time constants obtained from one decay fits of the histogram (n = 3/16). (F) Representative TIRF images after addition of 50 nM NTF263-535 to mIMCD-3 cells stably expressing Arl13B-scarlet-GCaMP6. GCaMP images are pseudo-colored based on pixel intensity. Scale bar: 5 µm. (G) Representative traces of changes in fluorescence (ΔF/F) during TIRFM imaging. Image acquisition every 250 ms. (H) Quantification of maximum peak area of fluorescence (ΔF/F*s) for control, PC-2 knock out cells + NTF263-535, wt mIMCD3 cilia + boiled NTF263-535, and wt mIMCD3 cilia + NTF263-535. (I) Quantification of number of calcium spikes observed in TIRFM imaging for control, PC-2 knock out cells + NTF263-535, wt mIMCD3 cilia + boiled NTF263-535, and wt mIMCD3 cilia + NTF263-535. Quantification is from three independent experiments, **p<0.01.
Figure 7
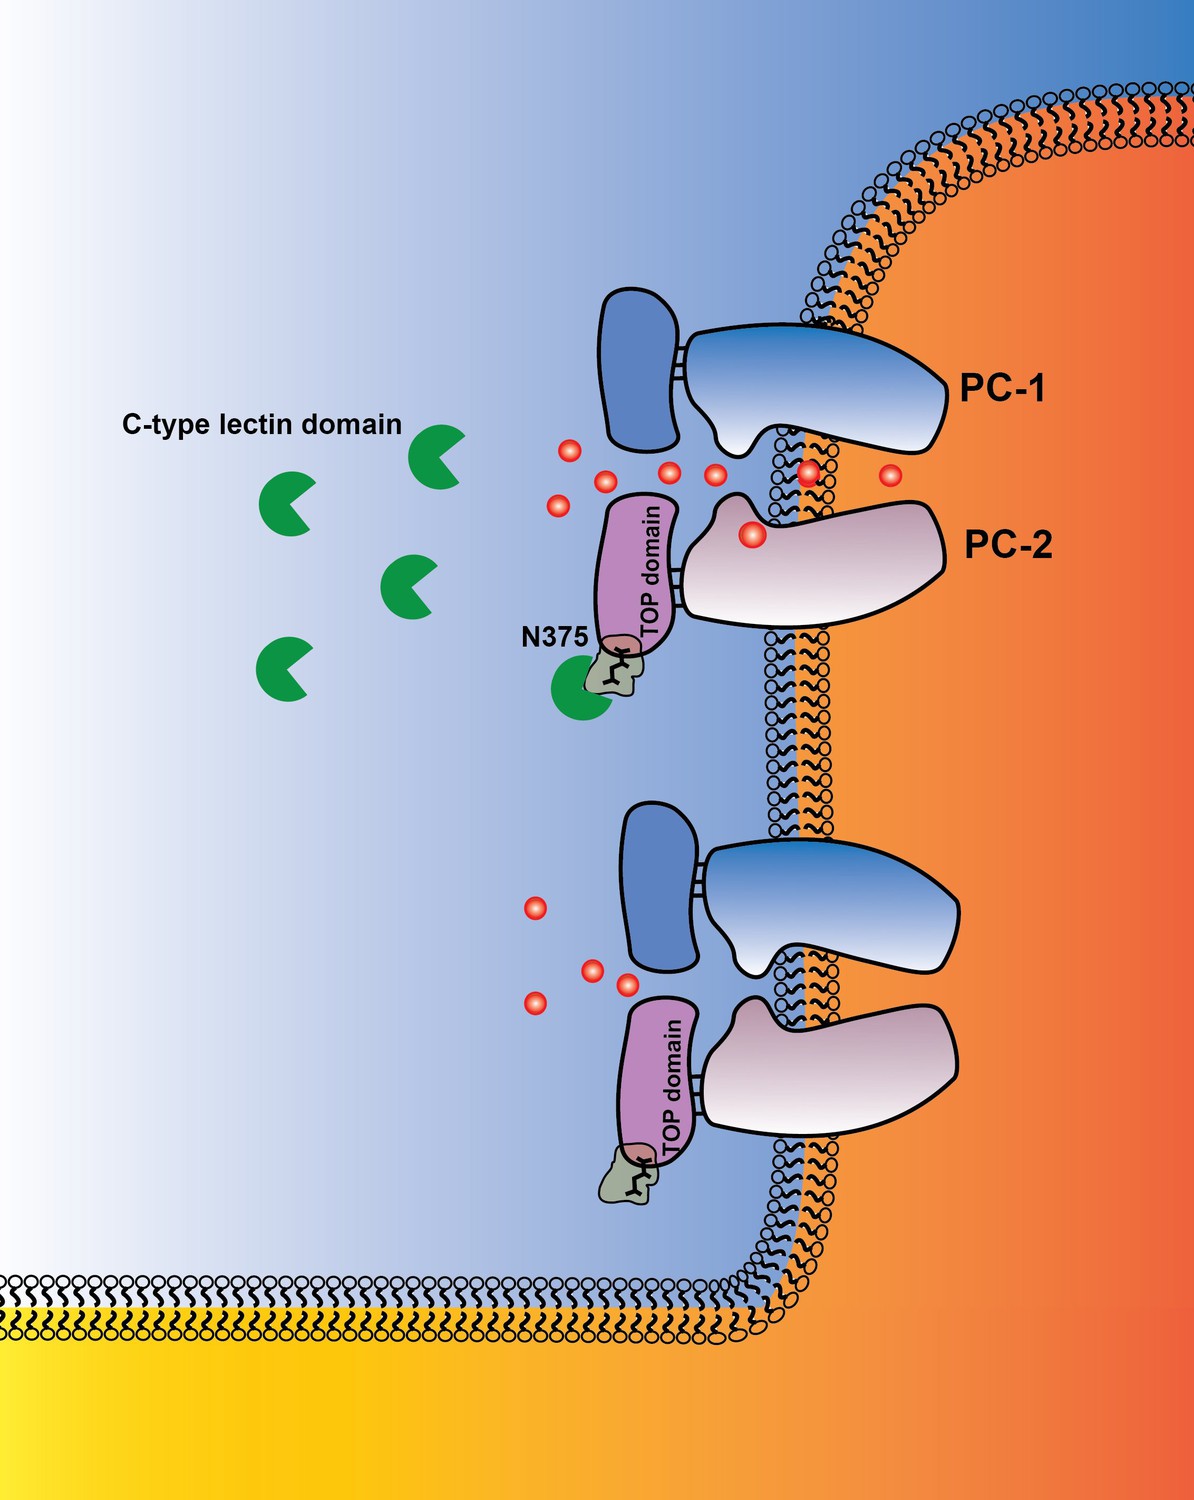
Graphical abstract PC-1 N-terminus with its C-type lectin domain interacts with carbohydrates in the PC-2 TOP domain and activates the channel complex in the cilium.
PC-1 N-terminus may either activate the channel as a soluble ligand or remain tethered to the channel complex and undergo intermolecular binding to TOP domains on neighboring channels. Channel activity can be different in the presence of N-terminal fragments of PC-1.
Tables
Table 1
Constructs used in this study.
| Construct name | Protein tag | Mutation |
|---|---|---|
| sPC-1/PC-2F604P | κ-IgG signal peptide and HA tag at 5’ end of PC-1 | F604P in PC-2 |
| PC-1/PC-2F604P | HA tag at 5’ end of PC-1 | F604P in PC-2 |
| sPC-1/PC-2 | κ-IgG signal peptide and HA tag at 5’ end of PC-1 | wild type PC-2 |
| sPC-1/PC-2FLAG | κ-IgG signal peptide and HA tag at 5’ end of PC-1, FLAG insertion in PC-2 TOP domain (pos. 904):…PSNGT-DYKDDDK-SFIFY… | |
| PC-2F604P | - | F604P in PC-2 |
| sPC-1pore/PC-2F604P | κ-IgG signal peptide and HA tag at 5’ end of PC-1 | R4100G, R4107G, H4111G in PC-1 F604P in PC-2 |
| PC-1ΔNT/PC-2 | HA tag (P2Y12) | Substitution of PC-1 N-terminus adjacent to TM-1 (position 9184) with P2Y12 N-terminus. (HA_P2Y12_mypydvpdyaqavdnltsapgntslctrdykitq)-(vrfvfp…_PC-1) |
| PC-1ΔNT/PC-2F604P | HA tag (P2Y12) | Substitution of PC-1 N-terminus with P2Y12 N-terminus F604P in PC-2 |
| sPC-1L3/PC-2 | κ-IgG signal peptide and HA tag at 5’ end of mPC-1L3 | - |
| sPC-1L31NT/PC-2 | κ-IgG signal peptide and HA tag at 5’ end of PC-1 N-terminus | Substitution of mPC-1L3 N-terminus with hPC-1 N-terminus at GPS cleavage (hPC-1…CLTR-HLTFFSS…mPC-1L3) |
| sPC-11L3NT/PC-2 | κ-IgG signal peptide and HA tag at 5’ end of PC-1L3 N-terminus | Substitution of hPC-1 N-terminus with 1-1052aa of mPC-1L3 at GPS cleavage (mPC-1L3…QCLCD-HLTAFGA…hPC-1) |
| sPC-11L3CTL/PC-2F604P | κ-IgG signal peptide and HA tag at 5’ end of PC-1 | Replacement of PC-1 C-type lectin domain (407-547aa) with C-type lectin domain of PC-1L3 (30-150aa) |
| sPC-1L31CTL/PC-2F604P | κ-IgG signal peptide and HA tag at 5’ end of PC-1L3 | Replacement of PC-1L3 C-type lectin domain (30-138aa) with C-type lectin domain of PC-1 (415-535aa) |
| sPC-1/PC-2F604PN375Q | κ-IgG signal peptide and HA tag at 5’ end of PC-1 N-terminus | F604P in PC-2, N375Q in PC-2 |
Key resources table
| Reagent type (species) or resource | Designation | Source or reference | Identifiers | Additional information |
|---|---|---|---|---|
| Gene (Homo sapiens) | hPKD1 | GenBank | L33243 | |
| Gene (Homo sapiens) | hPKD2 | GenBank | NM_000297 | |
| Gene (Mus musculus) | mPKD1-L3 | GenBank | NM_001286454 | |
| Gene (Homo sapiens) | hArl13b | GenBank | NM_182896 | |
| Cell line (Mus musculus) | mIMCD3 | ATCC | CRL-2123 | |
| Cell line (Mus musculus) | mIMCD3 PC-1 ko | This paper | Derived from CRL-2123 | CRISPR-CAS9 ablated PC-1 expression |
| Cell line (Mus musculus) | mIMCD3 PC-2 ko | From Dr Steven Kleene, University of Cincinnati PMC5283891 | Derived from CRL-2123 | CRISPR-CAS9 ablated PC-2 expression |
| Cell line (Homo-sapiens) | HEK293 | ATCC | CRL-1573 | |
| Antibody (mouse) | Anti-FLAG (M2) | Sigma Aldrich | F3165-1MG | (1:100) |
| Antibody (rat) | Anti-HA | Roche | 11867423001 | (1:100) |
| Antibody (rabbit) | Anti-Acetylated tubulin (K40) | Cell signalling | 5335 s | (1:10.000) |
| Antibody (mouse) | Anti-PC-2 (YCE2) | Santa Cruz | YCE2 SC-47734 | (1:1000) |
| Antibody (rat) | Anti-PC-1 (E8) | Baltimore PKD center | E8 | (1 µg/mL western blot) |
| Recombinant DNA reagent | pTRE3G-Bi | Takara Bio | Cat # 631337 | |
| Recombinant protein | PC-1 NTF 24–852 | This paper | Amplified from L33243 | |
| Recombinant protein | PC-1 NTF 263–535 | This paper | Amplified from L33243 | |
| Software, algorithm | PRISM10 | Graphpad | ||
| Software, algorithm | pCLAMP | Molecular Devices | ||
| Software, algorithm | Clampfit10.6 | Molecular Devices | ||
| Other | Höchst 33342 | Thermo Fisher | 1:10.000 |
Additional files
Download links
A two-part list of links to download the article, or parts of the article, in various formats.
Downloads (link to download the article as PDF)
Open citations (links to open the citations from this article in various online reference manager services)
Cite this article (links to download the citations from this article in formats compatible with various reference manager tools)
The heteromeric PC-1/PC-2 polycystin complex is activated by the PC-1 N-terminus
eLife 9:e60684.
https://doi.org/10.7554/eLife.60684


