Novel LOTUS-domain proteins are organizational hubs that recruit C. elegans Vasa to germ granules
- Center for Genomics and Systems Biology, Department of Biology, New York University, United States
- NYU Abu Dhabi Center for Genomics and Systems Biology, New York University Abu Dhabi, United Arab Emirates
- Goodman Cancer Research Centre and Department of Biochemistry, McGill University, Canada
- Max Delbrück Center for Molecular Medicine, Germany
Figures
Figure 1 with 1 supplement
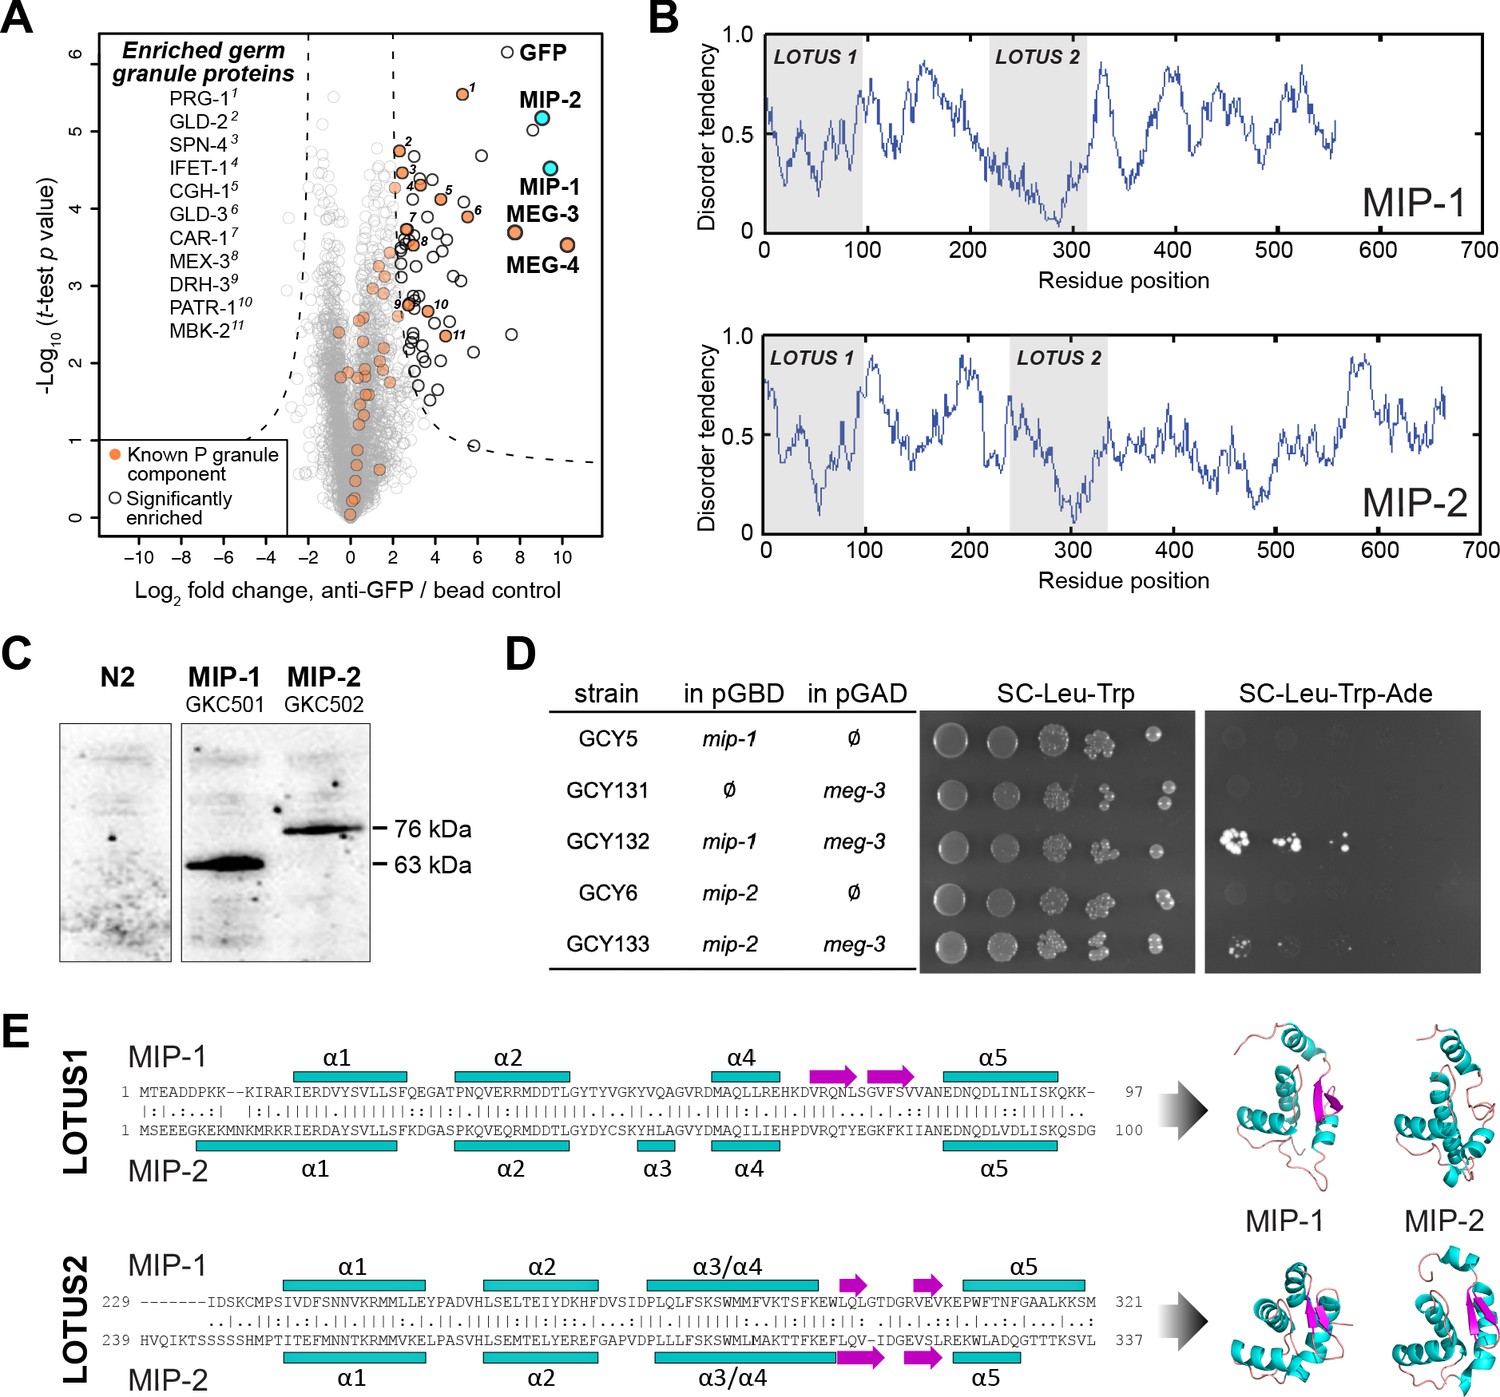
MIP-1 and MIP-2 are novel LOTUS-domain proteins.
(A) Proteins that co-immunoprecipitate with MEG-3 from embryo extracts include known components of P granules (orange), as well as two previously uncharacterized paralogs (aqua): C38D4.4 (MIP-1) and F58G11.3 (MIP-2). Proteins significantly enriched over controls in three biological replicates are outlined in black and include numerous known P granule components (listed at left, in order of descending significance). (B) MIP-1 and MIP-2 contain two LOTUS domains and intrinsically disordered regions (IDRs). (C) MIP-1 and MIP-2 are detected as a single isoform in extracts of mixed-stage animals. Western hybridization using an anti-FLAG antibody detects one polypeptide for 3xFLAG fusion proteins in genome-edited strains GKC501 (MIP-1::3xFLAG) and GKC502 (MIP-2::3xFLAG). N2 control is from the same gel. (D) Both MIP-1 and MIP-2 interact directly with MEG-3 in yeast two-hybrid assays. (E) (Left) Sequence alignments of LOTUS domains in MIP-1 and MIP-2. LOTUS domains are predicted to contain an alpha-5 helix that has been found in extended LOTUS domains (eLOTUS). (Right) Predicted three-dimensional structures of LOTUS1 (top) and LOTUS2 (bottom) domains in MIP-1 and MIP-2.
Figure 1—figure supplement 1
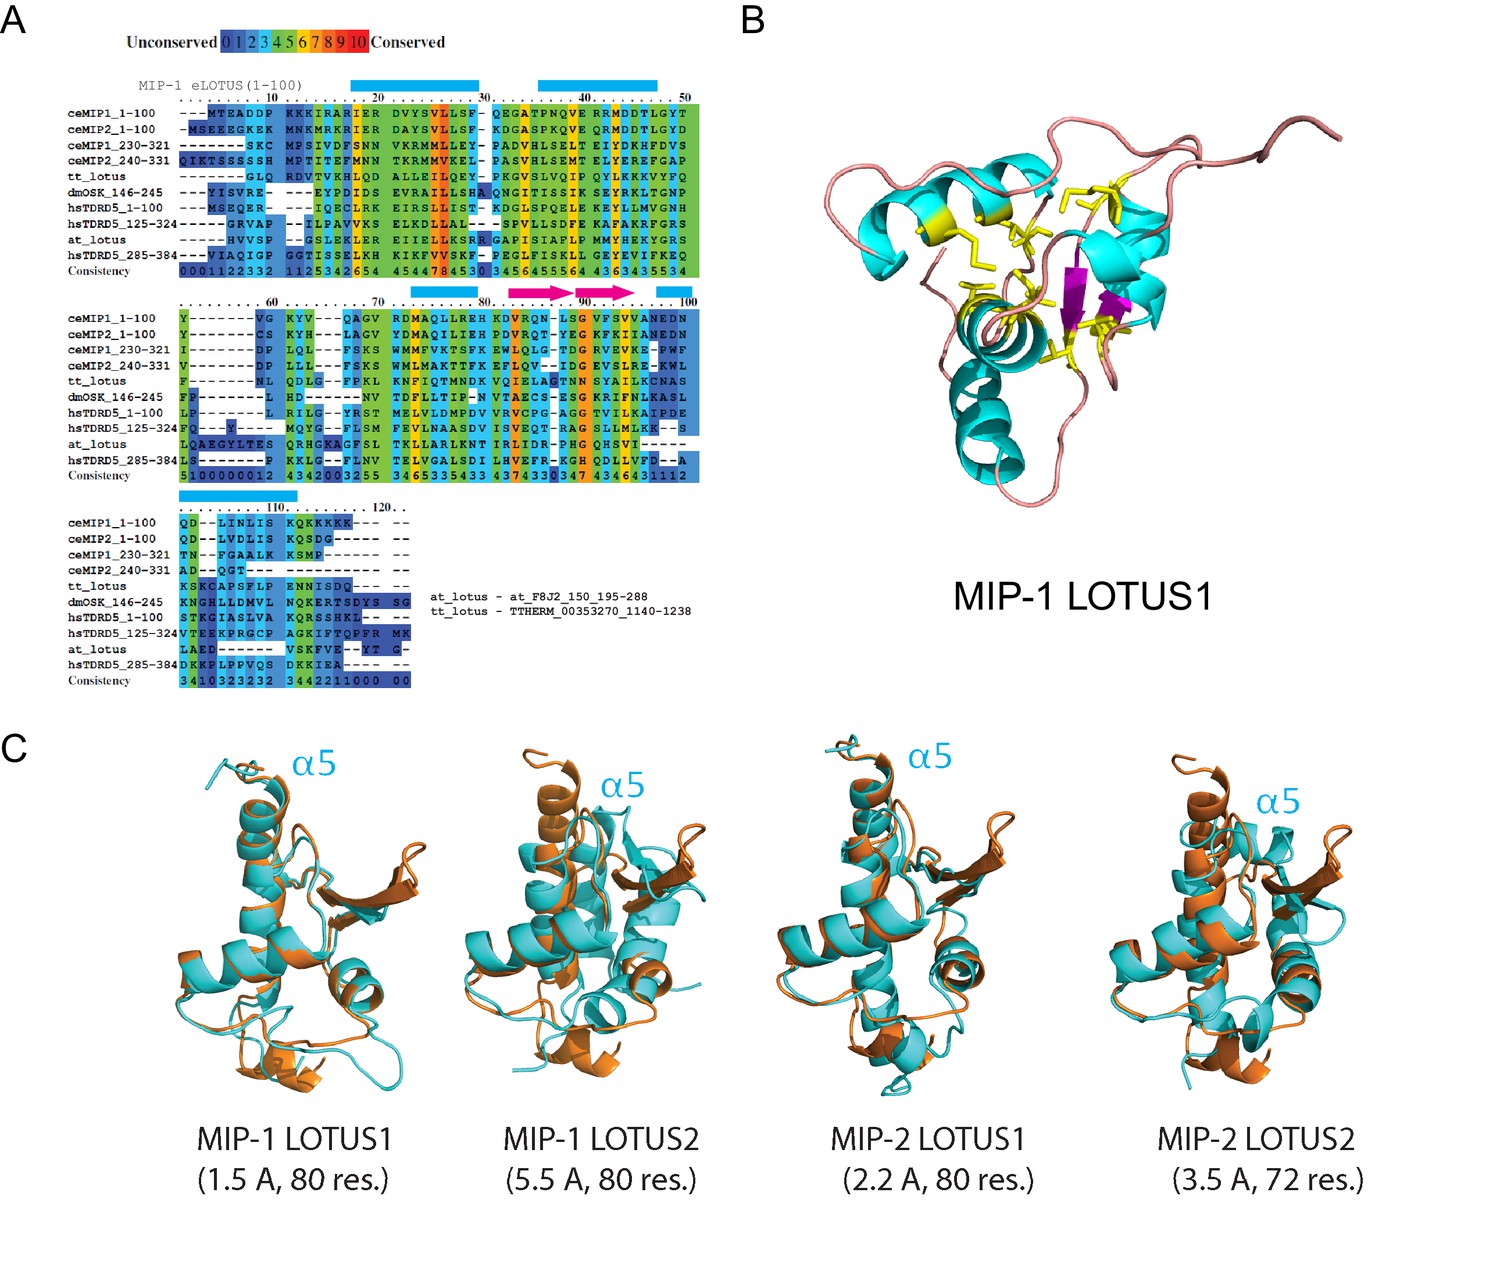
Sequence alignments and 3D structural models for MIP LOTUS domains.
(A) Multiple sequence alignment showing conserved positions of predicted LOTUS domains in MIPs together with known LOTUS domains from other species: T. thermophilus B-box zinc finger protein with HTH OST-type domains (tt_lotus, residues 1137–1236); D. melanogaster Oskar (dmOSK, residues146-205); H. sapiens TDRD5 (hsTDRD5, residues 1–100, 125–224, and 285–384); and A. thaliana Zinc finger (CCCH-type) family protein with a HTH OST-type domain (at_lotus, residues 193–292). (B) Homology model of the MIP-1 LOTUS1 three-dimensional structure. The most conserved residues (yellow, conservation score >5) are clustered in a conserved hydrophobic core. (C) Structural overlaps of predicted MIP LOTUS domains (cyan) and the solved Drosophila Oskar eLOTUS domain (orange). RSMD values in Angstroms (Å); see Supplementary file 1b (Table S2) for details.
Figure 2 with 2 supplements
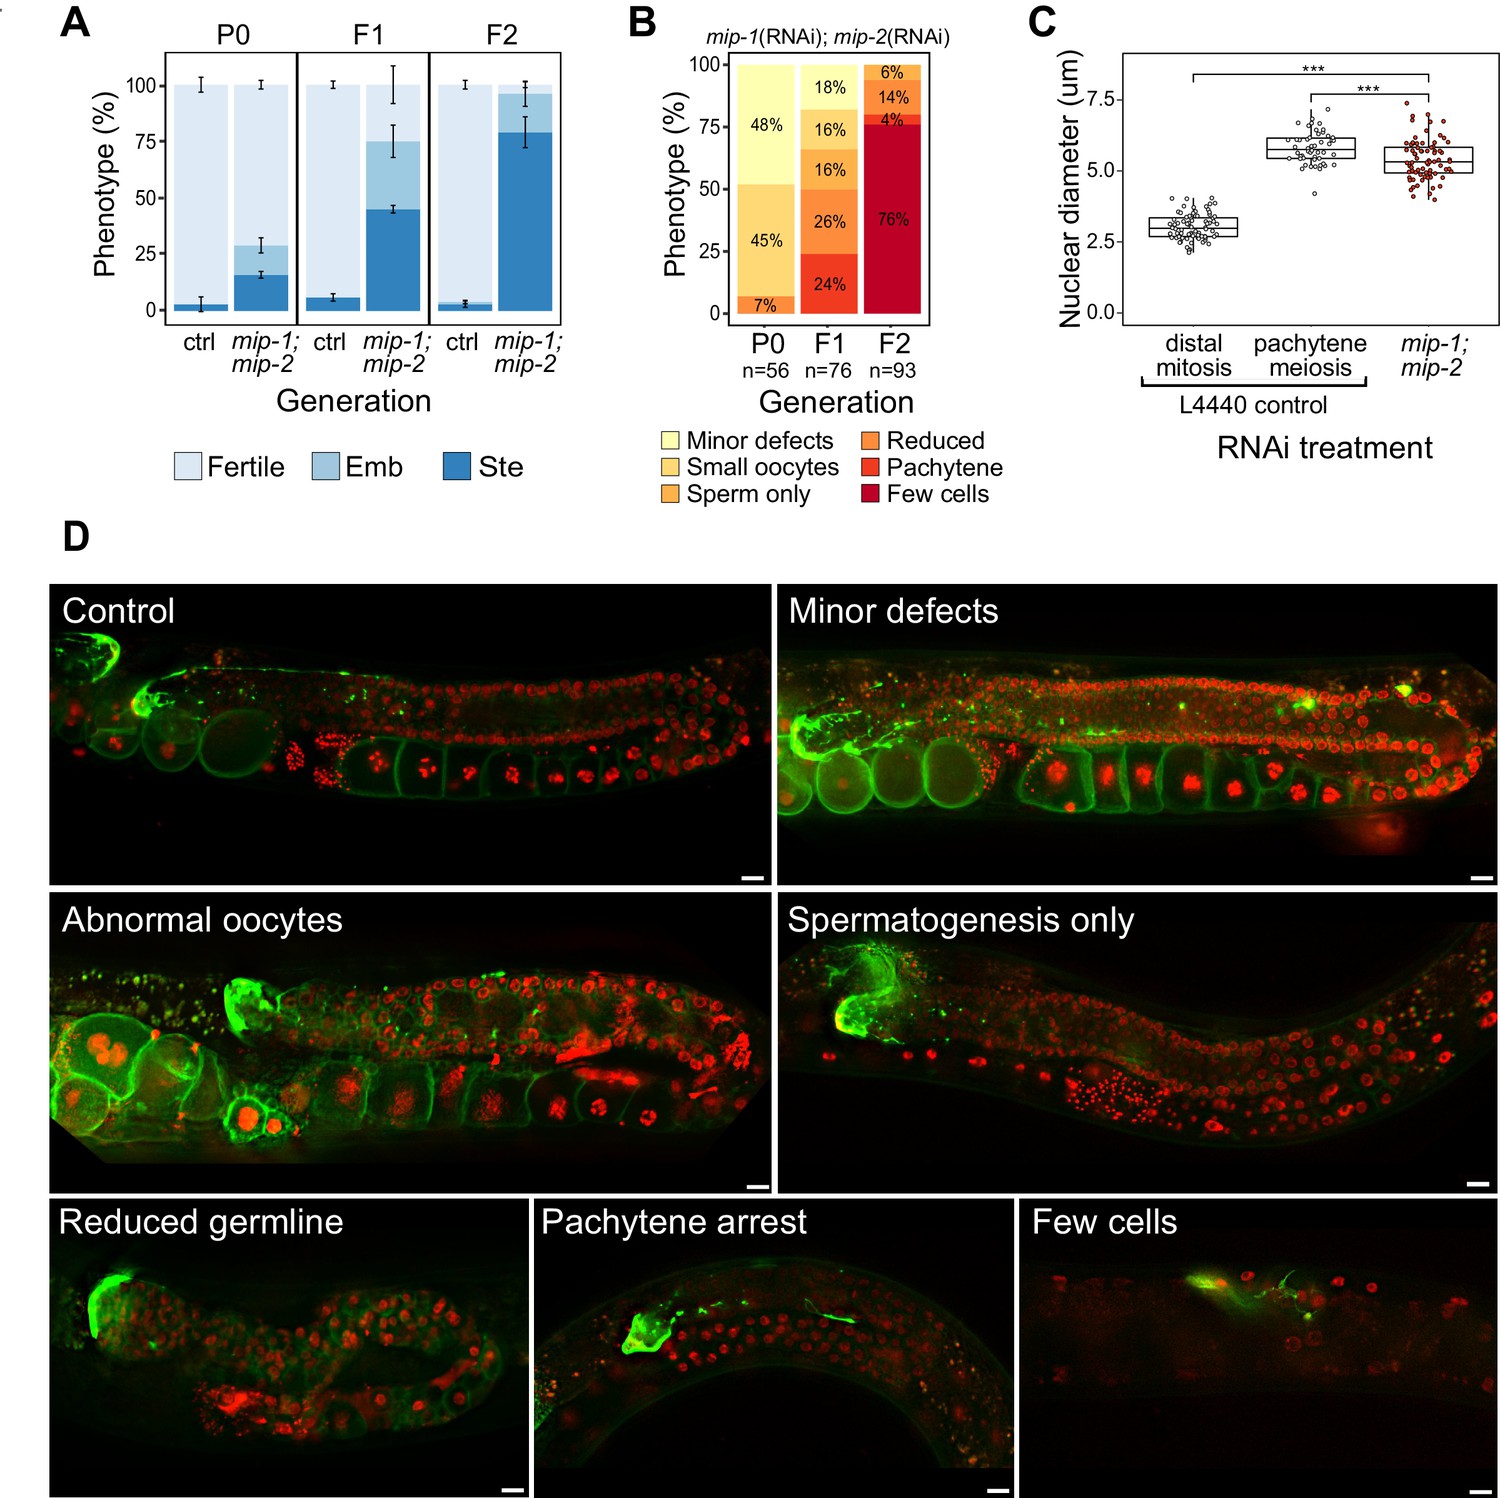
Phenotypes caused by reduction of MIP-1 and MIP-2 in the adult germ line.
Quantification and examples of increasing phenotypic severity across P0, F1, and F2 generations upon continuous mip-1(RNAi);mip-2(RNAi) versus L4440(RNAi) controls. (A) Proportion of treated animals at each generation showing embryonic lethality (Emb) and sterility (Ste). Error bars denote SEM for a total of n=~150 independent observations per treatment. (B) Proportion of germline phenotypic classes over three generations. A and B show combined data from strains OD95 and GKC509. (C) Diameter of remaining germline nuclei (μm) in severely reduced germ lines (‘few cells’ class) compared with nuclei from controls in strain GKC509. All WT nuclei measured in the distal germ line were within two cell diameters of the DTC. Asterisks denote significance according to Student’s t-test (***, p<0.001). (D) Fluorescent micrographs showing examples of main phenotypic classes in strain GKC509. Scale bars: 10 µm. Strain OD95 carries markers for histone H2B (mCherry::HIS-58) and plasma membrane (GFP::PH(PLCΔ1)); strain GKC509 also carries a marker for the distal tip cell (DTC) (LAG-2::GFP).
-
Figure 2—source data 1
Phenotypes produced by simultaneous depletion of MIP-1 and MIP-2 by RNAi.
- https://cdn.elifesciences.org/articles/60833/elife-60833-fig2-data1-v2.xlsx
Figure 2—figure supplement 1
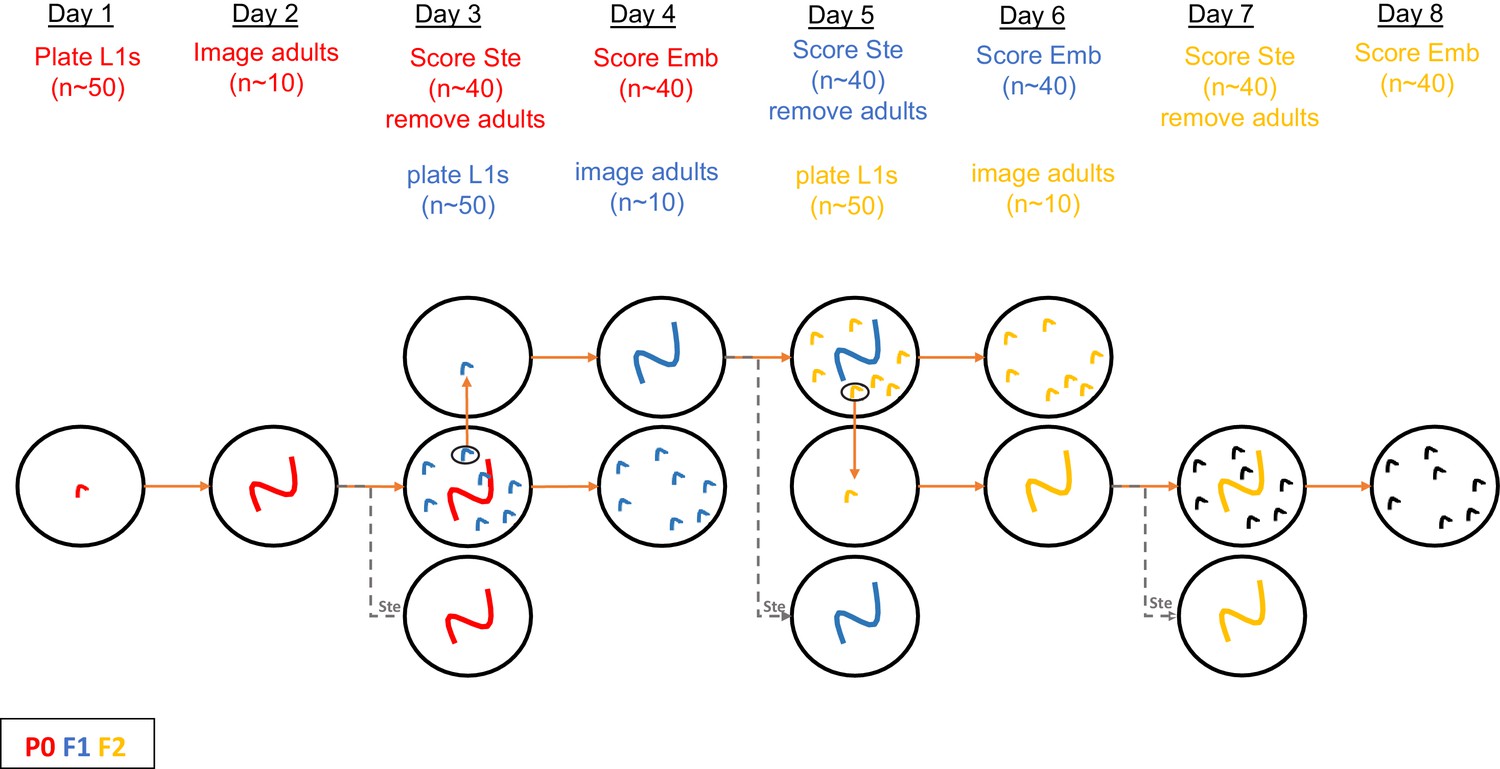
Schematic of protocol for RNAi treatment and scoring of phenotypes for data in Figure 2 (see also Materials and methods).
Figure 2—figure supplement 2
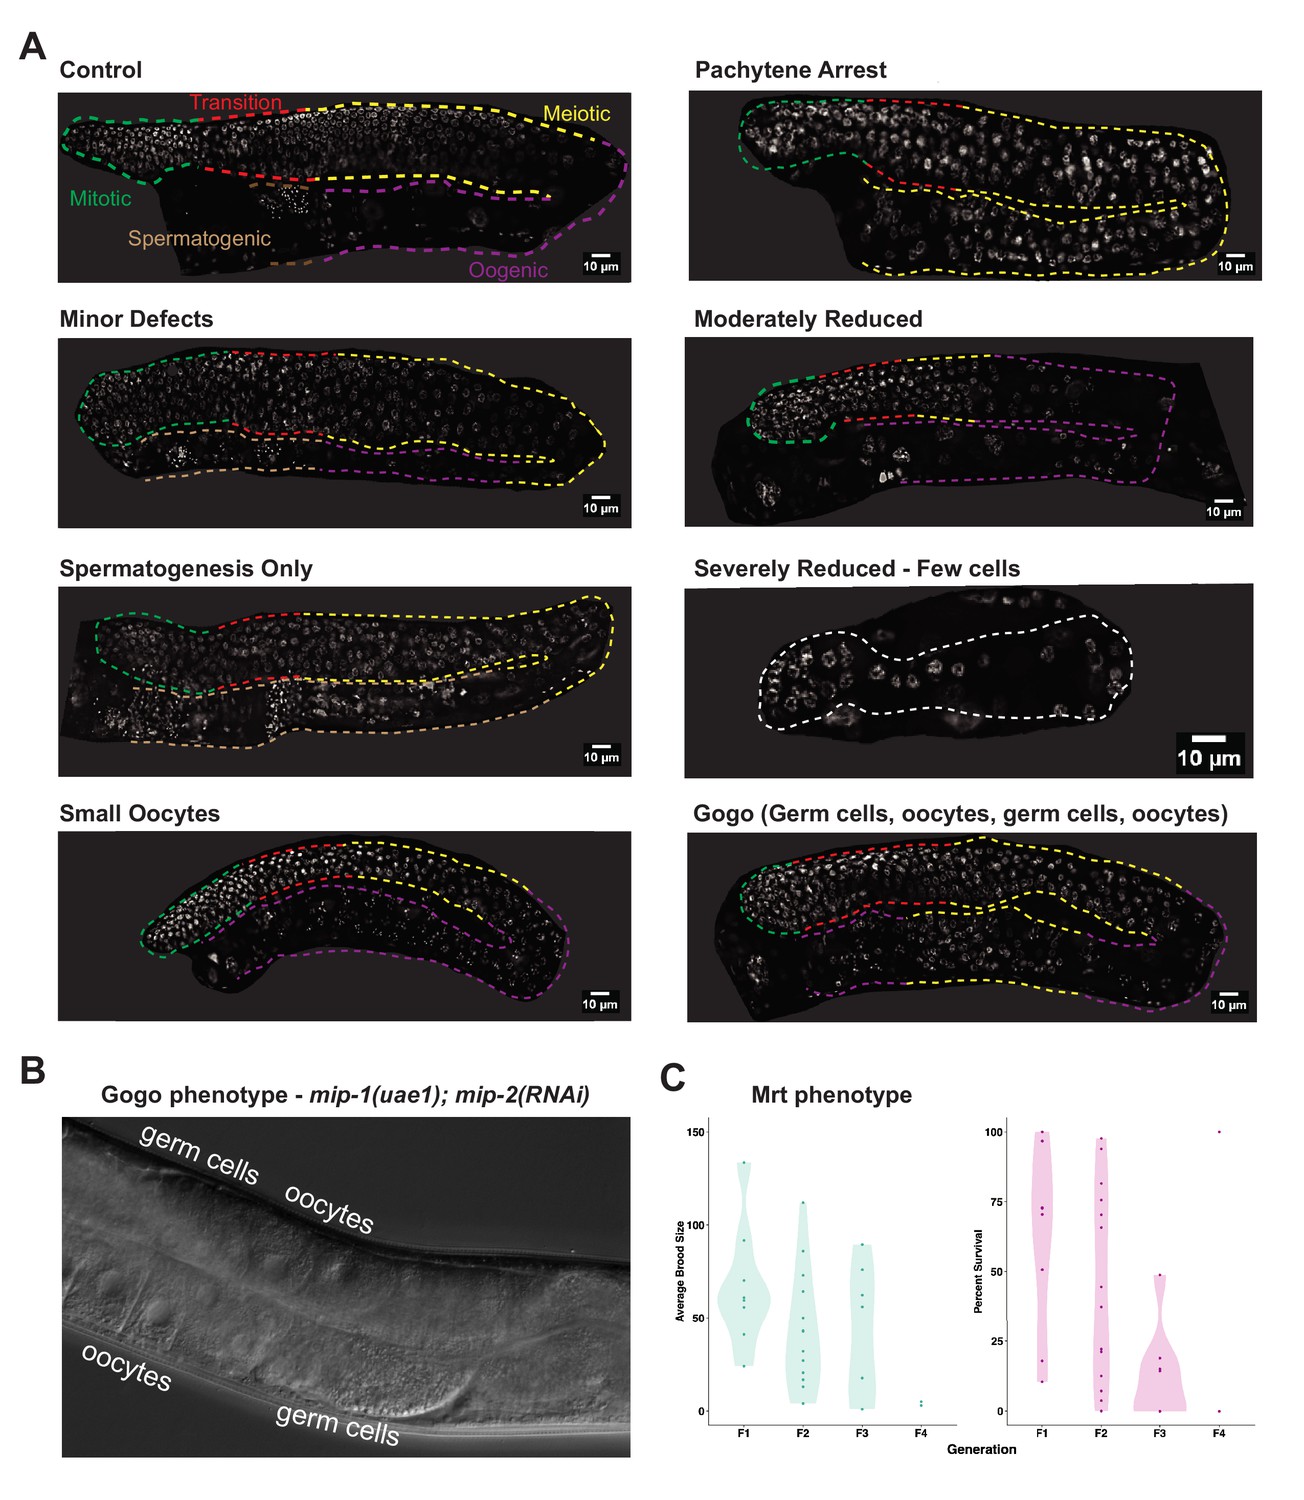
Double mip null mutants show a similar array of germline phenotypes as double mip RNAi.
(A) Phenotypes observed in the germ line of homozygous mip-1(uae1);mip-2(uae-2) double null mutants cultured at 25°C. Description of phenotypes in Supplementary file 1d (Table S4). (B) DIC and images of a Gogo germ line. (C) Quantification of average brood size and percentage survival of double mip null mutant progeny at 20°C across four successive generations. Lines show progressive loss of fertility, as evidenced by decreasing brood sizes per fertile mother, and higher embryonic lethality in the progeny, demonstrating a strong mortal germ line (Mrt) phenotype. Only two lines reach the F4 generation with at least one fertile parent, which produces an extremely low brood size. Data shown are the combined results of experiments that were started in the first generation and second generation after thawing (see Materials and methods for details).
-
Figure 2—figure supplement 2—source data 1
Double mip null mutants show a mortal germline phenotype.
- https://cdn.elifesciences.org/articles/60833/elife-60833-fig2-figsupp2-data1-v2.xlsx
Figure 3 with 1 supplement
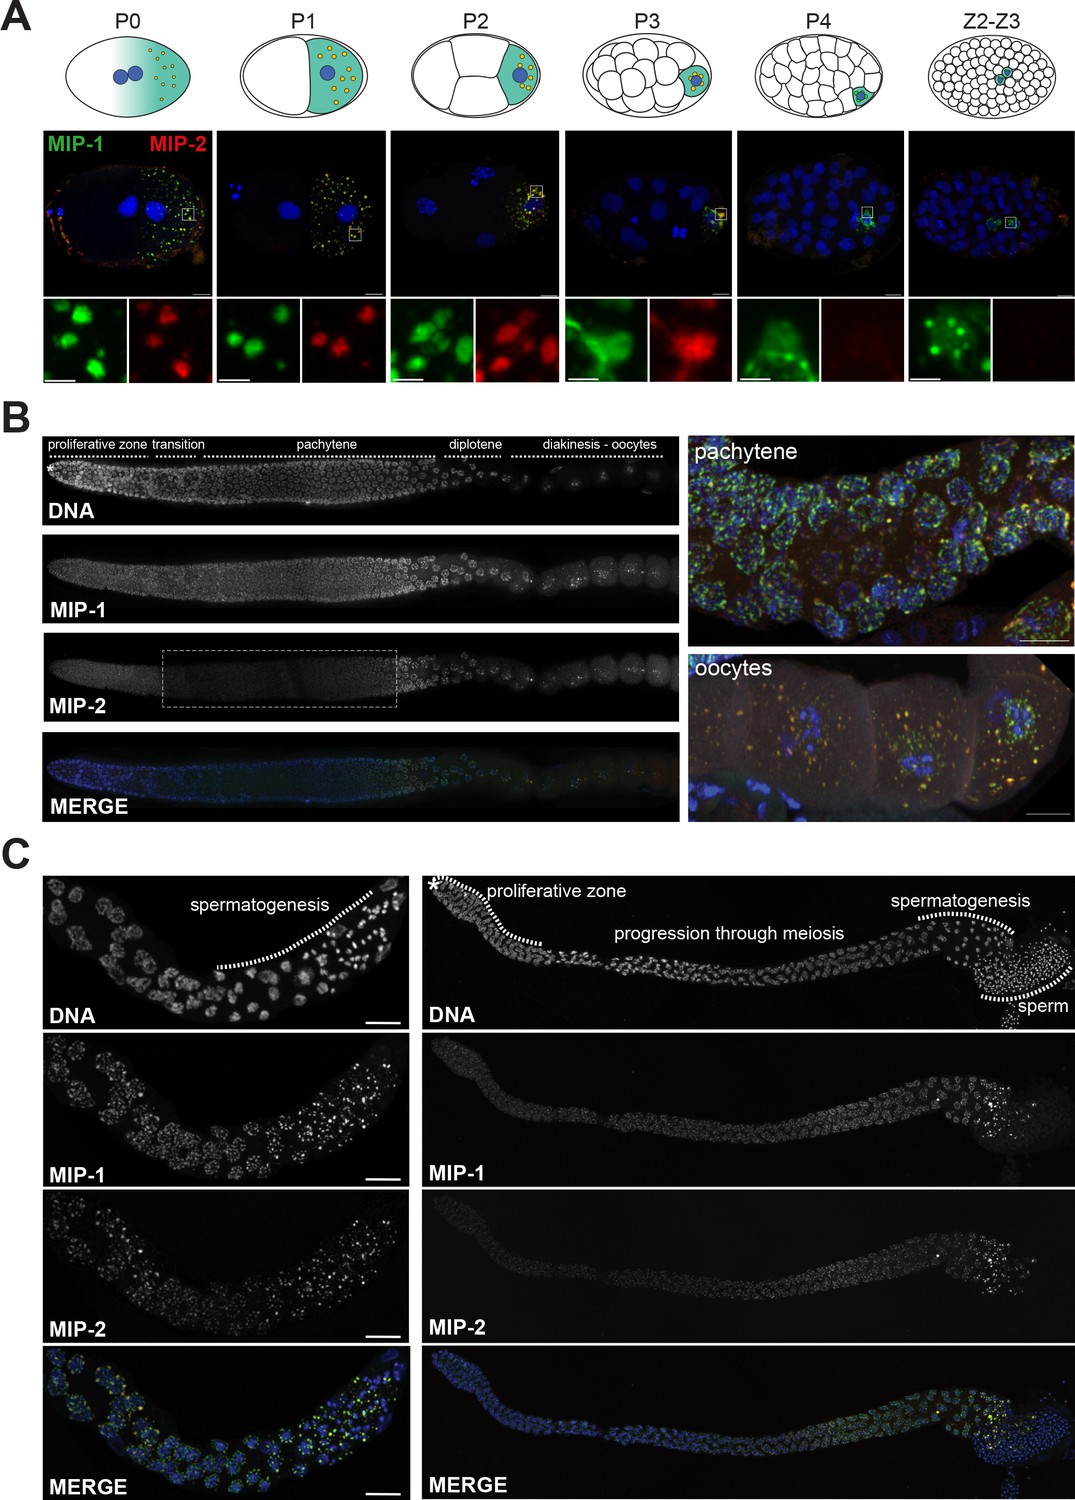
MIP-1 and MIP-2 form granules in the germ cell lineage and germ line throughout development.
Micrographs of fixed samples harboring MIP-1::GFP and MIP-2::mCherry. (A) MIP-1 and MIP-2 colocalize in granular structures in the germline precursor lineage in the embryo; beginning in P4 the expression of MIP-2 begins to decrease, becoming undetectable in older embryos (Z2–Z3). Cartoons of embryo developmental stages highlighting P lineage blastomeres (top panels), corresponding super-resolution micrographs (middle panels), and insets showing magnified sections from the embryos above in separate channels (bottom panels). Green puncta, GFP-tagged MIP-1, red puncta mCherry-tagged MIP-2, yellow color denotes the presence of similar levels of both proteins. Scale bar: 2 µm. (B) MIP-1 and MIP-2 localize to granules around germ cell nuclei in the germ line. Epifluorescence images of dissected gonads (left panel) and Zeiss LSM880 Airyscan images of pachytene nuclei and oocytes (right panel). MIP-1 is evenly expressed throughout the adult germ line, while MIP-2 expression is attenuated between the proliferative zone and pachytene exit (dashed box). (C) MIP-1 and MIP-2 are expressed during spermatogenesis in late L4 hermaphrodites (left panel) and adult males (right panel). Airyscan images of dissected gonads are oriented with the distal germ line to the left. Scale bar for left-hand panels:10 µm.
Figure 3—figure supplement 1
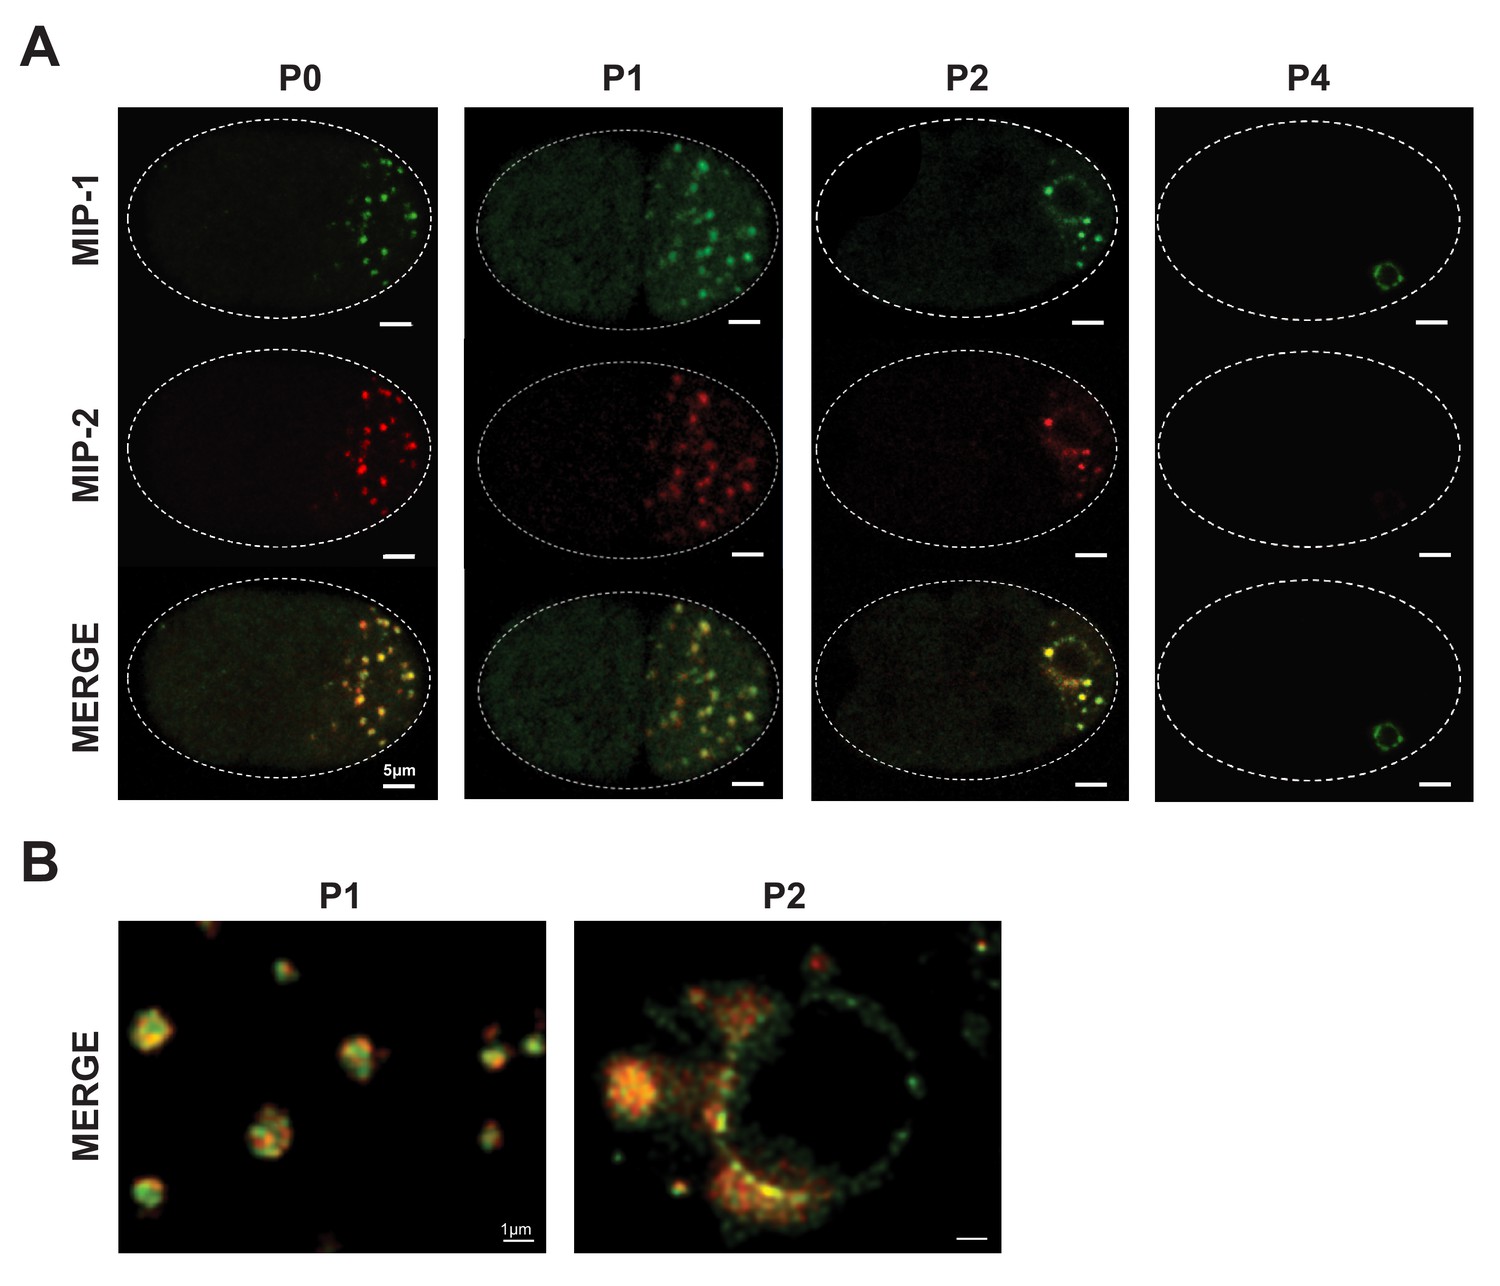
MIP-1 and MIP-2 colocalize in live embryos.
Super-resolution micrographs of MIP-1 and MIP-2 granule segregation in live early embryos. (A) MIP-1::GFP; MIP-2::mCherry embryos from 1 cell to 28 cells. (B) Free-floating granules in the P1 cell of a two-cell embryo (left) and granule attachment to the nuclear membrane in the P2 cell of a four-cell embryo (right).
Figure 4 with 1 supplement
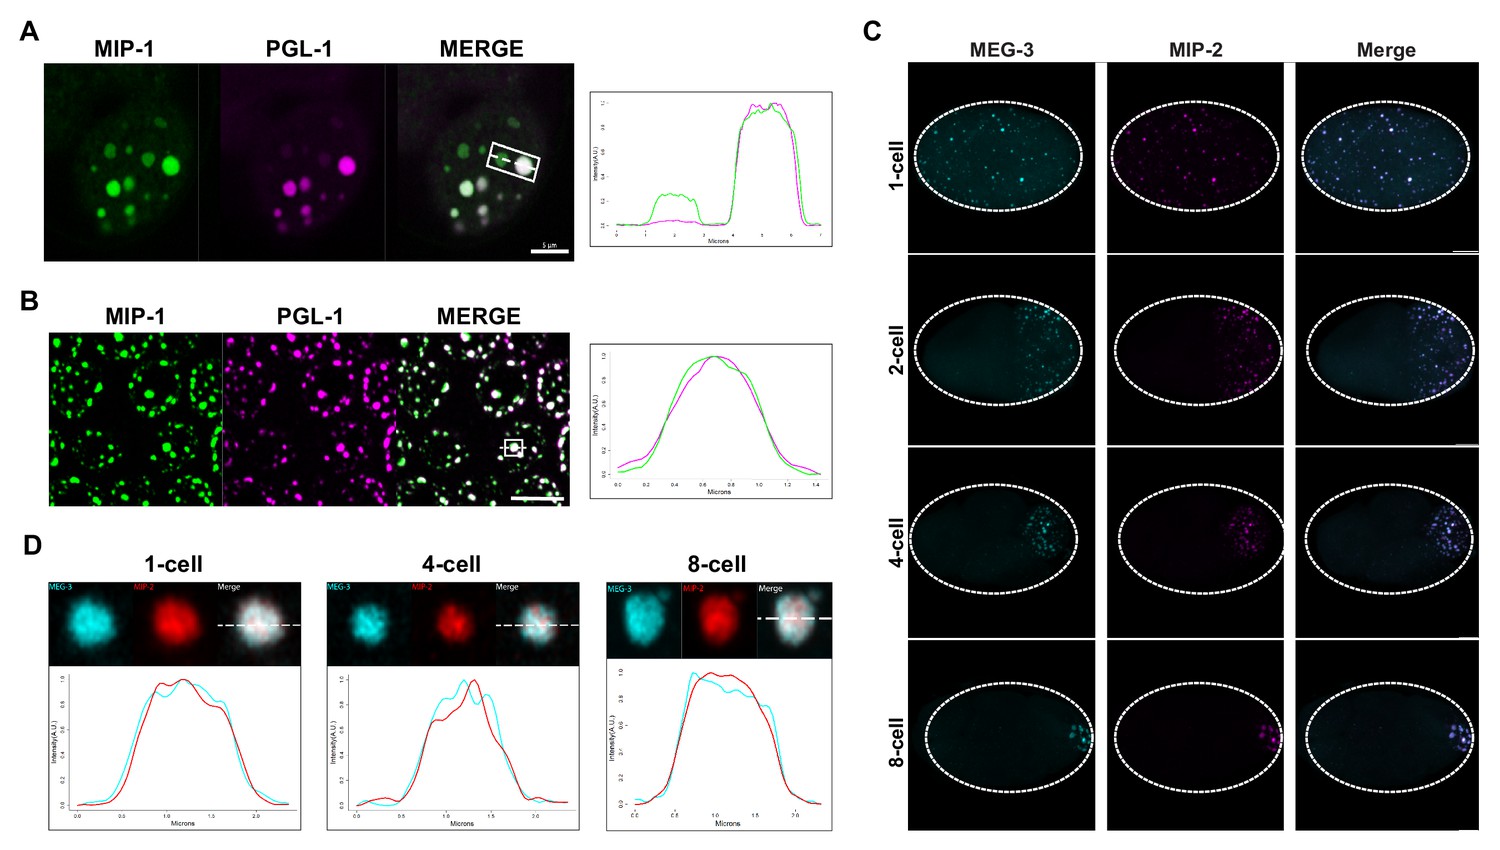
MIP-1 and MIP-2 are P granule components.
(A-B) MIP-1::GFP (green) and PGL-1::mCherry (fuschia) colocalize in (A) embryos and (B) adult germ line. (A) Left: P granules in P2 cell of a live four-cell embryo (anterior to the left). Some anteriorly localized granules contain MIP-1 and not PGL-1. Right: Cross-sectional fluorescence profile of the two granules highlighted in the micrograph, showing MIP-1::GFP and PGL-1::mCherry expression. (B) Left: Perinuclear P granules in the pachytene region. Right: Fluorescence profile of the granule highlighted in the micrograph. (C) Colocalization of MEG-3::Cerulean and MIP-2::mCherry in the early embryo. (D) Fluorescence profiles of granules from 1-cell, 4-cell, and 8-cell embryos showing complete overlap of MEG-3::Cerulean (aqua) and MIP-2::mCherry (red). Scale bars, 5 μm.
Figure 4—figure supplement 1
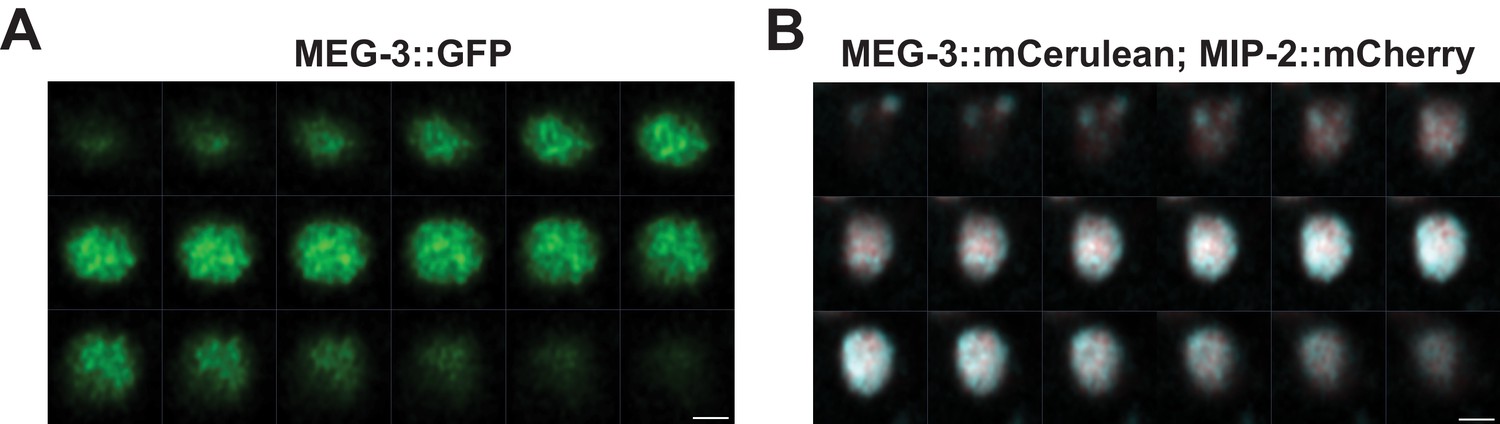
MIP-2 and MEG-3 colocalize throughout the volume of P granules in the early embryo.
Sequential images of Z-stacks through granules in P3 cells labeled with (A) GFP::MEG-3 and (B) MEG-3::Cerulean;MIP-2::mCherry. Settings: (A) 155 nm Z-step, 2.8 µm Z-section; (B) 75 nm Z-step, 1.36 µm Z-section. Scale bar: 1 µm.
Figure 5 with 6 supplements
MIP-1 and MIP-2 are required for assembly of core P granule components.
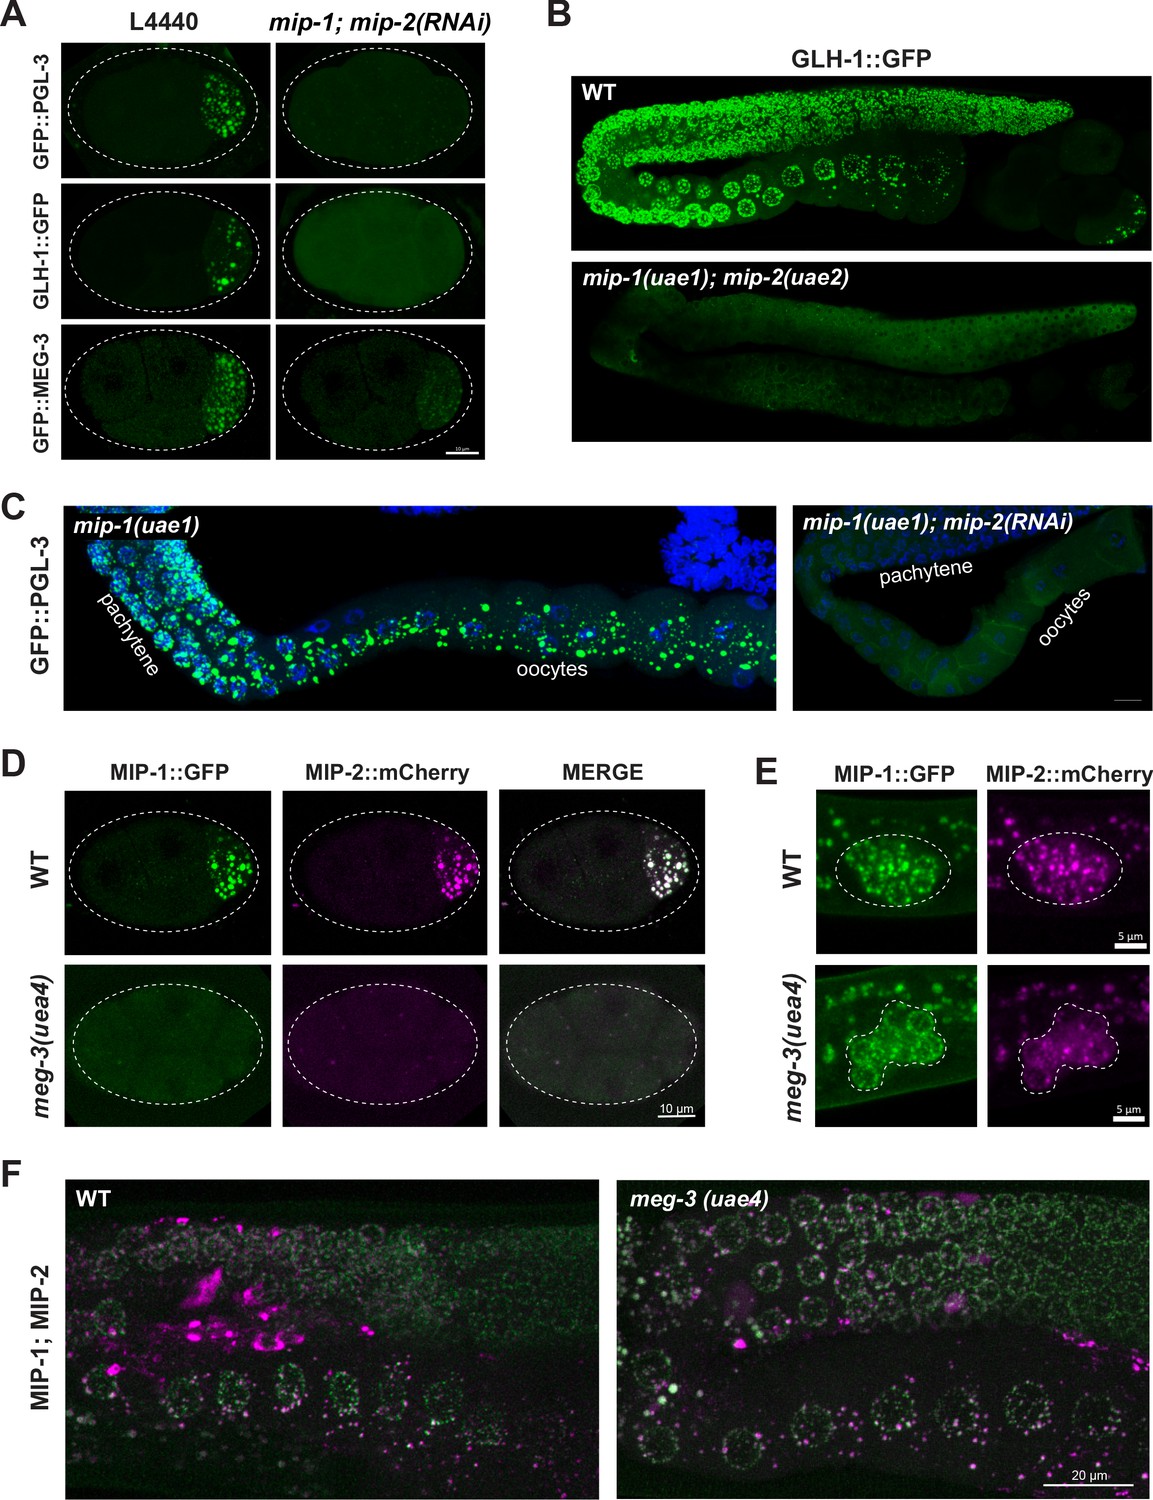
(A) Simultaneous depletion of MIP-1 and MIP-2 by RNAi affects the normal coalescence of GFP::PGL-3, GLH-1::GFP, and GFP::MEG-3 granules in the embryonic P lineage. Embryos shown are at the four-cell stage (see also Figure 5—videos 1–3). (B) GLH-1::GFP is mostly diffuse, with few small visible puncta, in the germ line of a live mip-1(uae1);mip-2(uae2) double null animal (strain GKC555). (C) Dissected and fixed germ lines carrying GFP::PGL-3 in a mip-1(uae1) genetic background (strain GKC525) show nearly complete loss of PGL-3 granules in the F1 generation when treated with mip-2(RNAi) (right) but not control RNAi (empty vector, left). (D–E) MIP-1::GFP and MIP-2::mCherry localization in WT and meg-3(uae4) null embryos (D) and L1 larvae (E). Deletion of meg-3 impairs MIP granule formation in embryos (four-cell embryos shown here) but not in L1 larvae, which express MIP-1 and MIP-2 at the onset of germ cell proliferation in dividing germ cells (enclosed by dashed line). Bright puncta outside the germ line in the green channel are autofluorescent intestinal gut granules. In both A and D, embryos in mutant backgrounds are over-exposed to visualize the blastomeres. (F) MIP-1 and MIP-2 expression in the adult germ line (WT, left) is unaffected in the presence of a meg-3 null allele (right). Dissected germ lines were stained with DAPI to visualize DNA.
Figure 5—figure supplement 1
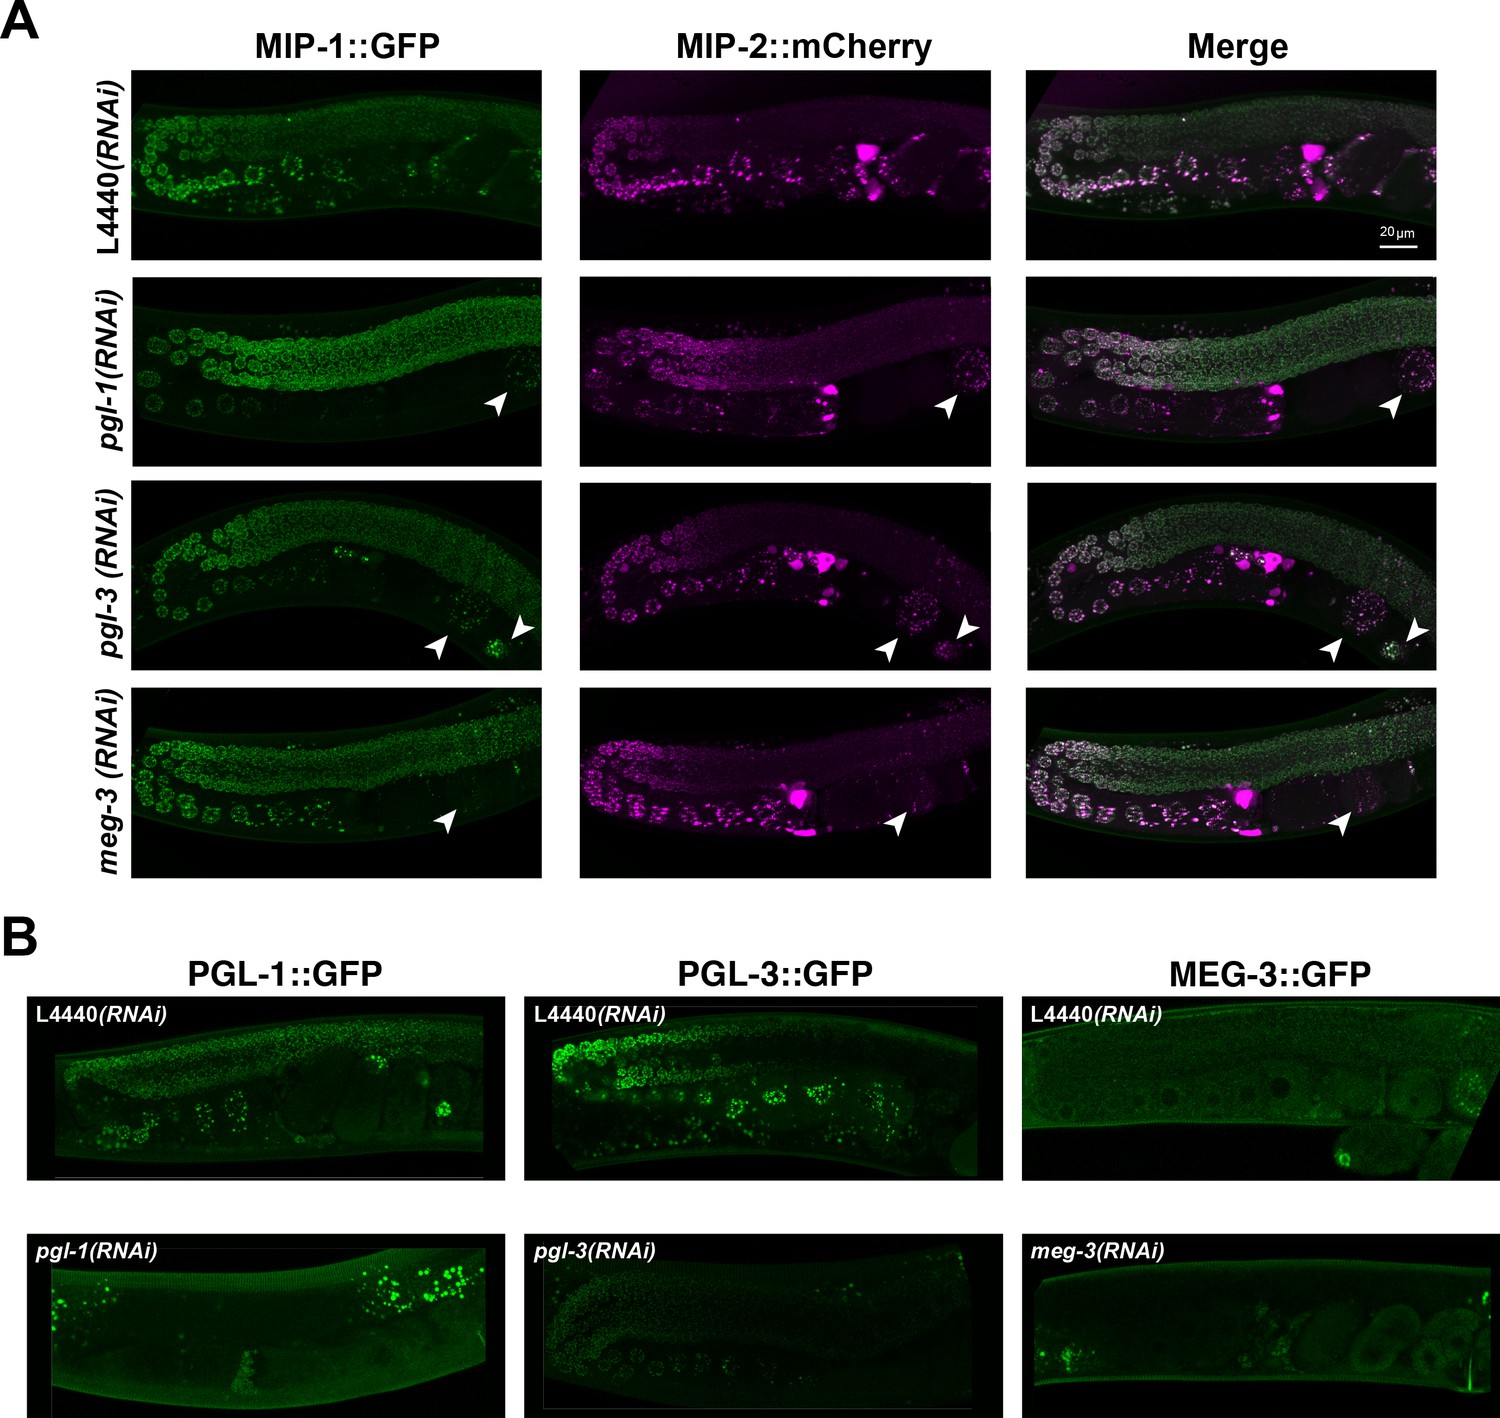
Localization of MIP-1 and MIP-2 in the adult germ line is not dependent on pgl-1, pgl-3, or meg-3.
Micrographs of MIP-1 and MIP-2 granules in germ lines from live animals. (A) MIP-1::GFP;MIP-2::mCherry germ lines from animals treated with RNAi of pgl-1, pgl-3, meg-3 and control RNAi (L4440). MIP granules in early embryos inside the uterus (arrowheads) are clearly visible in pgl-1(RNAi) and pgl-3(RNAi) animals but are reduced in meg-3(RNAi) animals. (B) Control experiments to confirm effectiveness of the RNAi constructs used in the experiment shown in A. Scale bar: 20 µm.
Figure 5—video 1
Normal formation of PGL-3 granules is affected in the early embryo when mips are depleted.
Time lapse acquisition of the first two rounds of cell division in embryos from animals carrying GFP::PGL-3 and treated with L4440 control (top) or with mip-1 and mip-2 double RNAi (bottom).
Figure 5—video 2
Normal formation of GLH-1 granules is affected in the early embryo when mips are depleted.
Time lapse acquisition of the first two rounds of cell division in embryos from animals carrying GLH-1::GFP and treated with L4440 control (top) or with mip-1 and mip-2 double RNAi (bottom).
Figure 5—video 3
Normal formation of MEG-3 granules is affected in the early embryo when mips are depleted.
Time lapse acquisition of the first two rounds of cell division in embryos from animals carrying MEG-3::GFP and treated with L4440 control (top) or with mip-1 and mip-2 double RNAi (bottom).
Figure 5—video 4
Normal formation of MIPs granules is affected in the early embryo of a meg-3 null mutant.
Time lapse acquisition of early embryonic development of embryos from animals carrying MIP-1::GFP and MIP-2::mCherry in a WT genetic background (top) and a meg-3 null mutant background (bottom).
Figure 5—video 5
MEG-3 localizes to P granules in the embryo but not in the adult germ line.
Z-stack acquisition through a gonad arm including a few embryos in a strain carrying MEG-3::mCerulean and MIP-2::mCherry.
Figure 6

Biophysical properties of P granule components.
(A) Dissected MIP-1::GFP, MIP-2::GFP, and GLH-1::GFP adult germ lines treated with 5% 1,6-hexanediol (HD) or egg buffer as a control (EB), imaged at the last experimental time point (190 s post-treatment). Quantification of the relative number of perinuclear granules over time (bottom right panel) indicates that MIP-1 and MIP-2 granules are less sensitive than GLH-1 to disruption of hydrophobic interactions. (B) Top: FRAP of individual P granules in P1 cells of two-cell (left) and P3 cells of 8- to 12-cell (right) embryos carrying individual GFP-tagged P granule proteins. Curves show mean normalized fluorescence intensity and standard error over time (n=10 replicates each). Bottom: Quantification of recovery rates from data shown in top row (median and interquartile range). PGL-3 recovery rate is higher than the other proteins in two-cell embryos; statistical differences are negligible between all other measurements (ANOVA test). Recovery rates were measured in two different MEG-3 GFP-tagged strains made by (1) bombardment [strain JH3016] or (2) CRISPR [strain JH3503].
-
Figure 6—source data 1
Biophysical properties of MIPs and other germ granule proteins in the germ line and early embryos.
- https://cdn.elifesciences.org/articles/60833/elife-60833-fig6-data1-v2.xlsx
Figure 7
MIP-1 and MIP-2 physically interact.
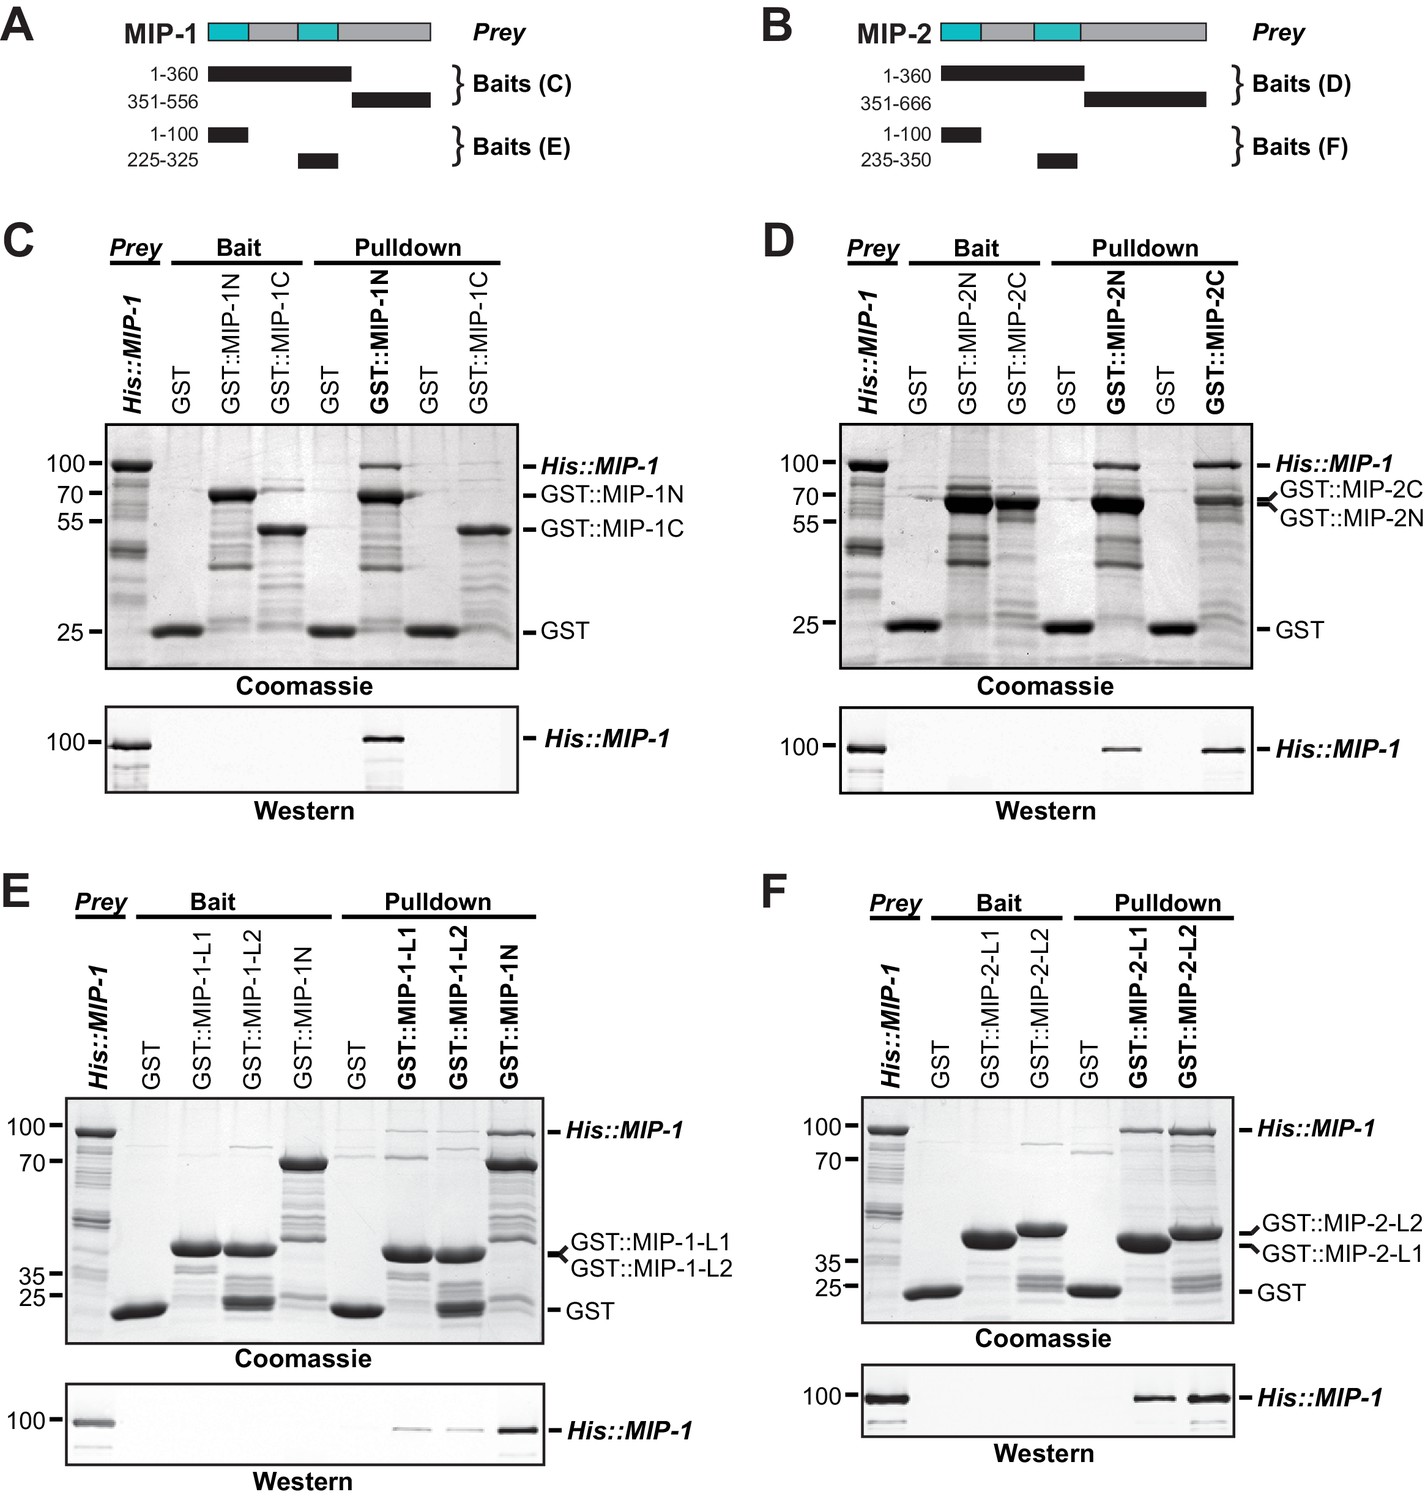
(A-B) Cartoons indicating prey and bait protein fragments used in co-immunoprecipitation experiments. LOTUS domains are depicted in cyan. (C–E) Co-immunoprecipitation of full-length 6xHis-tagged MIP-1 with GST-tagged N- and C-terminal fragments of MIP-1 (C) or MIP-2 (D) LOTUS1 and LOTUS 2 of MIP-1 (E) or LOTUS1 and LOTUS 2 of MIP-2 (F) purified recombinant proteins. (C) MIP-1 homodimerizes through its N-terminal region. (D) Full-length MIP-1 interacts with both the N- and C-terminal fragments of MIP-2. (E–F) Individual MIP-1 (E) and MIP-2 (F) LOTUS1 and LOTUS2 domains interact with full-length MIP-1.
Figure 8
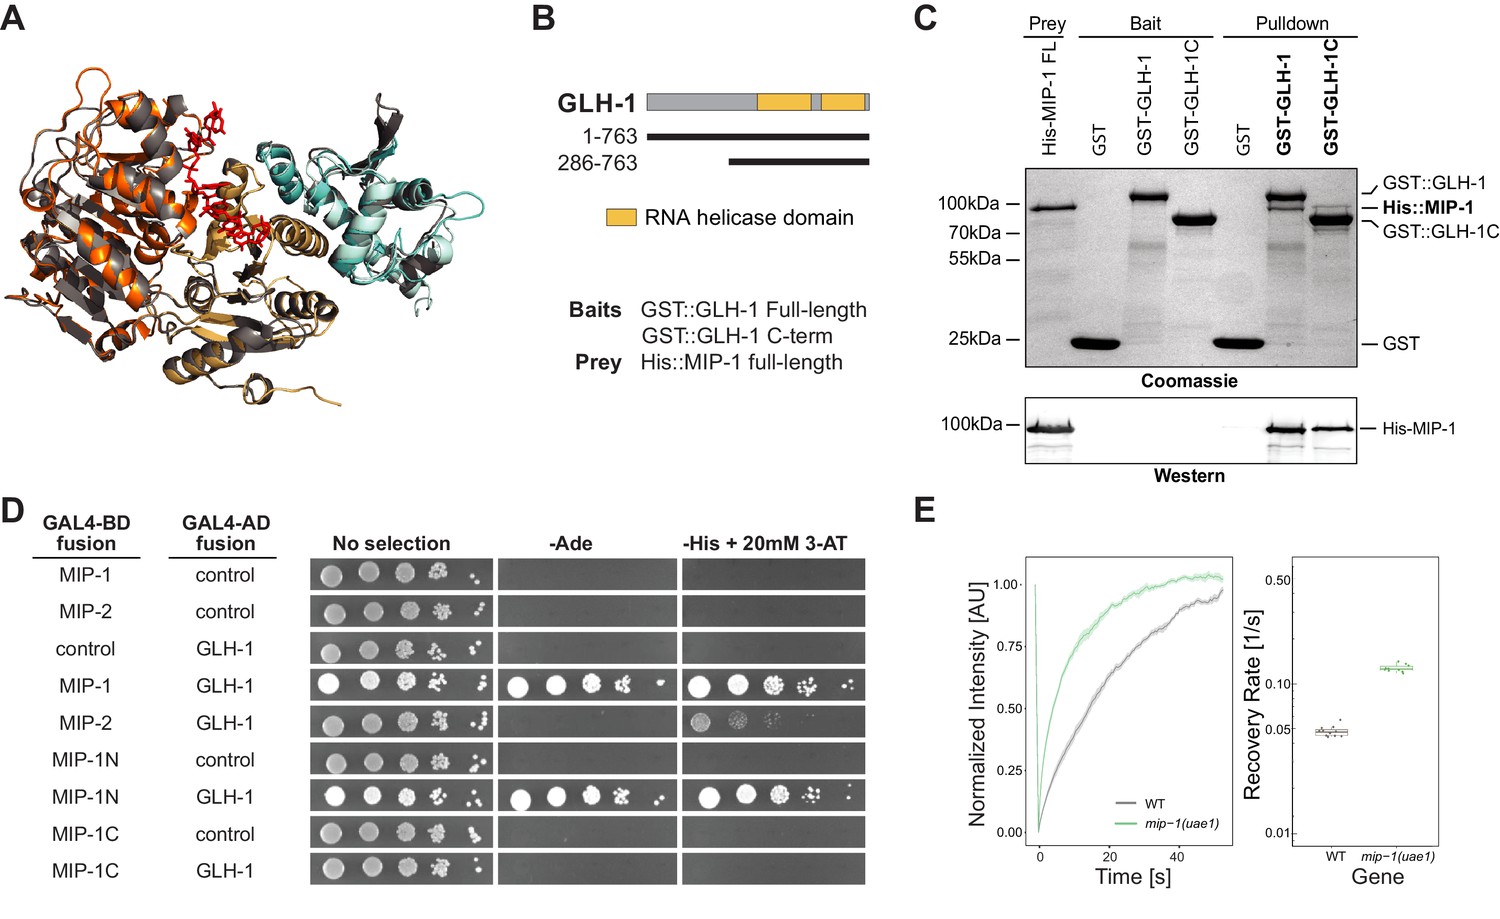
MIP-1 and MIP-2 interact directly with GLH-1, a Vasa helicase ortholog.
(A) 3D structural models showing the overlap between Vasa helicase bound to the Oskar LOTUS domain (gray ribbons) and GLH-1 helicase N-terminal (orange) and C-terminal (salmon) helicase domains bound to LOTUS1 of MIP-1 (cyan) and MIP-2 (sky blue). (B) Schematic of GLH-1 constructs used. The N- and C-terminal helicase domains (orange) span residues 372–556 and 592–739 and are separated by a short linker. (C) His-tagged full-length MIP-1 co-immunoprecipitates with GST-tagged full-length GLH-1 and with the GLH-1 C-terminal region. (D) Yeast two-hybrid assays for MIP-1 and MIP-2 interaction with GLH-1. Yeast Gal4 DNA-binding domain (Gal4-BD) and Gal4 activation domain (Gal4-AD) were fused to C. elegans MIP constructs containing a terminal 3xFLAG tag. Positive interactions display prototrophy upon activation of ADE2 and HIS3 reporters. Full-length MIP-1 and residues 1–360, spanning its two LOTUS domains, interact directly with GLH-1. MIP-2 also interacts with GLH-1 but gives a weaker result by this assay. (E) FRAP curves and recovery rates of GLH-1::GFP in P3 cells of (gray) WT and (green) mip-1(uae1) null embryos (n=10 replicates each). The recovery rate of GLH-1::GFP is significantly increased in the absence of MIP-1, indicating increased mobility.
-
Figure 8—source data 1
The mobility of GLH-1 granules depends on the presence of MIP-1 in P3 cells.
- https://cdn.elifesciences.org/articles/60833/elife-60833-fig8-data1-v2.xlsx
Figure 9 with 3 supplements
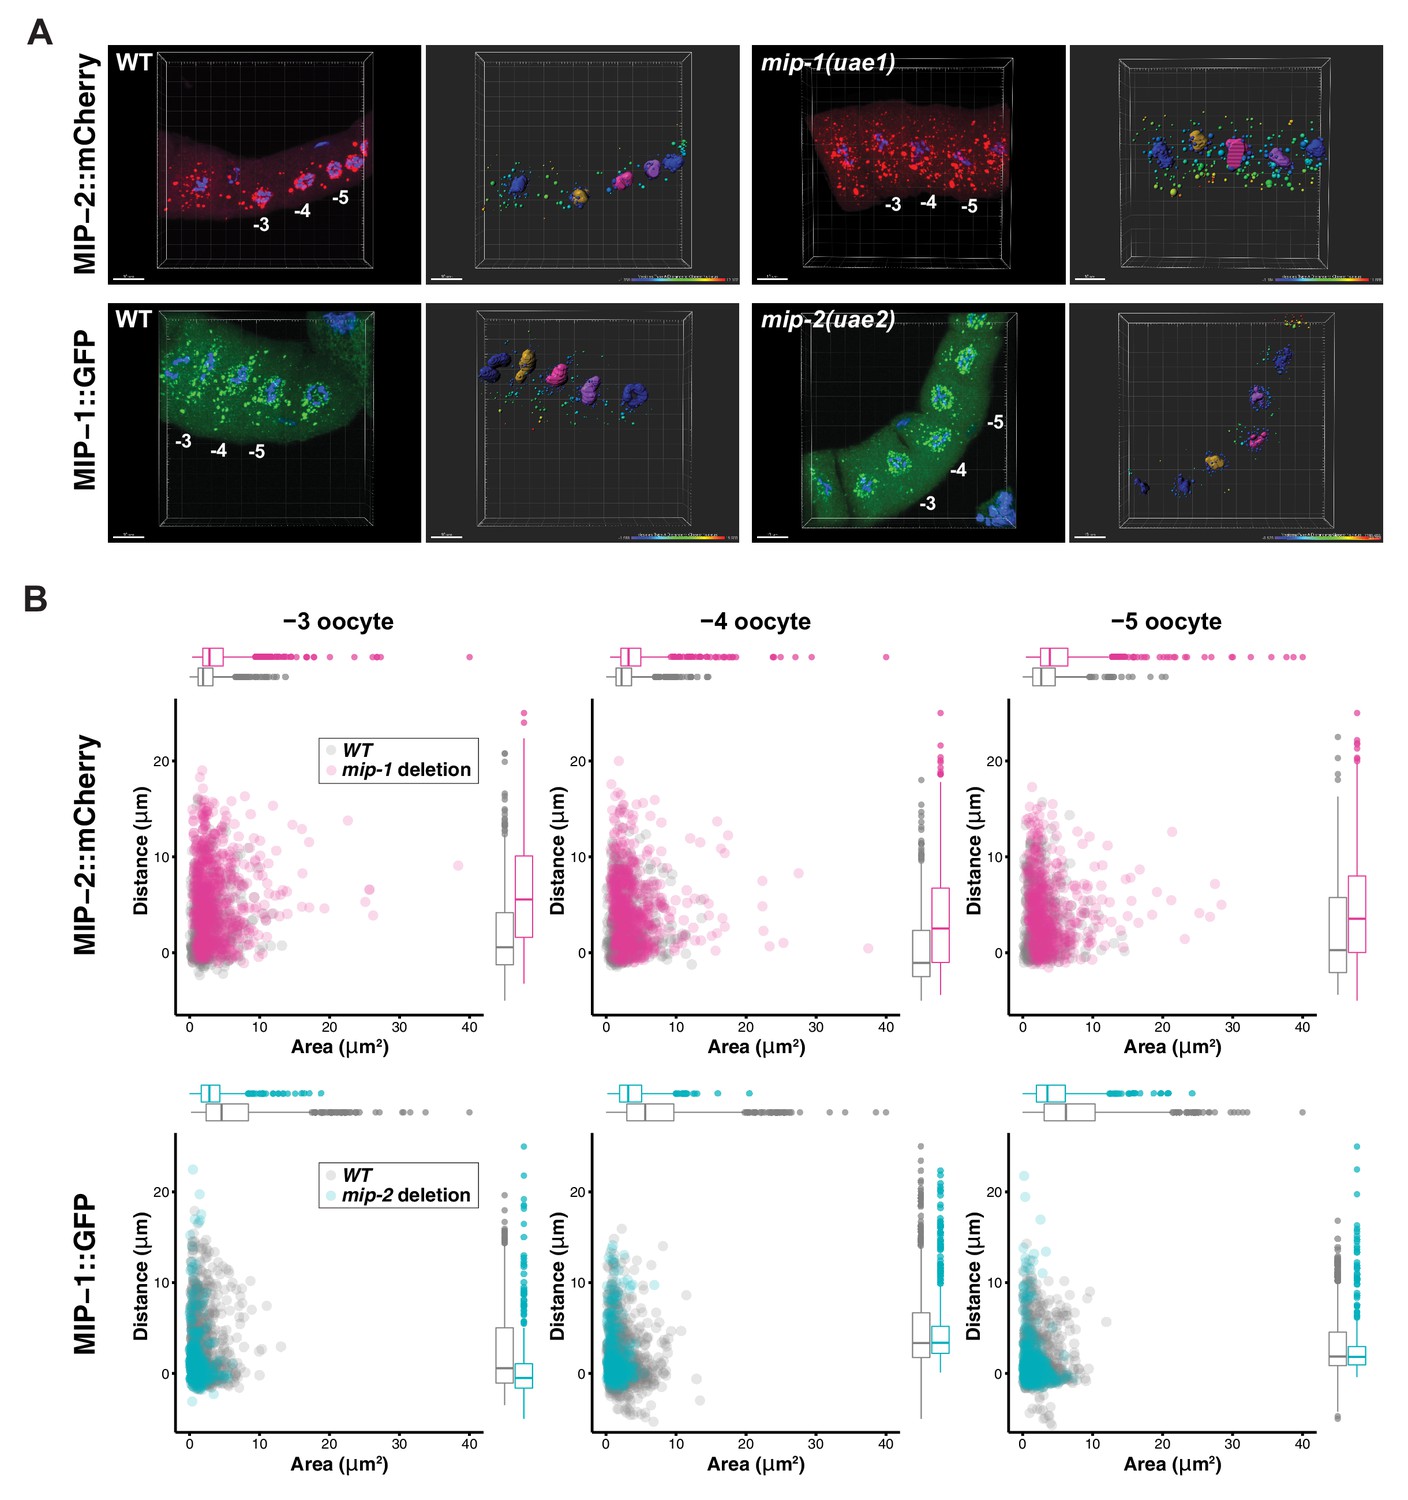
MIP-1 and MIP-2 have opposing effects on granule growth and distribution in the adult germ line.
(A) Identification of granules in the −3, –4, and −5 oocytes using Imaris image analysis software. Examples of typical micrographs of dissected germ lines used as input for the software are paired with their corresponding Imaris outputs for WT (left) and homozygous mip deletion alleles (right). Oocyte nuclei are colored according to position from the uterus: −3 (amber), −4 (fuchsia), −5 (purple). Other nuclei not included in the analysis are colored in blue. Identified granules are depicted using a color gradient according to their distance from nuclear boundaries (blue, closest; red, farthest away). Top row: MIP-2::mCherry in WT vs. mip-1(uae1) null background, showing increased size P granules in the cytoplasm. Granules are also seen in the rachis. Bottom row: MIP-1::GFP in WT vs. mip-2(uae2) null background, showing concentration of P granules around the nuclear periphery and reduction of cytoplasmic granule number and size. Scale bars, 10 μm. (B) Quantification of granule area and distance from nuclei in −3, –4, and −5 oocytes (10 gonads per genotype).
-
Figure 9—source data 1
MIP-1 and MIP-2 affect each other’s localization and granule size in the germline.
- https://cdn.elifesciences.org/articles/60833/elife-60833-fig9-data1-v2.xlsx
Figure 9—figure supplement 1
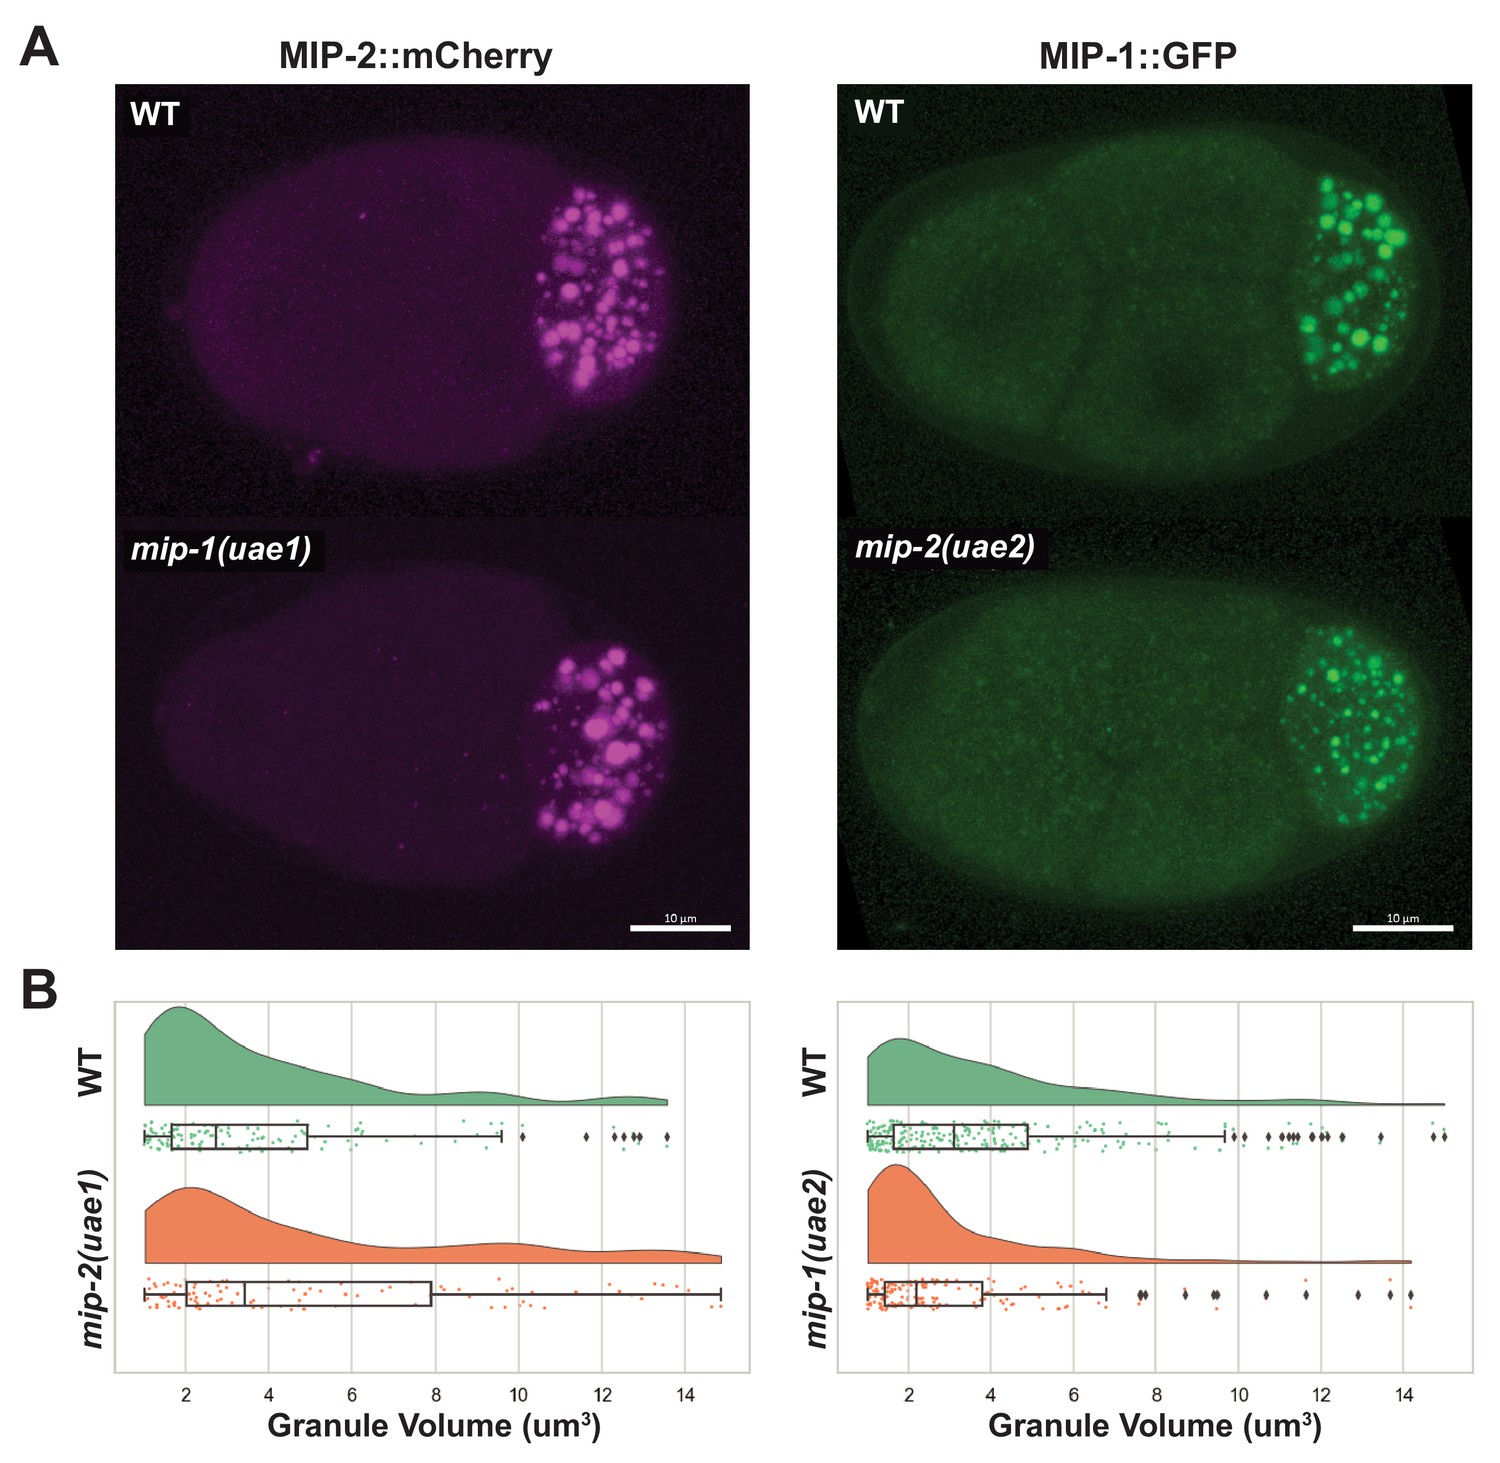
MIPs affect each other’s condensation in embryos.
(A) MIP-2::mCherry four-cell embryos (left), and MIP-1::GFP four-cell embryos (right). (B) Quantification of MIP granule volume in four-cell embryos comparing mip deletion strains with their corresponding controls. MIP-2 granules are larger in average when mip-1 is deleted, and MIP-1 granules are smaller in average when mip-2 is deleted.
-
Figure 9—figure supplement 1—source data 1
MIP-1 and MIP-2 affect each other’s granule size in early embryos.
- https://cdn.elifesciences.org/articles/60833/elife-60833-fig9-figsupp1-data1-v2.xlsx
Figure 9—video 1
MIP-2 granule formation depends on mip-1 in the early embryo.
Time-lapse acquisition of the first two rounds of cell division in embryos from animals carrying MIP-2::GFP in a WT genetic background (top) and a mip-1 null mutant background (bottom).
Figure 9—video 2
MIP-1 granule formation depends on mip-2 in the early embryo.
Time-lapse acquisition of the first two rounds of cell division in embryos from animals carrying MIP-1::GFP in a WT genetic background (top) and a mip-2 null mutant background (bottom).
Figure 10 with 2 supplements
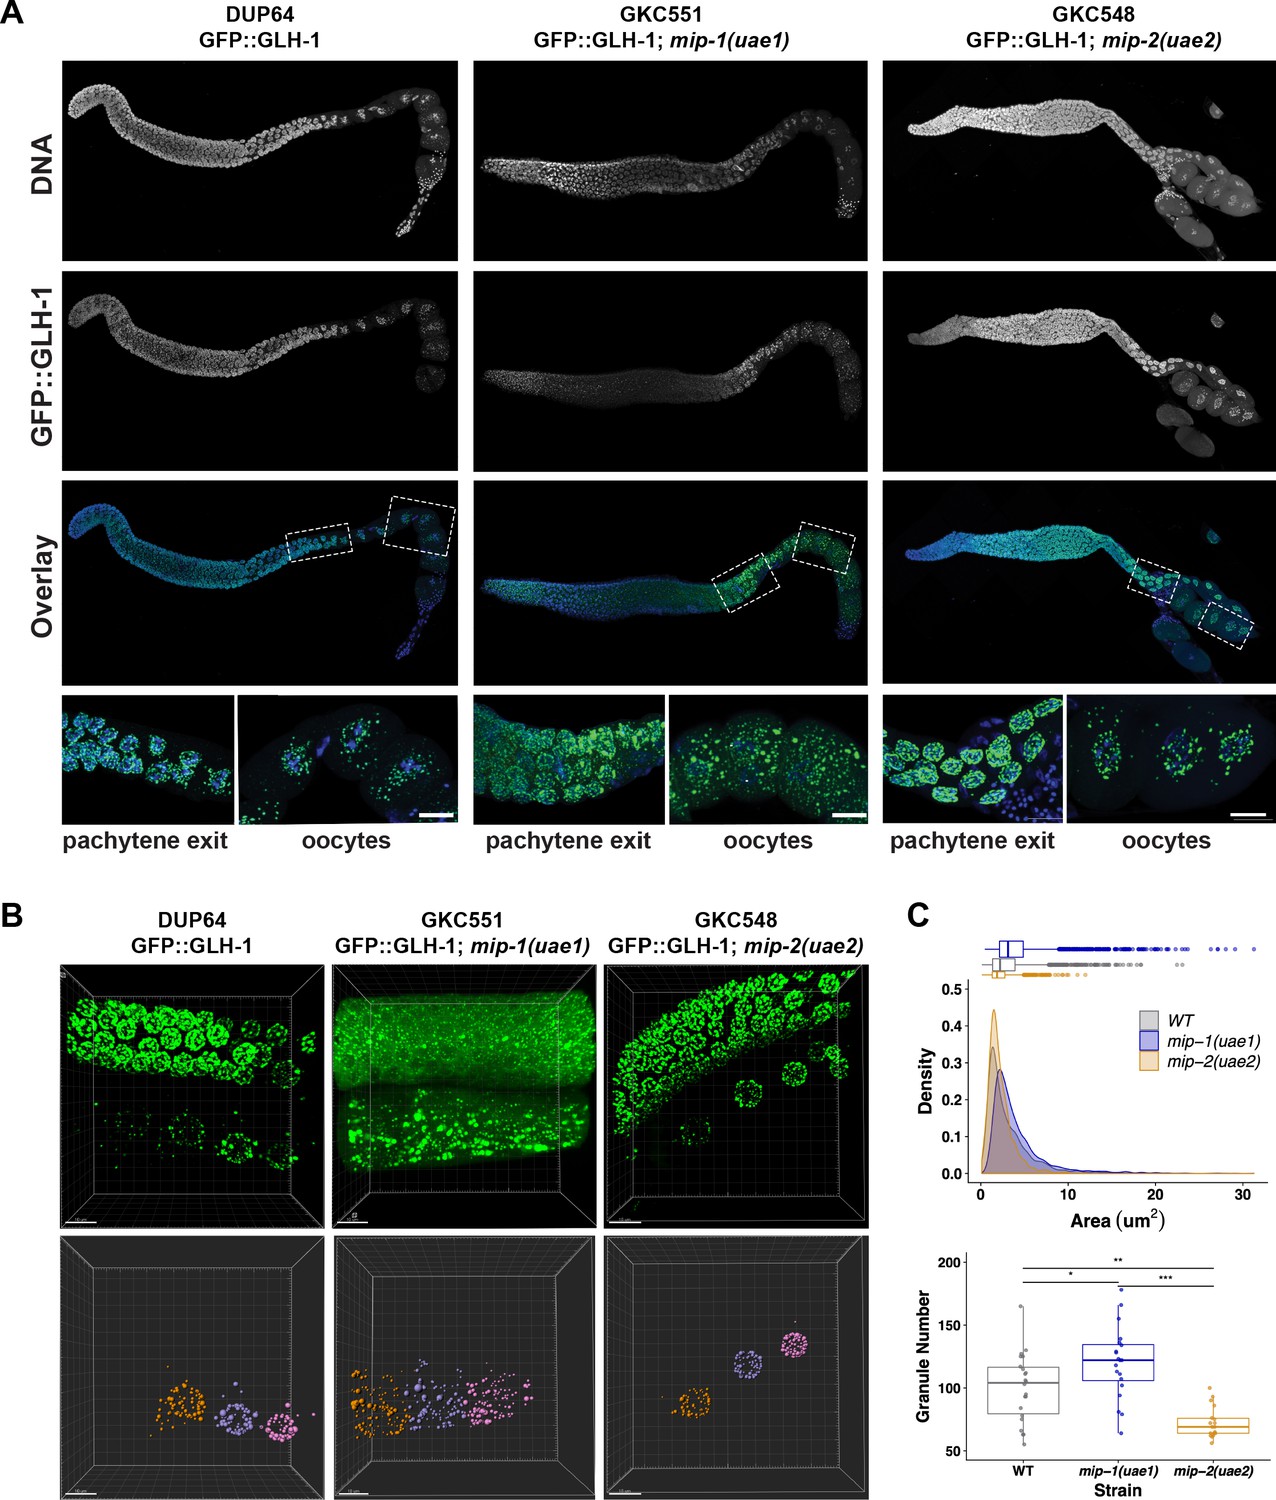
MIP-1 and MIP-2 are required for proper GLH-1 localization in vivo.
(A-B) Localization of GLH-1::GFP in (A) fixed dissected gonads and (B) live animals of different genetic backgrounds: WT (strain DUP64), mip-1(uae1) null allele (strain GKC551), and mip-2(uae2) null allele (strain GKC548). (A) Granules show opposing trends in mip-1 null (more cytoplasmic) and mip-2 null (more perinuclear) backgrounds. Bottom row shows magnified views of boxed regions in overlays. (B) Representative examples used for Imaris quantification of granules in oocytes, showing inputs (top) and outputs (bottom). Granules are colored according to nuclear position relative to the uterus: −2 (orange), −3 (purple), −4 (fuchsia). A section of the meiotic germ line is visible above the oocytes. (C) Quantification of granule area (top) and number (bottom), combining data from the −2, –3, and −4 oocytes. Tukey’s adjusted p-values from one-way ANOVA: *** < 0.001; ** 0.017; * 0.052.
-
Figure 10—source data 1
GLH-1 localization and granule size in the germline depends on MIP-1 and MIP-2.
- https://cdn.elifesciences.org/articles/60833/elife-60833-fig10-data1-v2.xlsx
Figure 10—figure supplement 1
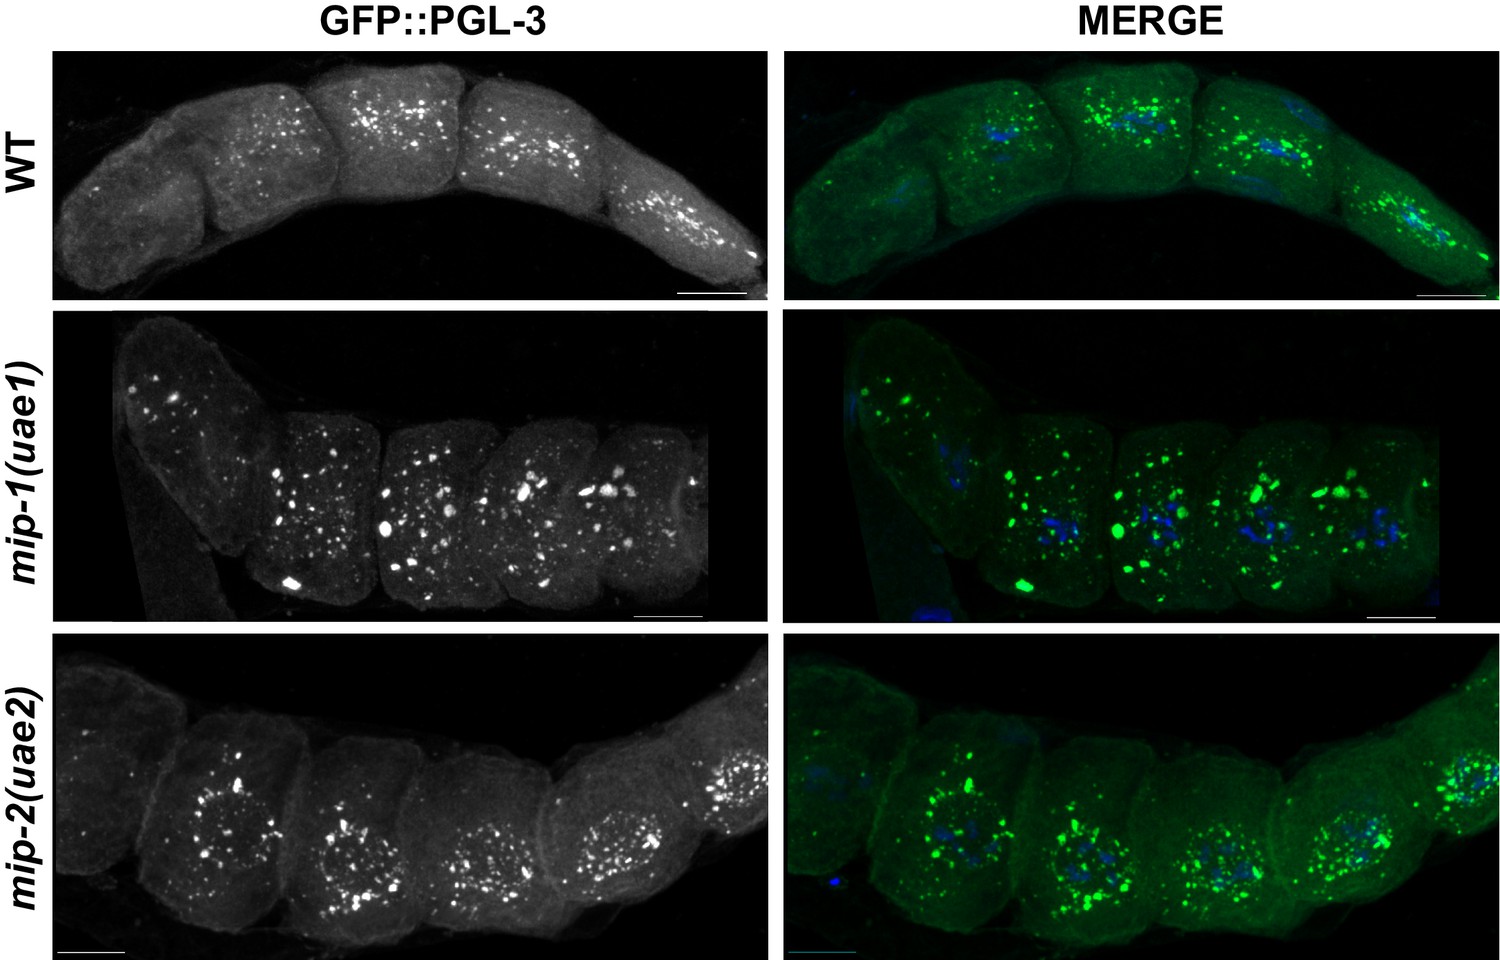
MIP-1 and MIP-2 are required for the proper localization of PGL-3 granules.
Localization of GFP::PGL-3 in oocytes from adult dissected gonads of different genetic backgrounds: Wild-type strain (JH2017) (top), mip-1(uae1) null (strain GKC525) (middle), and mip-2(uae2) null (strain GKC548) (bottom). Panels labeled ‘MERGE’ show overlay of GFP (green) and DAPI (DNA, blue) signals.
Figure 10—video 1
Localization of GLH-1 granules is affected in germ cells when individual mips are removed.
Z-stack acquisition through a section of the gonad of animals carrying GLH-1::GFP in a WT background (left), a mip-1 null background (middle), or a mip-2 null background (right). Pachytene germ cells and oocytes are visible.
Figure 11
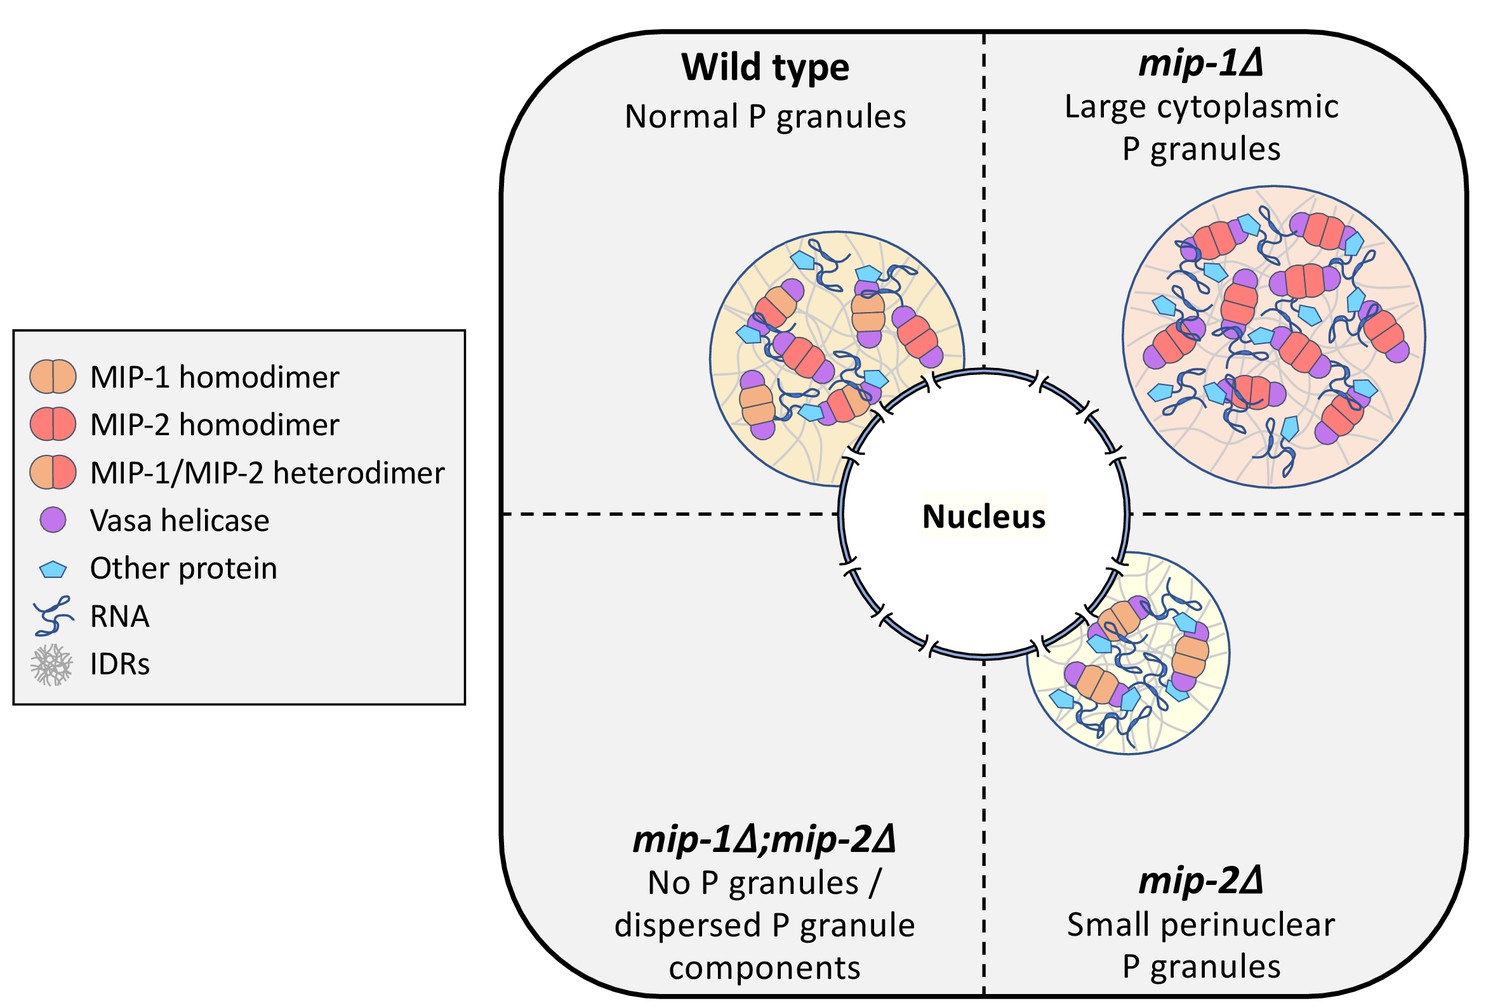
Conceptual illustration of MIP-1 and MIP-2 function in the C.elegans germ line.
The MIPs form homo- and heterodimers and bind Vasa helicases through their LOTUS domains to nucleate and scaffold RNP complexes. These associations are likely enhanced by additional interactions between MIP IDRs and other proteins or RNAs. The MIPs balance each other to regulate P granule localization and size, and other P granule components fail to undergo phase separation when both are missing.
Additional files
-
Supplementary file 1
An Excel file containing multiple tables in different tabs.
(a) Table S1. Proteins enriched in GFP::MEG-3 pulldowns. Proteins are sorted according to their p-value from the t SAM statistic as previously described (Chen et al., 2016). (b) Table S2. Similarity measures between predicted MIP LOTUS domain structures and LOTUS domains from other metazoans. Protein domains: M1, MIP-1; M2, MIP-2; L1, LOTUS1; L2, LOTUS2. SeqID, sequence identity; GDT, Global Distance Test parameters for best templates; PDB ID, protein databank identifier of the best template; RMSD, backbone root mean square distances in Å, with number of aligned residues in parentheses. Published structures used for comparison: D. melanogaster Oskar (PBD ID 5nt7), H. sapiens TDRD5 (PBD ID 3s93). (c) Table S3. Pairwise MIP LOTUS structural similarity analysis. Values shown are backbone rmsd values in Å and number of aligned residues (in parentheses). M1, MIP-1, M2, MIP-2; L1, LOTUS1; L2, LOTUS2. (d) Table S4. Description of MIP depletion phenotypes. (e) Table S5. Pairwise predicted binding affinities between MIP LOTUS domains and between MIP LOTUS domains and GLH-1. Affinities are in kcal/mol. M1, MIP-1; M2, MIP-2; L1, LOTUS1; L2, LOTUS2. Predictions for GLH-1 binding considered only the helicase CTD domain. Predictions for combinations with no values given were highly unfavorable (>0 kcal/mol). Predicted binding affinities for the native Drosophila complexes: Oskar LOTUS homodimer = −54.5 kcal/mol; Oskar LOTUS—Vasa helicase complex = −53.5 kcal/mol. (f) Table S6. Strains produced and used in this study. (g) Table S7. Guide RNA sequences, repair templates, and screening primers for CRISPR strains produced in this study. (h) Table S8. Plasmid DNA constructs for in vitro pulldown experiments.
- https://cdn.elifesciences.org/articles/60833/elife-60833-supp1-v2.xlsx
-
Transparent reporting form
- https://cdn.elifesciences.org/articles/60833/elife-60833-transrepform-v2.pdf
Download links
A two-part list of links to download the article, or parts of the article, in various formats.
Downloads (link to download the article as PDF)
Open citations (links to open the citations from this article in various online reference manager services)
Cite this article (links to download the citations from this article in formats compatible with various reference manager tools)
Novel LOTUS-domain proteins are organizational hubs that recruit C. elegans Vasa to germ granules
eLife 10:e60833.
https://doi.org/10.7554/eLife.60833


