Rab5 and Rab11 maintain hematopoietic homeostasis by restricting multiple signaling pathways in Drosophila
- Department of Genetics, College of Life Sciences, Northeast Forestry University, China
Figures
Figure 1 with 2 supplements
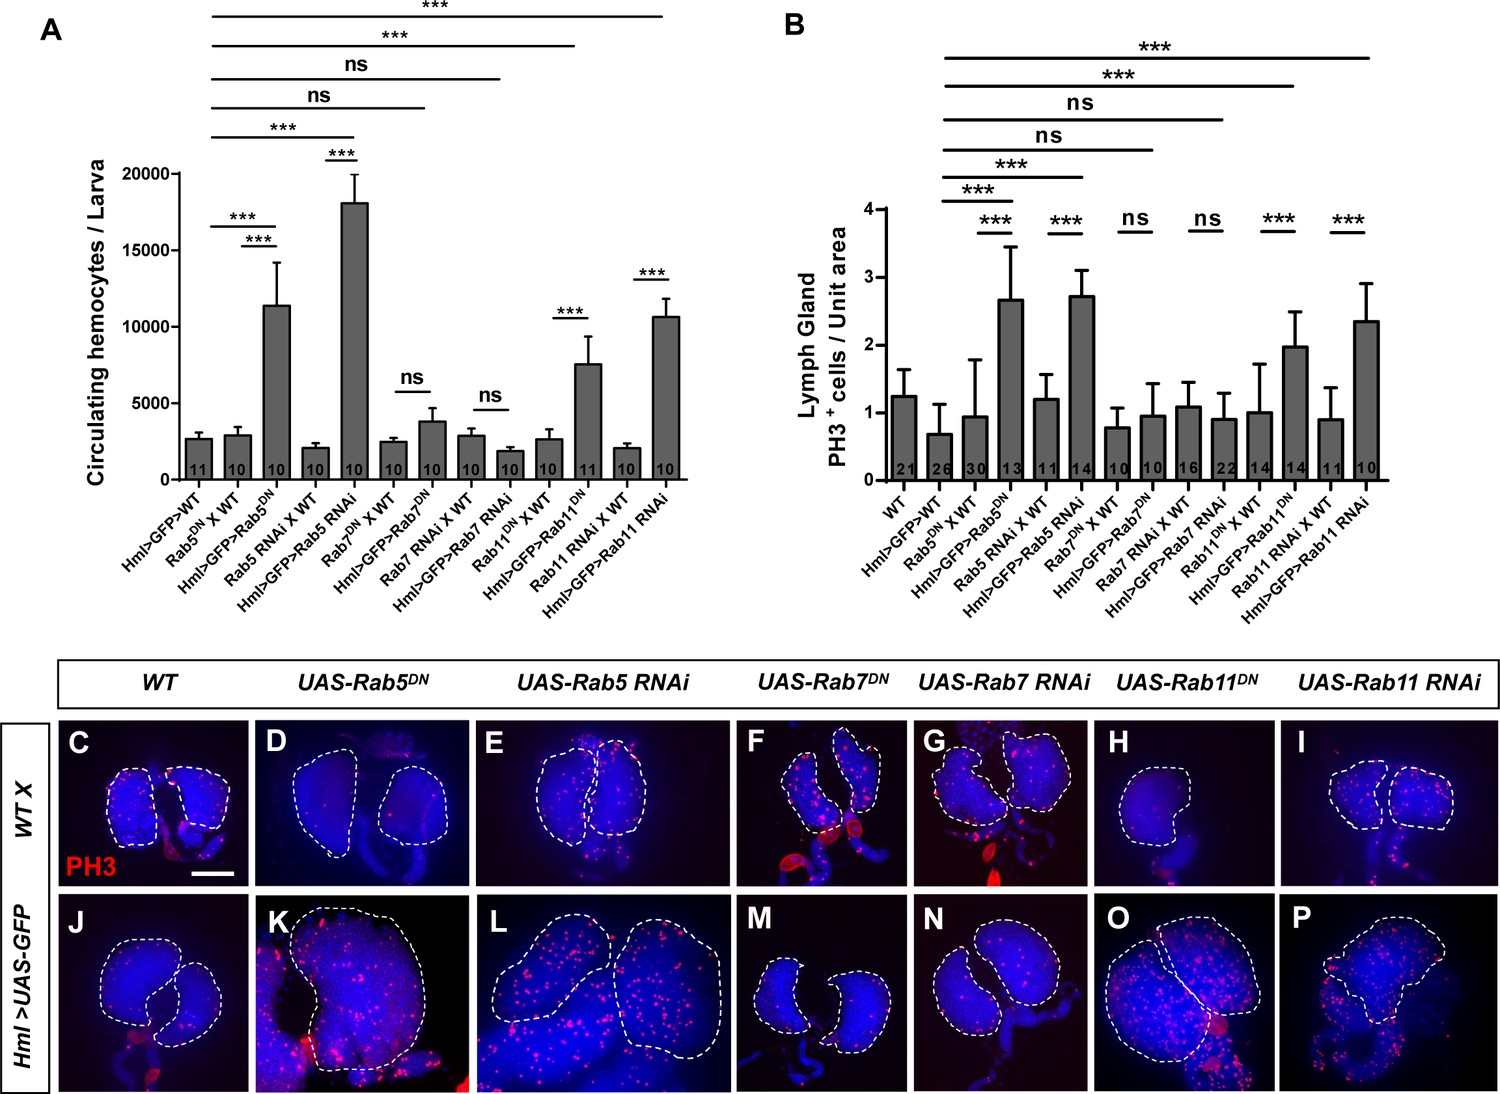
Inhibiting Rab5 or Rab11 promoted cell proliferation in circulating hemocytes and lymph glands.
(A) The number of circulating hemocytes increased upon the loss of Rab5 or Rab11 but not Rab7 in hemocytes. (B–P) Immunostaining for PH3 was performed in lymph glands from third instar larvae. The number of PH3-positive cells increased after the inactivation of Rab5 or Rab11 but not Rab7. The PH3-positive cell count per unit area was calculated as the PH3-positive cell count on a single anterior lobe divided by the area of the single anterior lobe; the quantification is shown in (B). Scale bar: 50 μm. ns, not significant; ***p<0.001 (one-way ANOVA).
Figure 1—figure supplement 1
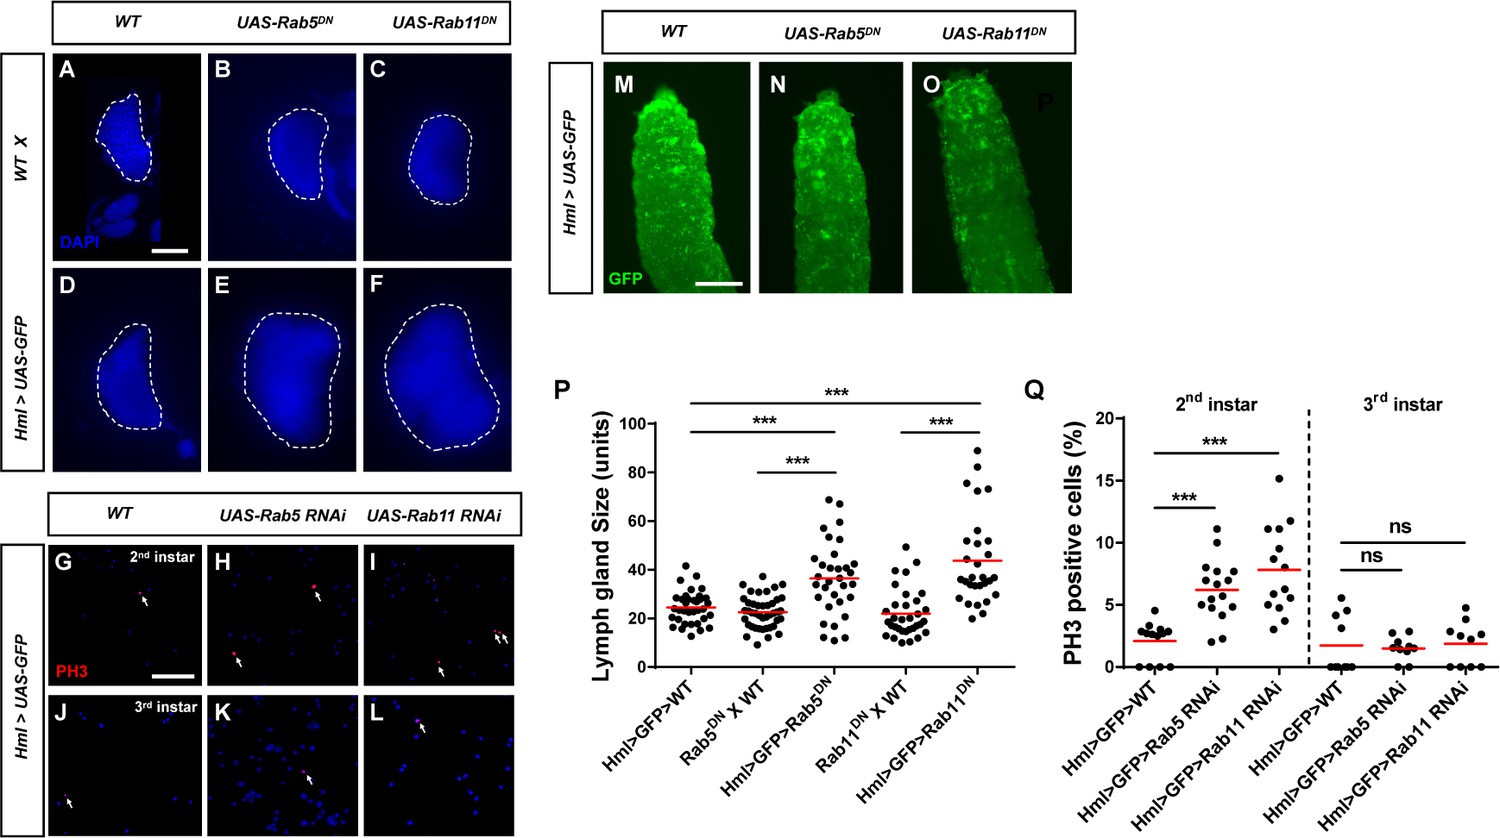
Analyses of lymph gland size and cell proliferation in circulating hemocytes as well as the sessile hemocyte pattern.
(A–F, P) Lymph glands were labeled with DAPI to measure the anterior lobe area. The anterior lobe areas in different genotypes are shown in (P). (G–L, Q) Cell proliferation was analyzed in hemocytes from second instar (G–I) and third instar larvae (J–L) via anti-PH3 antibodies, and the PH3-positive cell percentage is shown in (Q). (M–O) The sessile hemocyte pattern was unchanged in Hml>UAS-Rab5/11DN larvae. Scale bars: 50 μm (lymph glands and hemocytes) and 500 μm (larvae). ns, not significant; ***p<0.001 (one-way ANOVA).
Figure 1—figure supplement 2
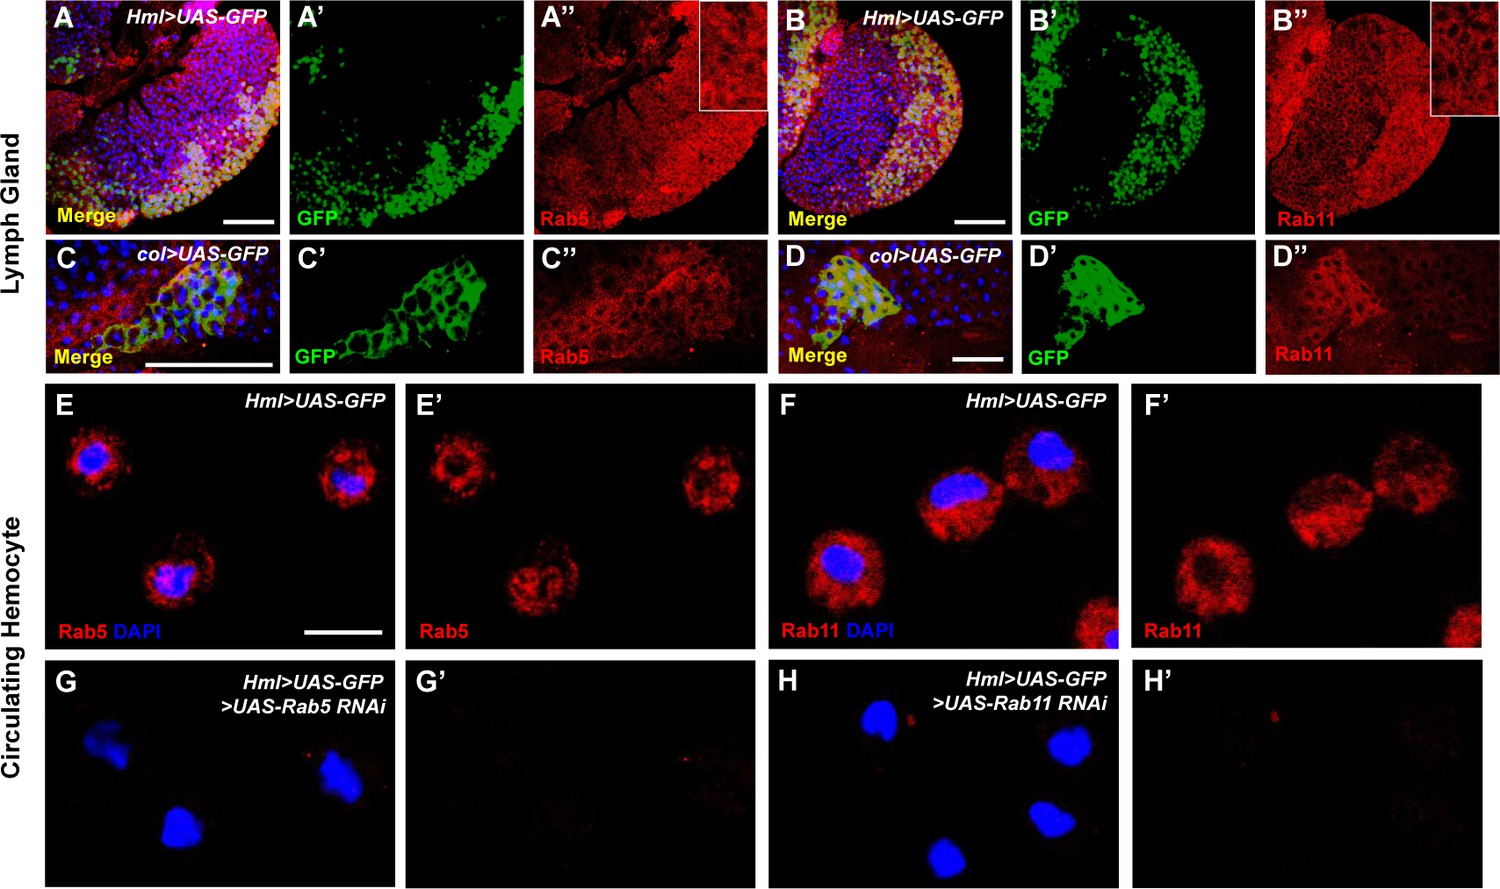
Localization of the Rab5 and Rab11 proteins in lymph glands and hemocytes.
(A–D”) The localization of Rab5 and Rab11 was analyzed in Hml>UAS-GFP and col>UAS-GFP lymph glands with anti-GFP (green) and anti-Rab5 (red) or anti-Rab11 (red) antibodies as appropriate. (E–H’) No Rab5 or Rab11 signals were observed in Hml>UAS-GFP>UAS-Rab5 RNAi or Hml>UAS-GFP>UAS-Rab11 RNAi hemocytes, respectively. Scale bars: 10 μm (hemocytes) and 50 μm (lymph glands).
Figure 2 with 6 supplements
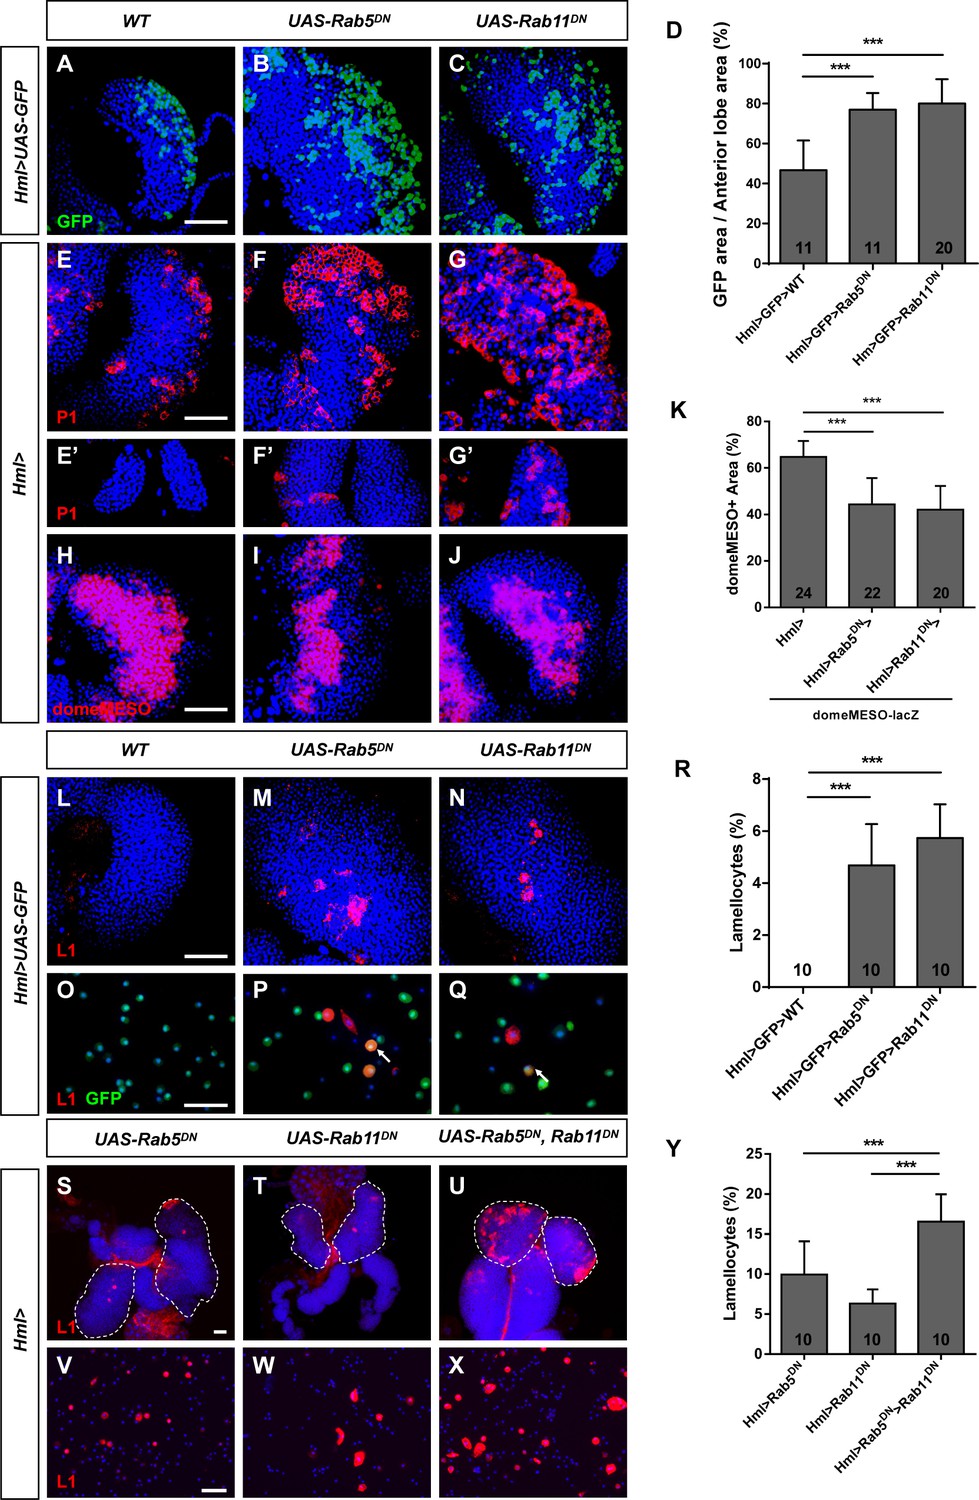
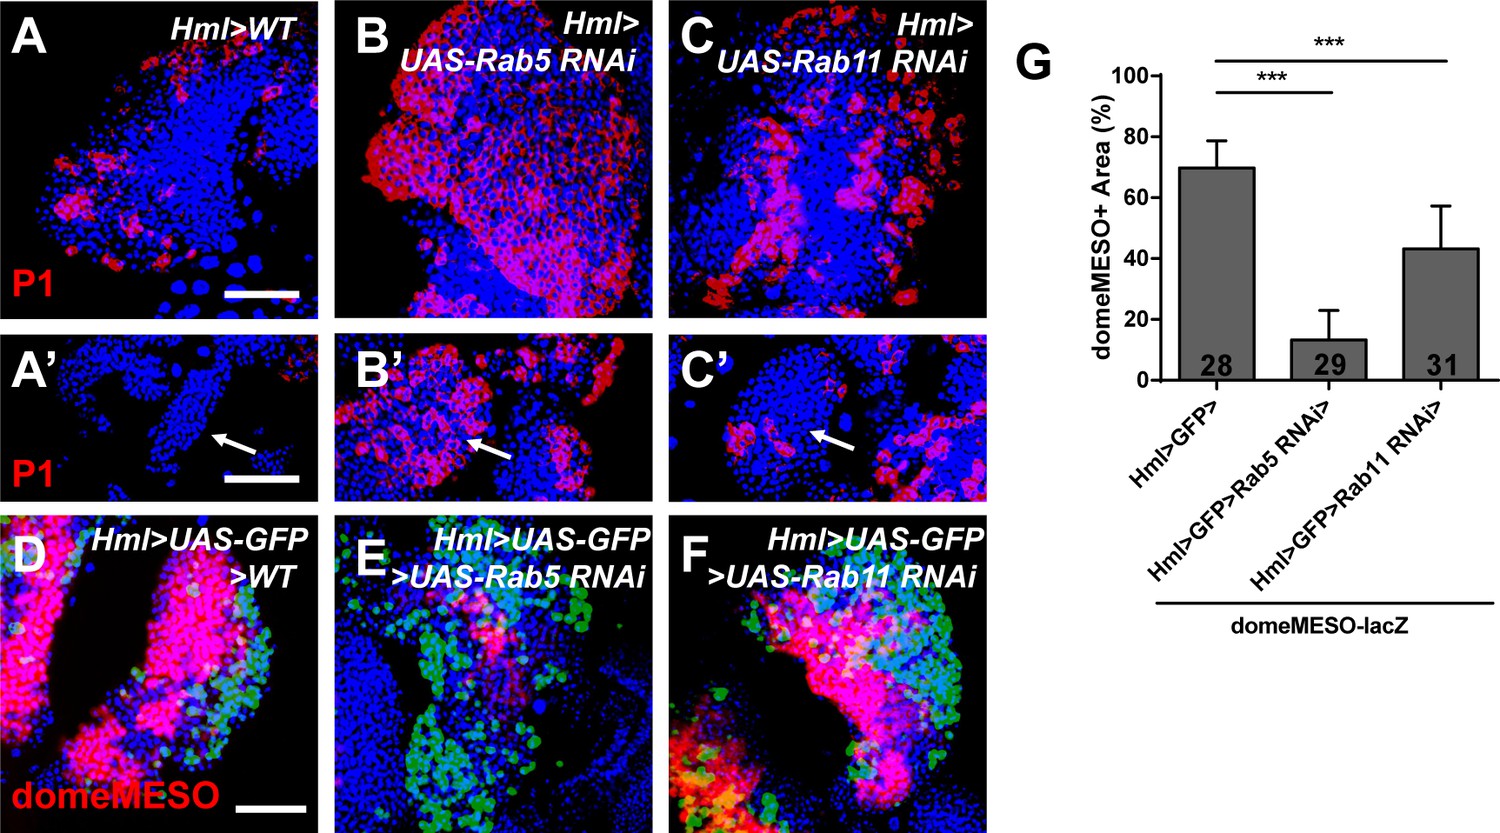
Inactivation of Rab5 or Rab11 promoted differentiation in circulating hemocytes and lymph glands.
(A–D) The percentage of the GFP-positive area in anterior lobes was increased in Hml>UAS-GFP>UAS-Rab5DN and Hml>UAS-GFP>UAS-Rab11DN lymph glands; the quantification is shown in (D). (E–G’) Immunostaining for the plasmatocyte marker P1 showed that the P1-positive area was increased upon the inactivation of Rab5 or Rab11 in both the anterior (E–G) and posterior lobes (E’–G’). (H–K) Analysis using the medullary zone (MZ) marker domeMESO-lacZ showed that the MZ area was decreased in Hml>UAS-Rab5DN and Hml>UAS-Rab11DN lymph glands. The proportion of the MZ area in the anterior lobe is shown in (K). (L–Y) Immunostaining for the lamellocyte marker L1 showed that the lamellocyte count was increased in lymph glands (L–N) and circulating hemocytes (O–Q) when Rab5 or Rab11 GTPase activity was disrupted. Aberrant lamellocyte differentiation was more severe in lymph glands (S–U) and circulating hemocytes (V–X) after the simultaneous disruption of Rab5 and Rab11. The lamellocyte frequency among total circulating hemocytes is shown in (R) and (Y). Scale bar: 50 μm. ***p<0.001 (one-way ANOVA).
Figure 2—figure supplement 1
Evaluation of the plasmatocyte count and medullary zone (MZ) area in the lymph gland after Rab5/Rab11 inactivation.
(A–C’) The plasmatocyte count was increased in the anterior (A–C) and posterior (A’–C’) lobes in lymph glands from Hml>UAS-Rab5 RNAi and Hml>UAS-Rab11 RNAi larvae, as determined by anti-P1 immunostaining. The arrows show the posterior lobes. (D–G) The MZ area was measured in Hml>UAS-GFP>domeMESO-lacZ, Hml>UAS-GFP>UAS-Rab5 RNAi>domeMESO-lacZ, and Hml>UAS-GFP>UAS-Rab11 RNAi>domeMESO-lacZ lymph glands; the quantification is shown in (G). Scale bar: 50 μm. ***p<0.001 (one-way ANOVA).
Figure 2—figure supplement 2
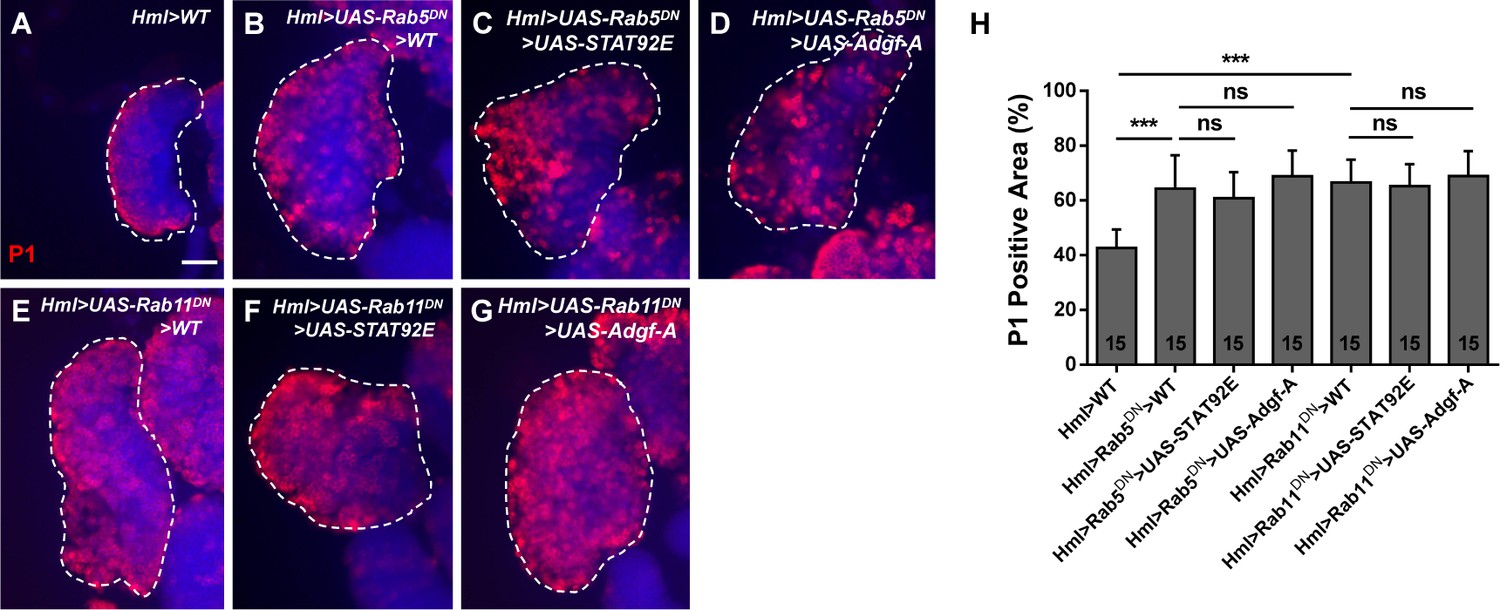
Overexpression of STAT92E or Adgf-A did not rescue the increased P1-positive area in Hml>UAS-Rab5/11DN lymph glands.
(A–H) P1 staining was performed in Hml>WT (A), Hml>UAS-Rab5/11DN>WT (B, E), Hml>UAS-Rab5/11DN>UAS-STAT92E (C, F), and Hml>UAS-Rab5/11DN>UAS-Adgf-A (D, G) lymph glands. The quantifications of the proportions of P1-positive areas are shown in (H). Scale bar: 50 μm. ns, not significant; ***p<0.001 (one-way ANOVA).
Figure 2—figure supplement 3
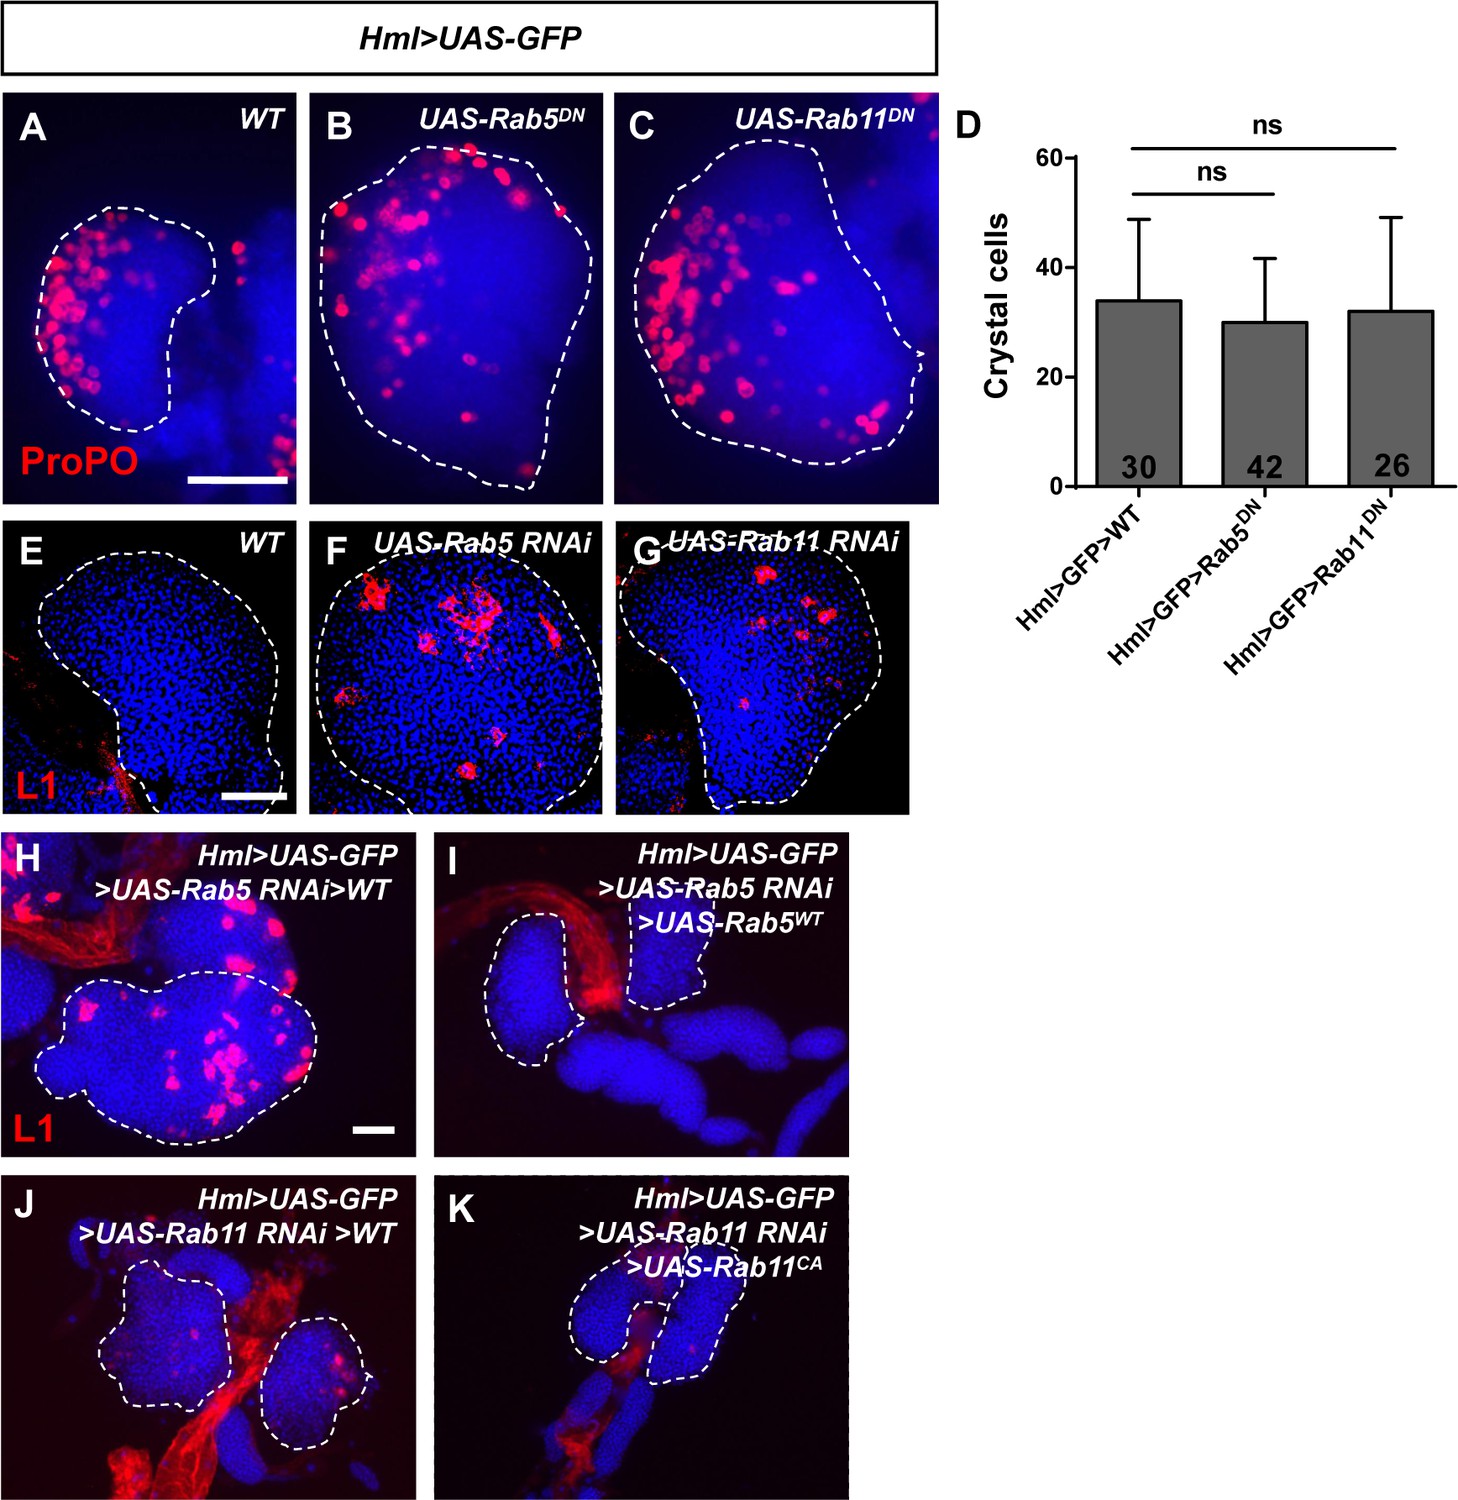
Analysis of the crystal cell count and rescue assays of lamellocyte differentiation in lymph glands.
(A–D) The crystal cell count (as evaluated by anti-ProPO staining) was unchanged in lymph glands upon the inactivation of Rab5 or Rab11. (E–G) Aberrant lamellocyte formation was observed in Hml>UAS-GFP>UAS-Rab5/11 RNAi lymph glands. (H–K) The aberrant lamellocyte differentiation was rescued in Hml>UAS-GFP>UAS-Rab5 RNAi>UAS-Rab5WT and Hml>UAS-GFP>UAS-Rab11 RNAi>UAS-Rab11CA lymph glands. ns, not significant. Scale bar: 50 μm.
Figure 2—figure supplement 4
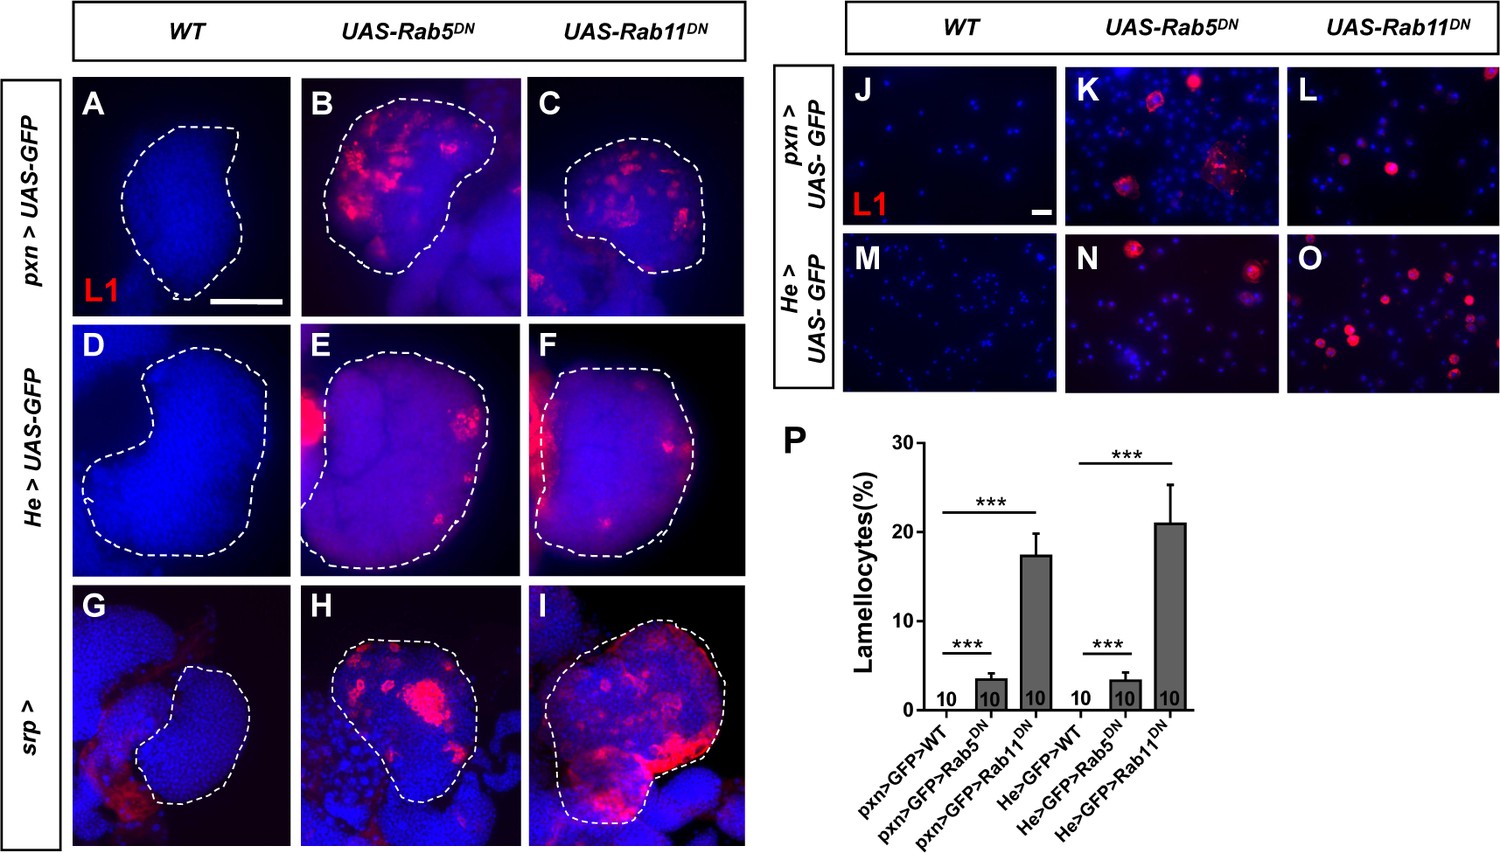
Inactivation of Rab5/Rab11 with different hemocyte-specific Gal4 drivers resulted in massive lamellocyte formation.
(A–O) Aberrant lamellocyte formation was observed in pxn>UAS-GFP>UAS-Rab5/11DN, He>UAS-GFP>UAS-Rab5/11DN, and srp>UAS-Rab5/11DN lymph glands and in pxn>UAS-GFP>UAS-Rab5/11DN and He>UAS-GFP>UAS-Rab5/11DN circulating hemocytes. (P) The lamellocyte proportions from (J–O) are shown. Scale bars: 10 μm (hemocytes) and 50 μm (lymph glands). ***p<0.001 (one-way ANOVA).
Figure 2—figure supplement 5
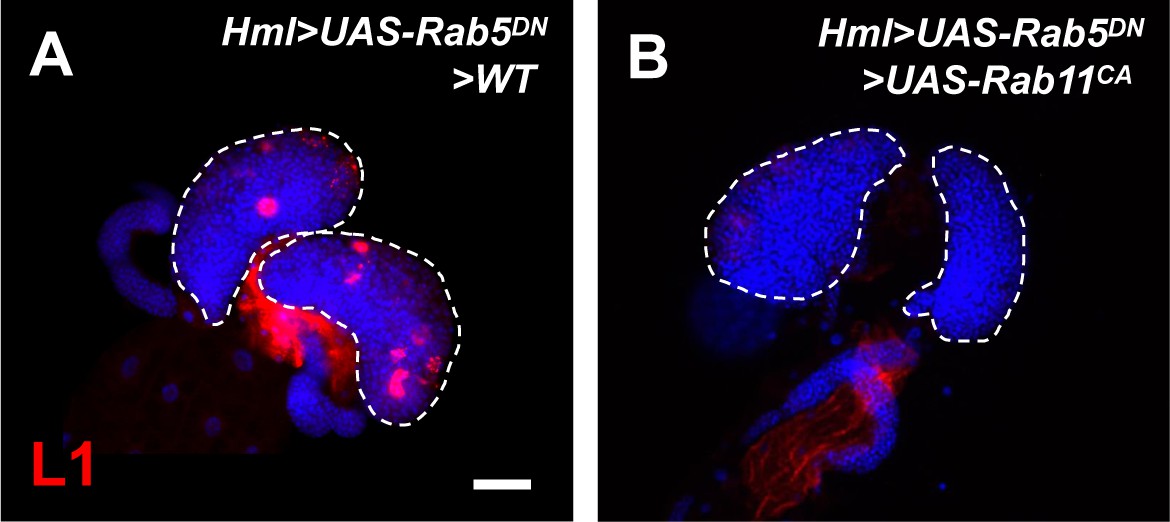
Active Rab11 GTPase activity could restore the aberrant lamellocyte differentiation in lymph glands after inhibition of Rab5.
(A and B) Immunostaining of lamellocytes was performed with anti-L1 antibodies. The increased lamellocyte count was rescued in Hml>UAS-Rab5DN>UAS-Rab11CA lymph glands. Scale bar: 50 μm.
Figure 2—figure supplement 6
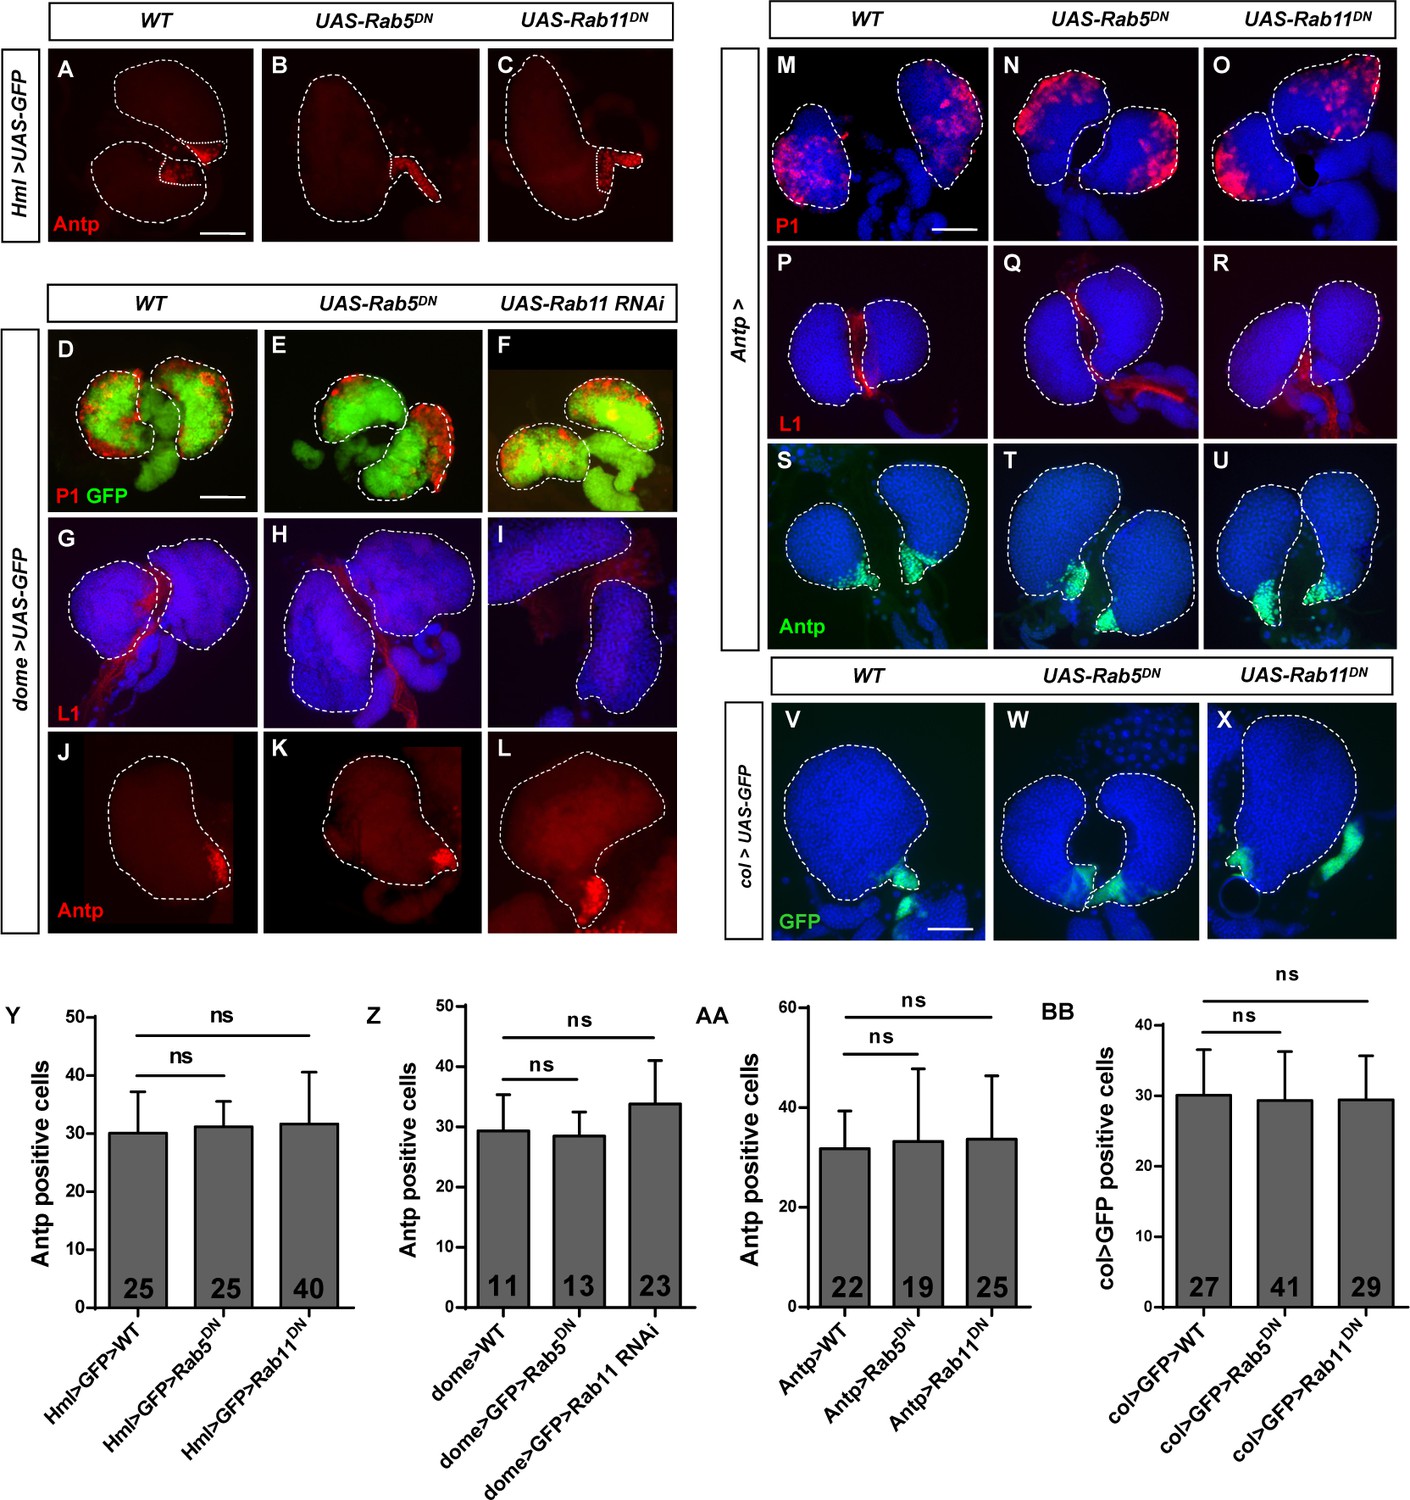
Analysis of the medullary zone (MZ) and posterior signaling center (PSC) upon the inactivation of Rab5 or Rab11.
PSC cells and the MZ were analyzed with anti-Antp antibodies or labeled with GFP after the inactivation of Rab5 or Rab11 using the Hml-Gal4 (A–C, Y), dome-Gal4 (J–L, Z), Antp-Gal4 (S–U, AA), and col-Gal4 (V–X, BB) drivers, respectively. The cortical zone (CZ) area and lamellocyte formation were determined with anti-P1 and anti-L1 antibodies after the inactivation of Rab5 or Rab11 using the dome-Gal4 (D–I) and Antp-Gal4 (M–R) drivers, respectively. Scale bar: 50 μm. ns, not significant (one-way ANOVA).
Figure 3 with 2 supplements

JNK signaling was activated upon Rab5 or Rab11 inactivation in the lymph gland.
(A–I) The JNK pathway activity was elevated in lymph glands upon Rab5 or Rab11 inactivation, as elucidated by the monitoring of JNK signaling with puc-lacZ (A–C) and anti-p-JNK antibodies (D–F). Apoptotic cells in Hml>UAS-GFP>UAS-Rab5DN and Hml>UAS-GFP>UAS-Rab11DN lymph glands were detected by TUNEL assays (G–I). (J–AA) Immunostaining for L1 (red) showed that aberrant lamellocyte differentiation was rescued in Hml>UAS-GFP>UAS-Rab5 RNAi>UAS-puc (Q), Hml>UAS-GFP>UAS-Rab11 RNAi>UAS-puc (W), Hml>UAS-GFP>UAS-Rab5 RNAi>UAS-bsk RNAi (R), Hml>UAS-GFP>UAS-Rab11 RNAi>UAS-bsk RNAi (X), and Hml>UAS-GFP>UAS-Rab5 RNAi>UAS-hep RNAi (S) lymph glands. The quantifications for (J–AA) are shown in BB. Scale bar: 50 μm. ns, not significant; ***p<0.001 (one-way ANOVA).
Figure 3—figure supplement 1
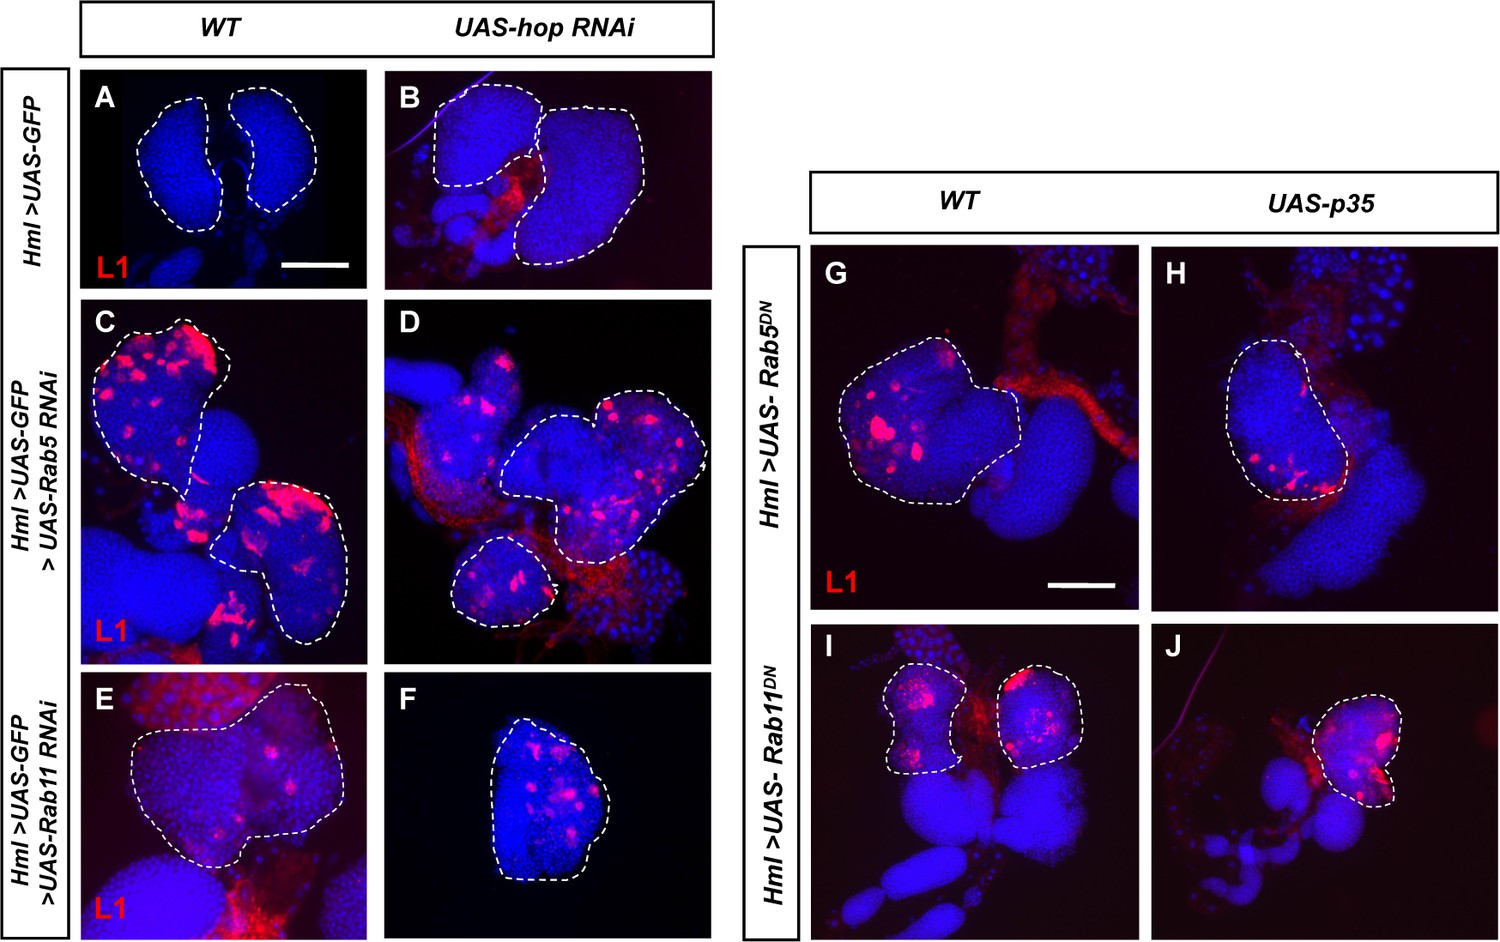
Knocking down hop or blocking apoptosis did not repress aberrant lamellocyte differentiation.
Knocking down hop (A–F) or overexpressing UAS-p35 (G–J) failed to repress the aberrant lamellocyte differentiation in Hml>UAS-GFP>UAS-Rab5/11 RNAi or Hml>UAS-Rab5/11DN lymph glands. Scale bar: 50 μm.
Figure 3—figure supplement 2
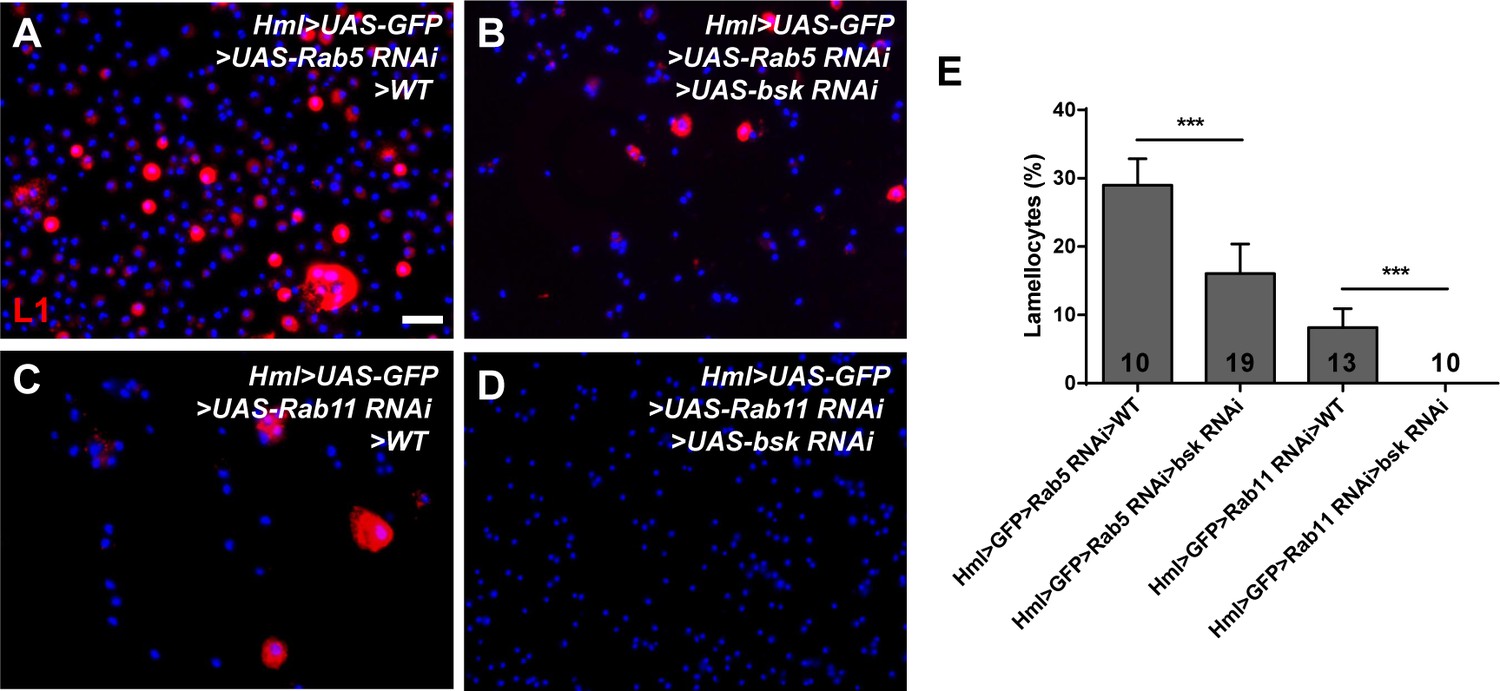
Knocking down bsk repressed aberrant lamellocyte differentiation in circulating hemocytes.
(A–D) Knocking down bsk repressed the aberrant lamellocyte differentiation in Hml>UAS-Rab5/11 RNAi circulating hemocytes. Quantification of the lamellocyte count is shown in (E). Scale bar: 20 μm. ***p<0.001 (one-way ANOVA).
Figure 4 with 2 supplements
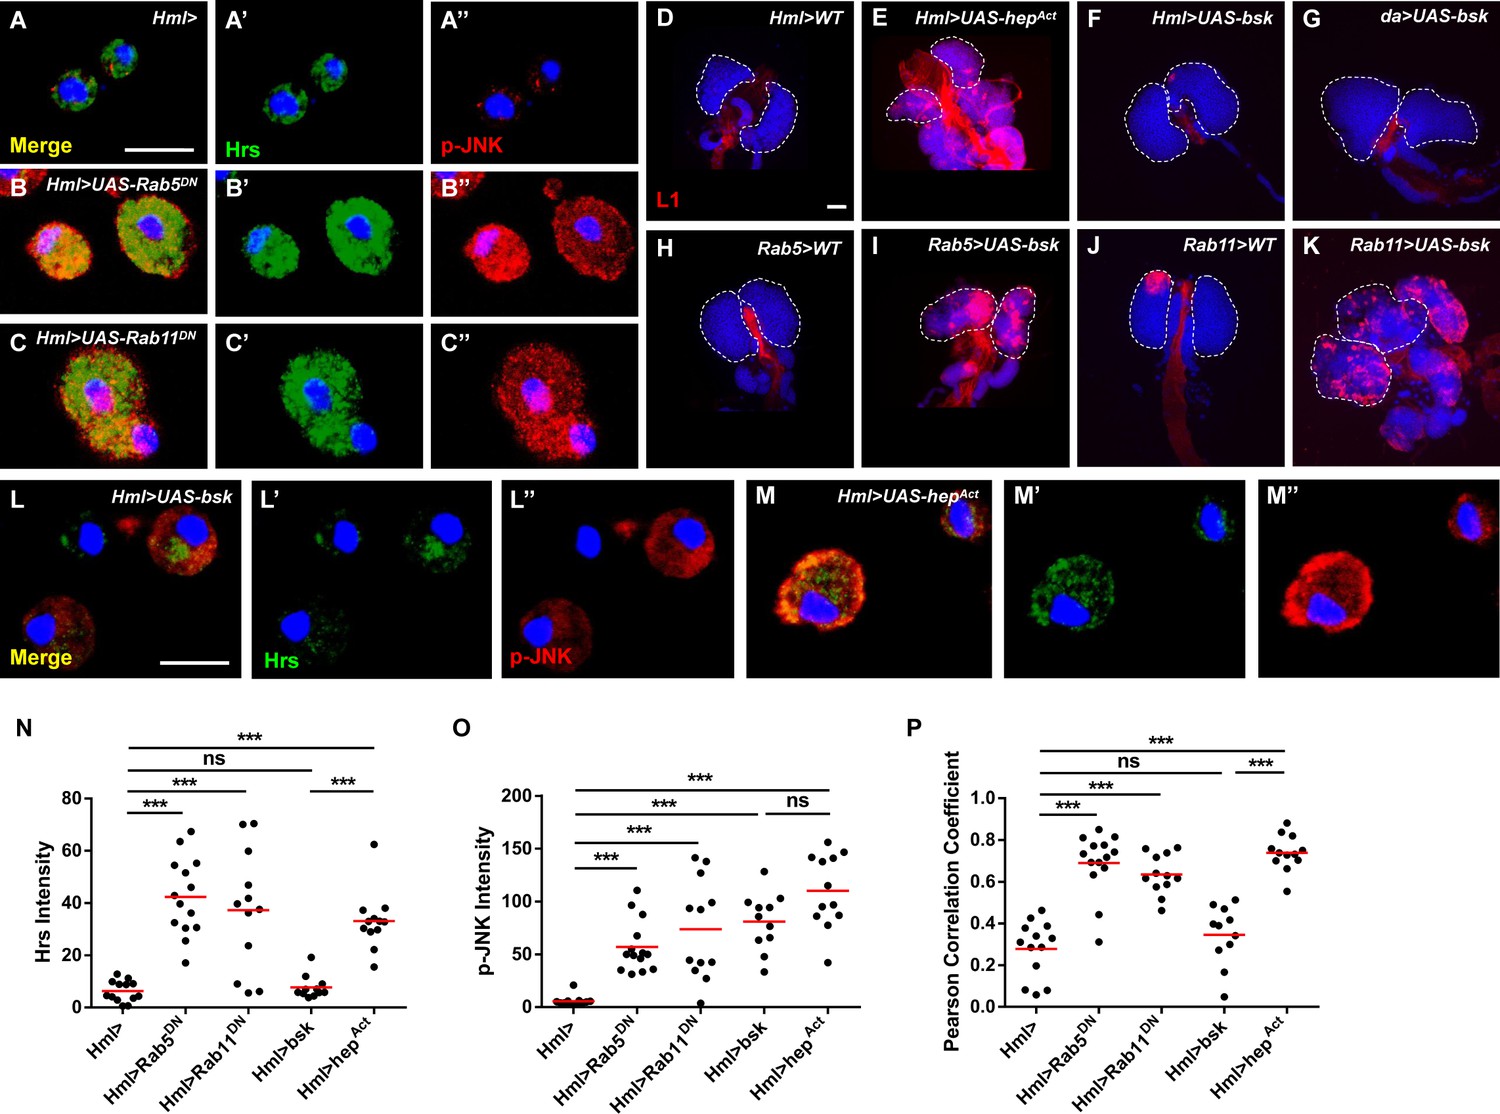
Inhibiting Rab5 or Rab11 induced high p-JNK levels in endosomes.
(A–C’’) An increased degree of Hrs (green) and p-JNK (red) colocalization was observed in Hml>UAS-Rab5DN and Hml>UAS-Rab11DN hemocytes. Merged images (Hrs+p-JNK+DAPI) are displayed in (A–C). (D–K) Massive lamellocyte formation was observed in lymph glands from Hml>UAS-hepAct (E), Rab5>UAS-bsk (I), and Rab11>UAS-bsk (K) larvae. (L–M’’) Hml>UAS-hepAct hemocytes exhibited more Hrs (green) and p-JNK (red) colocalization than Hml>UAS-bsk hemocytes. The Hrs and p-JNK levels are shown in (N) and (O), respectively. (P) The colocalization degree between Hrs and p-JNK is displayed as the Pearson correlation coefficient, which was analyzed with the Colocalization Finder plugin from ImageJ. Scale bars: 50 μm (lymph glands) and 10 μm (hemocytes). ns, not significant; ***p<0.001 (one-way ANOVA).
Figure 4—figure supplement 1
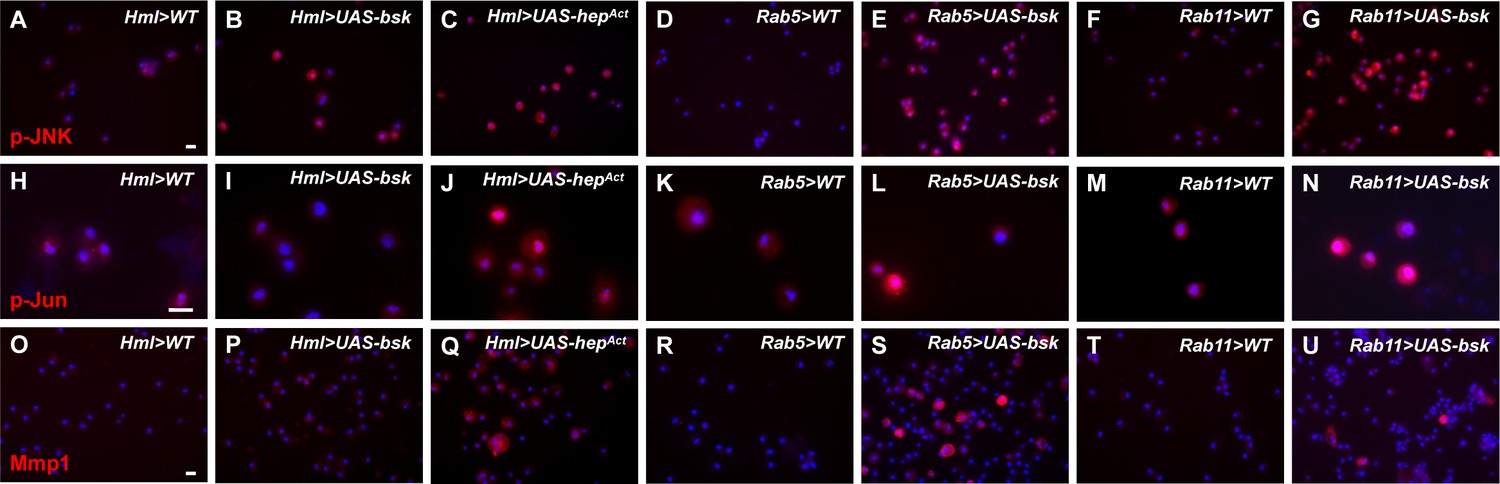
Analysis of the p-JNK, p-Jun, and Mmp1 levels in circulating hemocytes.
(A–U) Circulating hemocytes were stained with antibodies against p-JNK (A–G), p-Jun (H–N), and Mmp1 (O–U). Hml>UAS-hepAct, Rab5>UAS-bsk, and Rab11>UAS-bsk hemocytes showed elevated levels of p-JNK, p-Jun, and Mmp1, whereas only the p-JNK levels and not the p-Jun and Mmp1 levels were increased in Hml>UAS-bsk hemocytes. Scale bar: 10 μm.
Figure 4—figure supplement 2
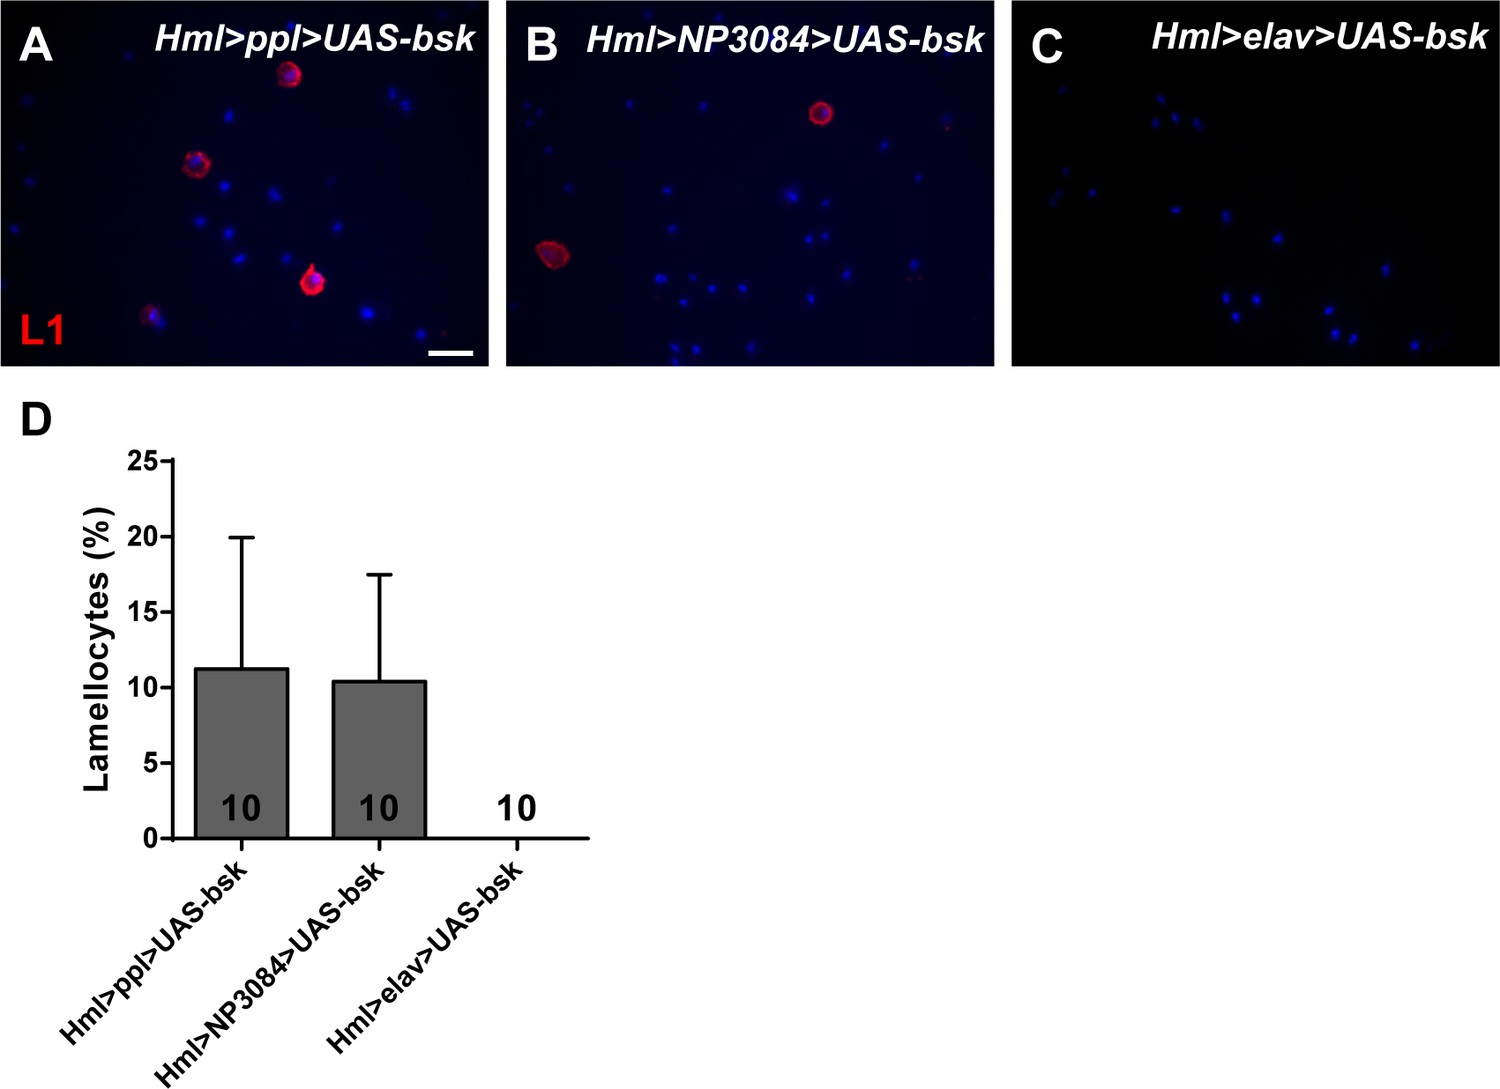
Overexpression of bsk in hemocytes and fat bodies or in hemocytes and the midgut simultaneously induced lamellocyte formation.
(A–D) Hemocytes from Hml>ppl>UAS-bsk, Hml>NP3084>UAS-bsk, and Hml>elav>UAS-bsk larvae were stained with anti-L1 antibodies. The lamellocyte frequency in circulating hemocytes is shown in (D). Scale bar: 20 μm.
Figure 5
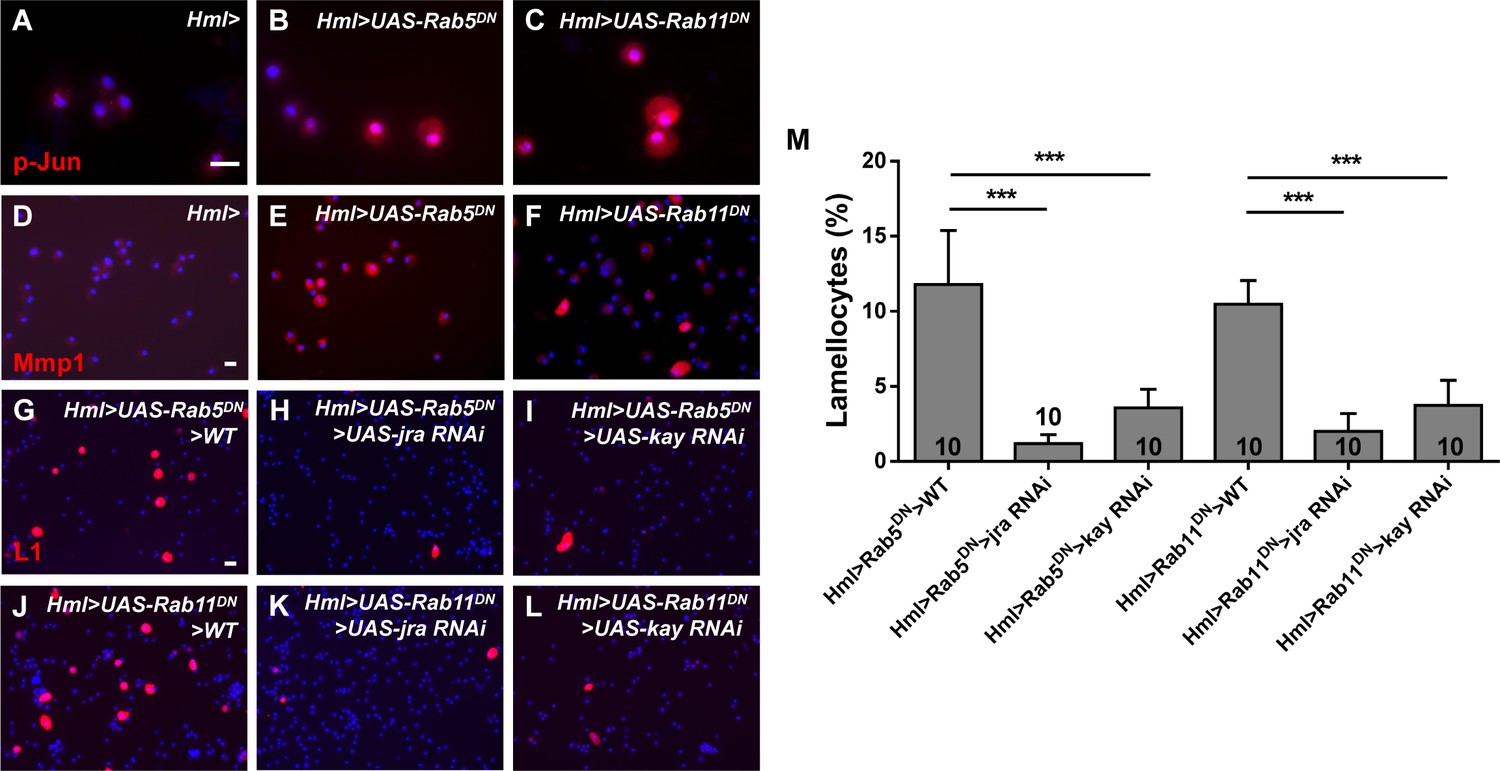
Inhibiting Rab5 or Rab11 in hemocytes increased the p-Jun and Mmp1 levels.
(A–F) Immunostaining of circulating hemocytes showed that the levels of p-Jun (A–C) and Mmp1 (D–F) were increased after the inactivation of Rab5 or Rab11. (G–M) The lamellocyte frequency, as analyzed by anti-L1 staining, was rescued in Hml>UAS-Rab5DN>UAS-jra/kay RNAi and Hml>UAS-Rab11DN>UAS-jra/kay RNAi circulating hemocytes. The percentage of L1-positive cells among total circulating hemocytes from (G–L) is shown in (M). Scale bar: 10 μm. ***p<0.001 (Student’s t-test).
Figure 6 with 1 supplement
Ras/EGFR signaling was enhanced upon Rab5 or Rab11 inactivation.
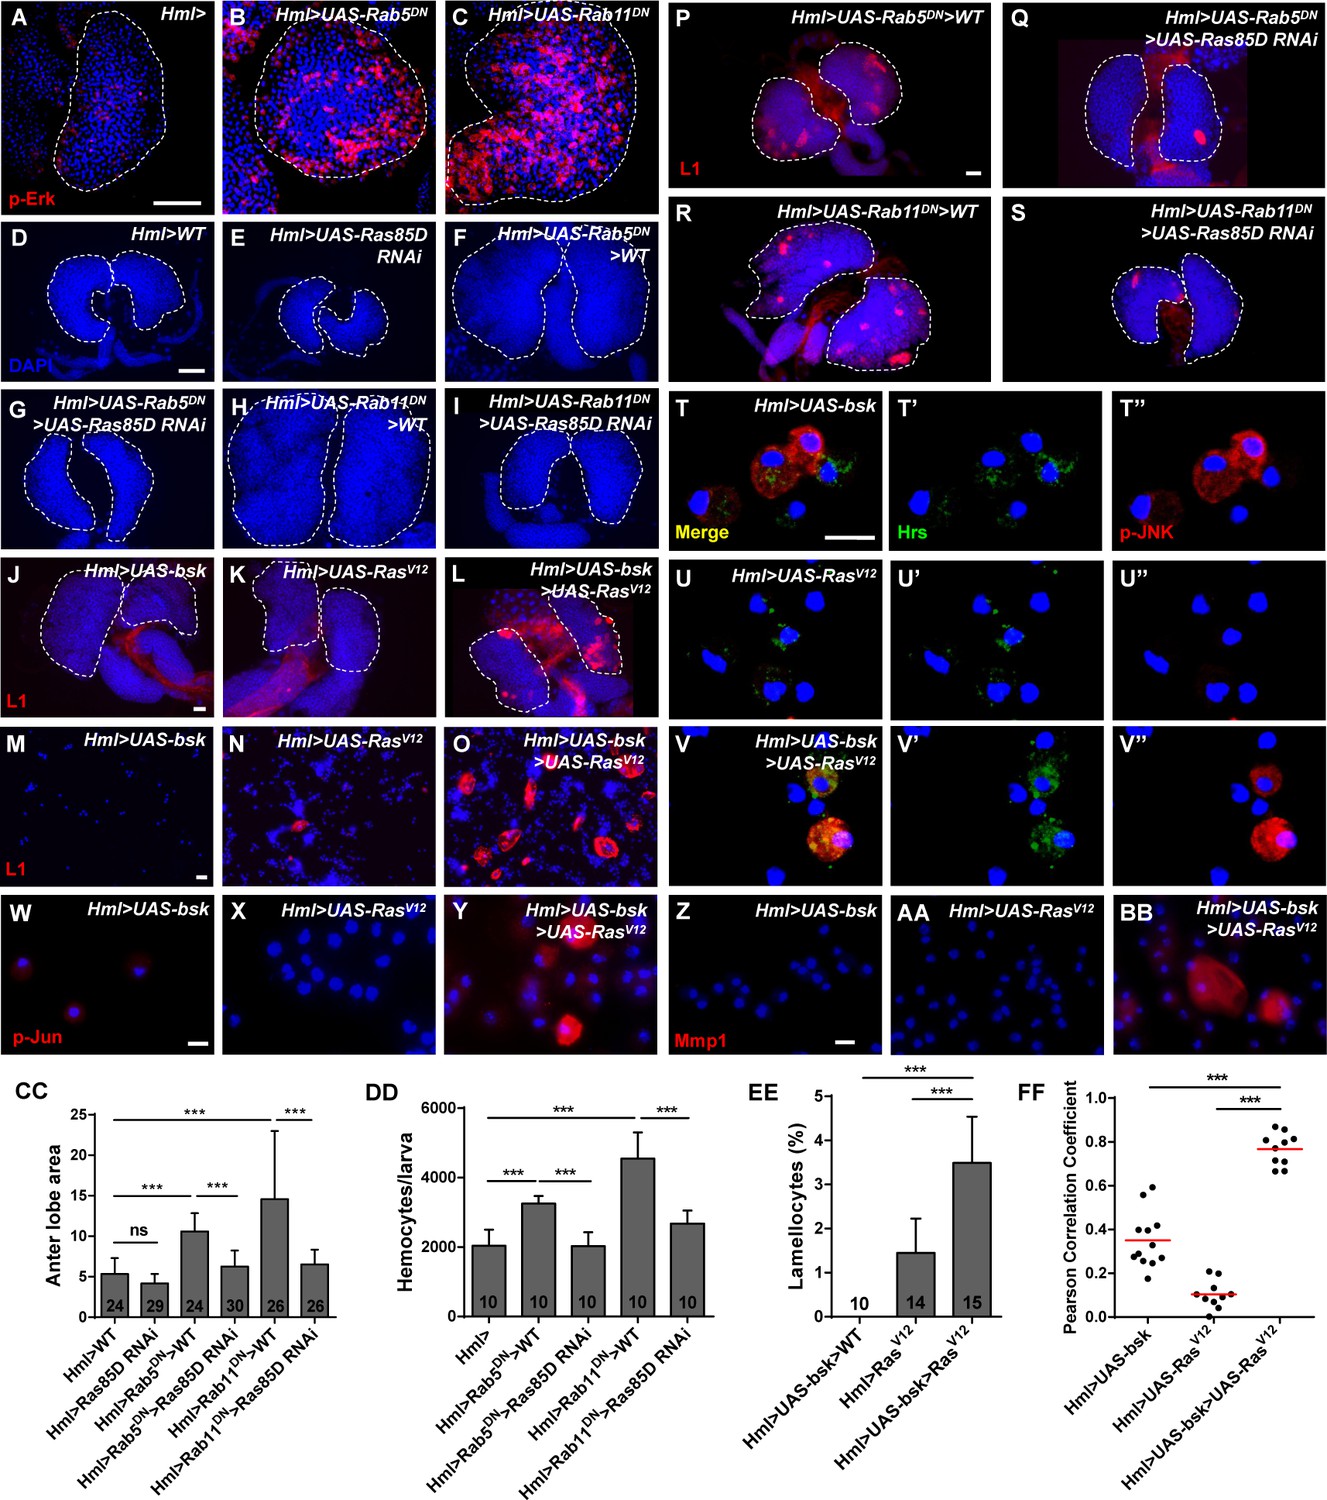
(A–C) Immunostaining of lymph glands showed high p-Erk (red) signals upon Rab5 or Rab11 inactivation. (D–I) Anterior lobe enlargement (visualized by DAPI staining) in Hml>UAS-Rab5/11DN lymph glands was rescued after knockdown of Ras85D. (CC) Quantification of the anterior lobe area from (D–I). (J–O) The lamellocyte count was increased in lymph glands (J–L) and circulating hemocytes (M–O) when bsk and Ras were simultaneously overexpressed in the cortical zone (CZ). (EE) The lamellocyte frequency in circulating hemocytes from (M–O). (P–S) The increased lamellocyte count in lymph glands after Rab5 or Rab11 inactivation was rescued by the knockdown of Ras levels using UAS-Ras85D RNAi. (T–BB) Colocalization between Hrs (green) and p-JNK (red) (T–V’’) and p-Jun and Mmp1 (W–BB) was increased in Hml>UAS-bsk>UAS-RasV12 hemocytes compared with control hemocytes. The colocalization degrees are shown in (FF). (DD) Quantification of the circulating hemocyte counts in third instar larvae showed that the increased hemocyte count in Hml>UAS-Rab5/11DN larvae was rescued by the downregulation of Ras85D. Scale bars: 50 μm (lymph glands) and 10 μm (hemocytes). ns, not significant; ***p<0.001 (one-way ANOVA).
Figure 6—figure supplement 1
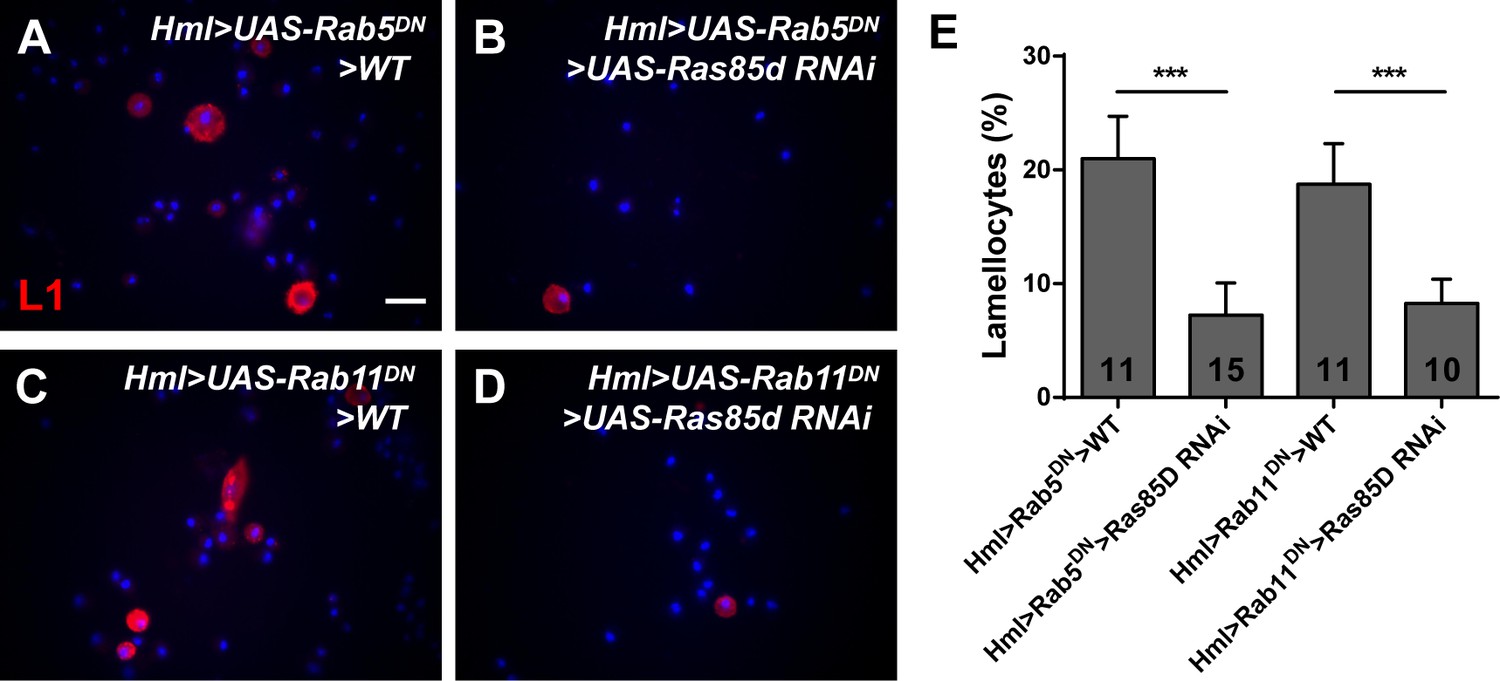
Knocking down Ras85D restored the aberrant lamellocyte differentiation in circulating hemocytes.
(A–D) Knocking down Ras85D repressed the aberrant lamellocyte differentiation in Hml>UAS-Rab5/11DN circulating hemocytes. (E) The lamellocyte frequency in circulating hemocytes. Scale bar: 20 μm. ***p<0.001 (one-way ANOVA).
Figure 7 with 1 supplement
The Toll pathway was activated upon Rab5 or Rab11 inactivation.
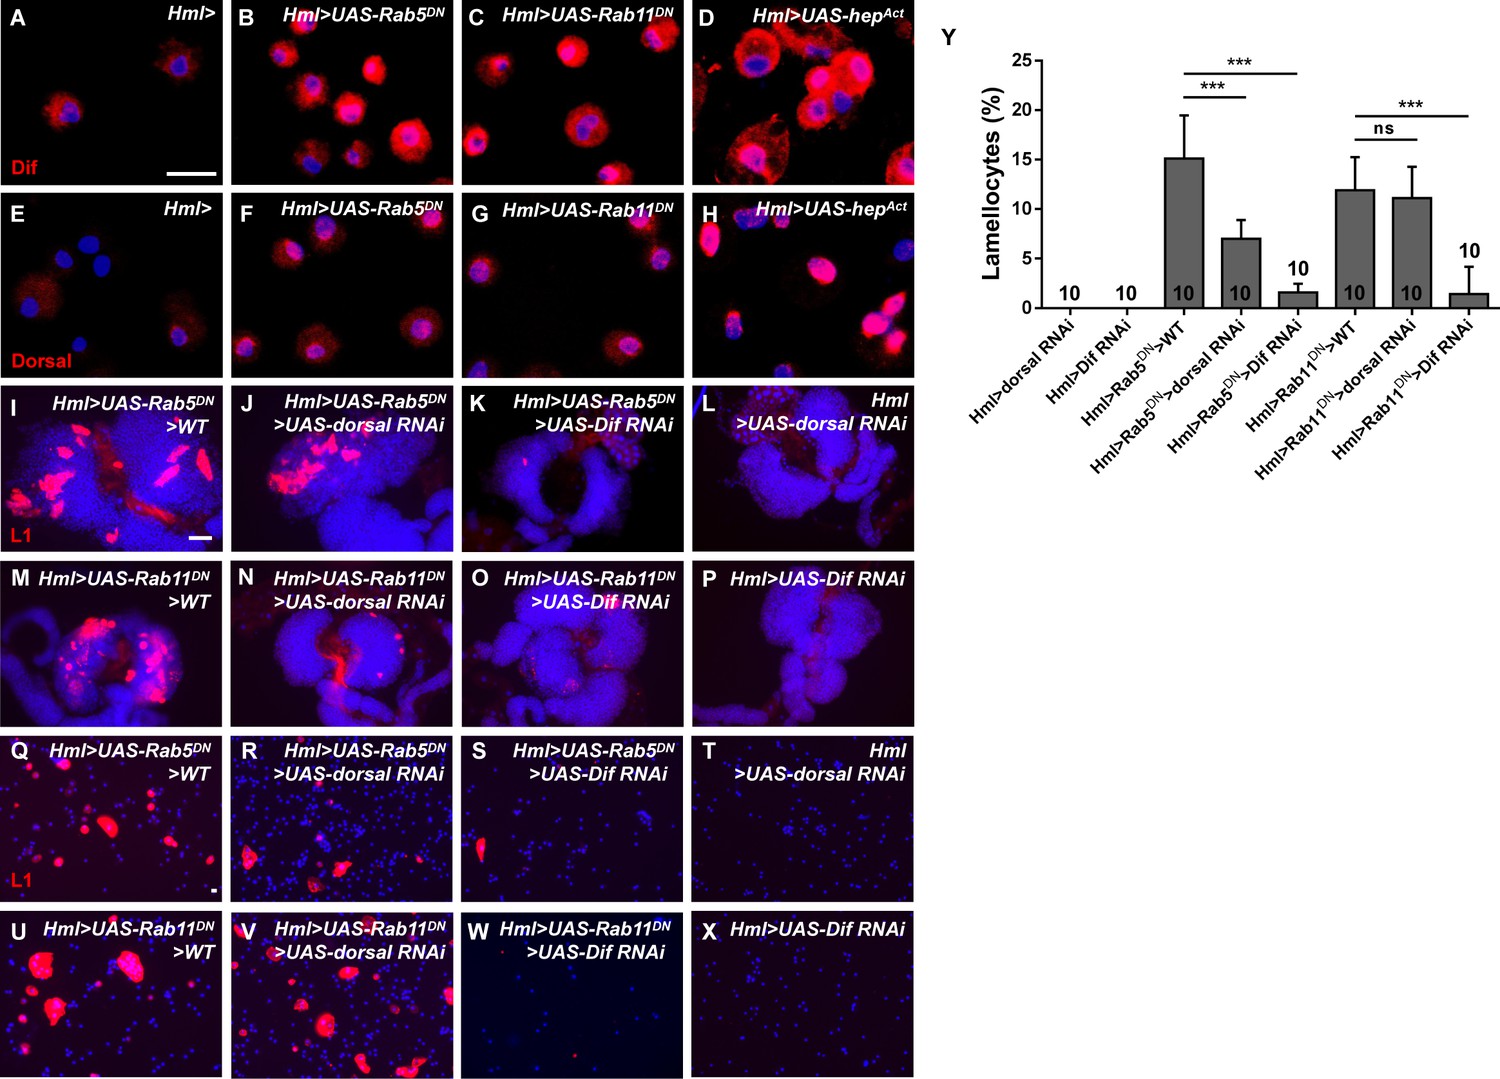
(A–H) Immunostaining of circulating hemocytes showed that Dif and Dorsal were activated in Hml>UAS-Rab5/11DN (B–C, F–G) and Hml>UAS-hepAct (D, H) hemocytes. (I–X) Detection of lamellocyte formation in hemocytes and lymph glands using anti-L1 antibodies (red) showed that UAS-Dif RNAi but not UAS-dorsal RNAi plays a significant role in restricting aberrant lamellocyte differentiation. The percentage of lamellocytes among circulating hemocytes is shown in (Y). Scale bars: 10 μm (hemocytes) and 50 μm (lymph glands). ns, not significant; ***p<0.001 (one-way ANONA).
Figure 7—figure supplement 1
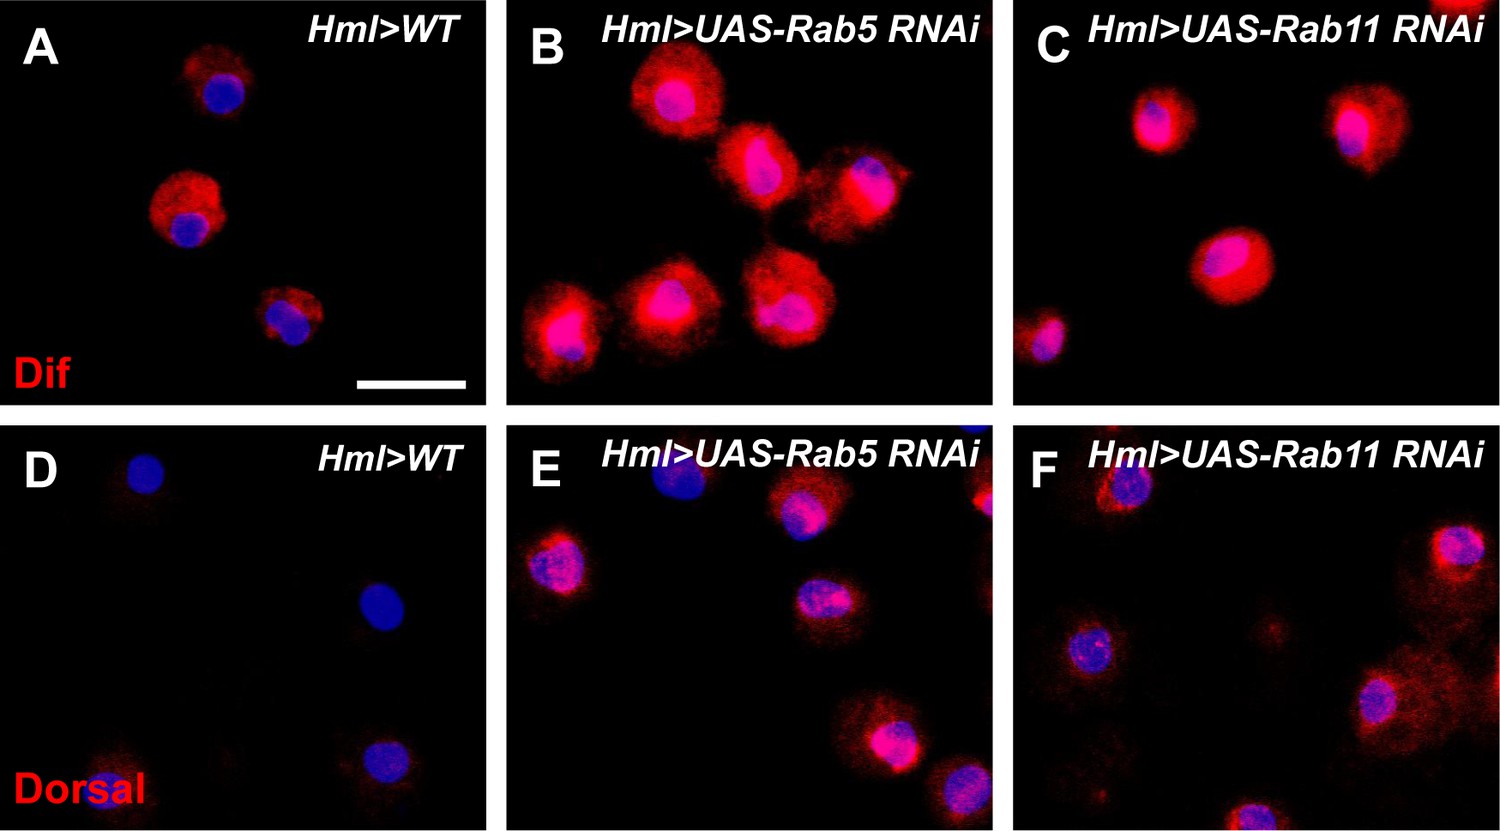
The Toll signaling pathway was activated upon the loss of Rab5 or Rab11.
The Dif (A–C) and Dorsal (D–F) levels were analyzed with immunostaining and found to be elevated in Hml>UAS-Rab5 RNAi and Hml>UAS-Rab11 RNAi hemocytes. Scale bar: 10 μm.
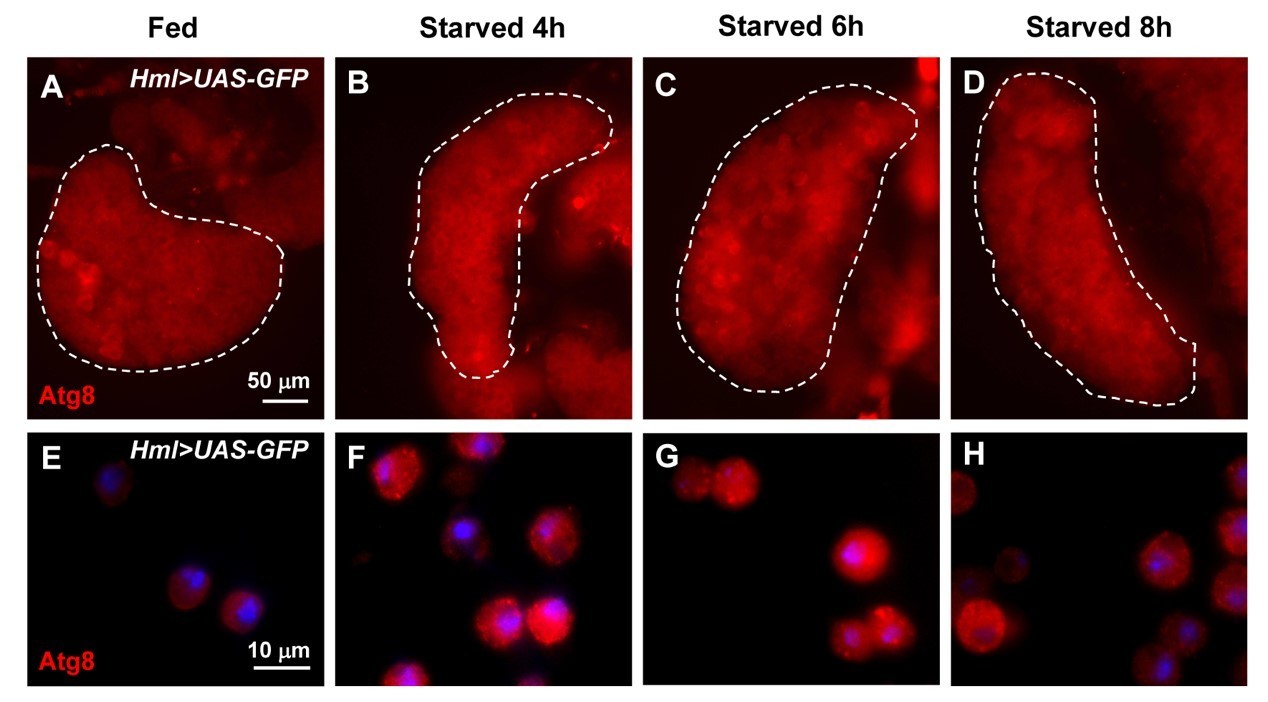
Figure 8 with 2 supplements
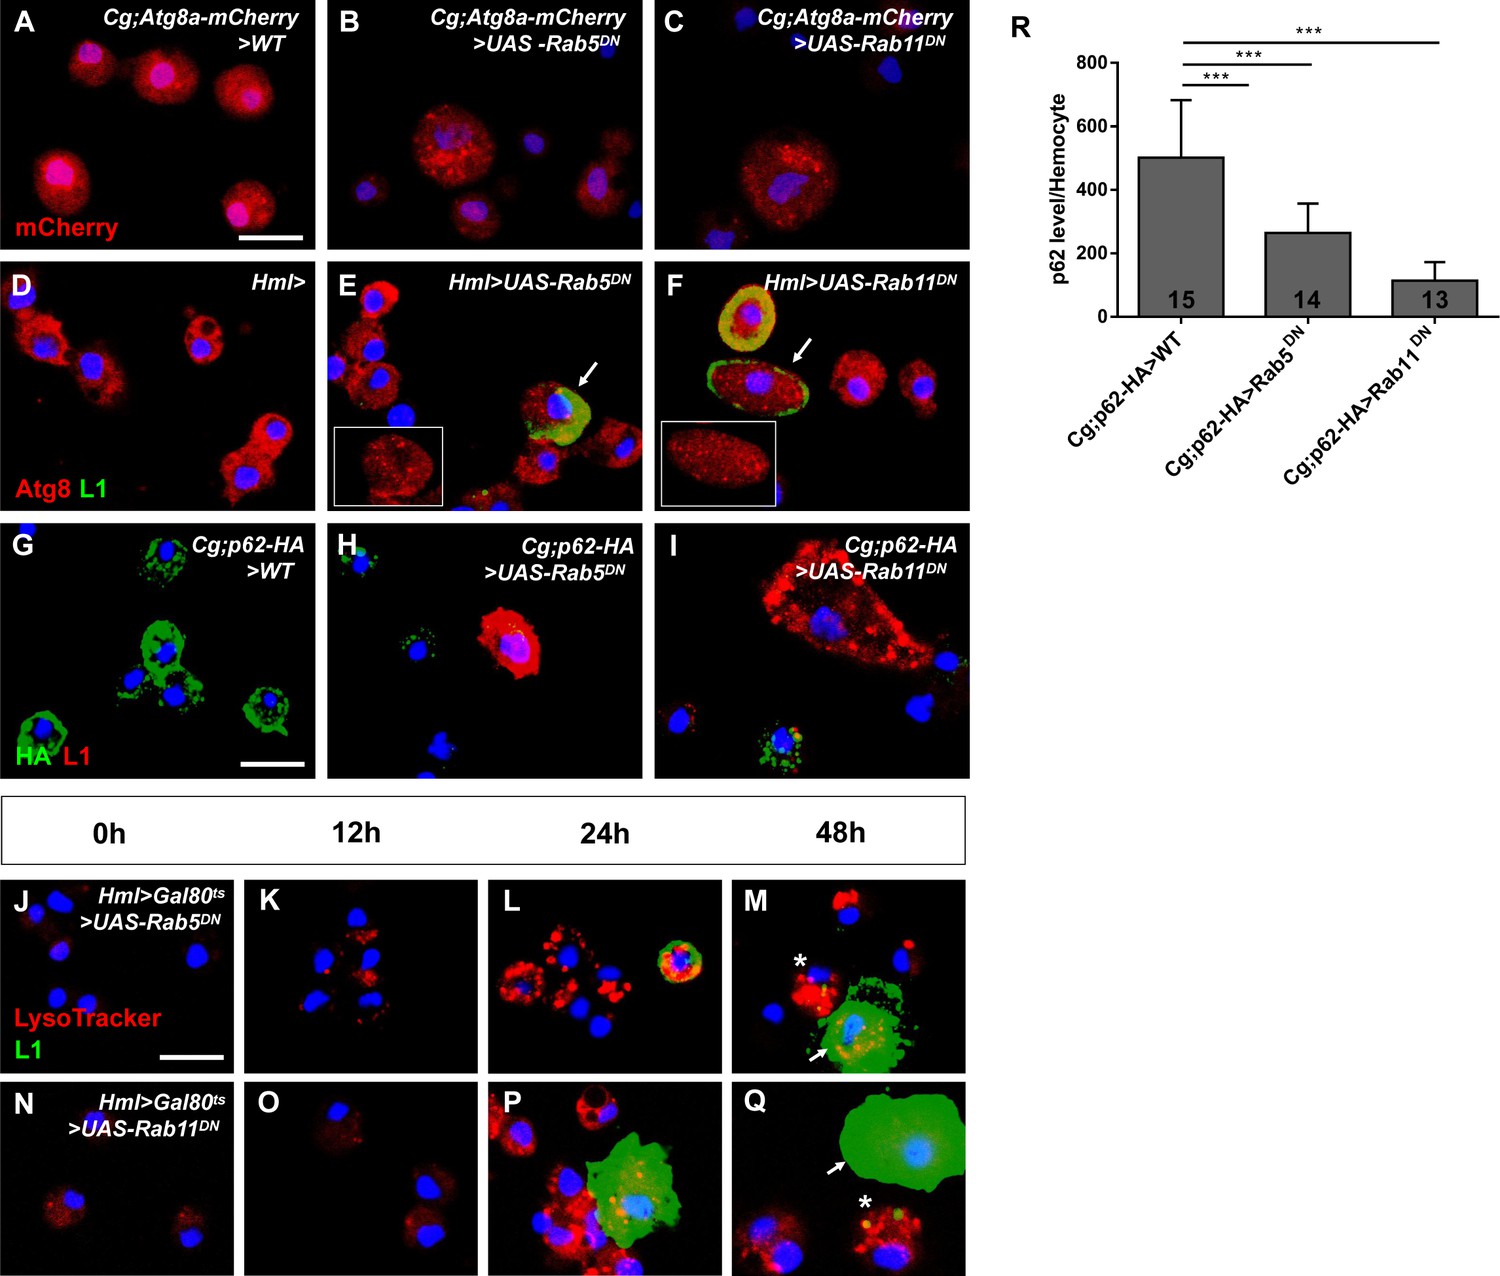
Loss of Rab5 or Rab11 activated autophagy in hemocytes.
(A–C) Many autophagosomes were observed in Cg;Atg8a-mCherry>UAS-Rab5DN and Cg;Atg8a-mCherry>UAS-Rab11DN hemocytes. (D–I) Circulating hemocytes of Hml-Gal4, Hml>UAS-Rab5DN, and Hml>UAS-Rab11DN larvae were labeled with anti-Atg8 (red) and anti-L1 (green) antibodies, whereas those of Cg;p62-HA>WT, Cg;p62-HA>UAS-Rab5DN, and Cg;p62-HA>UAS-Rab11DN were labeled with anti-HA (green) and anti-L1 (red) antibodies (G–I). The arrows in (E and F) indicate lamellocytes with large numbers of autophagosomes. The average p62 levels per hemocyte as measured by evaluating HA fluorescence are shown in (R). (J–Q) The LysoTracker intensity (red) and lamellocyte differentiation (green) were examined in circulating hemocytes from Hml>Gal80ts>UAS-Rab5DN and Hml>Gal80ts>UAS-Rab11DN larvae after being shifted to 29°C for 0 hr, 12 hr, 24 hr, and 48 hr. In (M) and (Q), the asterisks indicate ‘intermediates’, and the arrows indicate ‘mature lamellocytes’. Scale bar: 10 μm. ***p<0.001 (one-way ANOVA).
Figure 8—figure supplement 1
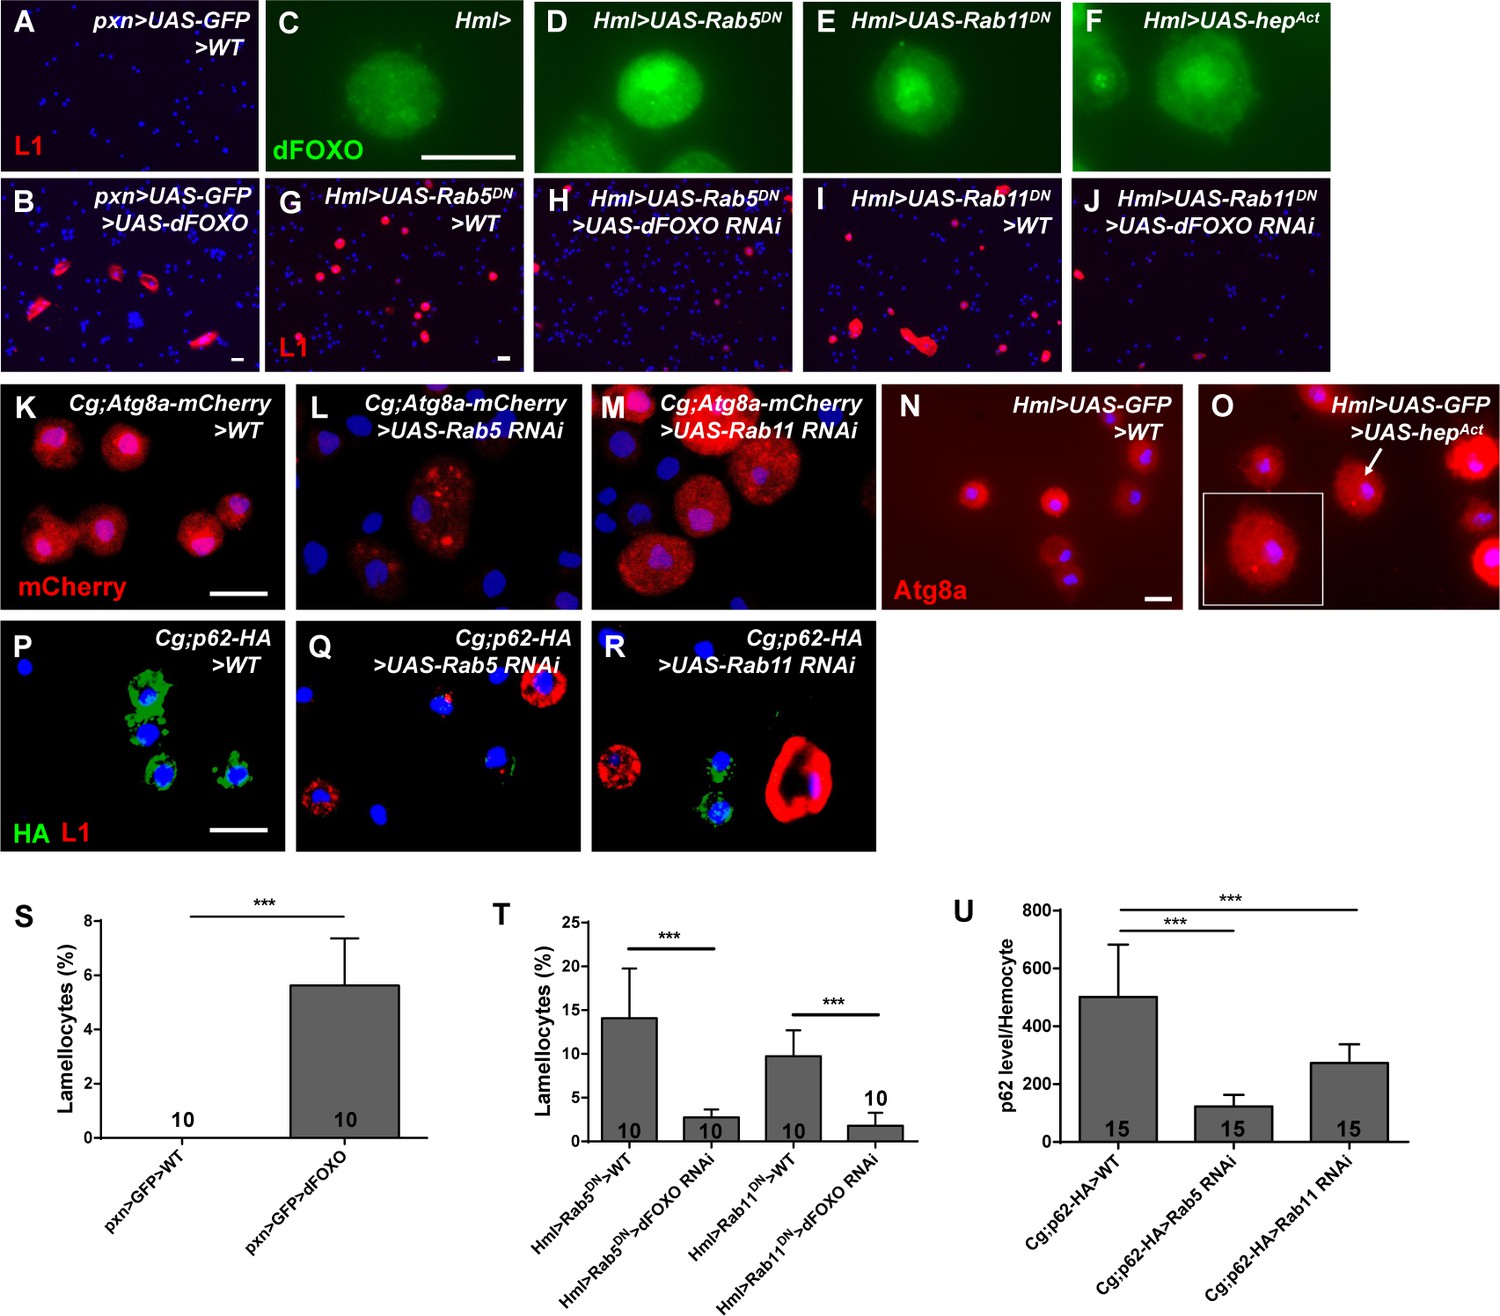
The dFOXO levels and autophagy activity were enhanced after the inactivation of Rab5 or Rab11 in hemocytes.
(A and B) Overexpression of dFOXO in hemocytes using pxn>GFP induced lamellocyte formation. (C–F) The dFOXO (green) levels were increased in circulating hemocytes from Hml>UAS-Rab5DN, Hml>UAS-Rab11DN, and Hml>UAS-hepAct larvae. (G–J) Rescue assays were performed with anti-L1 antibodies in lymph glands. Knockdown of dFOXO rescued the lamellocyte count among Hml>UAS-Rab5/11DN circulating hemocytes. The lamellocyte fraction is shown in (S and T). Autophagosomes were formed in Cg;Atg8a-mCherry>UAS-Rab5/11 RNAi hemocytes, as shown by mCherry fluorescence (K–M), and in Hml>UAS-GFP>UAS-hepAct hemocytes, as analyzed with anti-Atg8 antibodies (N and O). The arrow indicates cells with autophagosomes. (P–R) Cg;p62-HA>WT, Cg;p62-HA>UAS-Rab5 RNAi, and Cg;p62-HA>UAS-Rab11 RNAi hemocytes were labeled with anti-HA (green) and anti-L1 (red) antibodies. The average p62 levels per hemocyte were measured by HA fluorescence and are shown in (U). Scale bar: 10 μm. ***p<0.001 (Student’s t-test for [S and T]; one-way ANOVA for [U]).
Figure 8—figure supplement 2
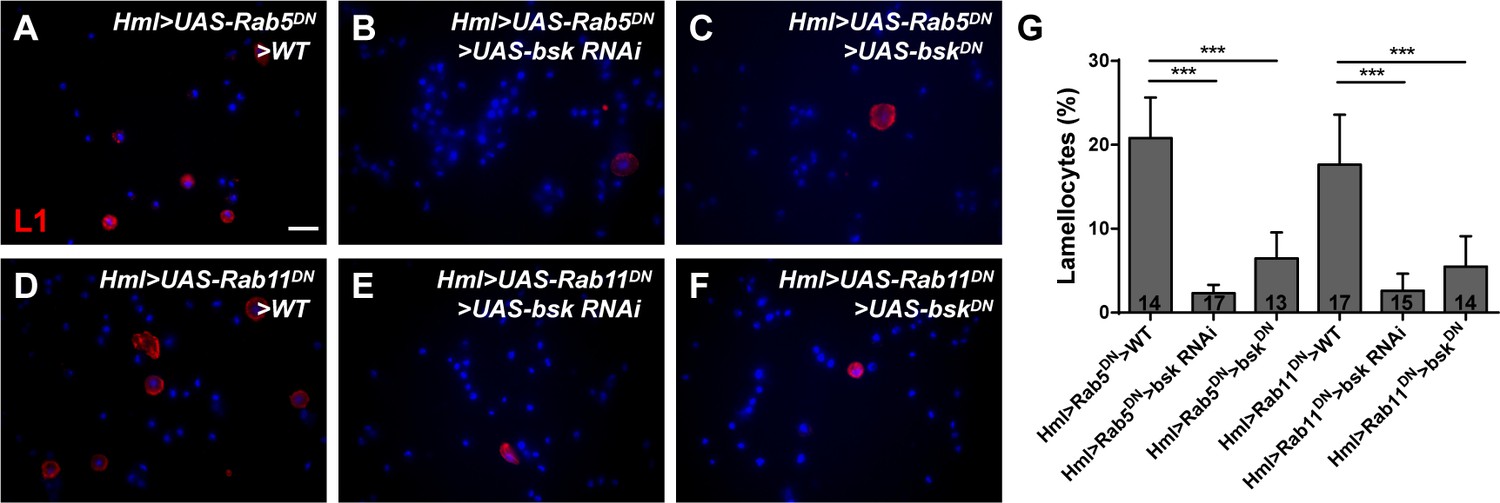
Repressing JNK signaling restored the increased lamellocyte count in Hml>UAS-Rab5/11DN larvae.
(A–F) The increased lamellocyte counts were restored in Hml>UAS-Rab5/11DN>UAS-bsk RNAi (B, E) and Hml>UAS-Rab5/11DN>UAS-bskDN (C, F) circulating hemocytes. The quantification of lamellocytes is shown in (G). Scale bar: 20 μm. ***p<0.001 (one-way ANOVA).
Figure 9
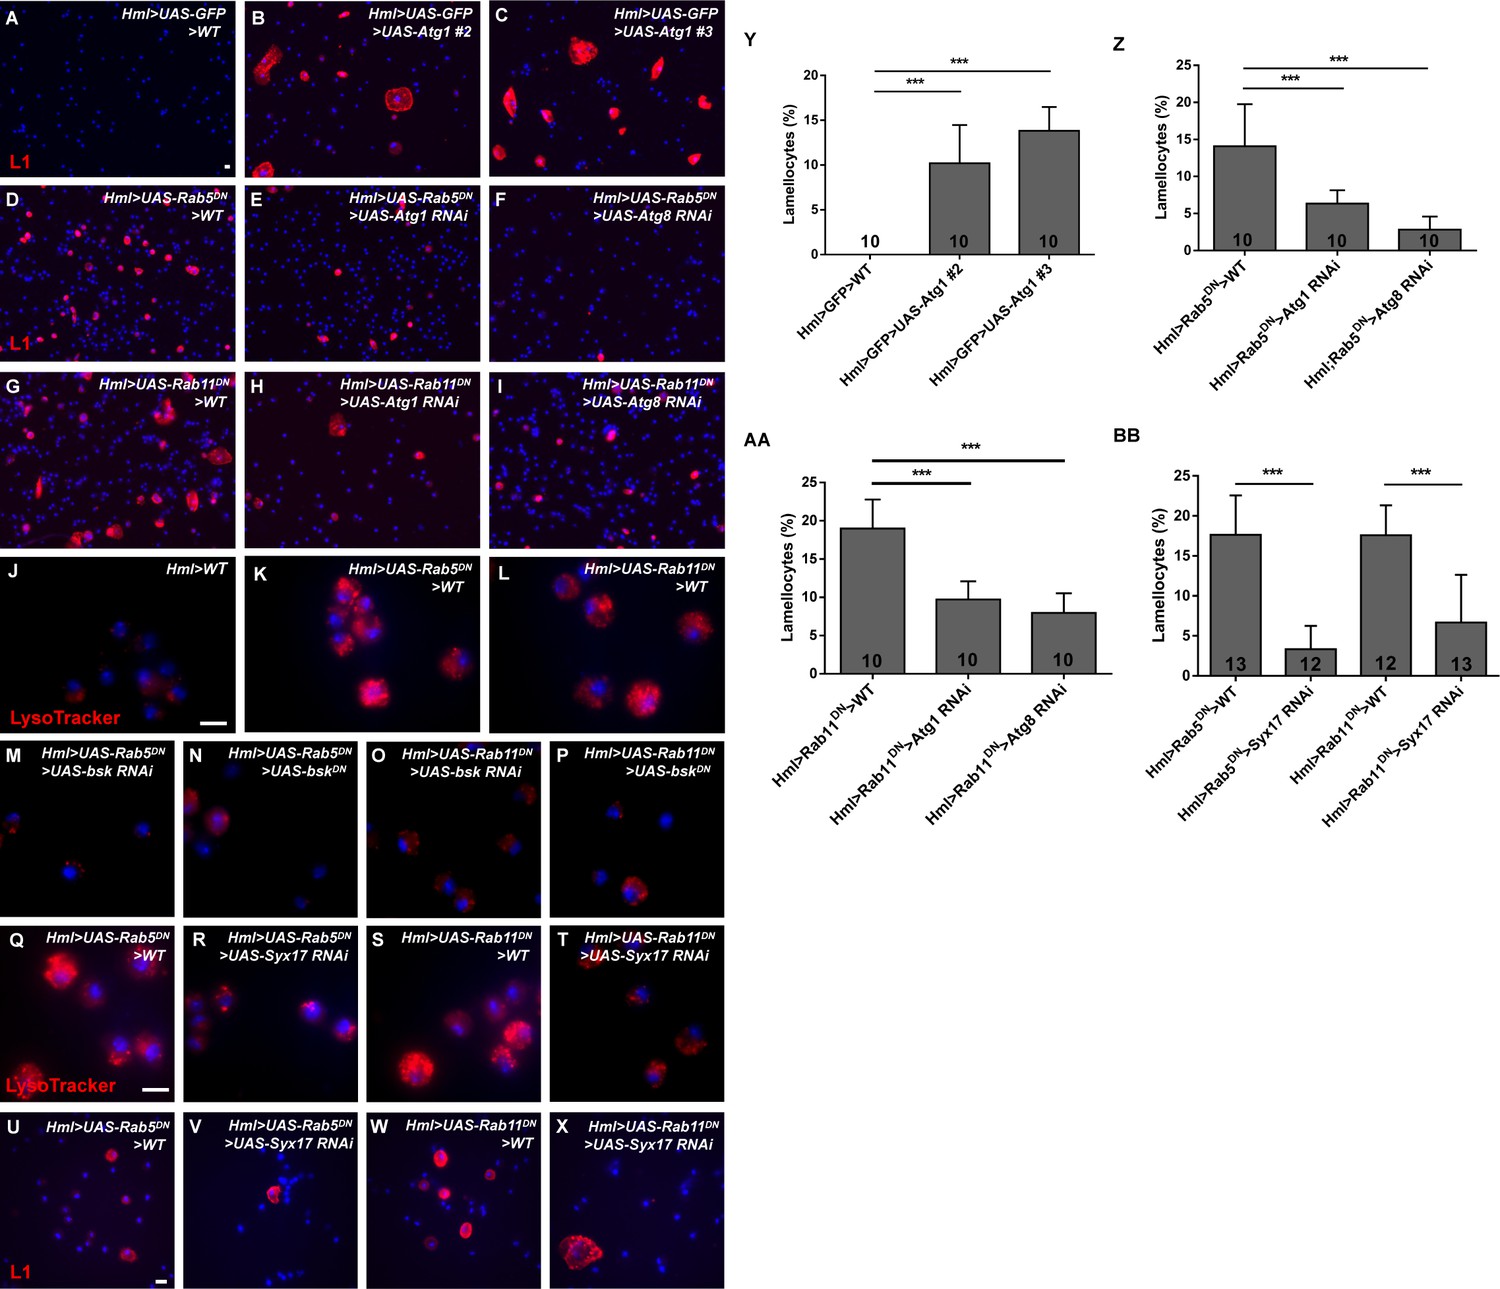
The lamellocyte formation upon the loss of Rab5 or Rab11 was autophagy-dependent.
(A–I, U–X) The lamellocyte count was determined in circulating hemocytes by anti-L1 immunostaining. Overexpression of Atg1 in two sources of UAS-Atg1 flies resulted in massive lamellocyte production (A–C). In addition, knocking down Atg1 (E, H), Atg8 (F, I), or Syx17 (V, X) in Hml>UAS-Rab5/11DN larvae suppressed the increase in the lamellocyte count. (Y–BB) The lamellocyte numbers were quantified. (J–T) LysoTracker staining in circulating hemocytes showed that the increased LysoTracker intensity was suppressed in Hml>UAS-Rab5/Rab11DN>UAS-bsk RNAi, Hml>UAS-Rab5/Rab11DN>UAS-bskDN, and Hml>UAS-Rab5/Rab11DN>UAS-Syx17 RNAi hemocytes. Scale bar: 10 μm. ***p<0.001 (one-way ANOVA).
Figure 10
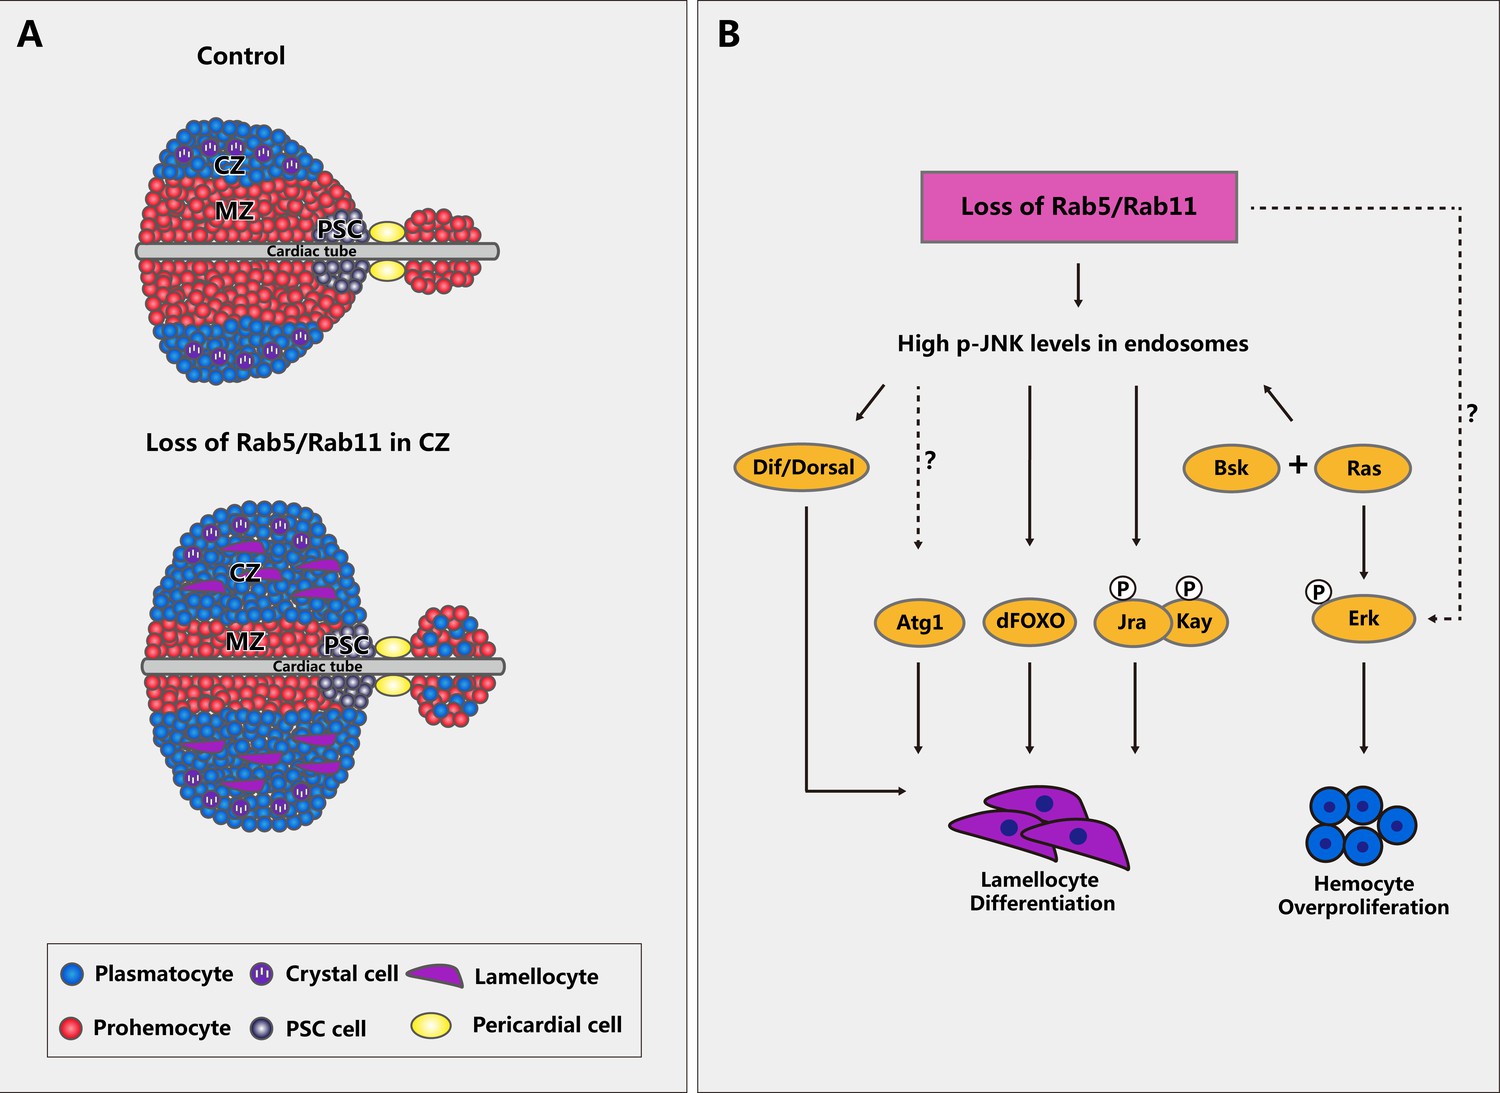
Schematic diagram of lymph gland morphology and the regulatory network of signaling pathways upon Rab5/Rab11 inactivation.
(A) Schematic diagram of lymph glands from control and Rab5/Rab11-deficient third instar larvae. When Rab5 or Rab11 was downregulated in the cortical zone (CZ), the formation of many premature hemocytes and lamellocytes was induced in the anterior and posterior lobes, whereas the medullary zone (MZ) area was decreased. Different cell types are represented by different colors and shapes. (B) Inhibiting Rab5 or Rab11 led to high p-JNK levels in endosomes. Next, activation of multiple signaling pathways, including JNK, Ras/EGFR, and Toll, ultimately contributed to lamellocyte differentiation and cell overproliferation.
Author response image 1
Author response image 2
Additional files
Download links
A two-part list of links to download the article, or parts of the article, in various formats.
Downloads (link to download the article as PDF)
Open citations (links to open the citations from this article in various online reference manager services)
Cite this article (links to download the citations from this article in formats compatible with various reference manager tools)
Rab5 and Rab11 maintain hematopoietic homeostasis by restricting multiple signaling pathways in Drosophila
eLife 10:e60870.
https://doi.org/10.7554/eLife.60870


