Plasma proteomic biomarker signature of age predicts health and life span
- Translational Gerontology Branch, National Institute on Aging, NIH, United States
- The Buck Institute for Research on Aging, United States
- National Institute on Aging, Intramural Research Program, Clinical Research Core, NIH, United States
- Laboratory of Human Carcinogenesis, Center for Cancer Research, National Cancer Institute, NIH, United States
- Precision Immunology, Immunology & Inflammation Research Therapeutic Area, Sanofi, United States
- Geriatric Unit, Azienda Sanitaria toscana centro, Italy
Figures
Figure 1 with 1 supplement
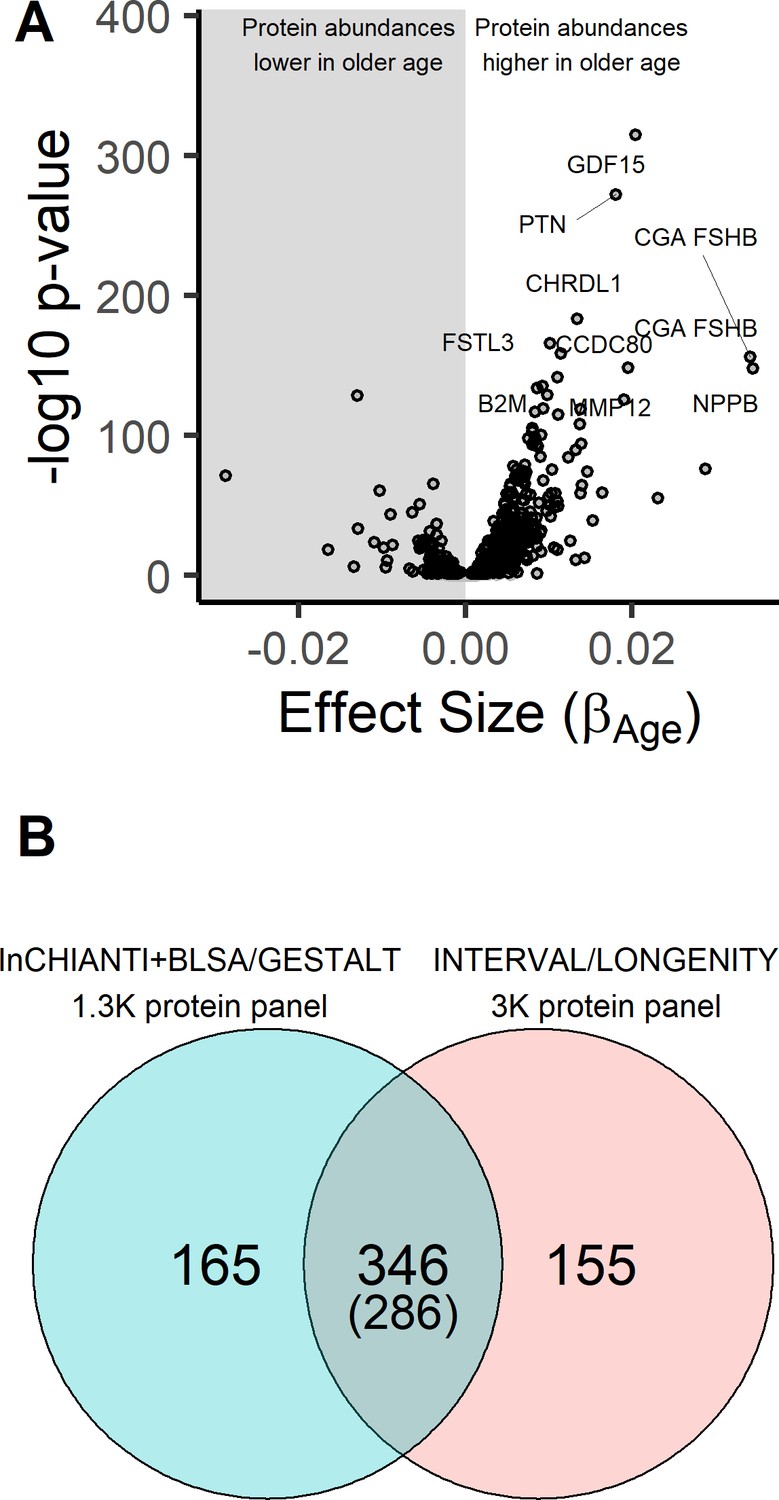
Age-associated proteins in the InCHIANTI study.
(A) The volcano plot displays the results from the association of 1301 proteins with chronological age in the InCHIANTI study (N = 997; Figure 1—source data 1). The figure displays the effect size, or the beta coefficient for age (βage) from the linear model, against significance presented as the -log10(P-value). Of the 1301 proteins, 651 proteins associated were associated with age. (B) Comparison of the age-associated proteins discovered using the 1.3K SOMAscan platform in the INCHIANTI/BLSA/GESTALT studies (Figure 1—source data 2) with the analysis using the 3K SOMAscan platform in the INTERVAL/LONGEVITY study (Lehallier et al., 2019). There were 346 proteins that were significant in both studies, and 286 of these proteins the direction of association with age were concordant.
-
Figure 1—source data 1
Results from the association analyses of 1301 proteins with chronological age in the InCHIANTI study.
- https://cdn.elifesciences.org/articles/61073/elife-61073-fig1-data1-v2.xlsx
-
Figure 1—source data 2
Results from the meta-analyses of protein associations with age in the InCHIANTI and BLSA/GESTALT study.
- https://cdn.elifesciences.org/articles/61073/elife-61073-fig1-data2-v2.xlsx
Figure 1—figure supplement 1
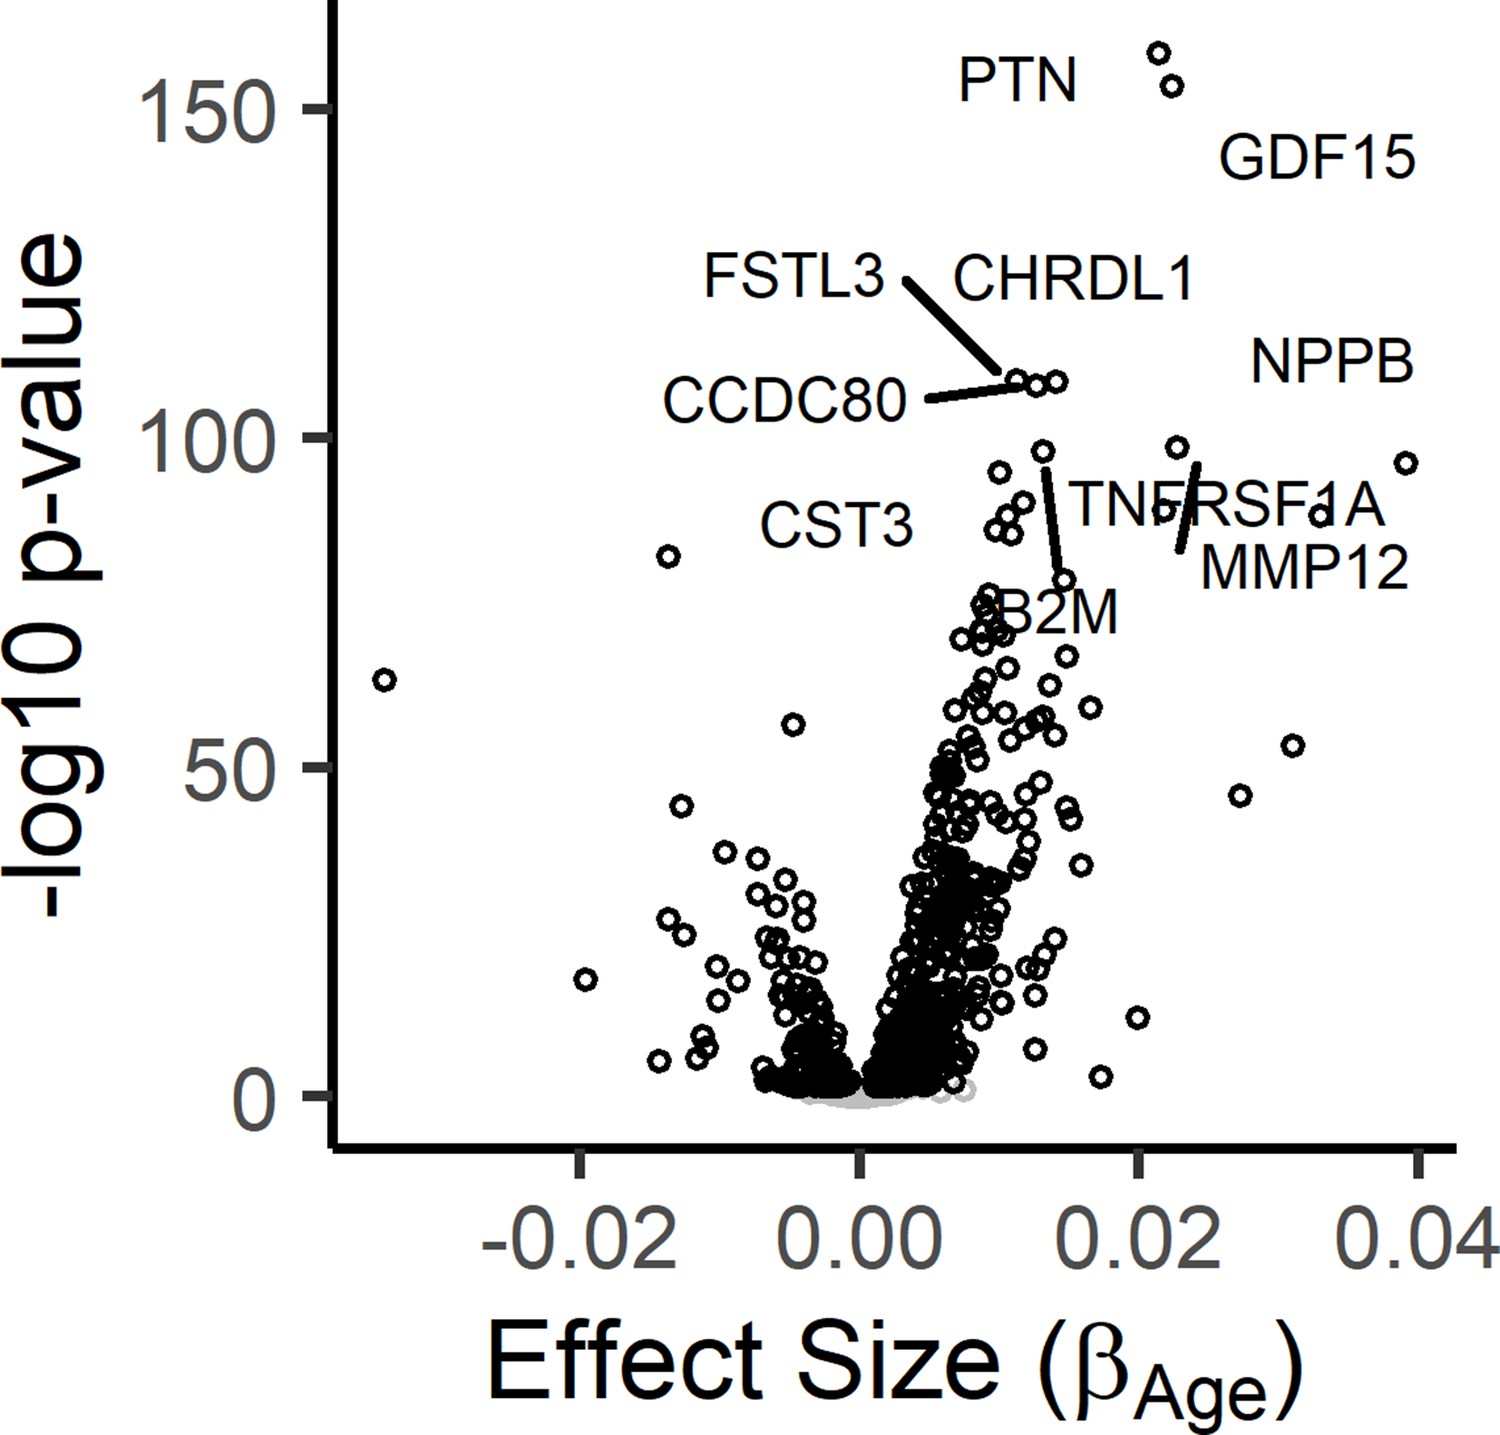
Results from the meta-analysis of age-associated proteins in the InCHIANTI and BLSA/GESTALT studies.
The results from the InCHIANTI study and BLSA/GESTALT (Tanaka et al., 2018) study was completed using the inverse-variance meta-analysis. Volcano plot displays the meta-analysis results for the 1301 proteins. The figure displays the effect size, or the beta coefficient for age (βage) from the linear model, against significance presented as the -log10(P-value).
Figure 2
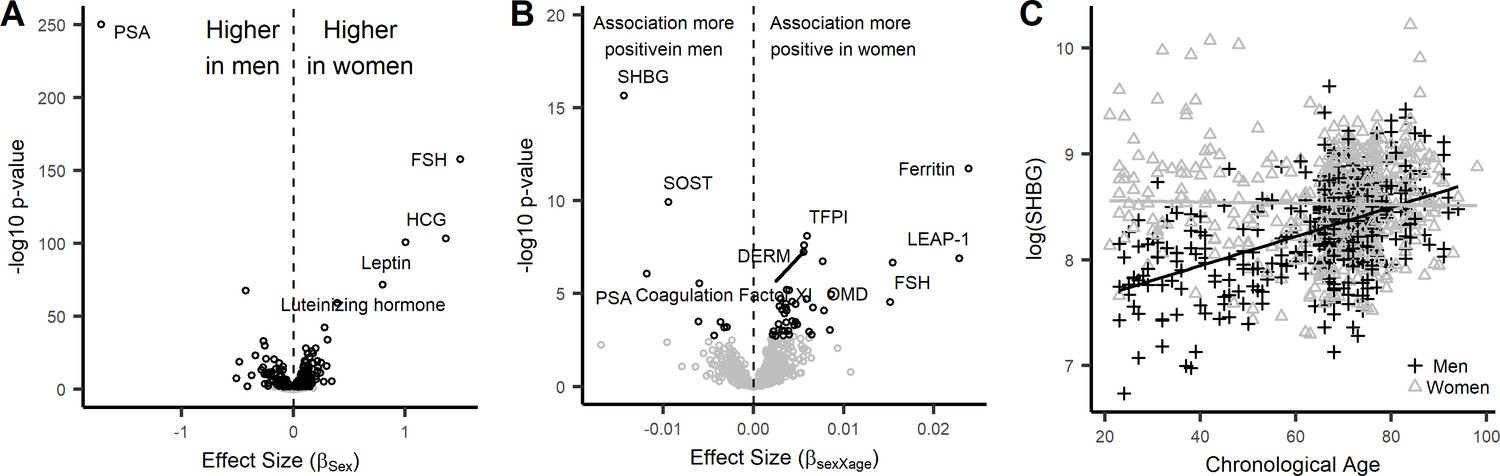
Sex-associated proteins and sex differences in age association of plasma proteins in the InCHIANTI study.
(A) Volcano plot displaying the results from the association of 1301 proteins with sex in the InCHIANTI study (Figure 2—source data 1). There were 427 proteins (black circles) with differential expression by sex. The figure displays the effect size, or the beta coefficient for sex (βage) where a positive value are proteins with overrepresentation in women, and a negative value are proteins overrepresented in men. The y-axis show the significance presented as the -log10 (P-value). (B) Volcano plot displaying the analysis to explore the differences in age association by sex (Figure 2—source data 1). The values represent the beta estimates for the interaction term between sex and age from the linear model. There were 50 proteins (black circles) with differential age association by sex. A positive effect size are proteins where the age association is more positive in women, conversely a negative effect size reflect proteins where the age association is more positive in men. (C) Scatterplot displaying the relationship between protein sex hormone binding globulin (SHBG) and age stratified by sex. In men, SHBG values were higher in older ages (+) whereas no age association was observed in women (Δ).
-
Figure 2—source data 1
Results from the association analyses of protein with sex and interactions between sex and age.
- https://cdn.elifesciences.org/articles/61073/elife-61073-fig2-data1-v2.xlsx
Figure 3

Association of plasma ENPP7 with age and mediation by cg15739835.
Mediation analysis in 460 subjects with DNA methylation and proteomic data was conducted with Baron and Kenny method (Supplementary file 1A). The most significant mediation was observed for ectonucleotide pyrophosphatase/phosphodiesterase 7 (ENPP7). (A) Scatterplot displaying the association of plasma ENPP7 with age (solid line) and attenuation of the association after adjustment for methylation at cg15739835. (B) Scatterplot displaying the negative association between methylation at cg15739835 with age.
Figure 4
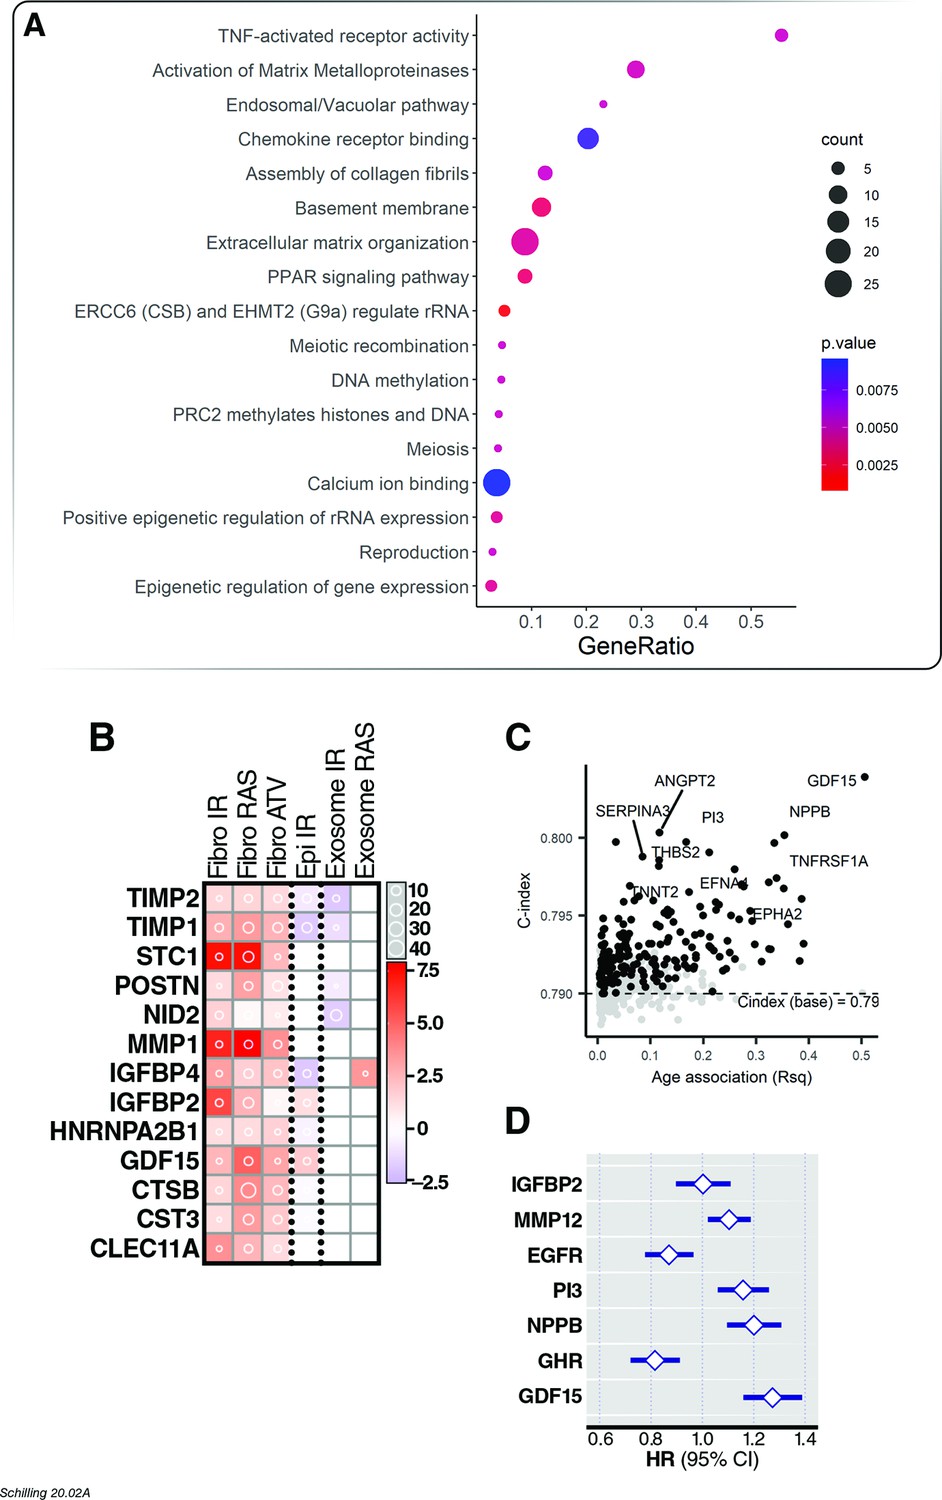
Association of age proteins with all-cause mortality.
Of the 651 age-associated proteins, 218 was associated with all-cause mortality (Figure 4—source data 1). (A) Pathway enrichment analysis of age-associated proteins predictive of all-cause mortality. (B) There were 13 core senescence-associated secretory proteins (SASP) among the proteins that predict mortality. (C) Scatterplot displaying the performance (c-index) of plasma proteins that predict all-cause mortality (y-axis) against the proportion of variance in age that is explained by the biomarker (Rsq) on the x-axis. (D) Forest plot to display the effect of 8 plasma proteins that significantly predicted all-cause mortality in a multi-protein model.
-
Figure 4—source data 1
Results from association of age-associated proteins with mortality in the InCHIANTI study.
- https://cdn.elifesciences.org/articles/61073/elife-61073-fig4-data1-v2.xlsx
-
Figure 4—source data 2
Results from association of age-associated proteins with mortality considering interactions with time interval in the InCHIANTI study.
- https://cdn.elifesciences.org/articles/61073/elife-61073-fig4-data2-v2.xlsx
Figure 5
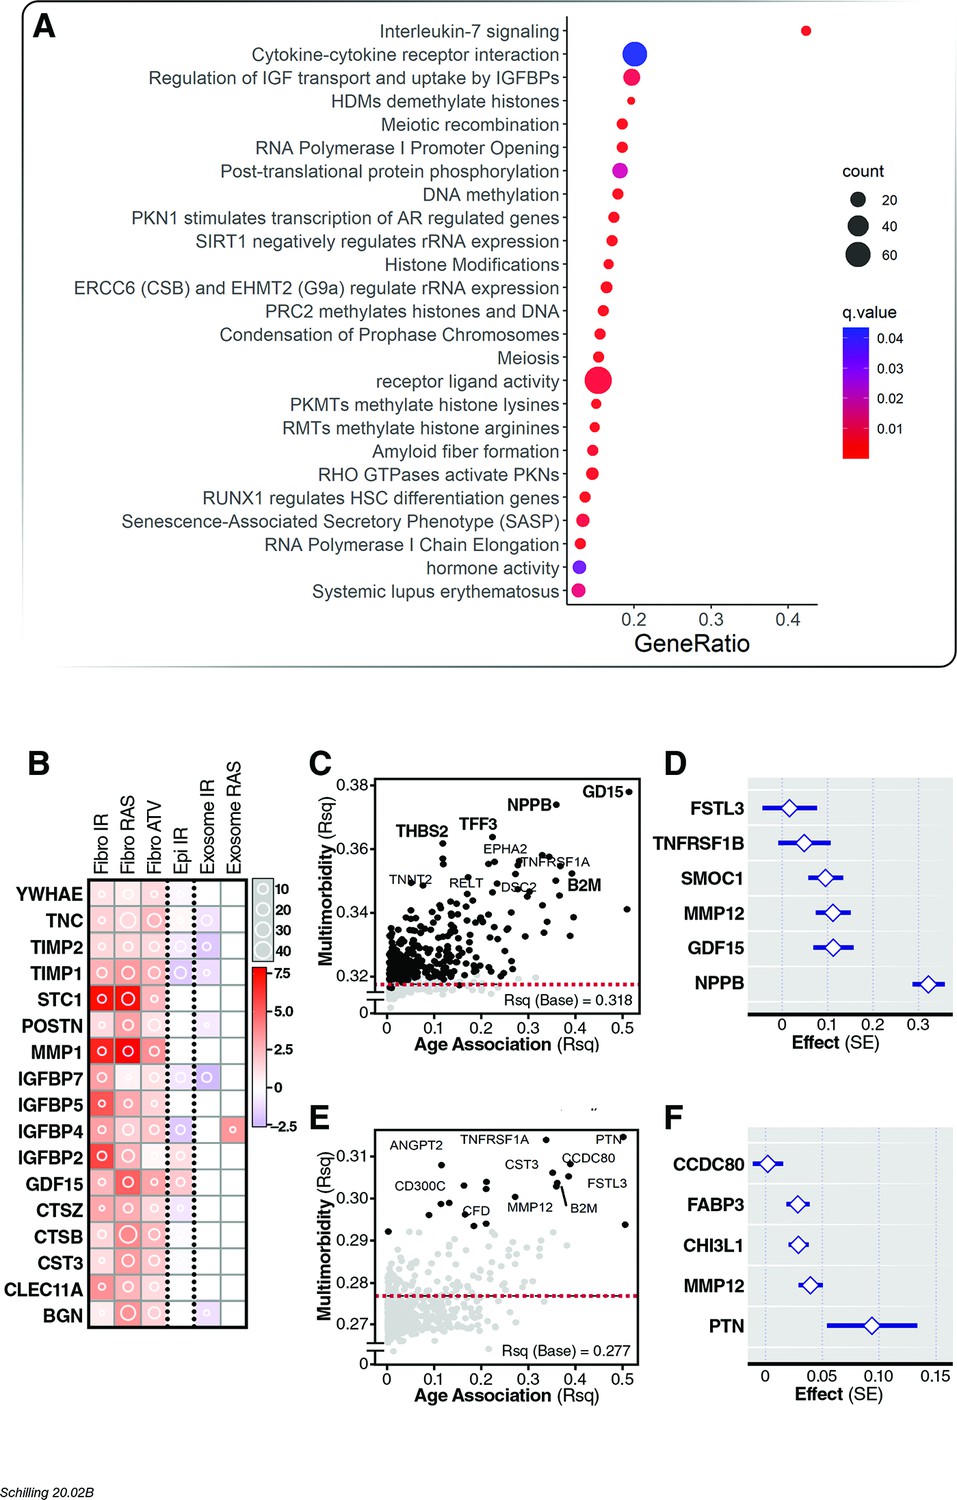
Association of age proteins with multimorbidity.
Of the 651 age-associated proteins, 295 was associated with all-cause mortality (Figure 5—source data 1). (A) Pathway enrichment analysis of age-associated proteins predictive of multimorbidity. (B) There were 13 core senescence-associated secretory proteins (SASP) among the proteins that predict mortality. Scatterplot displaying the proportion of variance (Rsq) of age explained by protein (x-axis) with relationship (Rsq) with protein with baseline multimorbidity (y-axis) (C) and trajectory of multimorbidity over 10 years in subjects free of disease at baseline (y-axis) (E). Forest plot to display the effect of six and five plasma proteins that predict baseline (D) and trajectory of multimorbidity (F).
-
Figure 5—source data 1
Results from association of age-associated proteins with number of diseases in the InCHIANTI study.
- https://cdn.elifesciences.org/articles/61073/elife-61073-fig5-data1-v2.xlsx
Figure 6
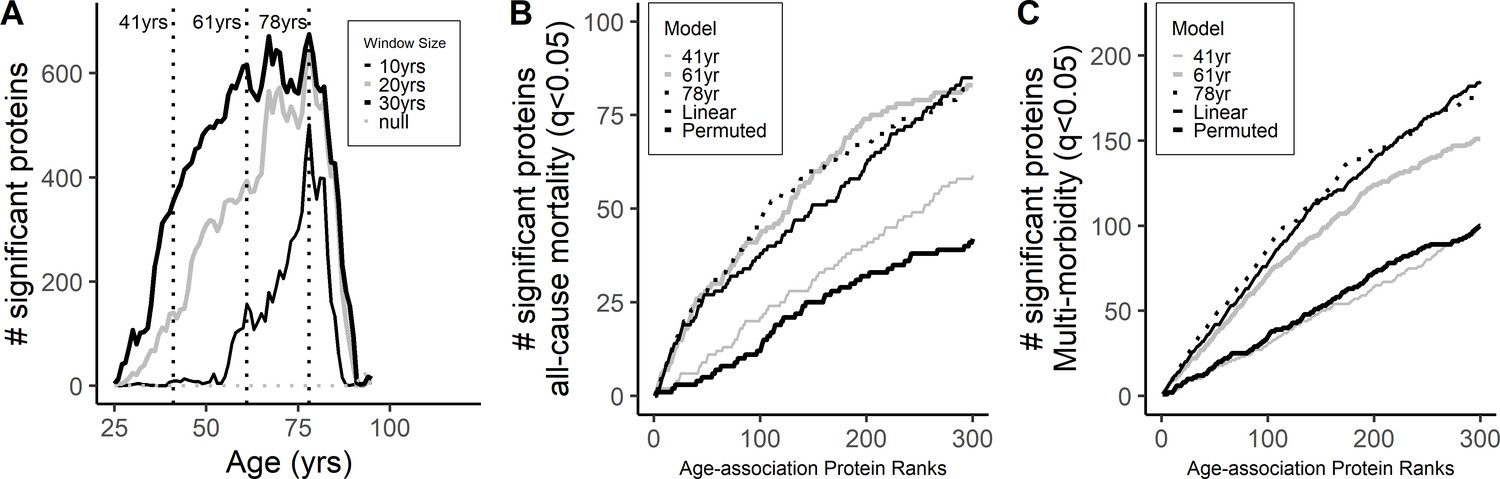
Differential protein expression across age-span.
(A) Differential expression of protein across different ages was explored suing a sliding-window analysis using an age window of 10, 20, and 30 years (Supplementary file 1B). Peak association was observed at age 78 while no clear peaks were observed at younger ages. Cumulative number of proteins associated with all-cause mortality (A) and multimorbidity (B) was compared in the ranked age-associated proteins at the different age waves (41, 61 and 78 years) and from the linear models.
Figure 7
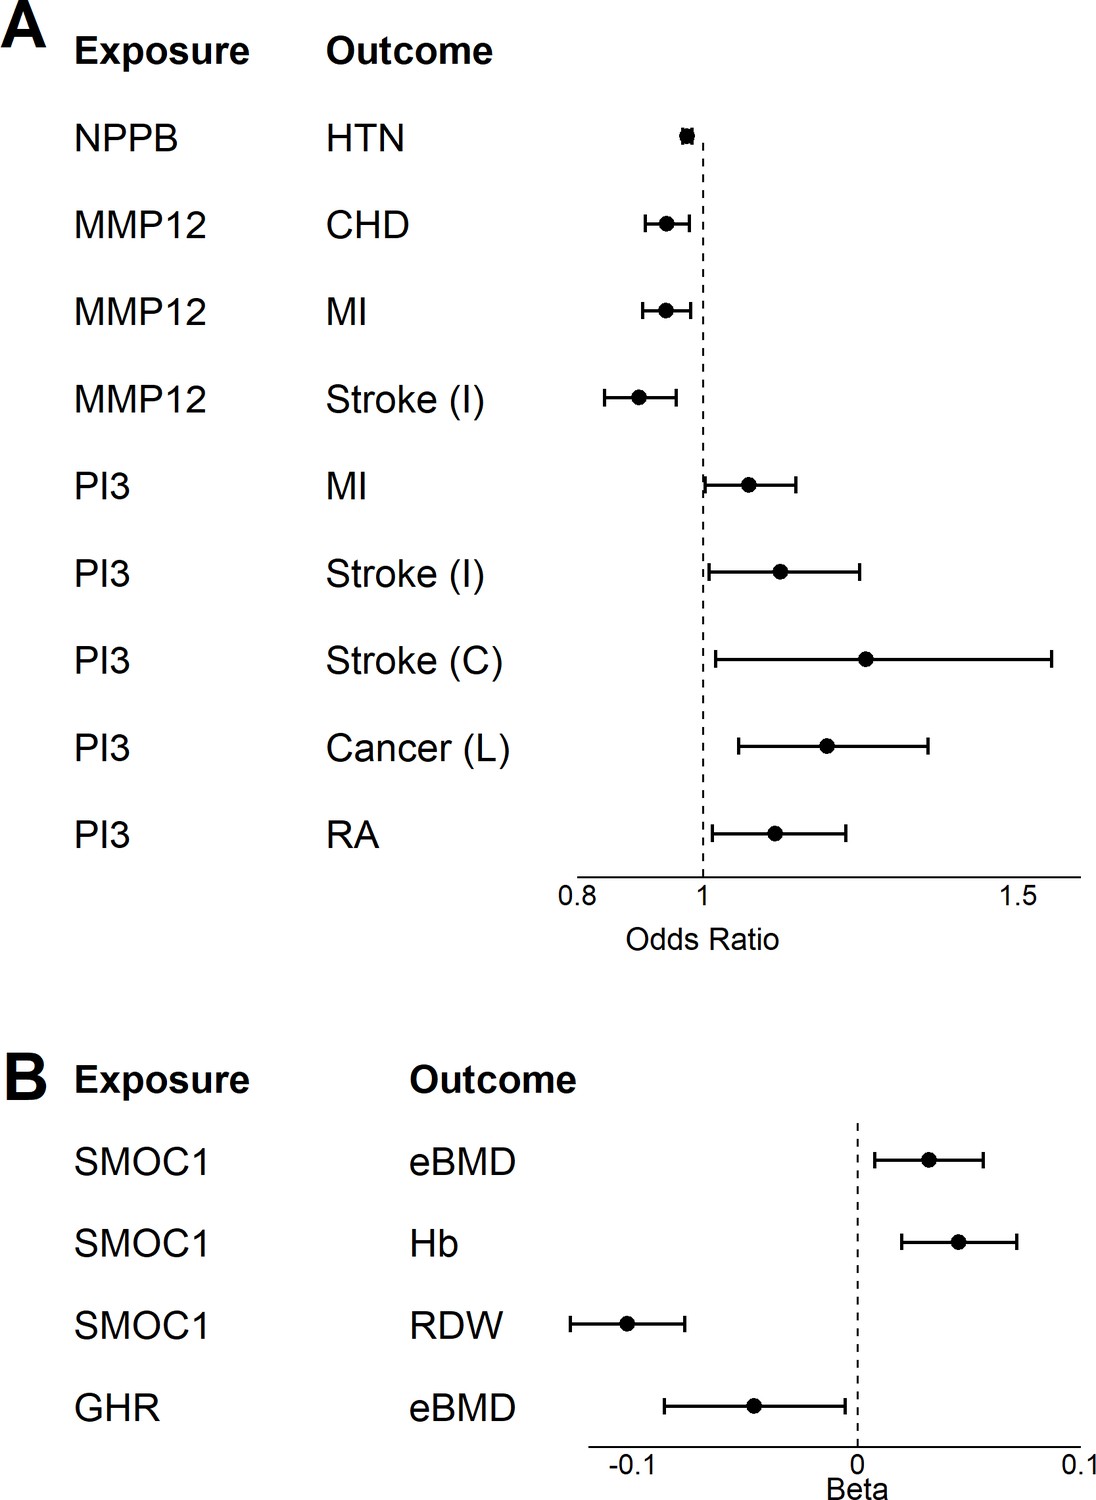
Two-sample Mendelian Randomization.
A two-sample Mendelian randomization (MR) was conducted for 18 age-related disease and endophenotypes using genetic instrument identified in the INTERVAL study for seven age-associated proteins (Sun et al., 2018) and (Supplementary file 1C). Forest plot displaying the results from the two-way MR for age-related disease (A) and endophenotypes (B).
Figure 8 with 2 supplements
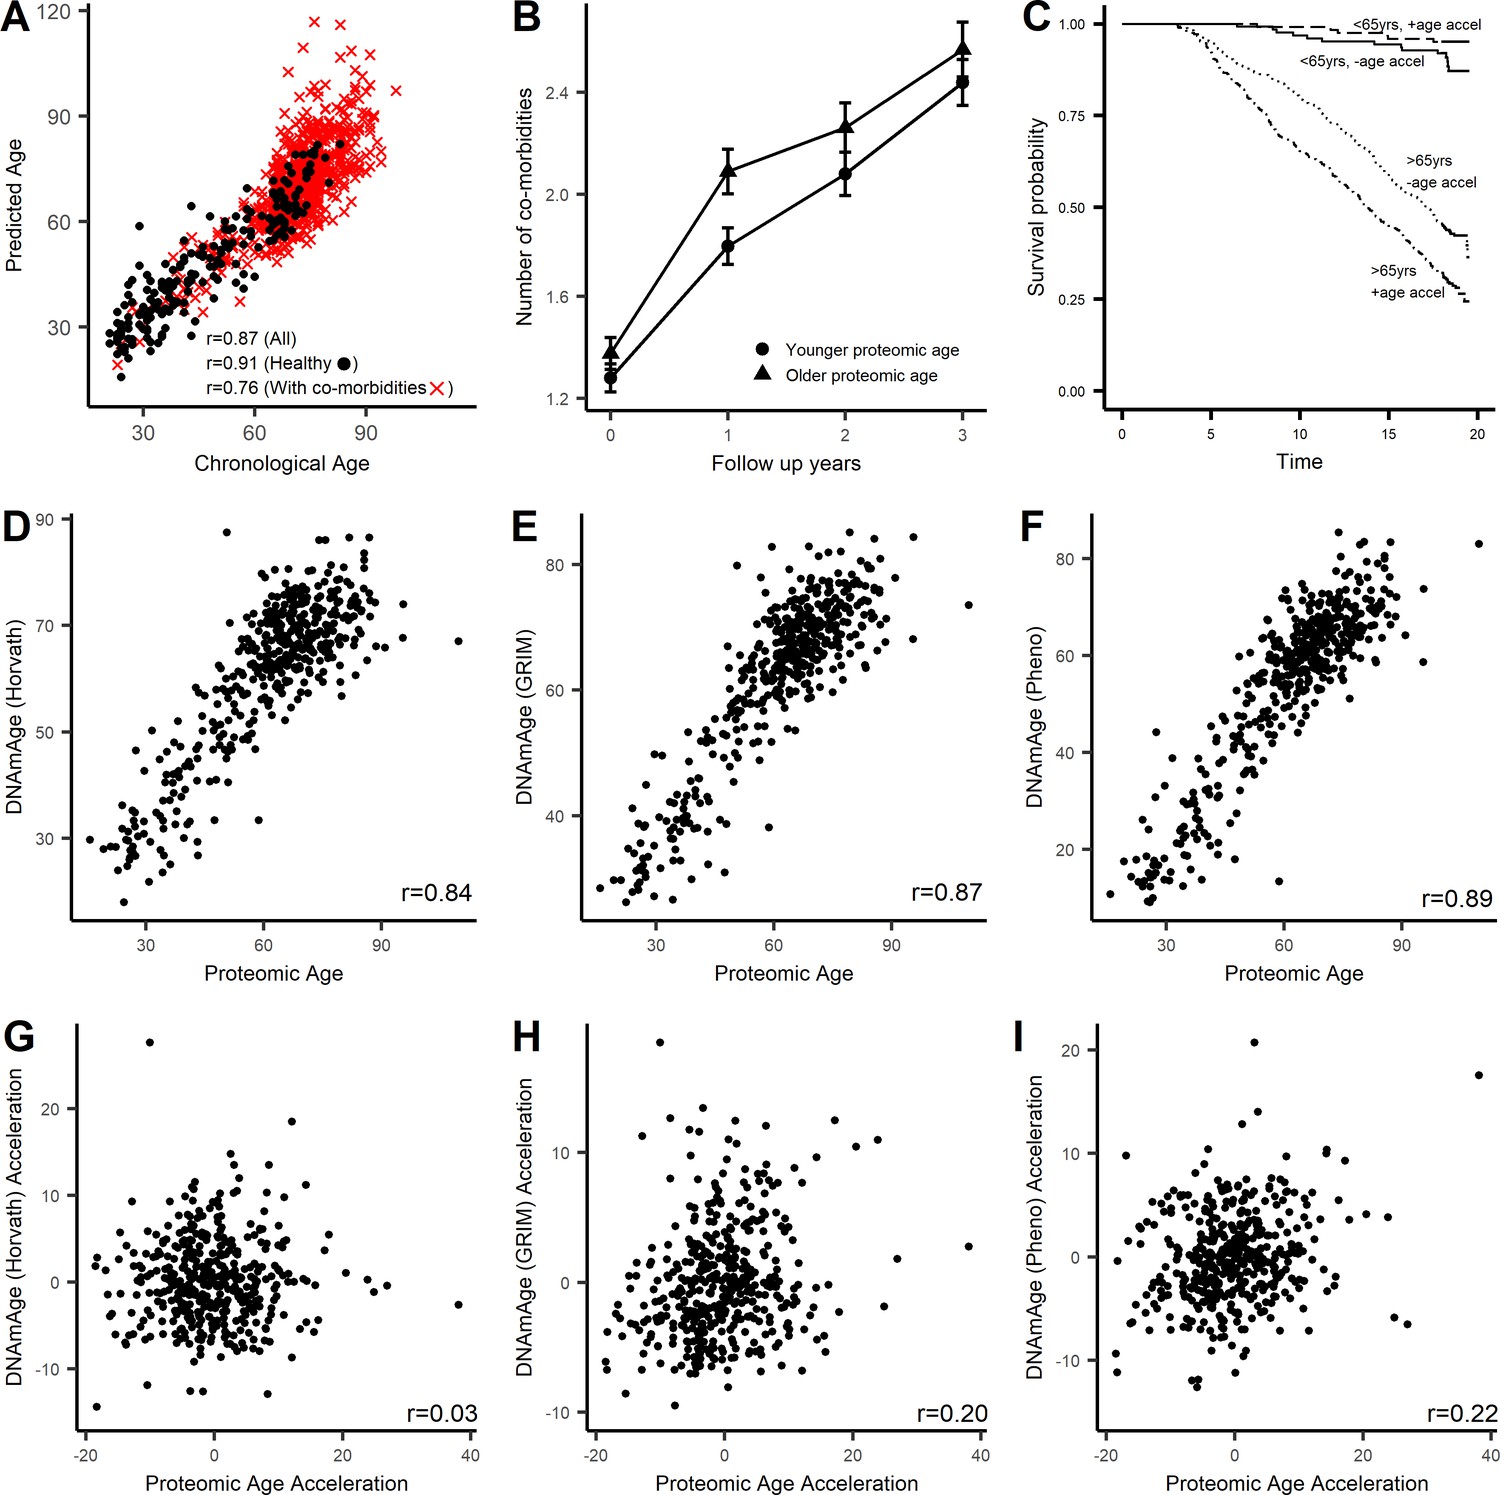
Characterization of proteomic signature of age.
A proteomic age predictor was created using 76 proteins and a measure of protein biological age was calculated as the residuals (PROaccel) from the regression model of chronological age with predicted age (PROage; Supplementary file 1D). (A) Scatter plot of PROage with chronological age. The correlation was higher in subjects free of disease (circle) compared to subject with co-morbidities (cross). Subjects that were greater PROaccel display greater increase in multimorbidity (B) and in higher risk for all-cause mortality in subjects older than 65 years of age (C). The proteomic age was compared with existing epigenetic age clocks. The proteomic signature of age was consistent with other aging clocks including methylation age (Horvath, 2013) (D), GRIMage (Lu et al., 2019) (E), and phenotypic age (Levine et al., 2015) (F). Age acceleration or measure of biological age based on proteomic signature was not correlated with biological aging measured by methylation clock (G), but was correlated with biological age based on GRIMage (H) and phenotypic age (I).
Figure 8—figure supplement 1
Comparison of proteomic signature of age.
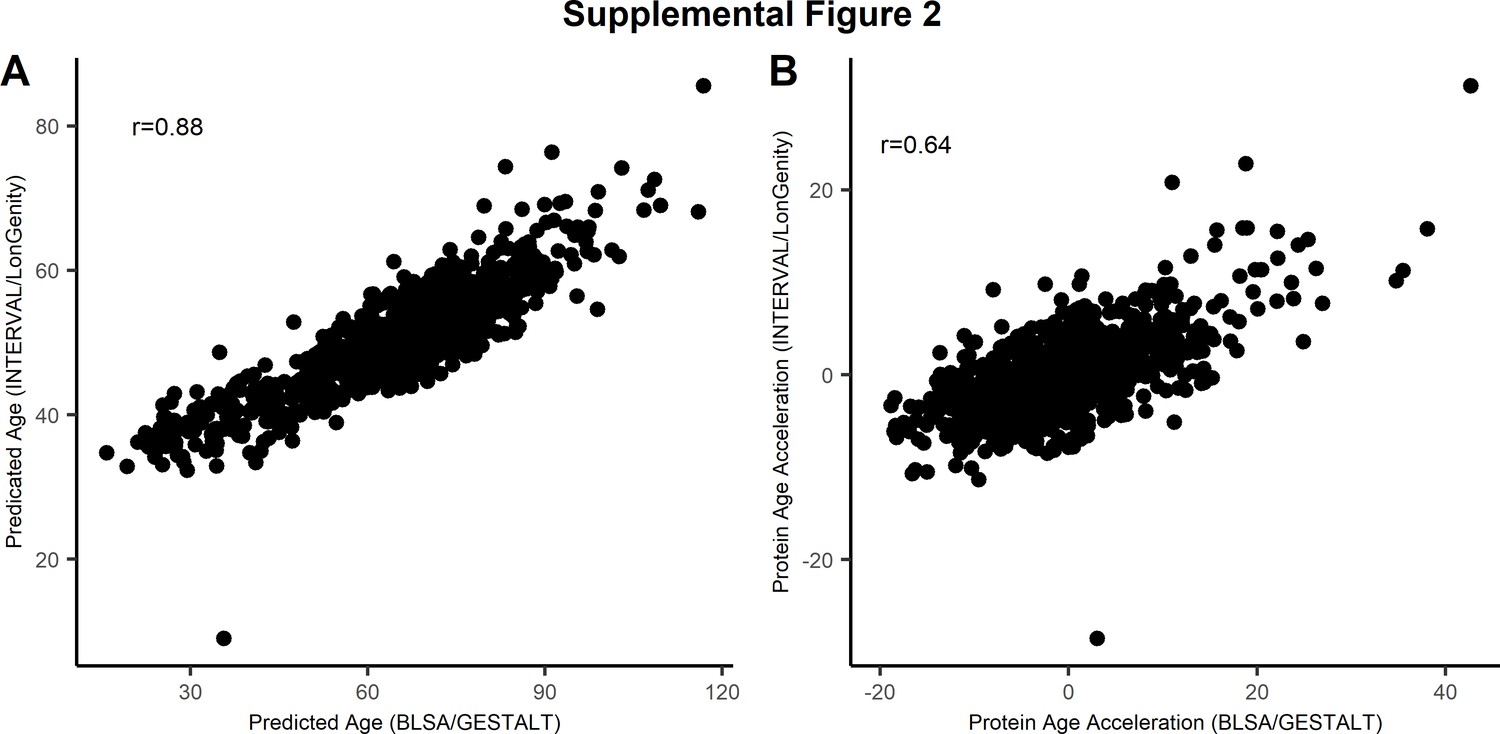
The 76-protein age predictor was compared with the parsimonious 9-protein model developed by Lehallier (Lehallier et al., 2019). The scatter plot displays the correlation between the two proteomic signature of age (A) and the measure of age acceleration (deviation of predicted age and observed age) based on 76 proteins (x-axis) with the 9-protein model (y-axis) (B).
Figure 8—figure supplement 2

Aging rates with trajectory of chronic disease accumulation in healthy disease-free subjects.
The association of age-associated proteins with trajectory of multimorbidity was examined in 310 subjects that were free of chronic diseases at baseline. Being biologically older (proteomic signature of age is greater than chronological age) displays greater increase in multimorbidity during a 10 year follow period.
Tables
Table 1
Clinical and demographic characteristics of 997 InCHIANTI subjects at baseline visit.
| Overall | 20–60 years | 60–70 years | 70–80 years | 80+ years | p | ||||||
|---|---|---|---|---|---|---|---|---|---|---|---|
| n | 997 | 203 | 285 | 380 | 129 | ||||||
| Age (yrs) | 66.3 | (15.4) | 40.1 | (11.1) | 66.4 | (2.2) | 73.9 | (2.7) | 84.9 | (3.6) | <0.001 |
| % Women | 549 | (55.1) | 106 | (52.2) | 152 | (53.3) | 207 | (54.5) | 84 | (65.1) | 0.097 |
| % Ripoli | 517 | (51.9) | 98 | (48.3) | 147 | (51.6) | 192 | (50.5) | 80 | (62.0) | 0.084 |
| % death | 504 | (50.6) | 9 | (4.4) | 109 | (38.2) | 259 | (68.2) | 127 | (98.4) | <0.001 |
| Follow-up time (yrs) | 15.0 | (4.9) | 18.4 | (1.6) | 16.6 | (3.8) | 14.1 | (4.8) | 8.7 | (4.0) | <0.001 |
| Number of common diseases | 1.3 | (1.3) | 0.3 | (0.5) | 1.2 | (1.1) | 1.7 | (1.3) | 2.3 | (1.5) | <0.001 |
| Hypertension | 375 | (37.6) | 18 | (8.9) | 120 | (42.1) | 168 | (44.2) | 69 | (53.5) | <0.001 |
| Depression | 183 | (18.4) | 22 | (10.8) | 36 | (12.6) | 88 | (23.2) | 37 | (28.7) | <0.001 |
| Cognitive impairment | 177 | (17.8) | 3 | (1.5) | 29 | (10.2) | 82 | (21.6) | 63 | (48.8) | <0.001 |
| Diabetes | 103 | (10.3) | 4 | (2.0) | 32 | (11.2) | 47 | (12.4) | 20 | (15.5) | <0.001 |
| Lower extremities joint disease | 84 | (8.4) | 1 | (0.5) | 18 | (6.3) | 49 | (12.9) | 16 | (12.4) | <0.001 |
| Peripheral artery disease | 76 | (7.6) | 0 | (0) | 14 | (4.9) | 39 | (10.3) | 23 | (17.8) | <0.001 |
| Anemia | 74 | (7.4) | 10 | (4.9) | 13 | (4.6) | 28 | (7.4) | 23 | (17.8) | <0.001 |
| Ischemic heart disease | 54 | (5.4) | 0 | (0) | 16 | (5.6) | 27 | (7.1) | 11 | (8.5) | 0.001 |
| Chronic obstructive pulmonary disease | 50 | (5.0) | 3 | (1.5) | 18 | (6.3) | 23 | (6.1) | 6 | (4.7) | 0.065 |
| Cancer | 48 | (4.8) | 1 | (0.5) | 18 | (6.3) | 24 | (6.3) | 5 | (3.9) | 0.008 |
| Stroke | 34 | (3.4) | 1 | (0.5) | 3 | (1.1) | 22 | (5.8) | 8 | (6.2) | <0.001 |
| Congestive heart failure | 28 | (2.8) | 0 | (0) | 6 | (2.1) | 16 | (4.2) | 6 | (4.7) | 0.013 |
| Hip fracture | 22 | (2.2) | 0 | (0) | 3 | (1.1) | 12 | (3.2) | 7 | (5.4) | 0.003 |
| Chronic kidney disease | 8 | (0.8) | 0 | (0) | 0 | (0) | 2 | (0.5) | 6 | (4.7) | <0.001 |
| Parkinson's disease | 6 | (0.6) | 0 | (0) | 2 | (0.7) | 2 | (0.5) | 2 | (1.6) | 0.354 |
-
Data represent mean (SD) for continuous variables and n (%) for categorical variable.
-
Table 1—source data 1
Phenotypic data of the InCHIANTI study.
- https://cdn.elifesciences.org/articles/61073/elife-61073-table1-data1-v2.xlsx
Additional files
-
Source code 1
R code for primary analyses in this manuscript.
- https://cdn.elifesciences.org/articles/61073/elife-61073-code1-v2.zip
-
Supplementary file 1
Supplemental tables.
(1A) Age-associated proteins mediation by DNA methylation (1B) Age-associated proteins at different age waves (1C) Age-associated diseases considered for Mendelian randomization (1D) 76-protein signature weights (1E) Enrichment analysis of proteins associated with mortality and multimorbidity
- https://cdn.elifesciences.org/articles/61073/elife-61073-supp1-v2.xlsx
-
Transparent reporting form
- https://cdn.elifesciences.org/articles/61073/elife-61073-transrepform-v2.pdf
Download links
A two-part list of links to download the article, or parts of the article, in various formats.
Downloads (link to download the article as PDF)
Open citations (links to open the citations from this article in various online reference manager services)
Cite this article (links to download the citations from this article in formats compatible with various reference manager tools)
Plasma proteomic biomarker signature of age predicts health and life span
eLife 9:e61073.
https://doi.org/10.7554/eLife.61073


