Coordinated crosstalk between microtubules and actin by a spectraplakin regulates lumen formation and branching
- Department of Genetics, Microbiology and Statistics, School of Biology, University of Barcelona, Spain
- Institute of Biomedicine University of Barcelona (IBUB), Spain
Figures
Figure 1 with 1 supplement
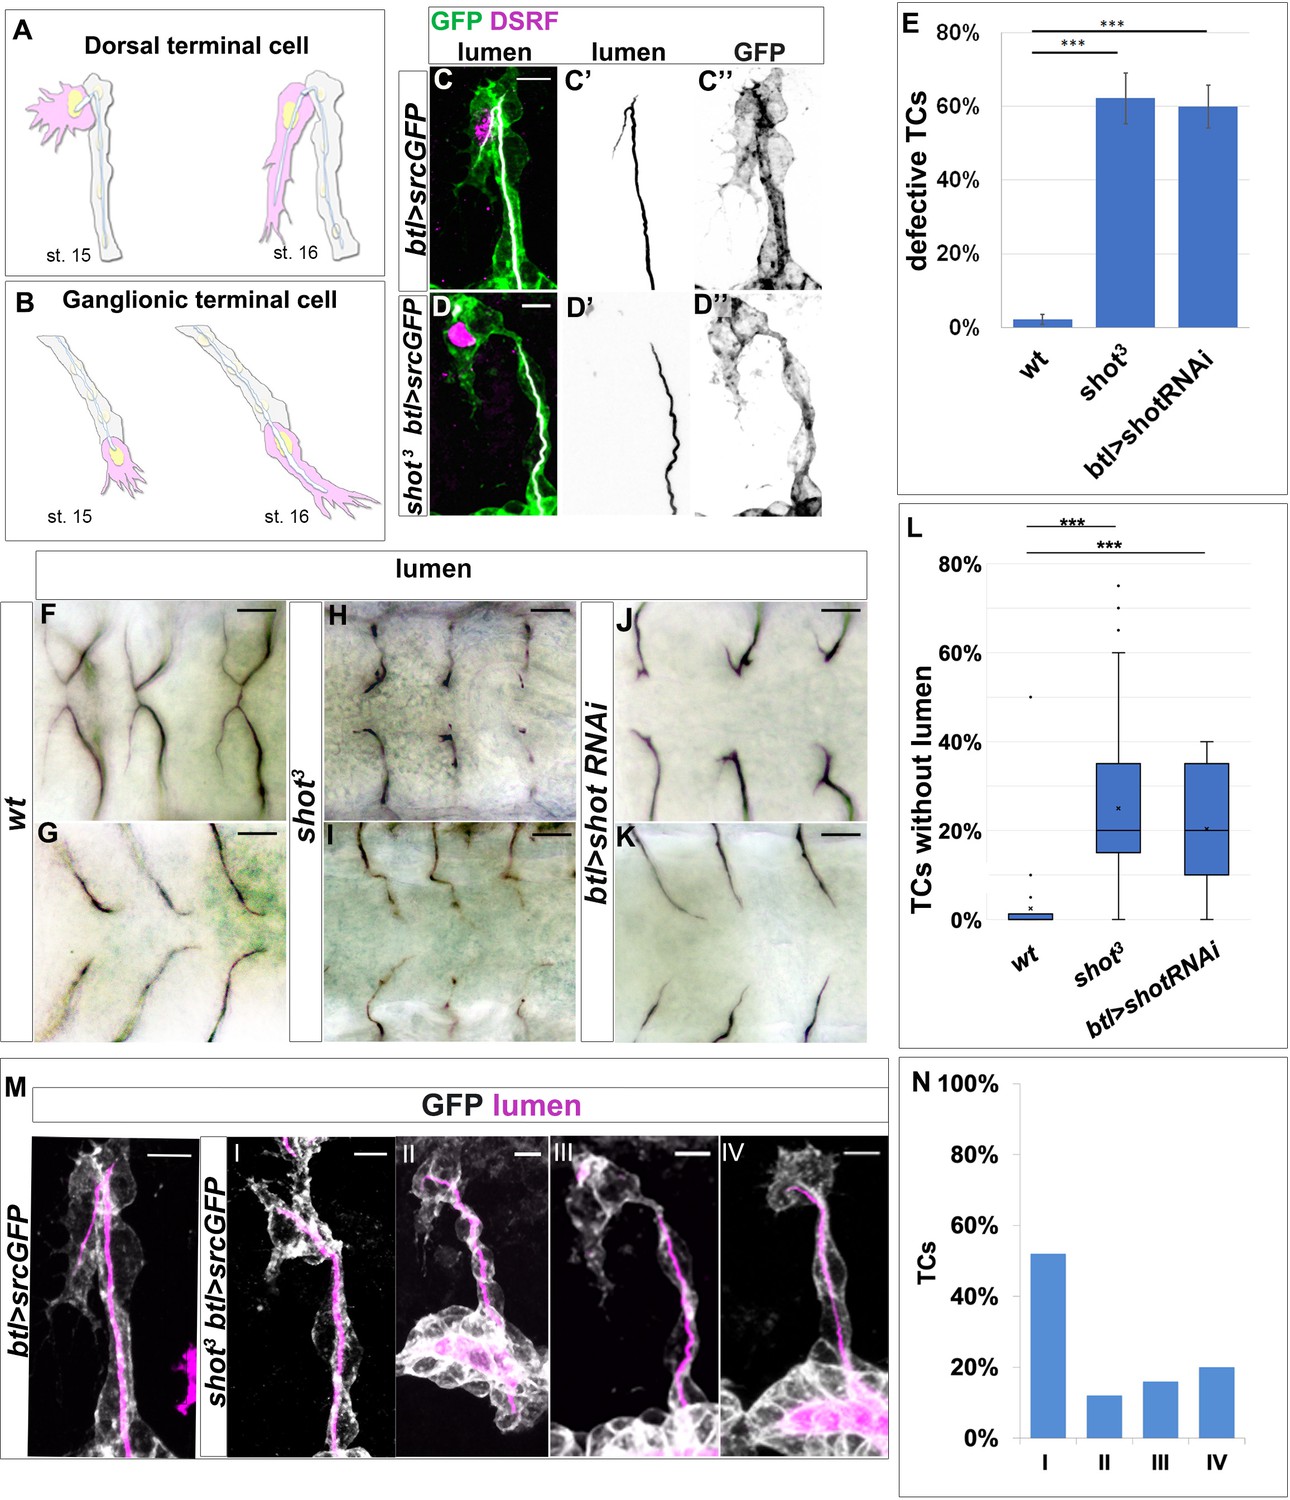
shot loss-of-function induces defects in subcellular lumen formation.
(A–B) Representation of dorsal and ganglionic TCs from embryonic st.15 to st.16 (DB and GB in grey, TC in pink). At st.15, the TC (cytoplasm in pink, nucleus in yellow, basal membrane in grey, apical membrane in blue and lumen in white) emits filopodia in the direction of cell elongation; apical membrane grows in the same direction giving rise to the outline of the subcellular lumen. At the same time the subcellular lumen is filled of chitin (white). At the end of st.16 the TC is elongated and the subcellular lumen is formed. (C–D) DBs at st.15 of btl >srcGFP (control) and shot3; btl >srcGFP fixed embryos stained with GFP to visualise tracheal cells, green in C and D, grey in C’’ and D’’, CBP to visualise the lumen, white in C and D black in C’ and D’ and DSRF in magenta. Anterior side is on the left and dorsal is up, scale bars 5 μm. (E) Quantification of total defective TCs in btl >shotRNAi (60%), shot3 (62.5%) and wt (2.25%) n = 20 embryos, 400TCs. Error bars are ± SEM and asterisks represent a p-value<0001. Statistics by two-tailed Student’s t-test. (F–K) DBs (F-J dorsal view) and GBs (G-K ventral view) of fixed embryos stained with anti-Gasp antibody at st.16 of wt (F and G), shot3 (H and I) and btl >shotRNAi (J and K) (L) Quantification of total TCs (genotype indicated) without subcellular lumen (wt 1.34% n = 400, shot3 25% n = 400, btl >shotRNAi 20%n = 300). *** p-value<0001. Statistics by two-tailed Student’s t-test. Scale bars 10 µm. (M–N) Different types of TC mutant phenotypes were produced in absence of Shot as observed in detail by confocal microscopy. (M) Dorsal branches of btl >srcGFP control and shot3 embryos stained with GFP (grey) to visualise membrane and CBP (in magenta) to visualise the lumen. Anterior side is on the left and dorsal side is up. Scale bars 5 μm. (I) TC partially elongated with formed lumen but with wrong directionality (52%); (II) the elongation was stopped prematurely and a primordium of subcellular lumen was formed (12%); (III) the cell elongated partially but the lumen was completely absent (16%); and (IV) the cell was not able to elongate and the lumen was completely absent (20%). Types III and IV were quantified in L as TCs without lumen. (E) Detailed quantification, by confocal microscopy, of the different types of TC mutant phenotypes reported as I-IV (n = 25 TCs).
-
Figure 1—source data 1
Quantification of shot loss-of-function defects in subcellular lumen formation.
- https://cdn.elifesciences.org/articles/61111/elife-61111-fig1-data1-v2.xlsx
Figure 1—figure supplement 1
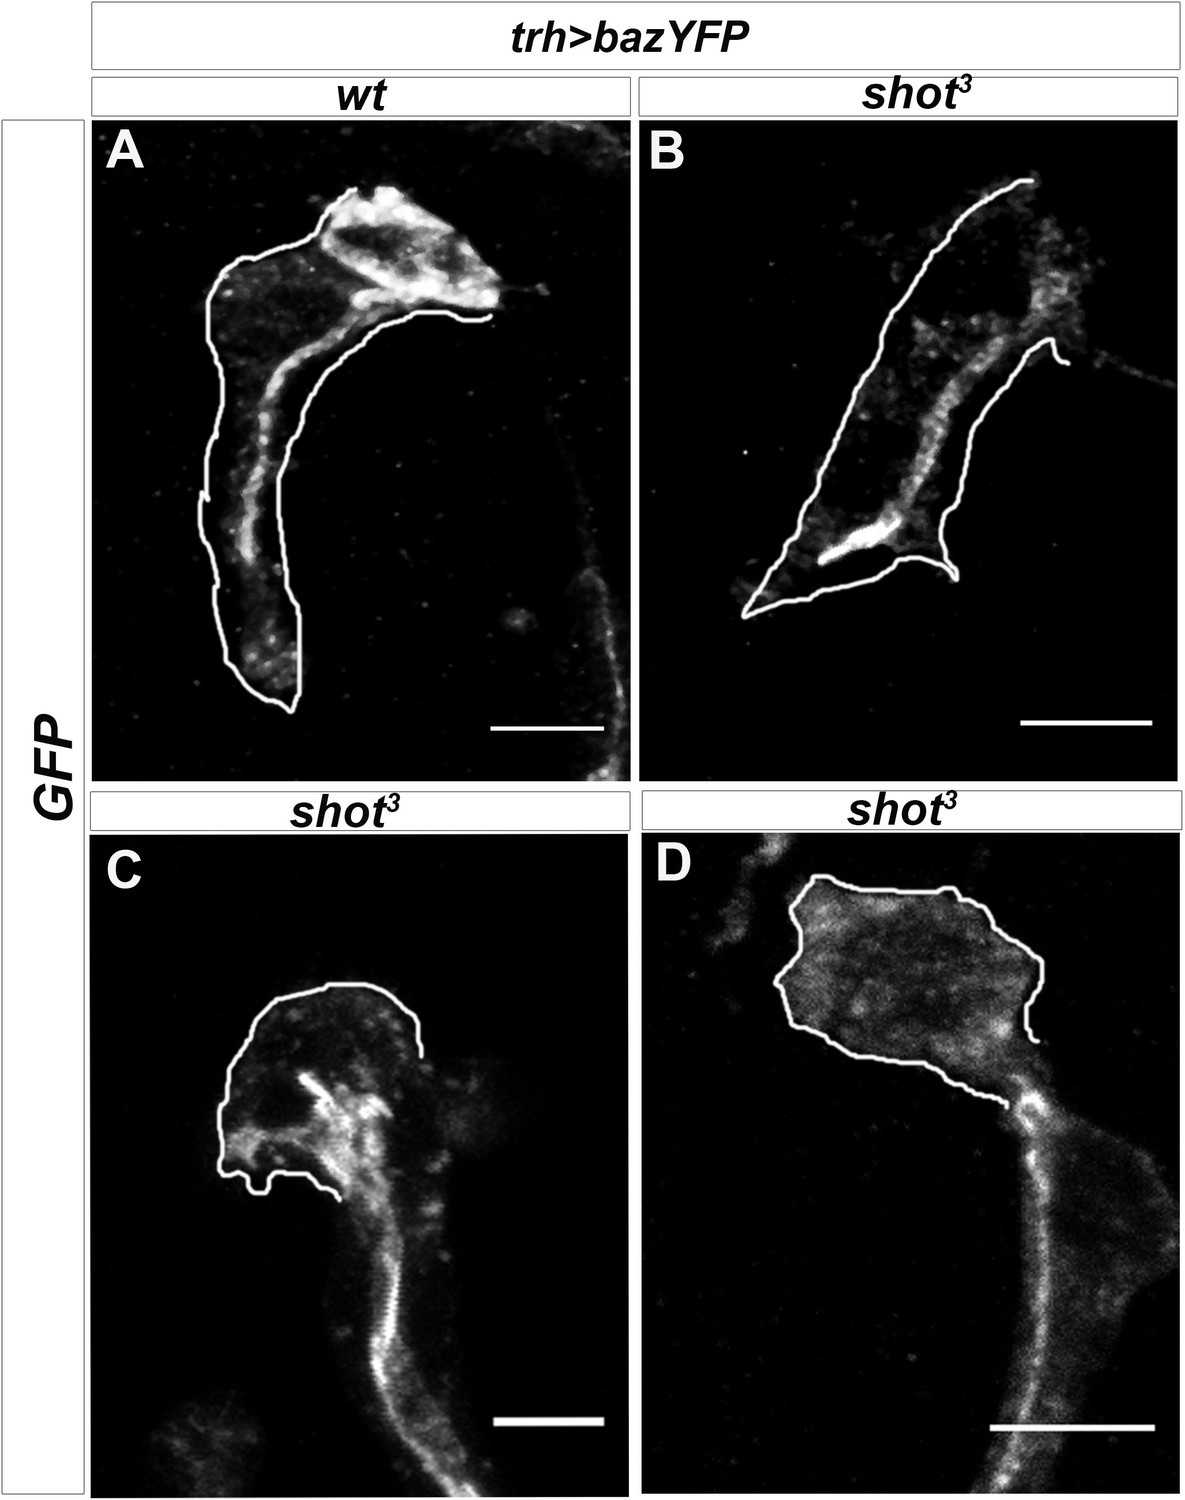
Par3 vesicles are mislocalised in shot mutant TCs.
Dorsal TCs from embryos btl >bazYFP control (A) and shot3 mutant (B–D) stained with anti-GFP antibody to detect bazooka/Par3 accumulation. In cases in which shot3 TC is partially elongated and the lumen is formed, no strong defects in apical membrane deposition are detected (B), instead when shot3 TCs are not elongated and the lumen is not formed (C and D), Bazooka/Par3 is scattered and disorganised, suggesting defects in membrane delivery. Anterior side is on the left and dorsal midline is up. The shape of TC is highlighted in white. Scale bars 5 μm.
Figure 2 with 1 supplement
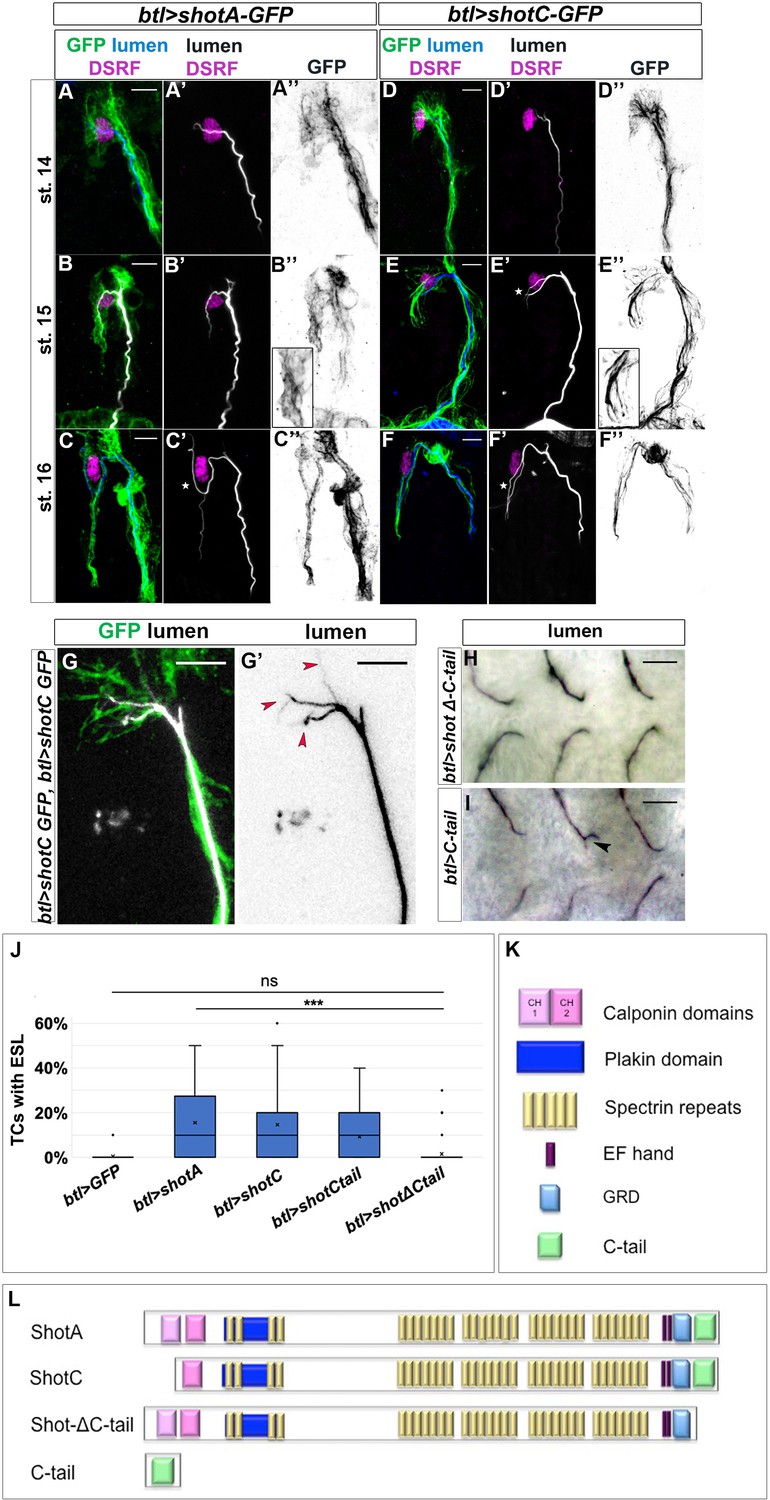
ShotOE induces luminal branching through its microtubule-binding domain.
Lateral view of DB tip cells from st.14 to st.16, of btl >shotA-GFP embryos (A–C) and btl >shotCGFP (D–F). Embryos were stained with GFP (green in A-F and grey A’’-F’’) to visualise Shot-GFP, DSRF to mark the TC nuclei (in magenta) and CBP to stain the chitinous lumen (blue in A-F and white A’-F’). Both overexpressing conditions induced ESLs (white stars). Note the GFP was more diffuse in the cytoplasm of the TCs of embryos overexpressing shotA, and more organised in bundles in the TCs overexpressing shotC. Anterior side of embryo is on the left and dorsal side up. Scale bars 5 μm. (G) ESL induction by ShotOE is dosage sensitive. Example of dorsal TC of an embryo overexpressing two copies of btl >shotC-GFP, stained with anti-GFP (green) and CBP (white in G, black in G’). Red arrows indicate extra-subcellular lumen branching. Note that the extra-subcellular lumina are very thin and they follow Shot positive bundles detected with GFP. Anterior side is on the left, dorsal midline is on the top. Scale bars 5 μm. (H, I) Tips of GB TCs from btl >shotΔCtail embryos with a single subcellular lumen each (H) and btl >C-tail (I) in which one TC is bifurcated; stained with anti-Gasp (ventral view, anterior side of the embryo is on the left). Scale bars 10 µm. (J) The C-tail domain is involved in ESL formation. Percentage of TCs displaying ESLs in embryos overexpressing GFP, shotA, shotC, C-tail, and shotΔCtail in the tracheal system (n = 400 TCs all genotypes except btl >shotC where n = 800). *** p-value<0.001; ns refers to a p-value>0.1. Statistics by two-tailed Student’s t-test. There was no significant difference between overexpression of shotΔCtail and GFP alone. (K) Schematic representation of spectraplakin protein domains and (L) the different Shot constructs used in this study.
-
Figure 2—source data 1
Quantification of ShotOE phenotypes in subcellular lumen formation.
- https://cdn.elifesciences.org/articles/61111/elife-61111-fig2-data1-v2.xlsx
Figure 2—figure supplement 1
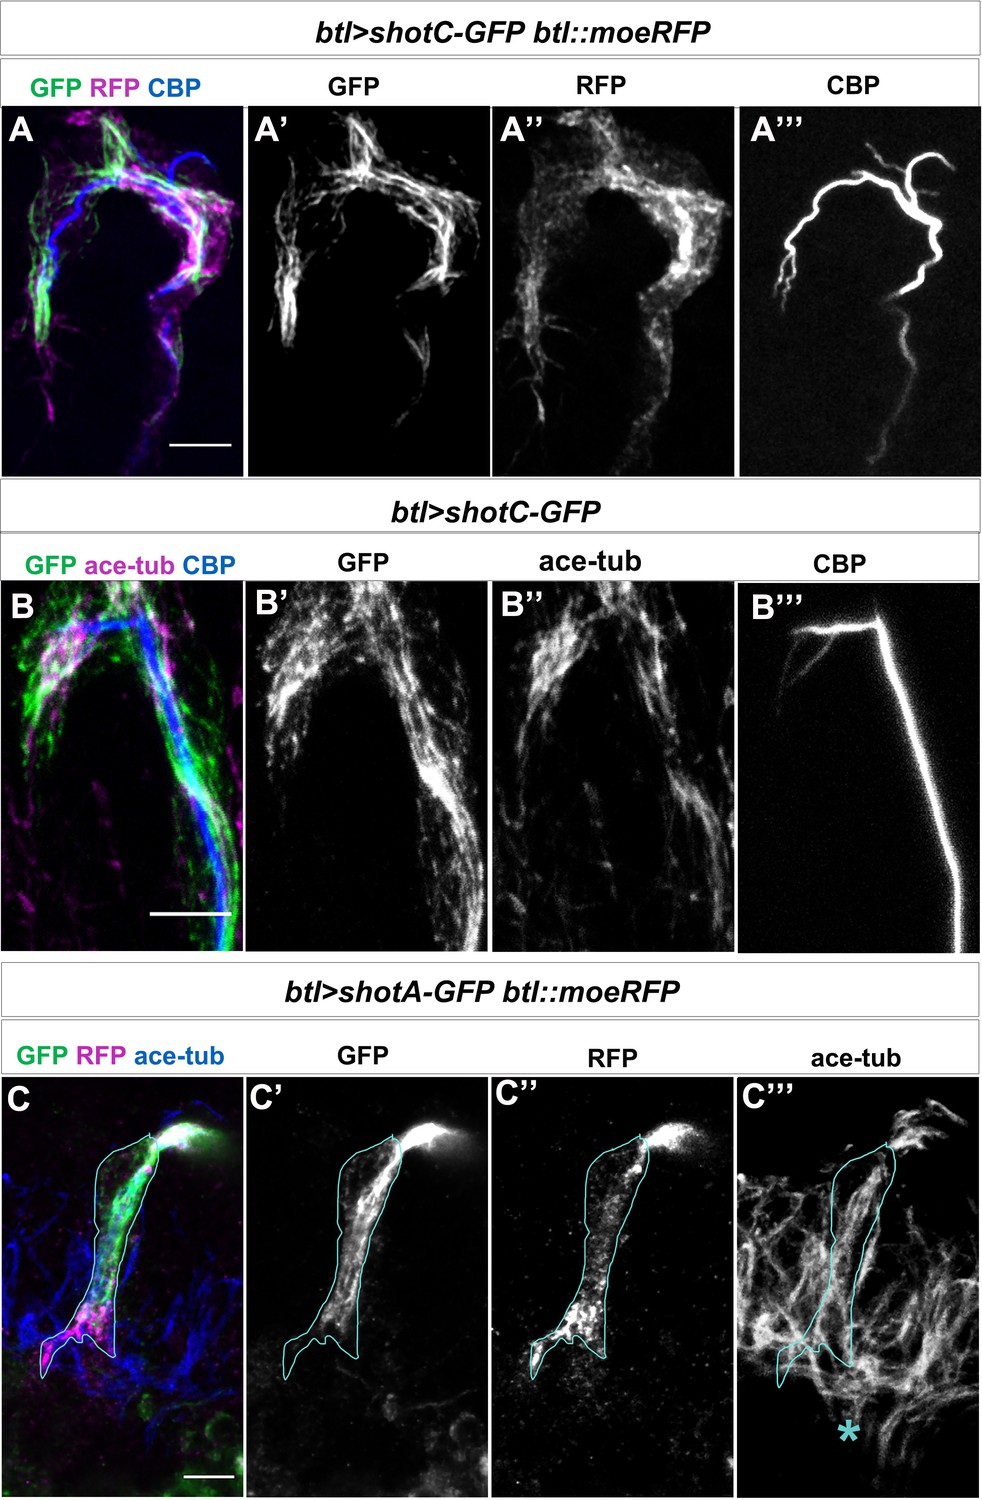
ShotOE does not perturb the TC cytoskeletal organisation.
(A) Dorsal TC of a late st.15 btl >shotCGFP;btl::moeRFP embryo stained with anti-GFP antibody (green in A, grey in A’), anti-RFP antibody (magenta in A, grey in A’’) and CBP (blue in A, grey in A’’’). The extra-subcellular lumen (ESL) appears inside the same cytoplasmatic protrusion in 75% of TCs analysed (n = 25). (B) Dorsal TCs of an early st. 15 btl >ShotC-GFP stained with anti-GFP antibody (green in B, grey in B’), anti-acetylated-tubulin antibody (magenta in B, grey in B’’) and CBP (blue in B, grey in B’’’). GFP positive bundles colocalise with MTs in 100% of TCs analysed (n = 20). (C) Ventral TC of a late st.15 btl >shotA-GFP;btl::moeRFP embryo stained with anti-GFP antibody (green in C, grey in C’), anti-RFP antibody (magenta in C, grey in C’’) and anti-acetylated-tubulin antibody (blue in C, grey in C’’’). Actin accumulation and acetylated-tubulin MT-bundles are not perturbed by Shot A overexpression (n = 10). Acetylated-tubulin antibody also detects the axonal bundles on the ventral midline (asterisk in C’’’). Scale bars 5 μm in all panels.
Figure 3

ESL induction by ShotOE is not associated with centrosome amplification.
(A,B) GB TC of a st.14 embryo (A), prior to lumen extension, and st.15 when a bifurcated lumen can be detected in ShotOE conditions. (A,B) btl >shotC-GFP embryos stained with CBP to mark lumen (white), anti-GFP to visualise Shot (green) and anti-CP309 antibody to mark centrosomes (magenta); the outline of TCs is drawn in yellow. The box in A is a magnification of the apical side, showing the TC centrosome pair (in magenta) and GFP positive Shot bundles (in grey) emanating from centrosomes. White stars indicate centrosomes apically localised. Note in B’ the subcellular lumen (magenta arrow) bifurcated in a point downstream from the centrosome pair. Anti-CP309 antibody stains all centrosomes throughout the embryo and not just in TCs and cross-reacts with an unidentified antigen at the subcellular lumen. (C) Quantification of centrosome number in wt, btl >shotC and Rca1 embryos ± SEM. (D) GB tips from Rca1; btl >shotC-GFP embryos at st.15, stained with CBP (in white) to visualise the lumen and E-cadherin (magenta) to recognise the TC apical junction. Anterior side of the embryo is on the left and ventral is down. Scale bar 2 μm. In these cases, it is possible to detect two types of luminal bifurcations: one from the apical junction (white arrow), caused by Rca1 mutant supernumerary centrosomes, and another one arising from a pre-existing lumen, induced by ShotOE. (E–H) Details of GB TCs at st.16 from embryos stained with anti-Gasp antibody to mark the lumen. (E) wt TCs with a single lumen each; (F) btl >shotC showing subcellular lumen bifurcations; (G) Rca1 showing subcellular lumen bifurcations; (H) Rca1; btl >shotC showing a multi-branched subcellular lumen. Anterior side of the embryo is on the left ventral midline is down. Scale bars 5 μm. (I) Quantification of the number of bifurcations (GB TCs) per embryo of the indicated genotype. ‘n bifurcations’ is the number of ESL per TC.
-
Figure 3—source data 1
Quantification of centrosome number and luminal phenotypes.
- https://cdn.elifesciences.org/articles/61111/elife-61111-fig3-data1-v2.xlsx
Figure 4 with 1 supplement
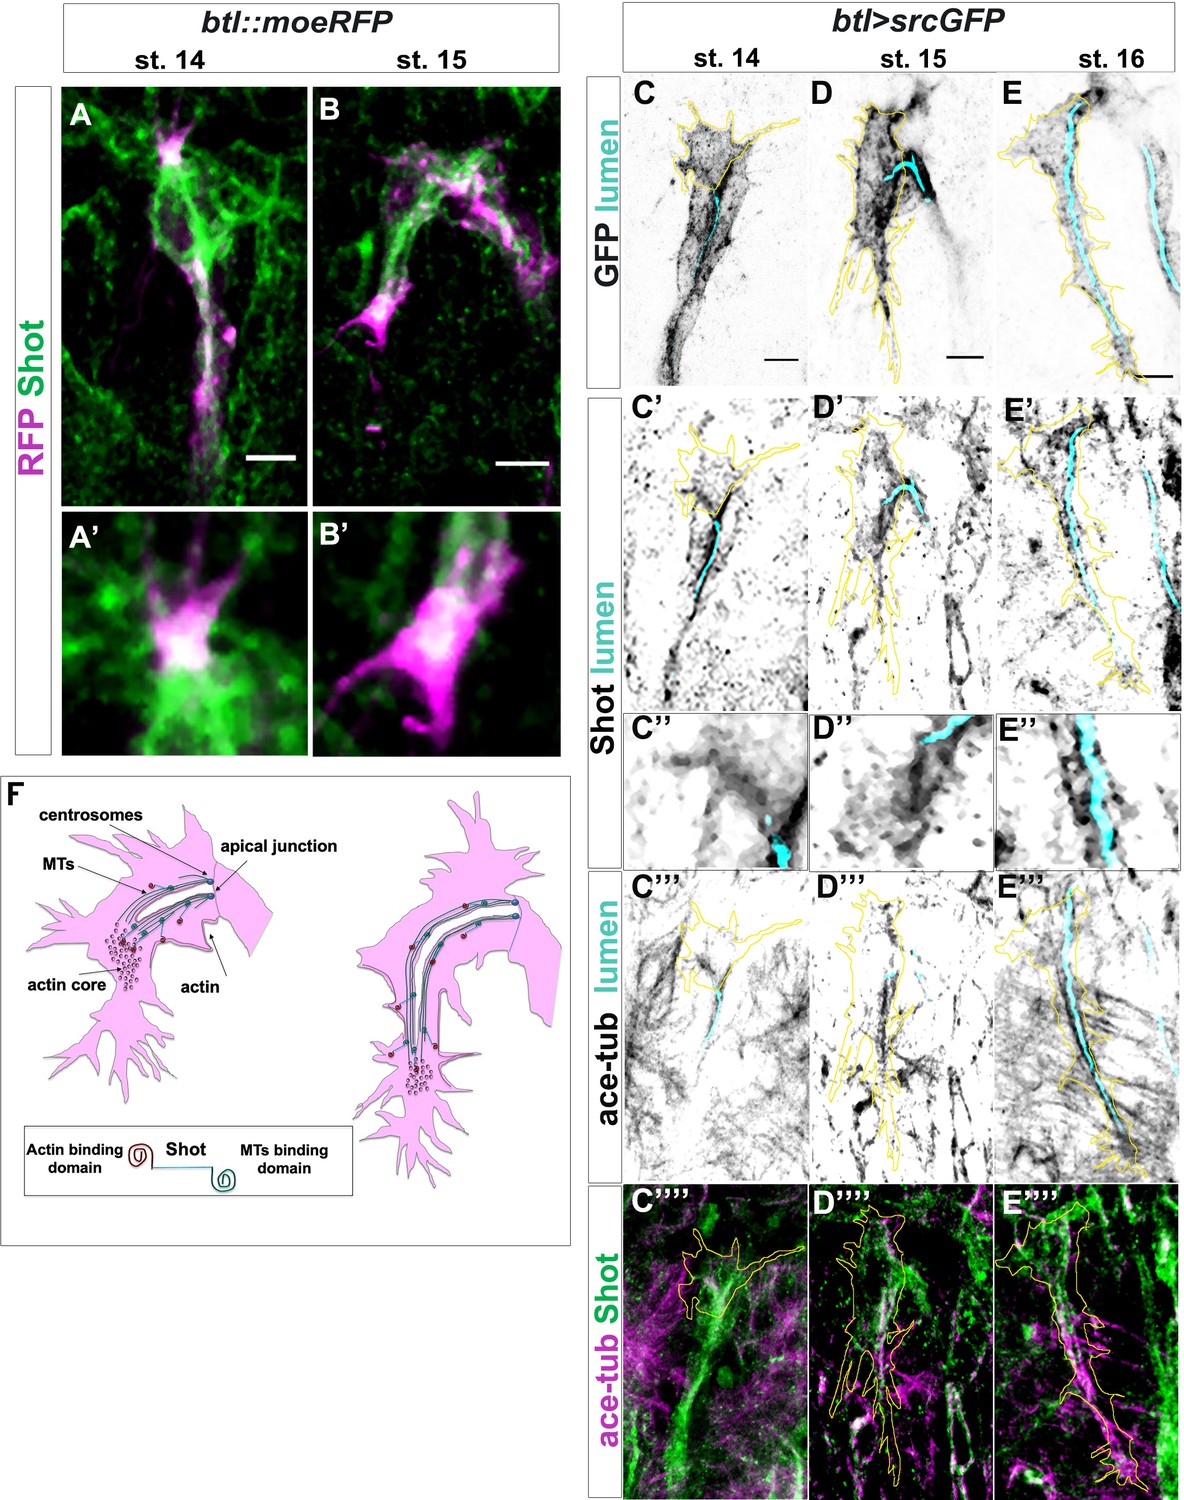
Shot colocalises with TC cytoskeletal components.
(A–B) Endogenous Shot, detected by an antibody in btl::moeRFP embryos, colocalised with actin during TC development. Tip of dorsal branches from st. 14 to late st. 15 of btl::moeRFP embryos stained with RFP (magenta) and Shot (green). In the magnification of the tip of the TCs (A’–B’) note Shot and RFP co-localisation in both embryonic stages. (C–E) Endogenous Shot accumulated around stable microtubules during subcellular lumen formation. The whole TC morphology changes overtime. This is a developing structure and both cell-shape and the cytoskeleton are changing throughout its development. Here we provide snapshots of different stages showing the beginning, middle and final stages of TC lumen formation. Dorsal TCs from fixed embryos btl >srcGFP stained with Shot and acetylated-tubulin antibodies and fluostain to detect chitin, from st.14 to st.16. GFP staining is showed in grey and cell contour in yellow (C–E), endogenous Shot is shown in grey in panels C’- E ‘’ (C’’- E’’ are magnification of C’- E’) and green C’’’’- E’’’’. Acetylated tubulin is in grey in C’’’- E’’’ and magenta in C’’’’ -E’’’’. The chitinous lumen was detected with fluostain, represented in cyan (C– E’’’). Acetylated tubulin and Shot are both accumulated ahead of the subcellular lumen at earliest stages (st. 14–15) and around the subcellular lumen at later stages (st.16). Note that co-localisation between acetylated tubulin and Shot is detected in the TCs. Anterior side is on the left, dorsal midline is up. Scale bar 5 μm. (F) Schematic representation of dorsal TC development from st.15 to st.16. Basal membrane in grey, apical membrane in light blue, subcellular lumen in white, the actin network in red and MTs are in green. Between st.14 and st.15 actin dots mature in an actin core in front of the tip of the subcellular lumen in formation that is surrounded by microtubules. Shot (represented on the bottom of the figure) was detected both inside the actin core and surrounding the lumen where stable MTs are organised.
Figure 4—figure supplement 1

Shot is dynamically localised in TCs and interacts with actin.
(A) Video 1 frames from the beginning of image acquisition to 180 min. Live embryos expressing ShotC-GFP in all tracheal cells. (B) Video 2 frames from the beginning of image acquisition to 180 min. Live embryos expressing ShotC-GFP and MoeRFP in all tracheal cells. (C) Video 3 frames from the beginning of image acquisition to 30 min. Live embryos expressing ShotA-GFP and lifeActinRFP in all tracheal cells.
Figure 5
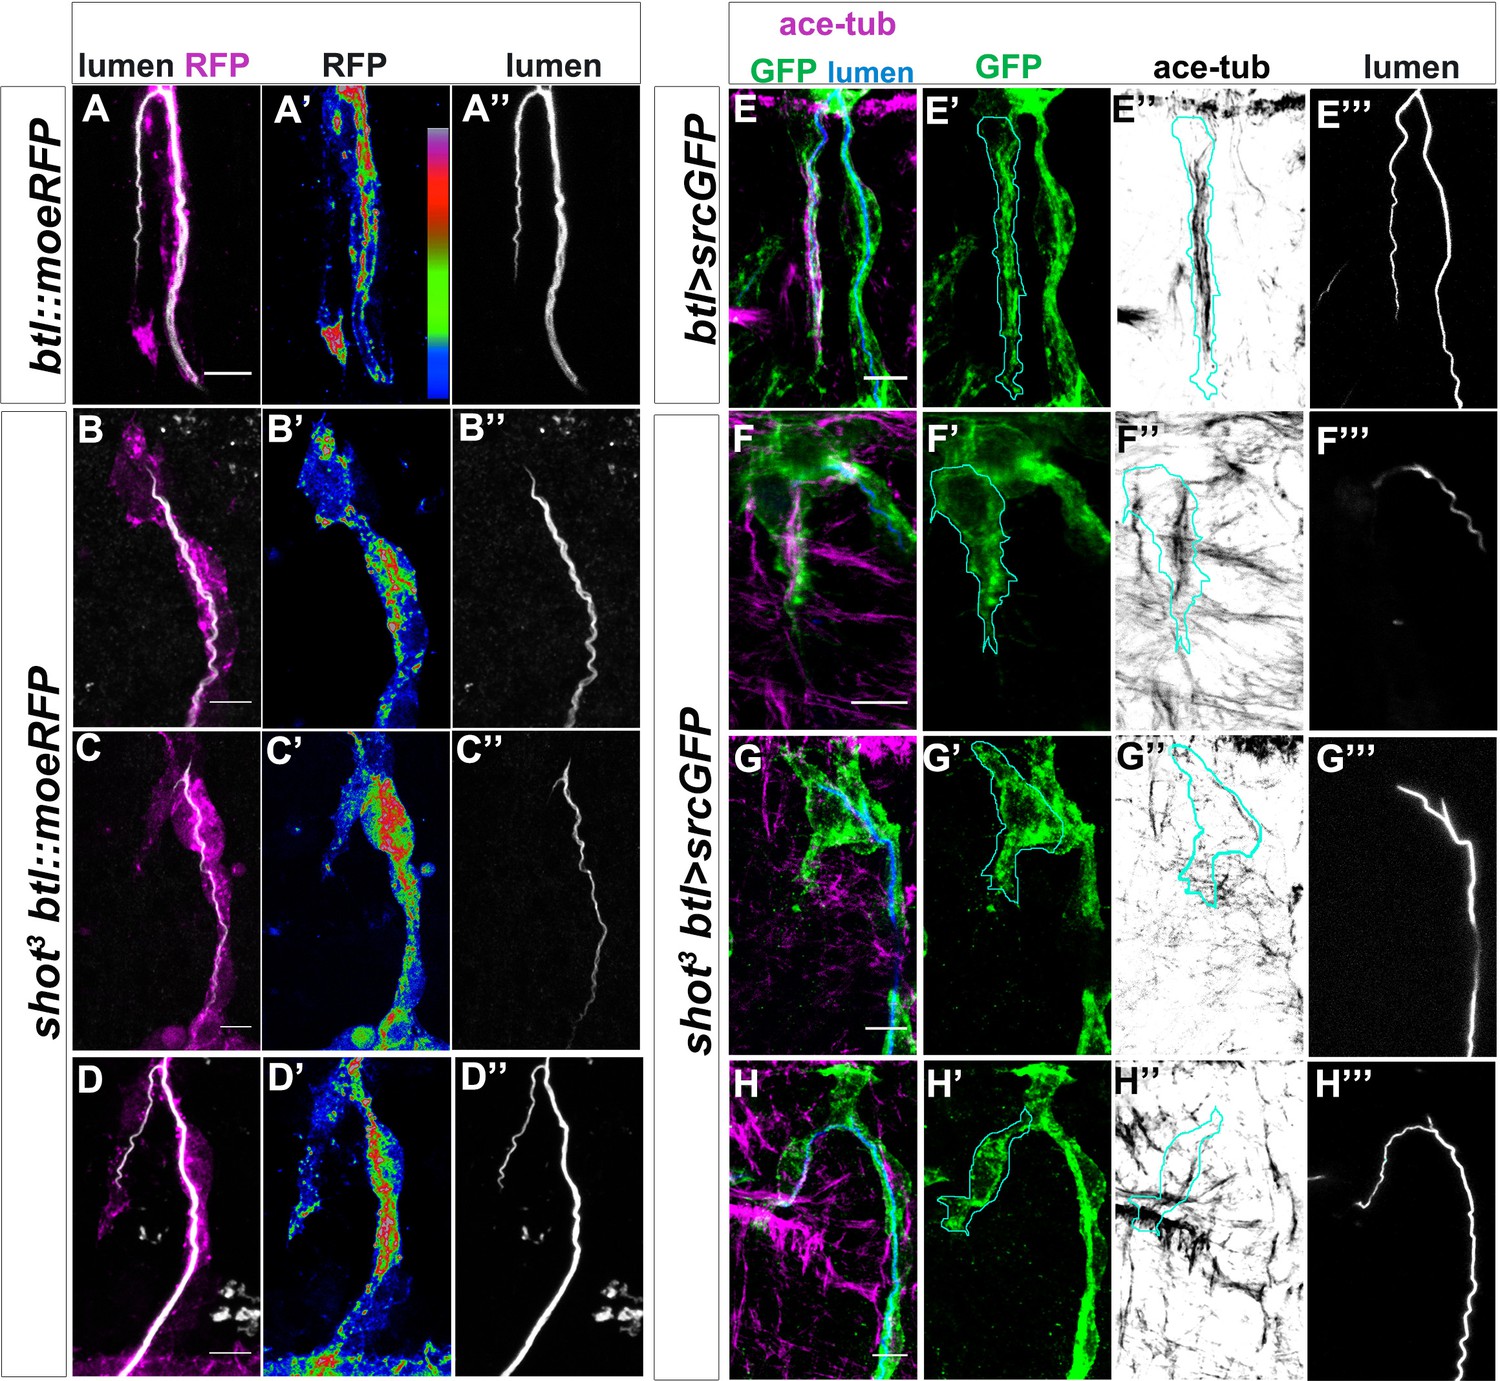
Shot LOF lead to disorganised MT-bundles and actin.
(A–D) Asymmetric actin accumulation in extended TCs was affected in shot3 mutant embryos. Dorsal TC from fixed shot3/+; btl::moeRFP controls (A) and shot3; btl::moeRFP mutant embryos (B–D), stained with RFP (Magenta in A-D or in a colour scale in which blue is low, green is middle and red high intensity in A’- D’) and CBP (in white). In shot mutant TCs actin appeared affected in its accumulation (B–D). (A) control; (B) when the cell was not elongated and the lumen was not formed; (C) when the cell was partially elongated and the lumen was not formed; (D) when the cell elongated and the lumen was partially formed (D). Note that actin was affected even when the cell was elongated and a lumen was partially formed. (E–H) TC MT-bundles in shot3. Dorsal TC from embryo at st.16 control (A) and shot3 mutant embryos (B–D) stained with GFP (green) acetylated tubulin (in magenta in E-H and in grey in E’’-H’’) and CBP (in blue in E-H and grey in E’’’-H’’’). The border of TC was drawn in cyan (E–H’’). In all cases, the organisation and the amount of stable MTs was strongly affected, in (F) MT-bundles were observed to be disorganised along the cytoplasmatic protrusion without subcellular lumen and in G and H only a thin track of MTs surrounds the subcellular lumen. Anterior side is on the left and dorsal midline is up. Scale bars 5 μm.
Figure 6 with 1 supplement
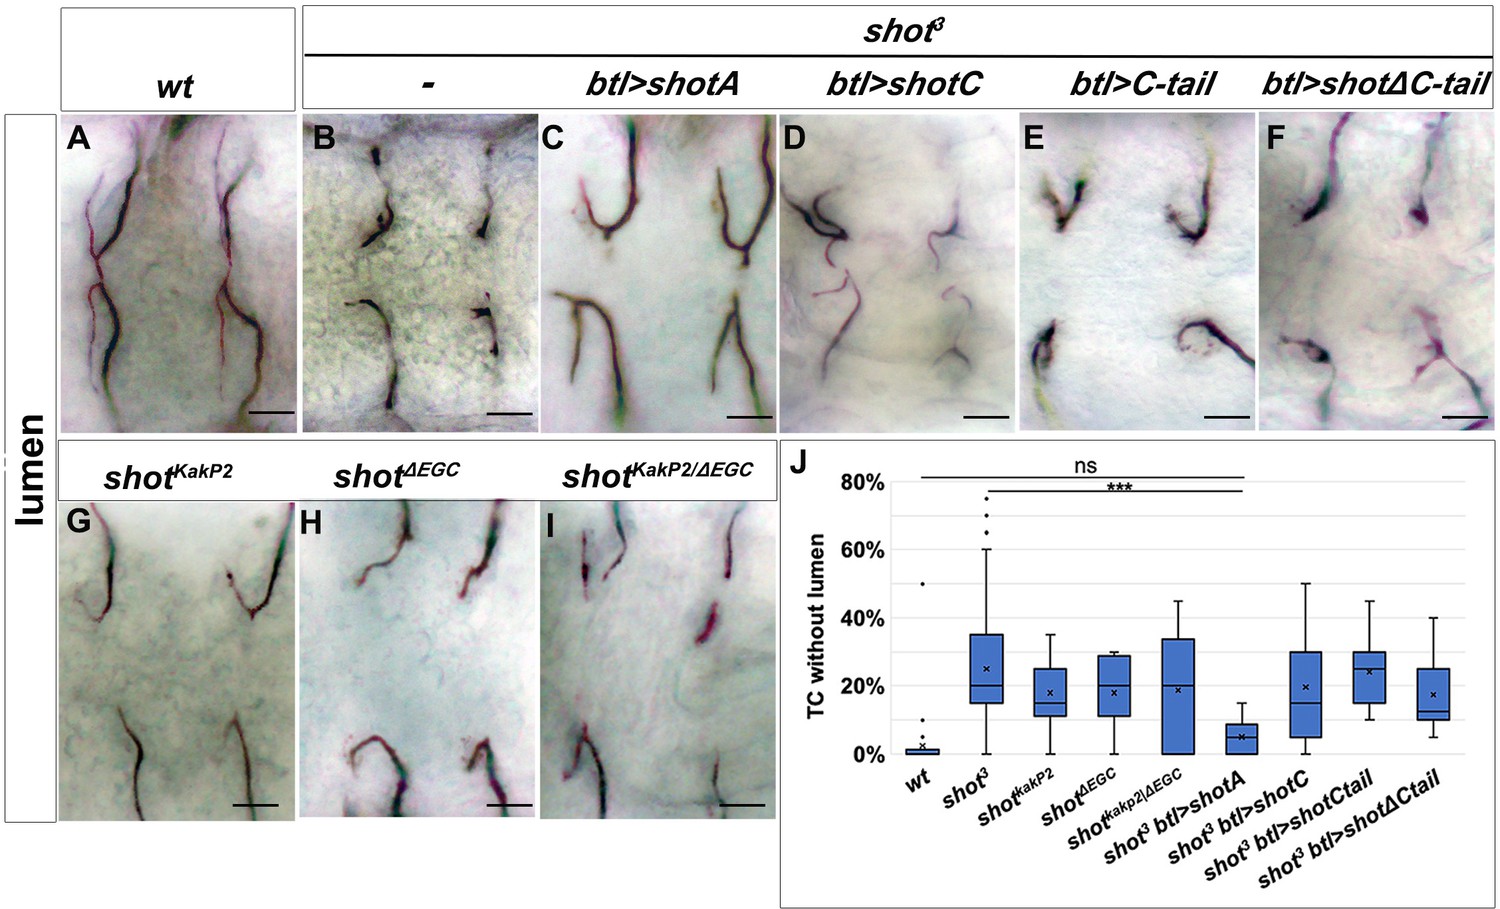
Shot Actin- and MT-binding domains are necessary for proper subcellular lumen formation.
(A–I) Dorsal branches of st.16 embryos, stained with anti-GASP to visualise the lumen. Genotype is indicated above each panel. Null allele, shot3, rescue experiments (B–F) indicate that both the actin-binding domain (ABD) and the microtubule-binding domain are involved in subcellular lumen formation since the only construct able to rescue the null allele phenotype is the UASShotA (B and J). Both functional domains are needed in the same molecule since mutants affected only in the ABD (shotKakP2) or in the microtubule-binding domain (shotΔEGD) and the transheterozygous shot KakP2/ΔEGD display the same phenotype as shot3. Scale bars are 10 µm. (J) Quantification of TCs without lumen: wt (n = 820); shot3 (n = 600); shotKakP2 (n = 400); shotΔEGD (n = 400); shot KakP2/ΔEGD (n = 320 TCs); shot3, btl >shotA (n = 240); shot3; btl >shotC (n = 240); shot3; btl >shotCtail (n = 240); shot3; btl >shotΔCtail (n = 240). *** p-value<0.001; ns refers to a p-value>0.1. Statistics by two-tailed Student’s t-test. Only ShotA significantly rescued the shot3 TC luminal phenotype.
-
Figure 6—source data 1
Quantification of rescue experiments and different shot mutant phentotypes and transheterozygous combinations.
- https://cdn.elifesciences.org/articles/61111/elife-61111-fig6-data1-v2.xlsx
Figure 6—figure supplement 1
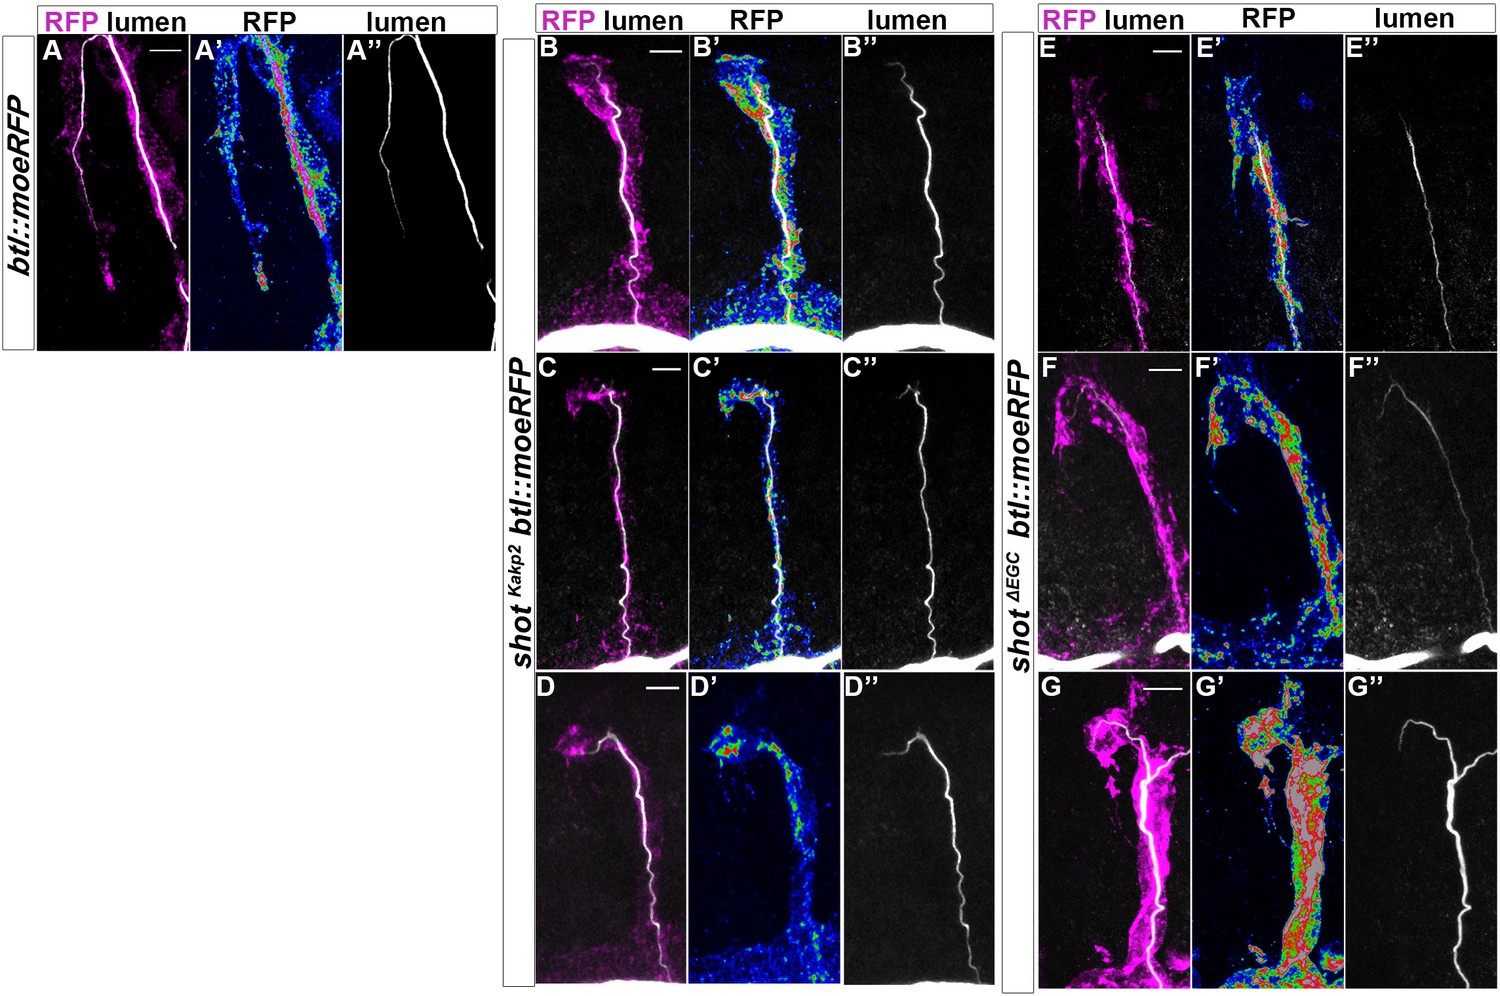
Asymmetric actin accumulation is affected in shot kakp2 and shot ΔEGC Dorsal TCs from btl::moeRFP.
(A) shotKAKP2; btl::moeRFP (B–D) and shotΔEGC; btl::moeRFP (E–G) embryos stained with RFP (magenta in A-G), in a colour scale in which blue is low, green in middle and red high pixel intensity (A’–G’) and CBP in grey (A–G and A’’–G’’). Similarly to shot3 null allele, actin organisation was impaired in all cases in both mutants (ranging from partially elongated TCs with subcellular lumen to cases in which the cell did not elongate and a subcellular lumen was not formed). Scale bars 5 μm.
Figure 7 with 1 supplement
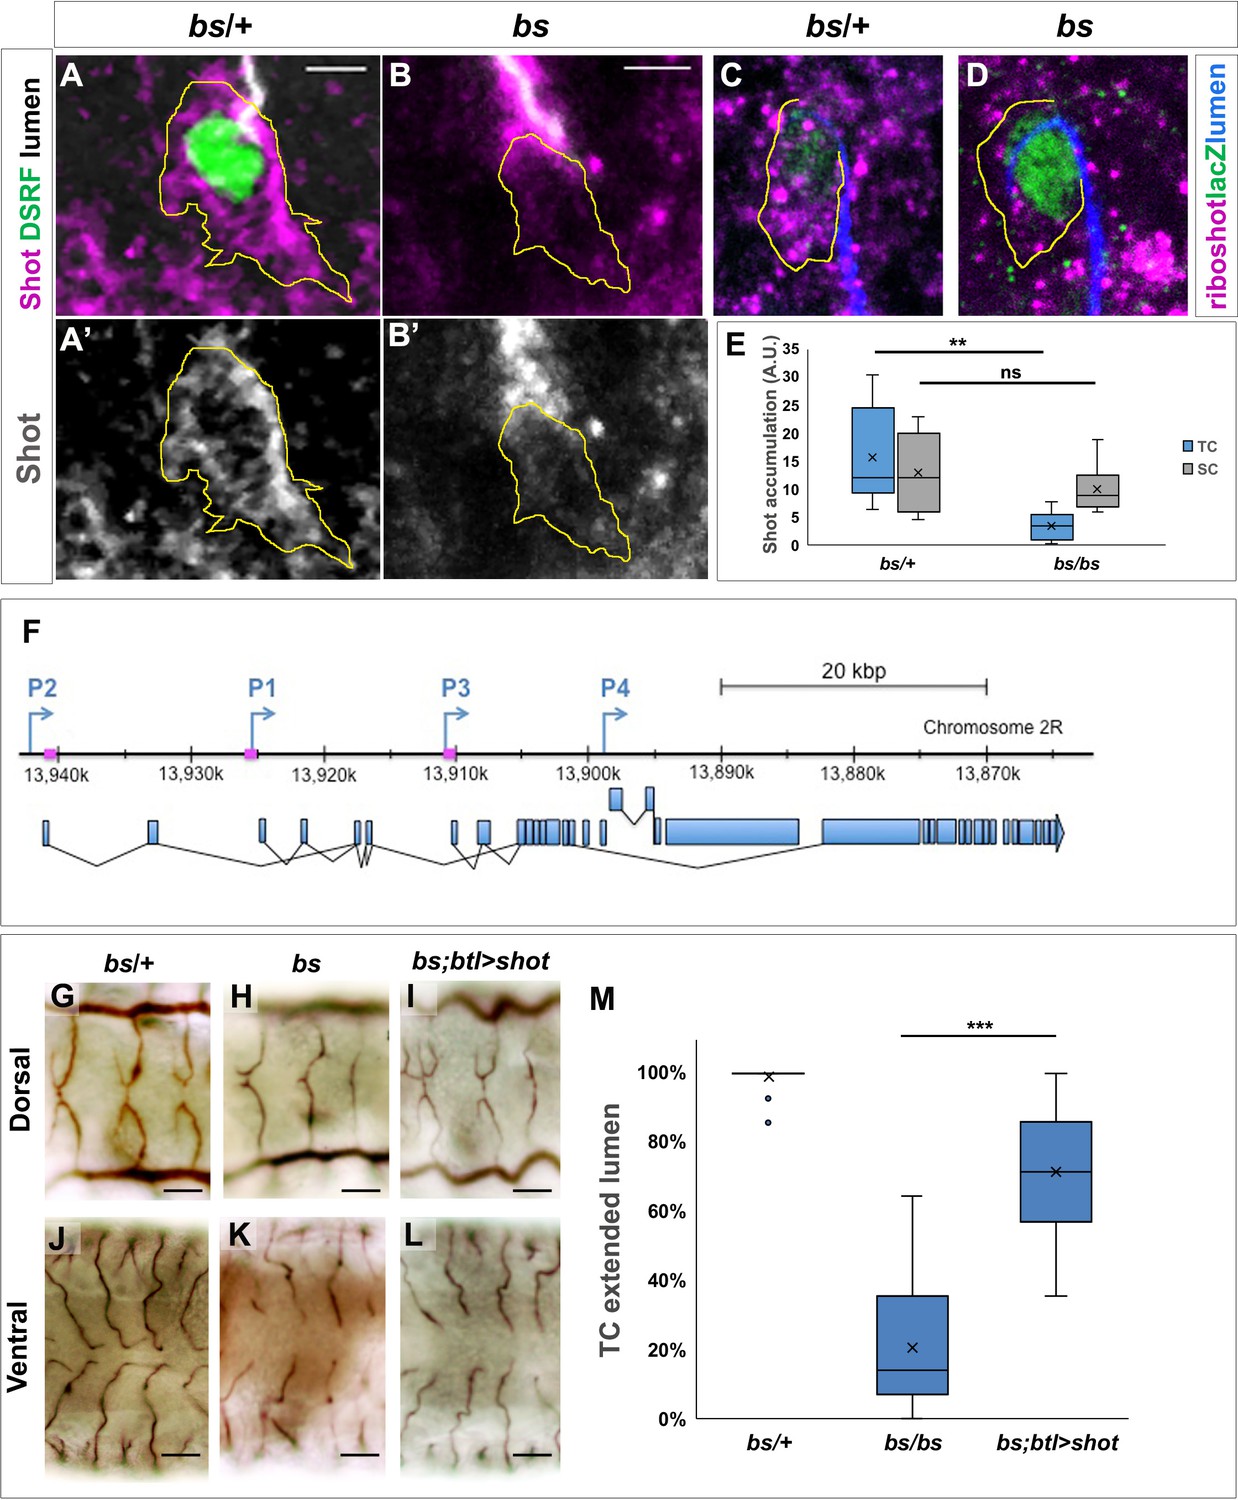
Shot expression is regulated by DSRF in TCs GB TC at st.15 from bs heterozygous controls.
(A) and homozygous (B) mutant embryos, stained with Shot (magenta in A and B, grey in A’ and B’), DSRF (green) antibodies and CBP (grey). In yellow, the outline of the TCs. Shot protein was less accumulated in TCs from homozygous bs embryos (B, B’ and E) n = 9 TCs. Scale bars are 5 µm. (C,D) DB TCs from bs heterozygous (C) control and homozygous (D) mutant embryos from wholemount FISH with a ribo-shot probe (magenta), stained with anti-betagal (green, to detect the DSRF enhancer trap lacZ expression) and CBP (blue) to mark the lumen. LacZ expression is higher in mutant embryos, homozygous for the lacZ P-element insertion (D). The yellow line marks the TC outline. Lower levels of shot mRNA were detected in bs mutant TCs when compared to control TCs (n = 8). Scale bars are 5 µm. (E) Quantification of Shot protein in control and mutant TCs and stalk cells (SC). Quantification of raw integrated pixel density in arbitrary units measured in Fiji in the TC and attached SC in each embryo. **p<0.01; ns refers to a p-value>0.1. Statistics by two-tailed Student’s t-test. (F) P1, P2 and P3 transcription start sites of the shot locus together with the specific sequences recognised by the DSRF transcription factor (squares in magenta) (adapted from Hahn et al., 2016). Dorsal and ventral TCs from control (G and J) bs (H and K) mutant embryos. The tracheal overexpression of Shot is sufficient to restore the growth of TC subcellular lumina in bs mutant background (I, L). (M) Quantification of TCs with an extended lumen: bs/+ (n = 350); bs/bs (n = 280) and bs/bs;btl >Shot (n = 210). *** p-value<0001. Statistics by two-tailed Student’s t-test.
-
Figure 7—source data 1
Quantification of blistered mutant phenotypes and rescue by Shot.
- https://cdn.elifesciences.org/articles/61111/elife-61111-fig7-data1-v2.xlsx
Figure 7—figure supplement 1
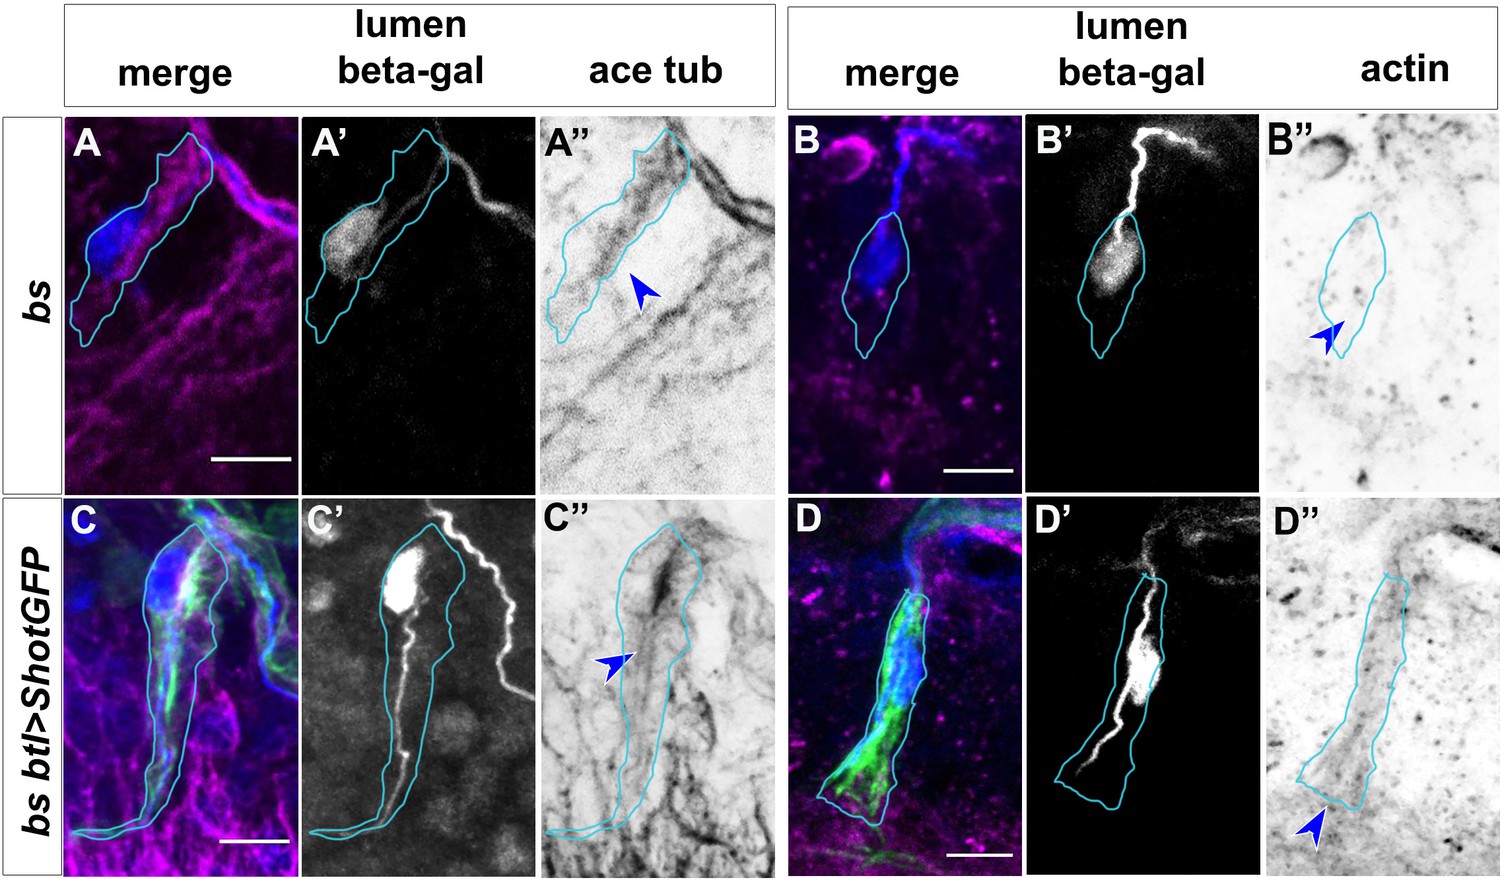
MTs and actin disorganisation in bs mutant TCs is rescued by Shot Dorsal.
(A and C) and ventral (B and D) TCs from bs embryos (A and B) and bs; btl >shotGFP (C and D) stained with anti β-gal antibody (blue in A – D, grey in A’ – D’) CBP probe (blue in A – D and grey in A’ – D’), anti-actin antibody (magenta in B and D, grey in B’’ and D’’) or anti-acetylated tubulin (magenta in A and C and grey in A’’ and C’’). Shot GFP is shown in green in merge panels (C and D). The cytoskeleton alterations observed in the actin and MT networks in bs mutant TCs (A and B), are partially restored with ShotOE (C and D, blue arrows). See control acetylated tubulin staining in Figure 5, panel E’’ and actin staining in Figure 8—figure supplement 3, panel A’’’. Anterior side is on the left and dorsal midline is up (A and C) or down (B and D). The shape of TC is highlighted in cyan. Scale bars 5 μm.
Figure 8 with 3 supplements

Shot and Tau functionally overlap during subcellular lumen formation.
(A–B) DB (A) and GB (B) embryonic TCs expressing tauGFP in the tracheal system, stained with GFP (green), CBP (white) and DSRF (magenta), showing the ESL phenotype induced by Tau overexpression. In A’ in B’ lumen and TC nuclei are shown, anterior side on the left, dorsal side is up; scale bar 5 μm. (C) Quantification of TCs with ESL in embryos overexpressing GFP (n = 240); ShotA (n = 400); one copy of btl >tauGFP (n = 440) or two copies of btl >tauGFP (n = 300). ***p-value<0.001; ns refers to a p-value>0.1. Statistics by two-tailed Student’s t-test. (D) Quantification of TCs without subcellular lumen in control (n = 820), shot3(n = 600), tau[MR22] (n = 180), shot3; tau[MR22](n = 180), shot3; btl >Tau (n = 440) and shot3; btl >Tau btl >Tau (n = 260) embryos. ***p-value<0.001; ns refers to a p-value>0.1. Statistics by two-tailed Student’s t-test. (E–J) Dorsal view of TCs from st. 16 embryos (genotype indicated) stained with anti-Gasp. tau deletion mutant does not display a subcellular lumen phenotype (D and F) but enhances the effect of shot mutation in the double mutant shot3; tau[MR22]. One copy of Tau is not sufficient to rescue shot3 (D and I, n = 400) but two copies rescues the shot LOF TC phenotype (D and J n = 260). Scale bars 10 µm. (K) Tau is detected in embryonic TCs. Embryonic shot::GFP dorsal TC stained with GFP (green in K, grey in K’), anti-Tau antibody (magenta in K, grey in K’) and CBP (blue in K grey in K’). Scale bar 5 μm.
-
Figure 8—source data 1
Quantification of tau mutant and overrexpression phenotypes and rescues.
- https://cdn.elifesciences.org/articles/61111/elife-61111-fig8-data1-v2.xlsx
Figure 8—figure supplement 1
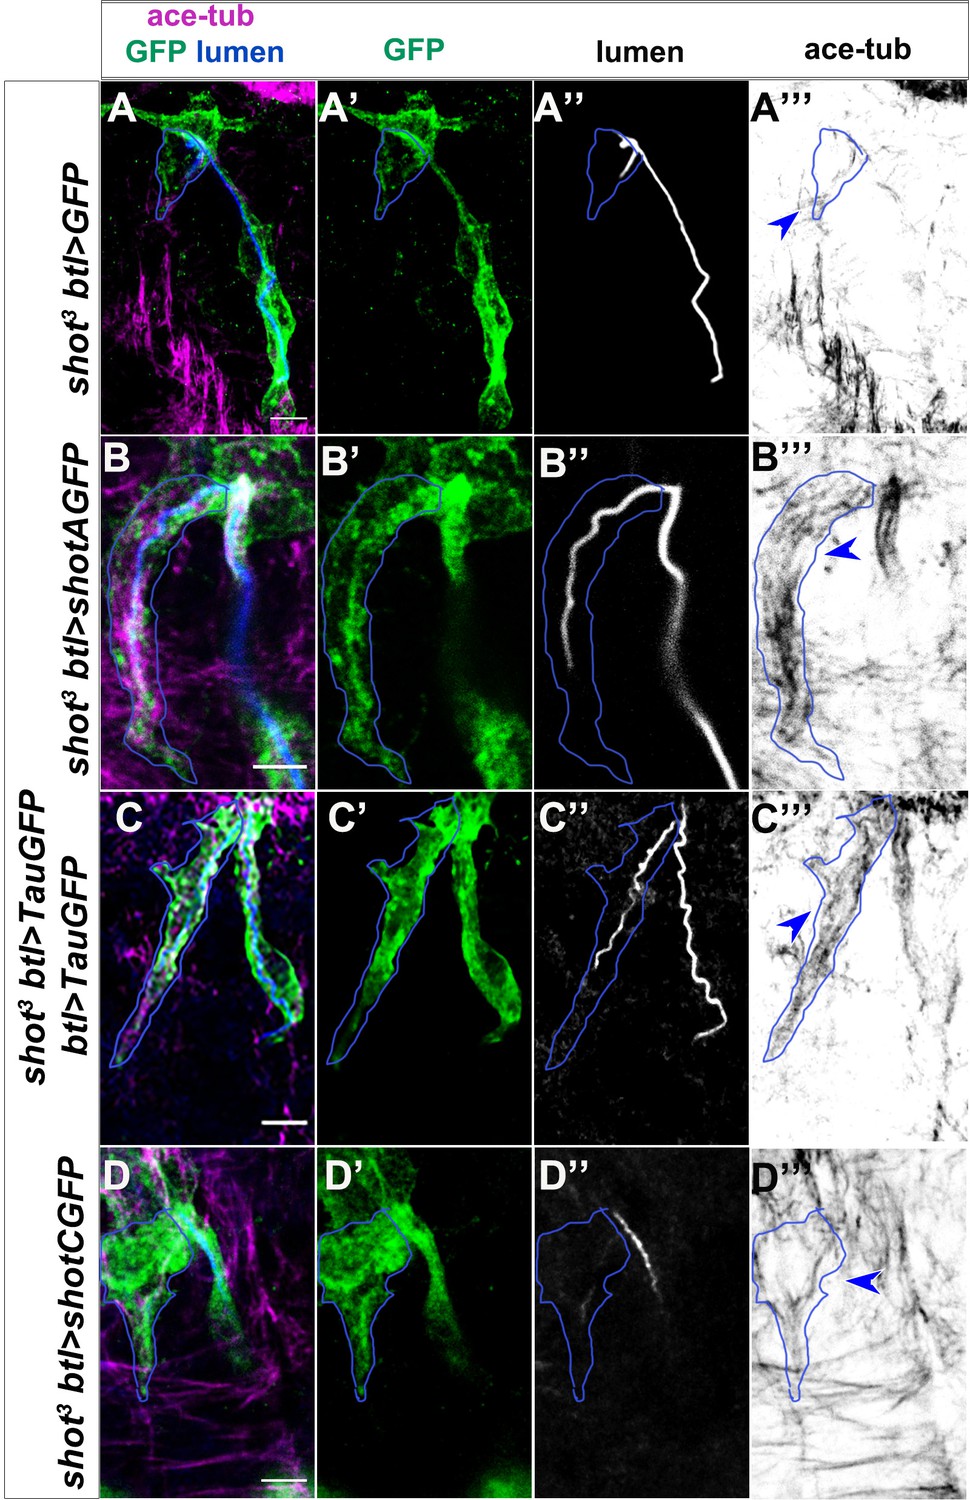
MT disorganisation in shot mutant TCs is rescued by ShotA and Tau, but not ShotC.
Dorsal TCs from shot3;btl >GFP (A–A’’’); shot3; btl >shotAGFP (B–B’’’) shot3; 2Xbtl > TauGFP; (C–C’’’); and shot3; btl >shotCGFP (D–D’’’) embryos, stained with anti-GFP antibody (green in A–D’), CBP blue in A–D and grey (A’’–D’’) and anti-acetylated-tubulin antibody (magenta in A–D and grey in A’’’–D’’’). The MT network (control embryos Figure 5, panel E’’) disrupted in shot3 mutant TCs (A’’’), is partially restored in shot3;btl >shotA (B’’’) TCs and well reorganised in shot3 embryos overexpressing two copies of Tau-GFP (C’’’) but not in shot3,btl >shotC embryos (D’’’) (blue arrows). Anterior side is on the left and dorsal midline is up. The outline of TC is sketched in blue. Scale bar 5 μm.
Figure 8—figure supplement 2
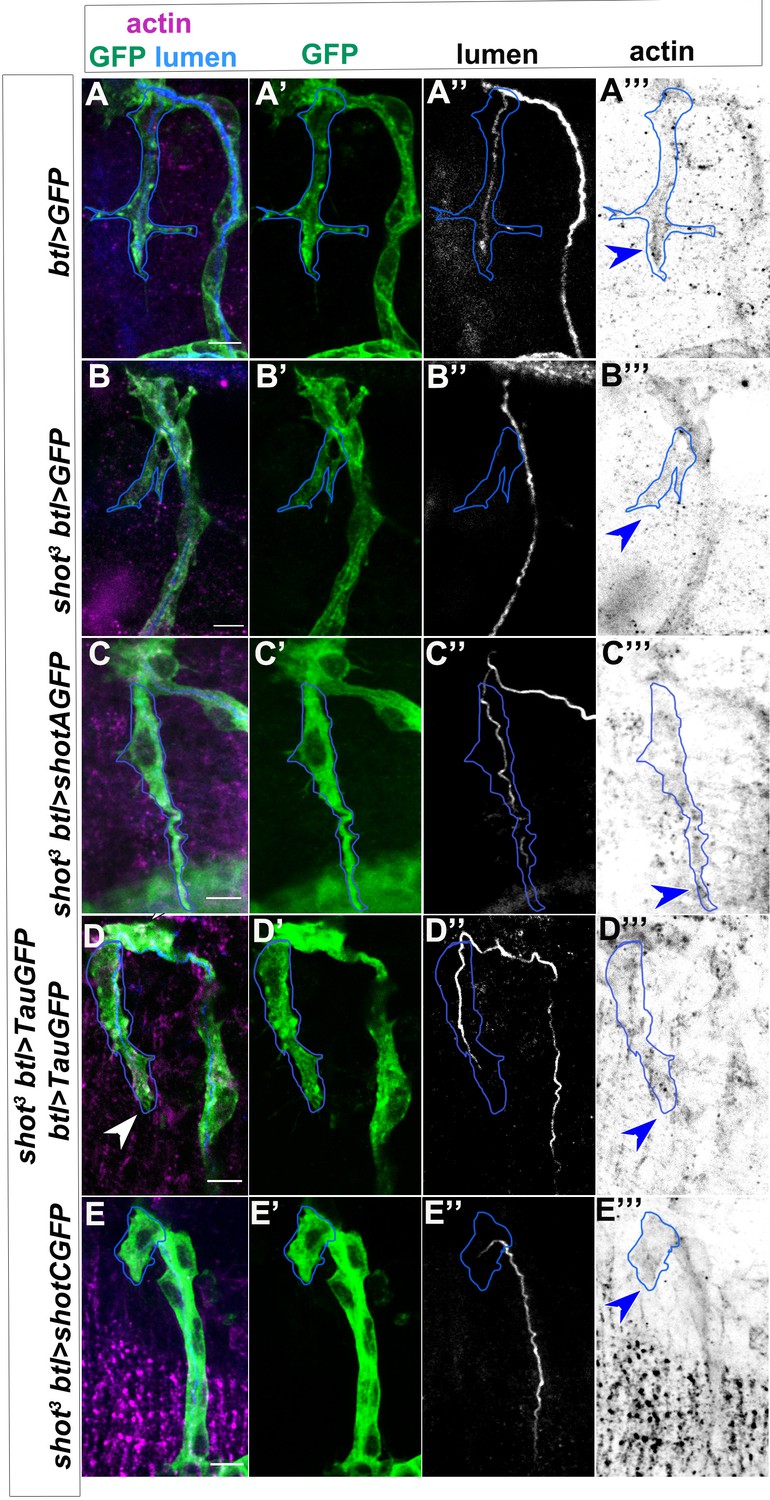
Actin disorganisation in shot mutant TCs is rescued by ShotA and Tau, but not ShotC.
Dorsal TCs from btl >GFP used as control (A–A’’’); shot3; btl >GFP (B–B’’’); shot3; btl >shotAGFP (C–C’’’); shot3;2Xbtl > TauGFP (D–D’’’) and shot3; btl >shotCGFP embryos, stained with anti-GFP antibody (green in A –E’), CBP (blue in A –E and grey in A’’–E’’) and anti-actin antibody (magenta in A – E and grey in A’’’–E’’’). The actin accumulation at the tip of TC (A’’’), disrupted in shot3 mutant TCs (B’’’), is restored in shot3 TCs overexpressing ShotA (C’’’) or two copies of Tau (D’’’), but not in shot3;btl >shotC embryos (E’’’), (see blue arrows). Anterior side is on the left and dorsal midline is up. The outline of TC is sketched in blue. Scale bar 5 μm.
Figure 8—figure supplement 3
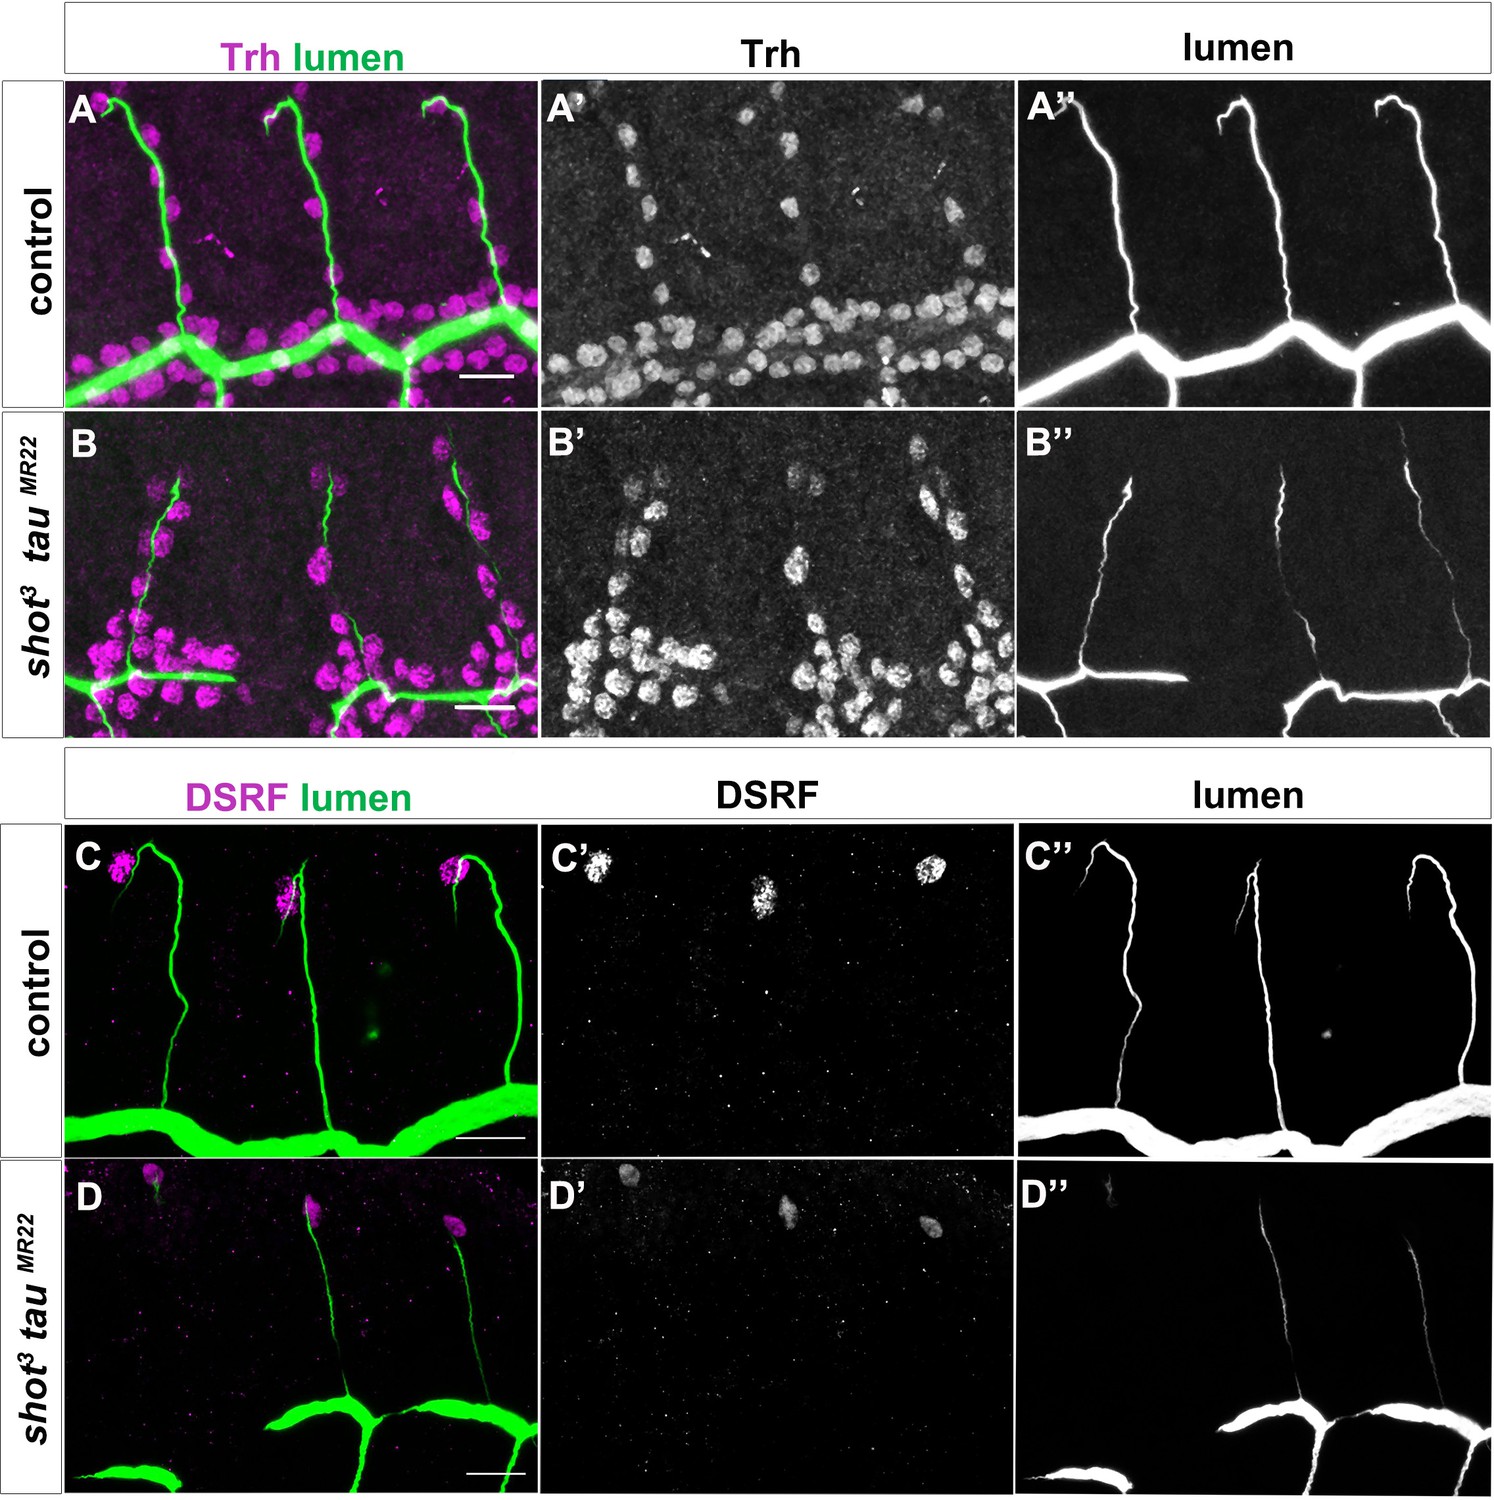
Double shot3;tauMR22 mutant embryos display defects in lumen formation but not in tracheal cell number or TC fate.
Dorsal branches of wt (A) and shot3; tau [MR22] embryos st.15 (B) stained with trachealess (trh) antibody to visualise all tracheal cell nuclei (magenta in A and B, grey in A’ and B’) and CBP to visualise the lumen (green in A and B, grey in A’’ and B’’) (n = 17 TCs) or wt (C) and shot3; tau [MR22] (D) stained with DSRF magenta in C and D (grey in C’ and D’) and CBP green in C and D and grey in C’’ and D’’ (n = 8 TCs). Dorsal view. Scale bar 10 μm.
Figure 9
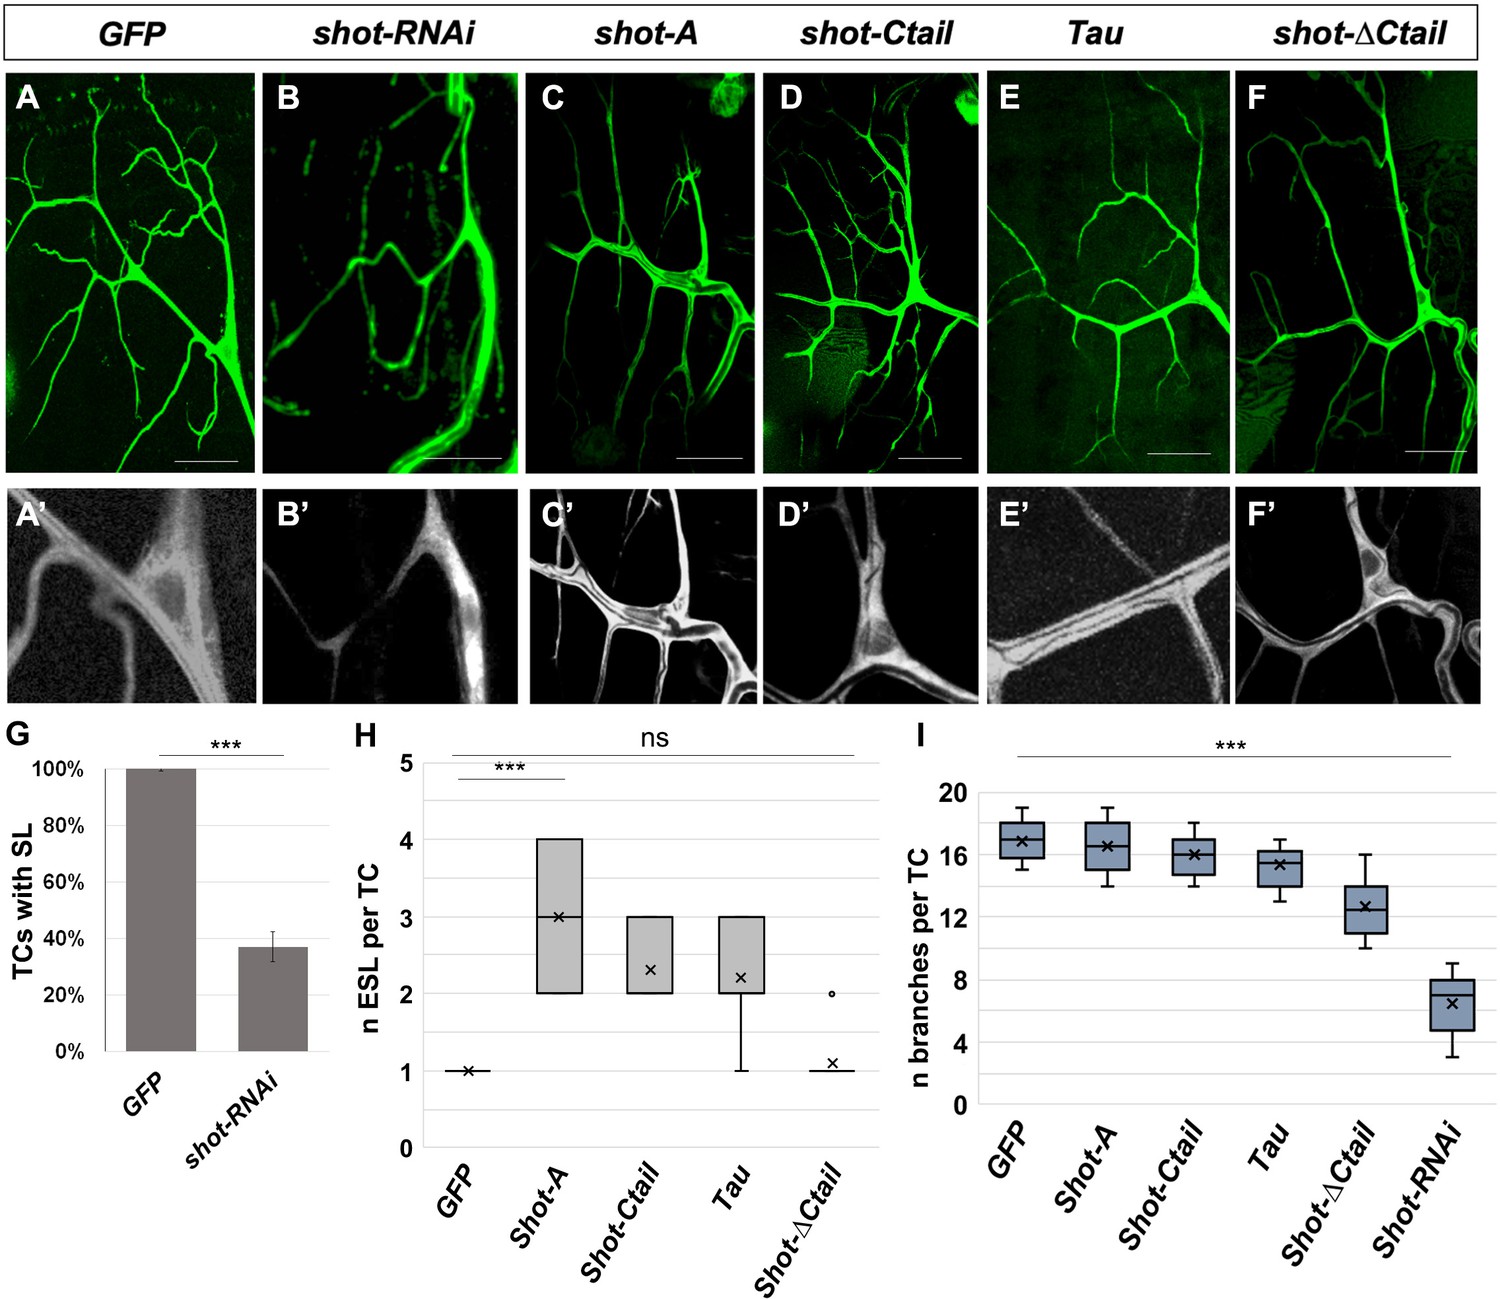
Shot and Tau modulate luminal branching in larval TCs.
Wandering larval (L3) TCs expressing only GFP (A) and different Shot and Tau constructs (B, C, D, E, F) under the control of a tracheal DSRFGAL4 driver (all except A and E where the driver used was btlGAL4). (A, A’) UASGFP (n = 8) (B, B’) UASshotRNAi, UASGFP (n = 8); (C, C’) UASShotA-GFP (n = 10); (D, D’) UASshotCtail-GFP (n = 8); (E, E’) UASTauGFP (n = 8); (F,F’) UASshot∆Ctail-GFP (n = 8). Scale bars 50 μm. (G) Quantification of the percentage of TCs with subcellular lumen; (H) quantification of the number of ESL per TC; (I) quantification of the number of branches per larval TC. *** represent a p-value<0.001; ns refers to a p-value>0.1. Statistics by two-tailed Student’s t-test.
-
Figure 9—source data 1
Quantification of larval branching phenotypes.
- https://cdn.elifesciences.org/articles/61111/elife-61111-fig9-data1-v2.xlsx
Figure 10
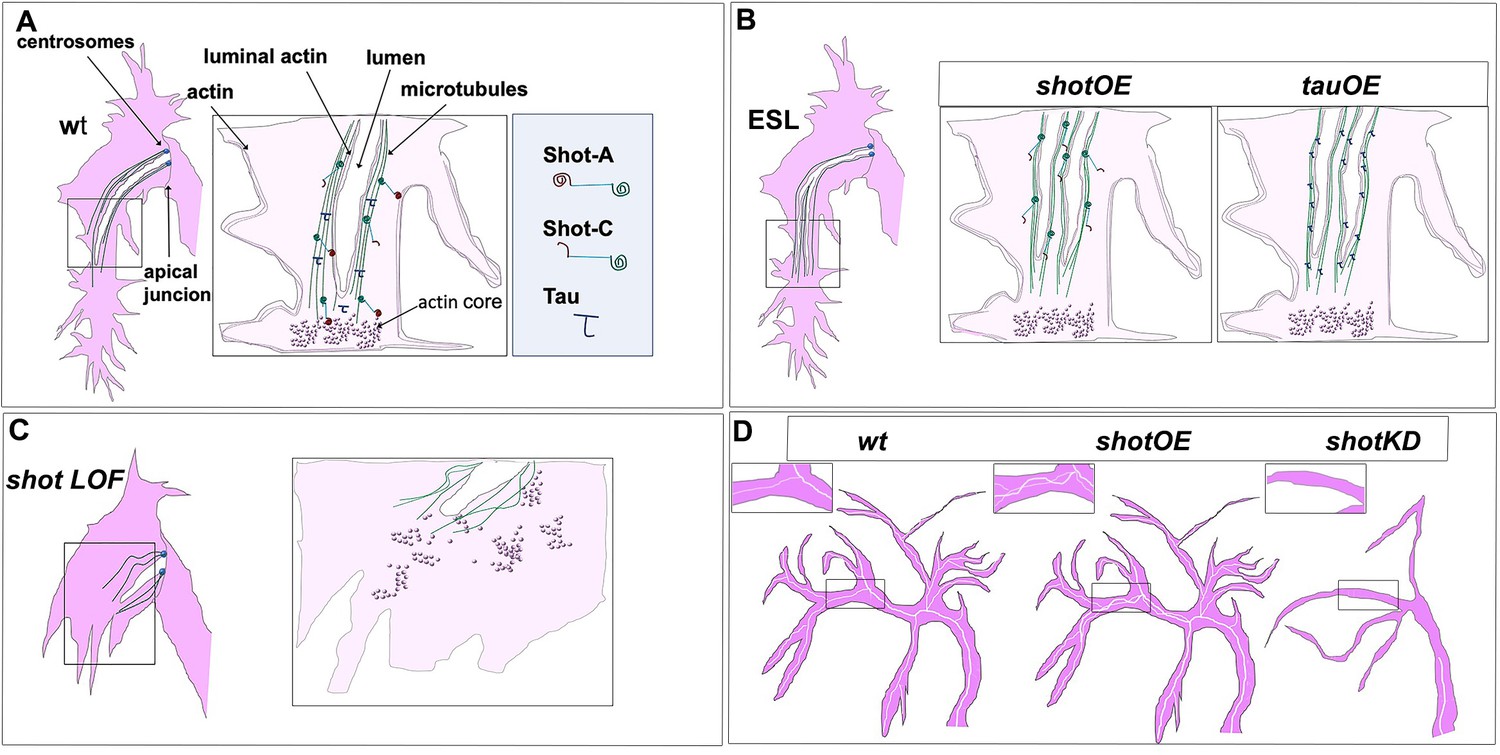
Shot and Tau dynamically modulate the cytoskeleton during subcellular lumen formation.
Schematic representation of st.16 embryonic (A, B, C) and third instar larval (D) TCs; cytoplasm is in pink and luminal space in white. (A) Cytoskeletal components in a wt embryo with the actin-network (dark pink) and MTs (green). Shot and Tau are able to organise the cytoskeleton by crosslinking MTs and actin; Shot (represented with the actin domain in red and the MT-binding domain in green) mediates the crosstalk between actin and MTs as the longer isoform (ShotA), but shorter isoforms lacking part of the ABD were reported not to bind/or very weakly bind actin (ShotC). Tau is represented in blue. (B) ESLs are formed by overexpressing shot or tau by an excess of MT stabilisation from the pre-existing lumen, which probably acts as a MTOC in this case. ESLs can be induced by Shot isoforms with affected (ShotC) or without ABD (ShotC-tail). (C) In the absence of the longer isoform of Shot (ShotA) proper cytoskeletal organisation, is not established, by defective MT-actin crosslinking, and cell elongation and lumen formation fail to occur. (D) Schematic representation of larval TCs in wt, in shotOE (or tauOE) where ESLs are formed without concomitant single-cell branching and in shot KD, where both single-cell and luminal branching are reduced.
Videos
Video 1
Shot localisation within the TCs is dynamic and accompanies the growing subcellular lumen.
In vivo Shot localisation during lumen formation in two wild-type ganglionic branch (GB) TCs. Time-lapse images of a wt embryo expressing btlGAL4UASShotC-GFP visualised from a dorsal view. Note the accumulation of Shot at the apical junction of the TC and subsequently in association with subcellular lumen extension. Frames were taken every minute for 3.5 hr.
Video 2
Shot localises with the extending subcellular lumen in TCs during subcellular lumen extension.
In vivo Shot colocalisation with actin during lumen formation in a wild-type dorsal branch (DB) TC. Time-lapse images of a wt embryo expressing btlGAL4UASShotC-GFP; btl::moeRFP visualised from a dorsal view. Note the colocalisation of Shot with actin the apical junction of the TC. As the cell extends, ShotC localises to the growing lumen and there is no detectable strong association with the actin core and filopodial actin. Frames were taken every 2 min for 3.3 hr.
Video 3
Shot localises with actin in TCs during the early steps of subcellular lumen extension.
In vivo Shot long-isoform colocalisation with actin during lumen formation in a wild-type dorsal branch (DB) TC. Time-lapse images of a wt embryo expressing btlGAL4UASShot-A-GFPUASlifeActRFP visualised from a dorsal view. Note the colocalisation of Shot with actin at the apical junction of the TC and subsequent association with the actin core and filopodial actin during subcellular lumen extension. Frames were taken every 40 s for 32 min.
Video 4
Shot localises with actin in TCs during later steps of subcellular lumen extension.
In vivo Shot long-isoform colocalisation with actin during lumen formation in a wild-type dorsal branch (DB) TC. Time-lapse images of a wt embryo expressing btlGAL4UASShotA-GFP; btl::moeRFP visualised from a dorsal view. Note the colocalisation of Shot with filopodial actin during subcellular lumen extension. Frames were taken every 30 s for 36 min.
Tables
Key resources table
| Reagent type (species) or resource | Designation | Source or reference | Identifiers | Additional information |
|---|---|---|---|---|
| Genetic reagent (D. melanogaster) | shot3 | Bloomington Drosophila Stock Center | BSDC:2282 FBst0005141 | Lee et al., 2000 |
| Genetic reagent (D. melanogaster) | shotkakP2 | Bloomington Drosophila Stock Center | BSDC:29034 FBst0029034 | Gregory and Brown, 1998 |
| Genetic reagent (D. melanogaster) | shotΔEGC | F. Jankovics | - | Takács et al., 2017 |
| Genetic reagent (D. melanogaster) | Rca1G012 | S.J. Araújo | - | Ricolo et al., 2016 |
| Genetic reagent (D. melanogaster) | tau[MR22] | Bloomington Drosophila Stock Center | BDSC:9530 FBst0009530 | Doerflinger et al., 2003 |
| Genetic reagent (D. melanogaster) | bs0326 | BSDC:83157 FBst0083157 | Guillemin et al., 1996 | |
| Genetic reagent (D. melanogaster) | btl::moeRFP | M. Affolter | - | Ribeiro et al., 2004 |
| Genetic reagent (D. melanogaster) | btl-Gal4 | M. Affolter | - | - |
| Genetic reagent (D. melanogaster) | DSRF4X-Gal4 | A.Ghabrial M. Metzstein | - | - |
| Genetic reagent (D. melanogaster) | UAS-shot L(A) GFP | Bloomington Drosophila Stock Center | BDSC:29044 (FBst0029044) | Lee and Kolodziej, 2002a |
| Genetic reagent (D. melanogaster) | UAS-shot L(C)-GFP | Bloomington Stock Center | BDSC:29042 FBst0029042 | Lee and Kolodziej, 2002a |
| Genetic reagent (D. melanogaster) | UAS-shot L(C)-GFP | Bloomington Stock Center | BDSC:29043 FBst0029043 | Lee and Kolodziej, 2002a |
| Genetic reagent (D. melanogaster) | UAS-shot-LA-ΔCtail-GFP | N. Sanchez-Soriano | - | Alves-Silva et al., 2012 |
| Genetic reagent (D. melanogaster) | UAS-shot-LA-Ctail-GFP | N. Sanchez-Soriano | - | Alves-Silva et al., 2012 |
| Genetic reagent (D. melanogaster) | UAS-TauGFP | M. Llimargas | - | Llimargas et al., 2004 |
| Genetic reagent (D. melanogaster) | UAS-bazooka YFP | J. Casanova | - | Gervais and Casanova, 2010 |
| Genetic reagent (D. melanogaster) | UAS-srcGFP | Bloomington Stock Center | BDSC 5432 FBti0013990 | Kaltschmidt et al., 2000 |
| Genetic reagent (D. melanogaster) | UAS-shot RNAi | Bloomington Stock Center | BSSC_64041 FBst0064041 | Perkins et al., 2015 |
| Genetic reagent (D. melanogaster) | UAS-lifeActRFP | Bloomington Stock Center | BDSC:58715 FBti0164961 | - |
| Genetic reagent (D. melanogaster) | shot::GFP | J.Pastor-Pareja | - | Sun et al., 2019 |
| Antibody | mouse anti GASP | DSHB | ID: AB_528492 2A12 | 1:5 |
| Antibody | rat anti DE-cad | DSHB | ID:AB528120 DCAD2 | 1:100 |
| Antibody | guinea Pig anti CP309 | V. Brodu | - | 1:1000 |
| Antibody | rabbit and rat anti DSRF | J. Casanova | - | 1:500 |
| Antibody | goat anti-GFP | Abcam | Catalog # AB6673 | 1:500 |
| Antibody | rabbit anti-GFP | Invitrogen | Catalog # A11122 | 1:500 |
| Antibody | chicken anti-βgal | Abcam | Catalog # AB134435 | 1:500 |
| Antibody | mouse anti-βgal | Promega | Catalog # 23783 | 1:500 |
| Antibody | mouse antiacetylated tubulin | Millipore | Catalog # 3408 | 1:100 |
| Antibody | guinea pig anti Shot | K. Röper | - | 1:1000 |
| Antibody | mouse anti-Tau-1 | Sigma-Aldrich | Catalog # MAB3420 Clone PC1C6 | 1:200 |
| Antibody | mouse anti-Actin | MP Biomedicals | Catalog # 691001 | 1:500 |
| Antibody | anti-dig POD fragments | Roche | Catalog # 11 207 733 910 | 1:1000 |
| Antibody | Goat Anti-Mouse Cy3 (Polyclonal) | Jackson ImmunoResearch | Catalog # 115-165-003 | 1:500 |
| Antibody | Goat anti-Mouse Alexa555 (Polyclonal) | LIFE TECHNOLOGIES/Thermofisher Scientific | Catalog # A-21424 | 1:500 |
| Antibody | Goat anti-mouse Alexa488 (Polyclonal) | LIFE TECHNOLOGIES/Thermofisher Scientific | Catalog # A11029 | 1:500 |
| Antibody | Donkey anti mouse Alexa647 (Polyclonal) | LIFE TECHNOLOGIES/Thermofisher Scientific | Catalog # A31571 | 1:500 |
| Antibody | Goat anti-chicken Alexa555 (Polyclonal) | LIFE TECHNOLOGIES/Thermofisher Scientific | Catalog # A-21437 | 1:500 |
| Antibody | Goat anti-chicken Alexa488 (Polyclonal) | LIFE TECHNOLOGIES/Thermofisher Scientific | Catalog # A-11039 | 1:500 |
| Antibody | Goat anti-chicken Alexa Fluor 647 (Polyclonal) | LIFE TECHNOLOGIES/Thermofisher Scientific | Catalog # A-21449 | 1:500 |
| Antibody | Goat anti-rabbit Alexa 555 (Polyclonal) | LIFE TECHNOLOGIES/Thermofisher Scientific | Catalog # A-21429 | 1:500 |
| Antibody | Goat anti-rabbit Alexa488 (Polyclonal) | LIFE TECHNOLOGIES/Thermofisher Scientific | Catalog # A11008 | 1:500 |
| Antibody | goat anti-rabbit Alexa647 (Polyclonal) | LIFE TECHNOLOGIES/Thermofisher Scientific | Catalog # A-21244 | 1:500 |
| Antibody | Goat anti-guinea pig Cy2 (Polyclonal) | Jackson ImmunoResearch | Catalog # 706-225-148 | 1:500 |
| Antibody | Goat anti-guinea pig 647 (Polyclonal) | LIFE TECHNOLOGIES/Thermofisher Scientific | Catalog # A-21244 | 1:500 |
| Antibody | Donkey anti- mouse Alexa 555 (Polyclonal) | LIFE TECHNOLOGIES/Thermofisher Scientific | Catalog # A31570 | 1:500 |
| Antibody | Donkey anti- mouse Alexa488 (Polyclonal) | LIFE TECHNOLOGIES/Thermofisher Scientific | Catalog # A-21202 | 1:500 |
| Antibody | Donkey anti- mouse Alexa647 (Polyclonal) | LIFE TECHNOLOGIES/Thermofisher Scientific | Catalog # A31571 | 1:500 |
| Antibody | Donkey anti- rabbit Alexa555 (Polyclonal) | LIFE TECHNOLOGIES/Thermofisher Scientific | Catalog # A31572 | 1:500 |
| Antibody | Donkey anti- rabbit Alexa488 (Polyclonal) | LIFE TECHNOLOGIES/Thermofisher Scientific | Catalog # A-21206 | 1:500 |
| Antibody | Donkey anti- rabbit Alexa647 (Polyclonal) | LIFE TECHNOLOGIES/Thermofisher Scientific | Catalog #A31573 | 1:500 |
| Antibody | Donkey anti-goat Alexa 555 (Polyclonal) | LIFE TECHNOLOGIES/Thermofisher Scientific | Catalog #A21432 | 1:500 |
| Antibody | Donkey anti-goat Alexa 488 (Polyclonal) | LIFE TECHNOLOGIES/Thermofisher Scientific | Catalog # A32814 | 1:500 |
| Antibody | Donkey anti-rat Cy3 (Polyclonal) | Jackson ImmunoResearch | Catalog #712-165-150 | 1:500 |
| Antibody | Goat Anti-rat Alexa 488 (Polyclonal) | LIFE TECHNOLOGIES/Thermofisher Scientific | Catalog # A11006 | 1:500 |
| Antibody | Goat anti-Rat Alexa Fluor647 (Polyclonal) | LIFE TECHNOLOGIES/Thermofisher Scientific | Catalog # A-21247 | 1:500 |
| Antibody | Biotinylated goat anti-mouse IgM (Polyclonal) | Thermo Fischer Scientific | Catalog #31804 | 1:500 |
| Sequence-based reagent | Shot mRNA probe | This work | - | 1:100 |
| Other | CBP | J. Casanova | - | 1:500 |
| Other | Fluostain | Sigma-Aldrich | FB28 | 1:300 |
| Other | Vectastain-ABC kit | Vector Laboratories | PKU-400 | 1:200 |
| Other | TSA Cy3 | Akoya Bio | NEL744001KT | 1:100 |
Additional files
-
Supplementary file 1
Supplementary tables 1 and 2 describing DSRF-specific sequences in upstream and downstream regions of the shot gene and the DSRF Positional Weight Matrix (PWM).
Description of the quantification of phenotypes from Figure 3.
- https://cdn.elifesciences.org/articles/61111/elife-61111-supp1-v2.docx
-
Transparent reporting form
- https://cdn.elifesciences.org/articles/61111/elife-61111-transrepform-v2.pdf
Download links
A two-part list of links to download the article, or parts of the article, in various formats.
Downloads (link to download the article as PDF)
Open citations (links to open the citations from this article in various online reference manager services)
Cite this article (links to download the citations from this article in formats compatible with various reference manager tools)
Coordinated crosstalk between microtubules and actin by a spectraplakin regulates lumen formation and branching
eLife 9:e61111.
https://doi.org/10.7554/eLife.61111


