The biphasic and age-dependent impact of klotho on hallmarks of aging and skeletal muscle function
- Department of Physical Medicine & Rehabilitation, University of Pittsburgh, United States
- Department of Environmental and Occupational Health, University of Pittsburgh, United States
- Department of Bioengineering, University of Pittsburgh, United States
- Department of Computational & Systems Biology, School of Medicine, University of Pittsburgh, United States
- Department of Physics, University of Florida, United States
- Department of Research Beyond Borders, Regenerative Medicine, Boehringer Ingelheim Pharmaceuticals, Inc, Germany
- McGowan Institute for Regenerative Medicine, University of Pittsburgh, United States
Figures
Figure 1 with 2 supplements
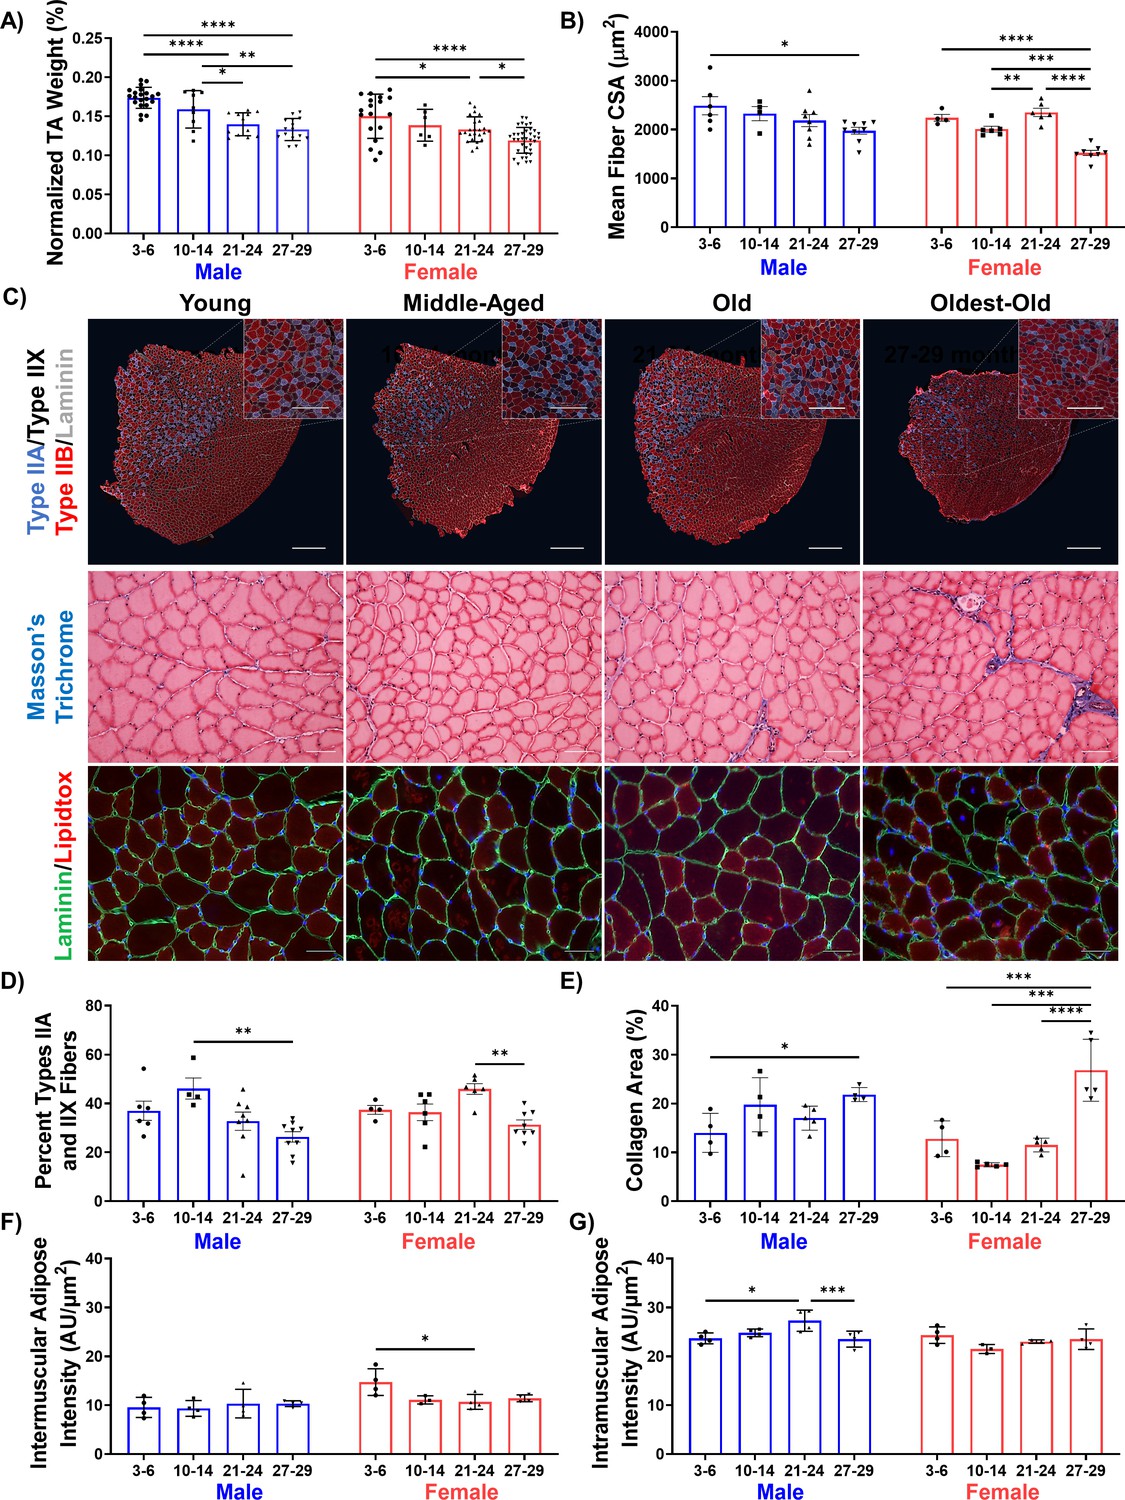
Declines in muscle structure are subtle until advanced age.
(A) Tibialis anterior (TA) muscle weight as a percentage of whole-body weight in young (3–6 months), middle-aged (10-14 months), old (21-24 months), and oldest-old (27-29 months) male (N = 57) and female mice (N = 78, one-way ANOVAs). (B) Average fiber cross-sectional area of uninjured male (N = 27) and female (N = 24) mouse TAs across age groups (one-way ANOVAs). (C) Representative images of TA sections stained for laminin (gray), type IIA (purple), type IIX (black/unstained), and type IIB (red) fibers (top, main scale bars = 500 μm, inset scale bars = 250 μm ); Masson’s trichrome staining (middle, 50 µm); and lipidtox staining (bottom, lipidtox = red, laminin = green, scale bars = 50 µm). (D) Percentage of IIA and IIX fibers in the whole TA cross-section of male (N = 27) and female (N = 24) mice (one-way ANOVAs). (E) Collagen area of TA sections across ages and sexes (male N = 17, female N = 19) quantified by Masson’s Trichrome staining (one-way ANOVAs). (F) Intermuscular lipid accumulation in the TA across ages and sexes (male N = 16, female N = 15) quantified by lipidtox staining (one-way ANOVA). (G) Intramuscular lipid accumulation in the TA across ages and sexes (male N = 16, female N = 15) quantified by lipidtox staining (one-way ANOVA). All data presented as mean ± SD (*p<0.05, **p<0.01, ***p<0.001, ****p<0.0001).
-
Figure 1—source data 1
Raw Data for Figure 1A-B, D-G, and Figure 1—figure supplement 1A-B, D-G and Figure 1—figure supplement 2.
- https://cdn.elifesciences.org/articles/61138/elife-61138-fig1-data1-v2.xlsx
Figure 1—figure supplement 1
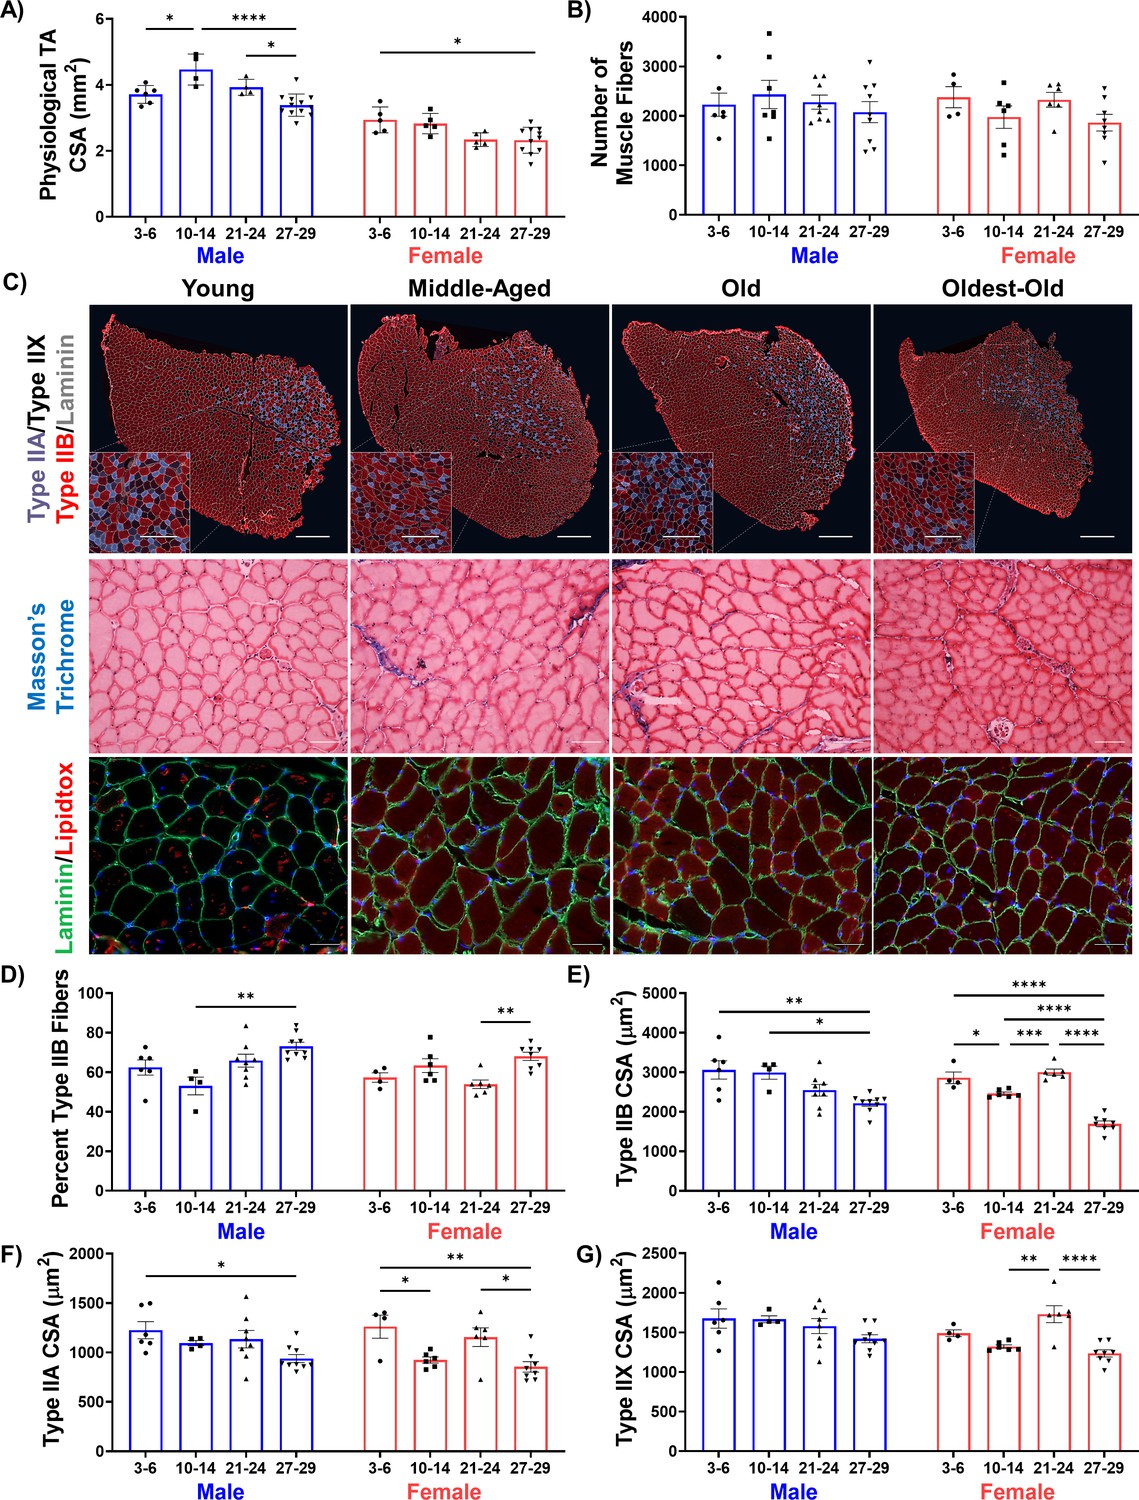
Characterization of sarcopenic changes in male mice.
(A) Physiological TA cross-sectional area (CSA) estimated from length and mass measurements in young (3–6 months), middle-aged (10-14 months), old (21-24 months), and oldest-old (27-29 months) male (N = 26) and female (N = 26) C57BL/6J mice across ages and sexes (one-way ANOVAs). (B) Total number of TA muscle fibers in whole TA sections across ages and sexes (male N = 27, female N = 24). (C) Representative images of male uninjured TA muscles showing fiber type staining for type IIA (purple), type IIX (black/unstained), type IIB (red), and laminin (gray, main scale bars = 500 μm, inset scale bars = 250 μm), and Masson’s trichrome staining. (D) Percentage of type IIB muscle fibers in whole TA muscle sections (male N = 27, female N = 24, one-way ANOVA). (E) Type IIB fiber CSA (male N = 27, female N = 24, one-way ANOVA). (F) Type IIA fiber CSA (male N = 27, female N = 24, one-way ANOVA). (G) Type IIX fiber CSA (male N = 27, female N = 24, one-way ANOVA). All data presented as mean ± SD (*p<0.05, **p<0.01, ***p<0.001, ****p<0.0001).
Figure 1—figure supplement 2
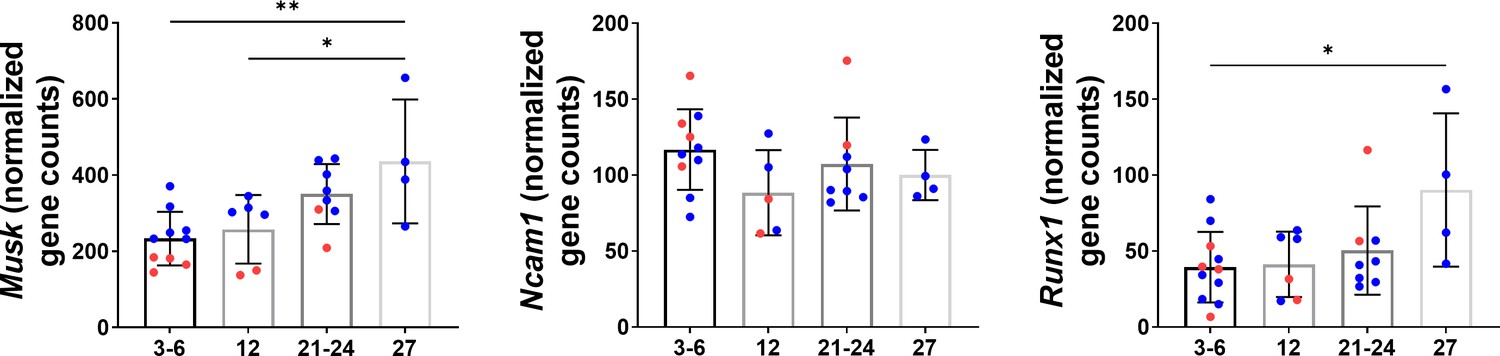
Denervation gene expression in mice across age groups for Musk (N = 28), Ncam1 (N = 27), and Runx1 (N = 29).
Data collected from the Tabula Muris Senis database. Blue dots represent male data. Red dots represent female data (one-way ANOVAs). All data presented as mean ± SD (*p<0.05, **p<0.01).
Figure 2

Male and female mice display a progressive loss of muscle function over time.
(A) Whole-body endurance of young (3–6 months), middle-aged (10-14 months), old (21-24 months), and oldest-old (27-29 months) male (N = 67) and female (N = 77) mice measured by the four-limb hang test (one-way ANOVA). 'g'= gravity and 's'=seconds. (B) Peak specific tetanic force production in male (N = 25) and female (N = 24) TA muscles (one-way ANOVAs). (C) Force frequency curves for TA stimulation in male mice (N = 25). (D) Force frequency curves for TA stimulation for female (N = 24) mice. (E) Half relaxation time of the TA muscle following single twitch stimulation across ages and sexes (male N = 25, female N = 24, Kruskal-Wallis tests). (F) Time to maximum force following single twitch stimulation of the TA muscle (male N = 25, female N = 24, Kruskal-Wallis tests). All data presented as mean ± SD (*p<0.05, **p<0.01, ****p<0.0001).
-
Figure 2—source data 1
Raw Data for Figure 2.
- https://cdn.elifesciences.org/articles/61138/elife-61138-fig2-data1-v2.xlsx
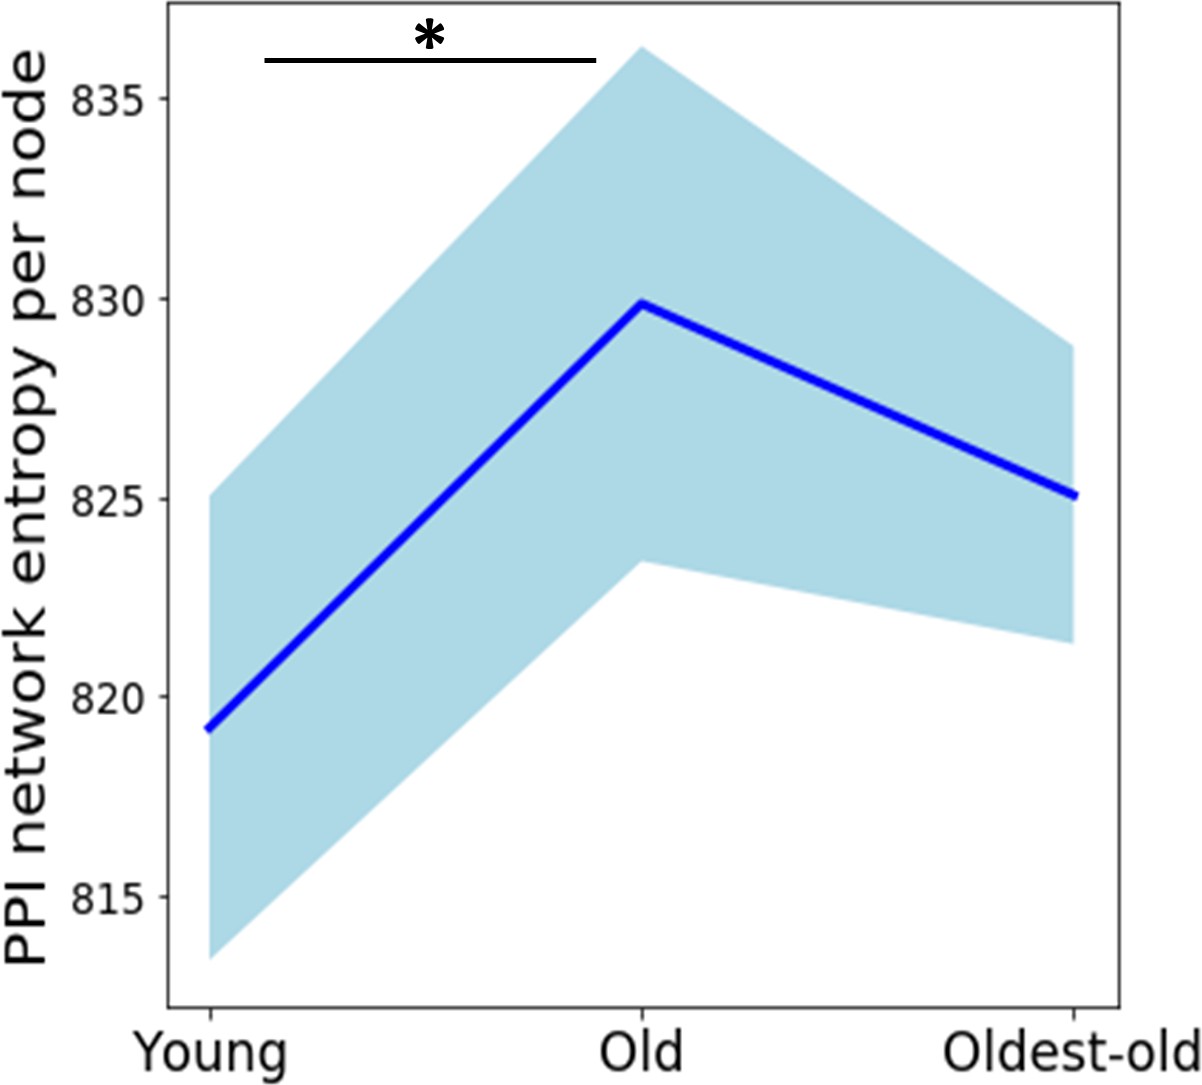
Figure 3 with 4 supplements

Network entropy increases from young to old mice, after which time it plateaus.
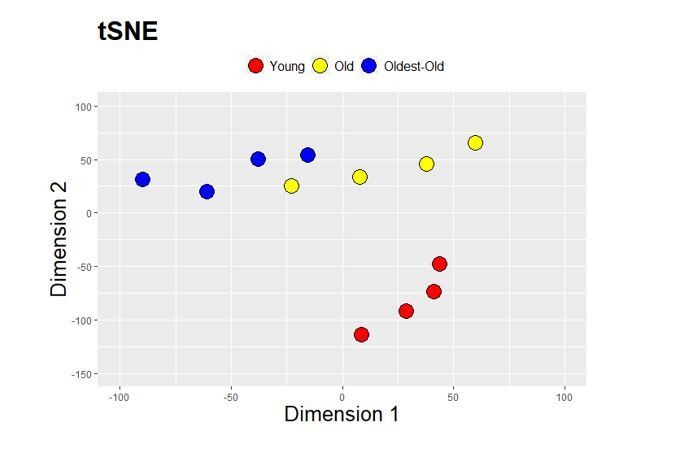
(A) RNA-seq analysis workflow. (B) Principle component analysis (PCA) showing overall gene expression patterns in young (3–6 months), old (21-24 months), and oldest-old (27-29 months) mice (N = 12). (C) Heatmap showing genes associated with aging progression derived from the 100 genes with the highest PC2 loadings. The two highlighted sections show 15/100 genes that have an increasing trend and 23/100 genes that have a decreasing trend. (D) Schematic description of network entropy computation and interpretation. PPI networks were generated based on RNA-seq data. We capture the degree sequence and the edge weights from the network obtained from experimental data in the form of constraints. The ensemble of networks that follow these constraints have similar network features. If the probability distribution is skewed, then it has a low network entropy and, if not, then it is has a high network entropy. (E) Protein-protein interaction (PPI) network entropy computed from transcriptomic data indicates an increase in molecular disorder of hallmarks of aging genes. A non-parametric Kruskal Wallis test (p=0.0741) and Dunn’s post-hoc test were performed. Entropy of young to old changed with p=0.07. Blue shaded portion indicates standard deviation (n = 4). (F) Venn Diagram showing the number of differentially expressed (DE) genes between groups old vs. young, and oldest-old vs. young mice. (G) Network plot denotes the total number of DE genes per hallmark and the corresponding proportion of DE genes that are unique to old and oldest-old, when compared to young counterparts for each hallmark of aging. Edge weights denote the number of genes that are common between the two hallmarks the edge connects. The node sizes are proportional to the number of genes that fall into each hallmark.
-
Figure 3—source data 1
Raw Data for Figure 3—figure supplement 4.
- https://cdn.elifesciences.org/articles/61138/elife-61138-fig3-data1-v2.xlsx
Figure 3—figure supplement 1

Transcriptomic changes in the context of hallmarks of aging genes.
(A) Gene Ontology enrichment of top 100 genes PC2 loadings that characterize aging progression. The majority of these level 3 GO terms fall under altered intercellular communication and nutrient-sensing deregulation. (B) Full heatmap showing genes associated with aging progression derived from the top 100 genes with the highest PC2 loadings.
Figure 3—figure supplement 2
Network entropy with all genes.
Network entropy trend with all genes considered in the PPI network. A non-parametric Kruskal Wallis test (p=0.056) with Dunn’s post-hoc test was performed. Blue shaded portion indicates standard deviation (n = 4).
Figure 3—figure supplement 3
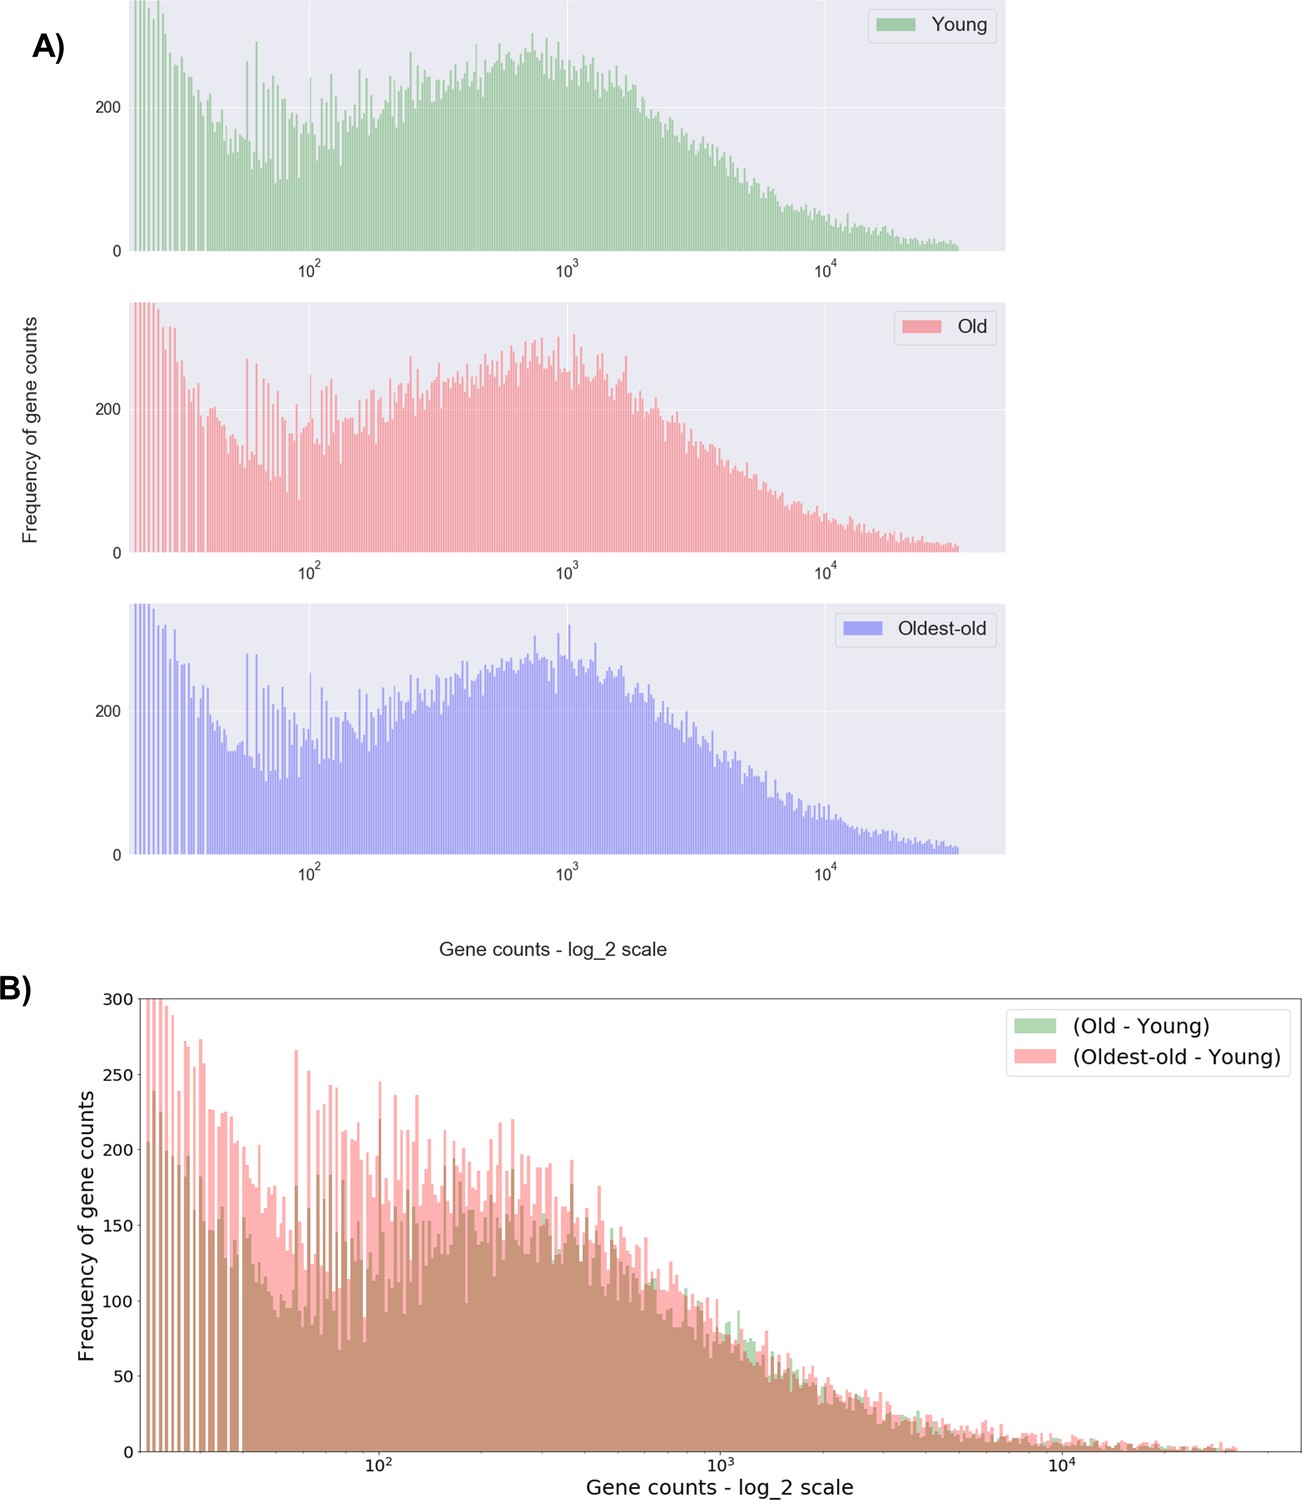
Histogram of all gene counts across young, old, and oldest-old age groups.
(A) Histogram of all gene counts (concatenated values from four animals from each age group). (B) Histogram that shows the difference between age groups, with the green (Old - Young) histogram right-shifted compared to red (Oldest-old – Young).
Figure 3—figure supplement 4
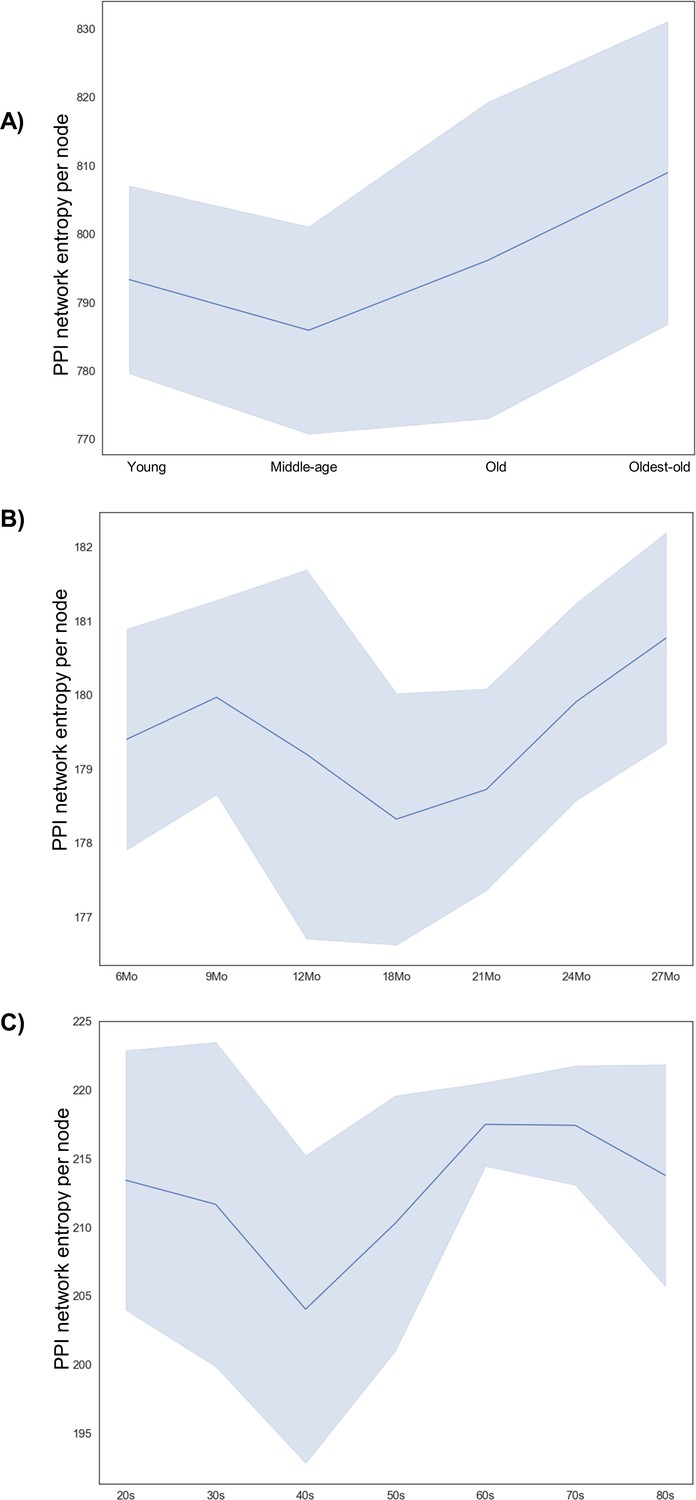
Validation of network entropy trends in other samples and species.
(A) PPI network entropy obtained from all genes in male mice with ages ranging from young (3–6 months), middle-age (12–15 months), old (21–24 months), and oldest-old (27 months). The blue shaded region denotes standard deviation (n = 6, 7, 6, and 4, respectively). One 21-month-old male sample was excluded since the number of nodes was 33% lower than the mean of rest of the samples. (B) PPI network entropy obtained from all genes in male rats with ages ranging from young to old (6, 9, 12, 18, 21, 24, and 27 months). The blue shaded region denotes standard deviation (n = 7, 7, 8, 7, 7, 8, and 8, respectively ). (C) PPI network entropy obtained from all genes in human males with ages ranging from young to middle-aged to old to oldest-old, grouped as decades, namely, 20–29 years, 30–39 years, and so on to >80 years old. The blue shaded region denotes standard deviation (n = 4, 7, 4, 5, 4, 7, and 4, respectively).
Figure 4 with 1 supplement

Development and validation of an AAV approach for systemic delivery of Klotho.
(A) Changes in circulating Klotho levels measured via ELISA in young (3–6 months), middle-aged (10-14 months), old (21-24 months), and oldest-old (27-29 months) male (N = 41), and female (N = 47) mice (one-way ANOVAs). (B) Changes in circulating FGF23 levels in male (N = 20) and female (N = 39) mice. Red symbols represent undetectable levels and were set to zero (Kruskal-Wallis tests, KO values were excluded from statistical analysis). (C) Schematic of the AAV-Klotho plasmid design. (D) Liver expression of AAV vector genomes quantified via qPCR (N = 33, Kruskal-Wallis test). (E) Circulating Klotho levels measured via MSD-ELISA in young female (N = 33) mice injected with AAV-Klotho at varying doses (Kruskal-Wallis test). (F) Gene count normalized to library size for Klotho in the gastrocnemius muscle of female mice treated with GFP and AAV-Kl (N = 20, one-way ANOVA). (G,H,I) Serum concentration levels for insulin (N = 29), cholesterol (N = 35), and glucose (N = 20) in GFP- and Kl-treated female mice (one-way ANOVA). All data presented as mean ± SD (*p<0.05, **p<0.01, ***p<0.001, ****p<0.0001).
-
Figure 4—source data 1
Raw Data for Figure 4A-B, D-I, and Figure 4—figure supplement 1.
- https://cdn.elifesciences.org/articles/61138/elife-61138-fig4-data1-v2.xlsx
Figure 4—figure supplement 1

Quantification of circulating lipid metabolites in mice receiving AAV-Kl treatment versus controls.
Circulating phospholipids (N = 20), NEFA (N = 20), and triglycerides (N = 20) in young (3–6 months), old (21-24 months), and oldest-old (27-29 months) female mice receiving AAV-GFP or AAV-Kl.
Figure 5 with 1 supplement
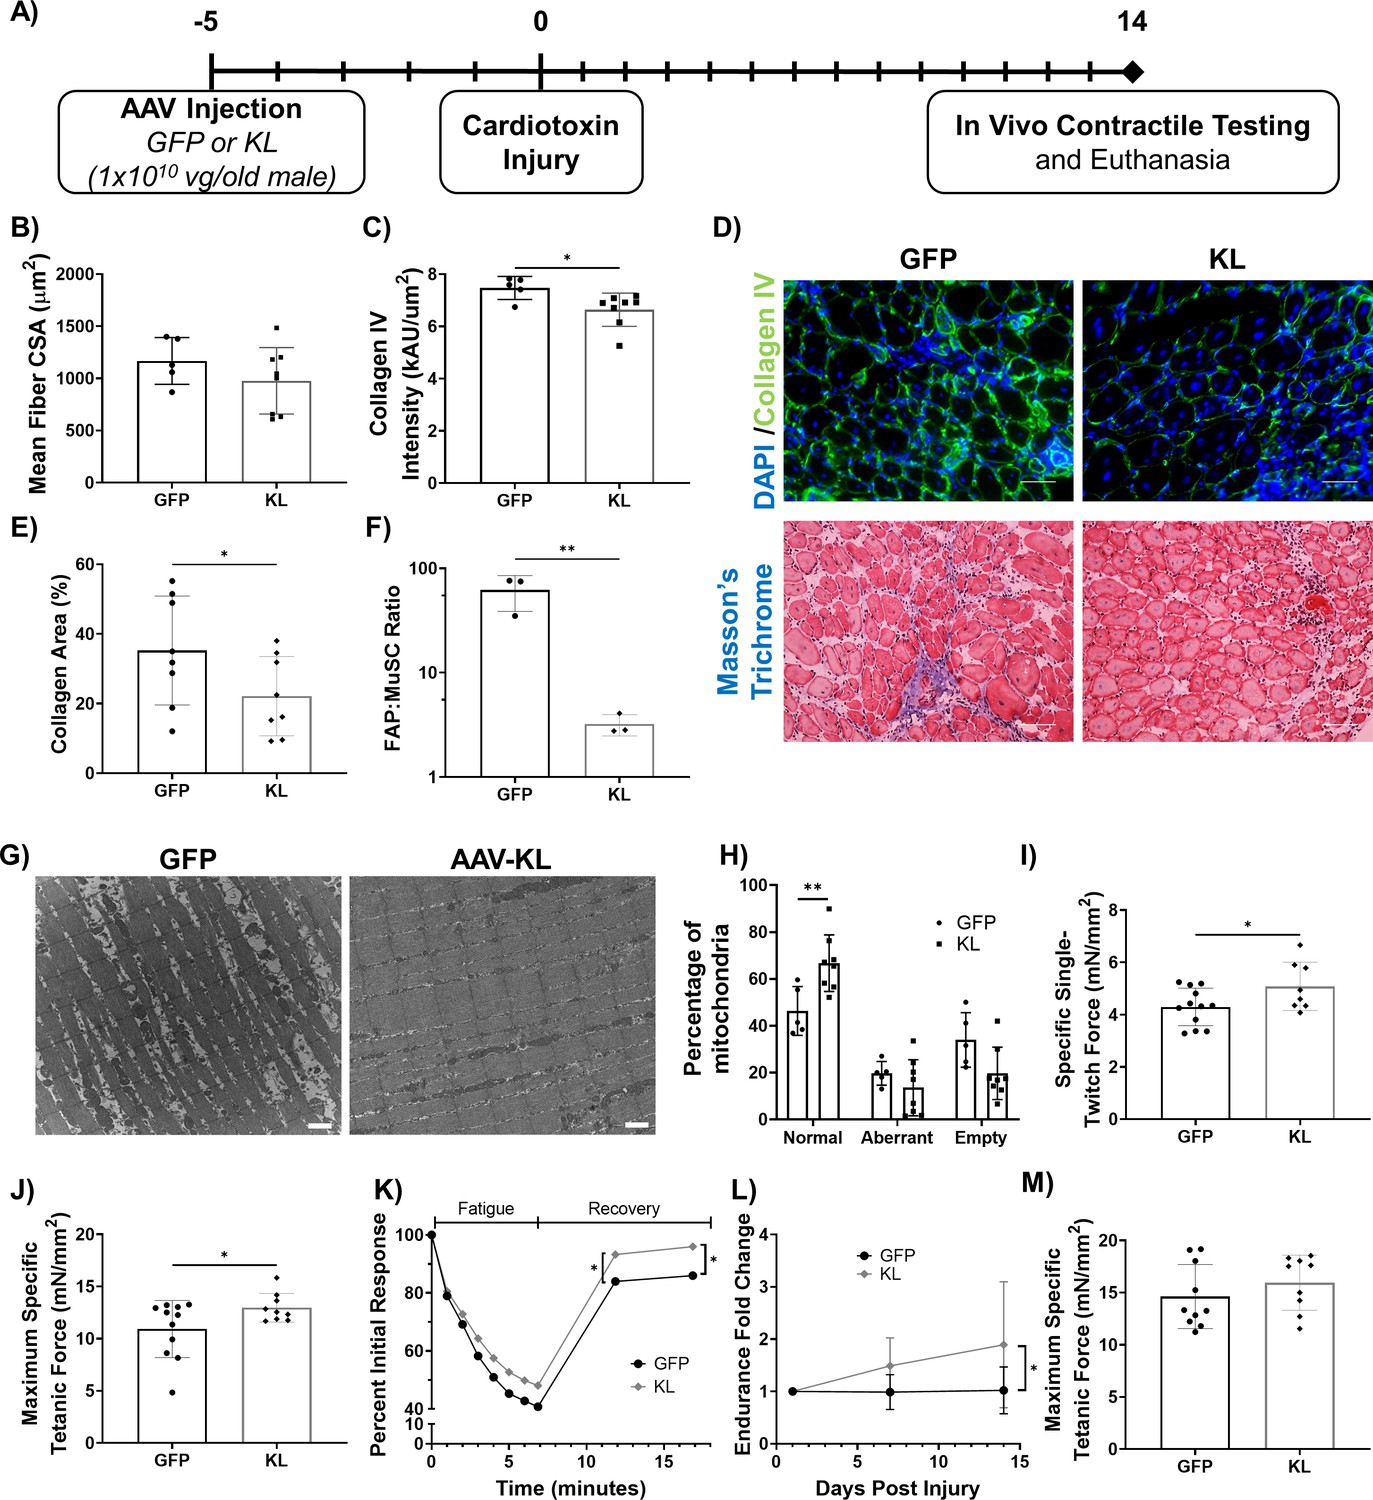
Gene delivery of Klotho enhances functional muscle regeneration following an acute injury.
(A) Experimental design using old (21–24 months) male mice. (B) Quantification of TA average myofiber cross-sectional area (N = 13). (C) Collagen IV expression in the TA muscle of GFP- versus KL-treated mice (one-tailed Mann-Whitney test, N = 13). (D) Top: Representative images of injured TA muscles stained for collagen IV (green) and DAPI (blue, scale bars = 50 µm). Bottom: Masson’s Trichrome staining of the TA (scale bars = 50 µm). (E) Collagen area percentage in the TA quantified from Masson’s Trichrome staining (one-tailed student’s t-test, N = 16). (F) FAPs to MuSCs ratio in injured TA muscles, as determined by flow cytometry (N = 6, one-tailed student’s t-test). (G) Representative TEM images showing mitochondria in the TA muscle fibers of AAV-GFP vs. KL-treated mice. Aberrant and empty mitochondria show abnormal shape and high proportion of white space respectively (scale bars = 1μm). (H) Quantification of the quality of mitochondria (two-way ANOVA, N = 13). (I) TA specific twitch force produced 14 days post-injury (dpi) (one-tailed Student’s t-test, N = 20). (J) TA maximum specific tetanic force 14 dpi (one-tailed Student’s t-test, N = 20). (K) Change in force production of the TA over time as mice underwent a fatigue protocol consisting of repeated TA stimulation for a total of 7 min, followed by recovery over two 5-min intervals (two-way ANOVA, N = 19). (L) Fold change in whole body endurance compared to one day post injury hang impulse score (Mixed-effects analysis, N = 16). (M) TA peak tetanic specific force for mice 7 days after an eccentric injury treadmill protocol (N = 19). All data presented as mean ± SD (*p<0.05, **p<0.01).
-
Figure 5—source data 1
Raw Data for Figure 5B-C, E-F, H-M, and Figure 5—figure supplement 1C, E.
- https://cdn.elifesciences.org/articles/61138/elife-61138-fig5-data1-v2.xlsx
Figure 5—figure supplement 1
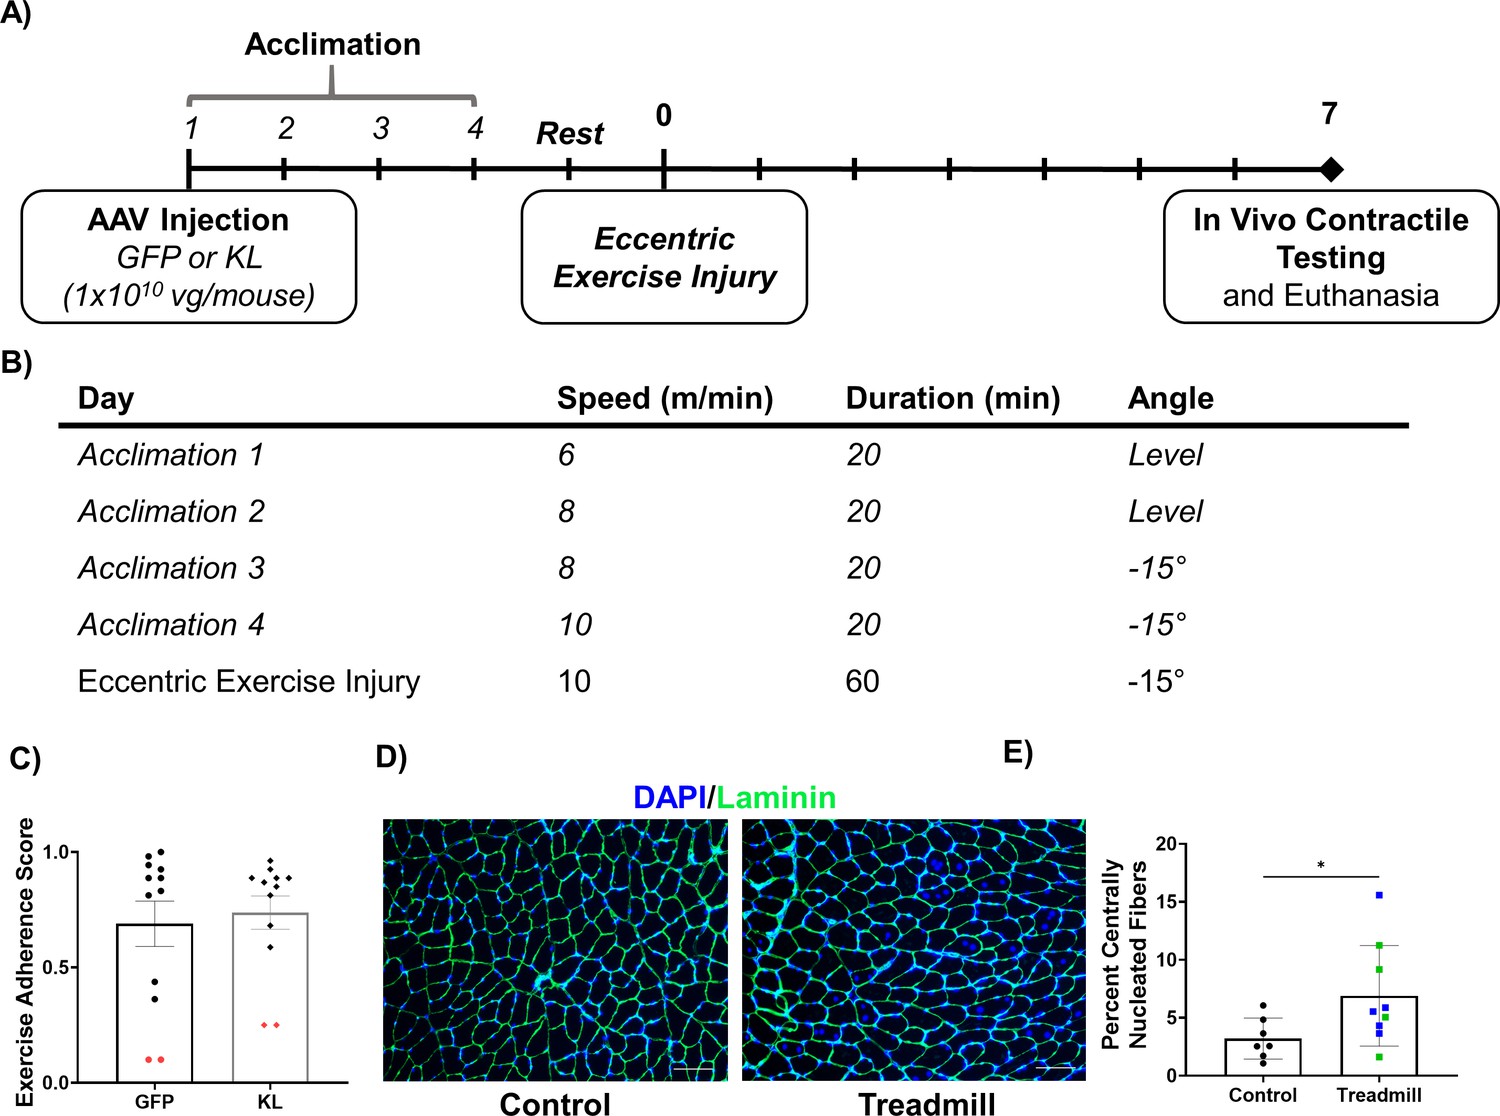
Validation of the eccentric exercise injury model.
(A) Experimental design for the eccentric exercise injury model using old (21–24 months) male mice. (B) Summary of parameters for the acclimation period and injury protocol. (C) Assessment of adherence to the exercise protocol showing similar performance between mice receiving AAV-GFP and AAV-Kl (N = 24). Red symbols represent underperforming animals that were removed from further analysis (N = 2 per group). (D) Representative images in the TA showing the extent of injury induced by the exercise protocol, scale bars = 100 microns. (E) Percent of fibers with central nuclei in control vs. mice completing the treadmill protocol (N = 19, green = GFP group, blue = KL group, student’s one-tailed t-test). All data presented as mean ± SD (*p<0.05).
Figure 6 with 1 supplement
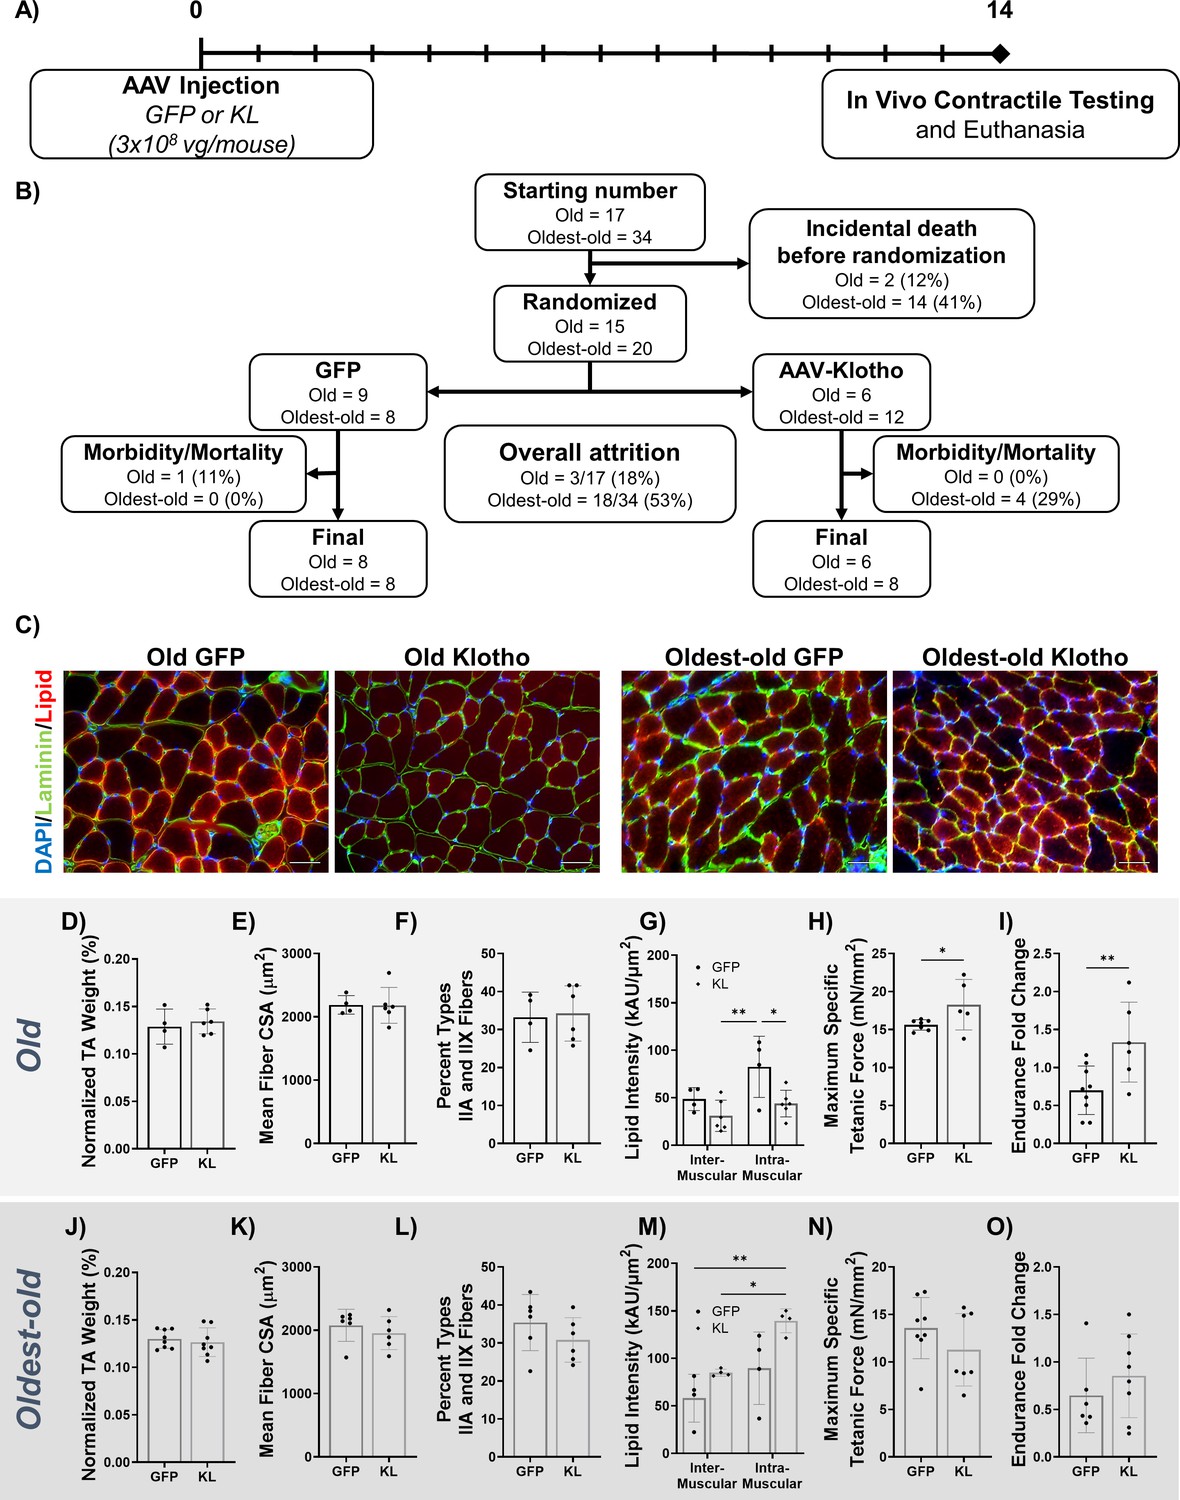
AAV-Klotho enhances muscle function in old, but not oldest-old, mice.
(A) Experimental design and timeline using old (21–24 months) and oldest-old (27-29 months) female mice. (B) Animal inclusion flow chart. Mortality describes mice that died over the course of the experiment. Morbidity describes mice in whom pathology was found at the time of euthanasia . These mice were subsequently excluded from analyses. (C) Representative images showing TA myofiber area (Laminin; green), lipid (red), and DAPI (blue) of the TA 14 dpi in old and oldest-old female mice treated with GFP or Kl. Scale bars = 50 µm. (D) TA wet weight (as a percent of total body weight) of old female mice treated with AAV-GFP or AAV-Kl (N = 10). (E) Quantification of TA muscle-fiber cross-sectional area (CSA) for old female mice (N = 10). (F) Percentage of type IIA and IIX muscle fibers in whole TA cross-sections of old female mice (N = 10). (G) Inter- and intramuscular lipid intensity in TA cross-sections of old female TAs (two-way ANOVA, N = 10). (H) Old female TA maximum specific tetanic force production (one-tailed Student’s t-test, N = 12). (I) Hang-test performance 14 days after injection of AAV-Kl or AAV-GFP, calculated relative to baseline performance (one-tailed Student’s t-test, N = 15). (J) TA wet weight (as a percent of total body weight) of oldest-old female mice treated with AAV-GFP or AAV-Kl (N = 16). (K) Quantification of TA muscle-fiber CSA for oldest-old female mice (N = 12). (L) Percentage of type IIA and IIX muscle fibers in whole TA cross-sections of oldest-old female mice (N = 12). (M) Inter- and intramuscular lipid intensity in TA cross-sections of oldest-old female TAs (two-way ANOVA, N = 8). (N) Oldest-old female TA maximum specific tetanic force production (N = 15). (I) Hang-test performance 14 days after injection, calculated relative to baseline performance (N = 14). All data presented as mean ± SD (*p<0.05, **p<0.01).
-
Figure 6—source data 1
Raw Data for Figure 6D-O, and Figure 6—figure supplement 1A-D.
- https://cdn.elifesciences.org/articles/61138/elife-61138-fig6-data1-v2.xlsx
Figure 6—figure supplement 1
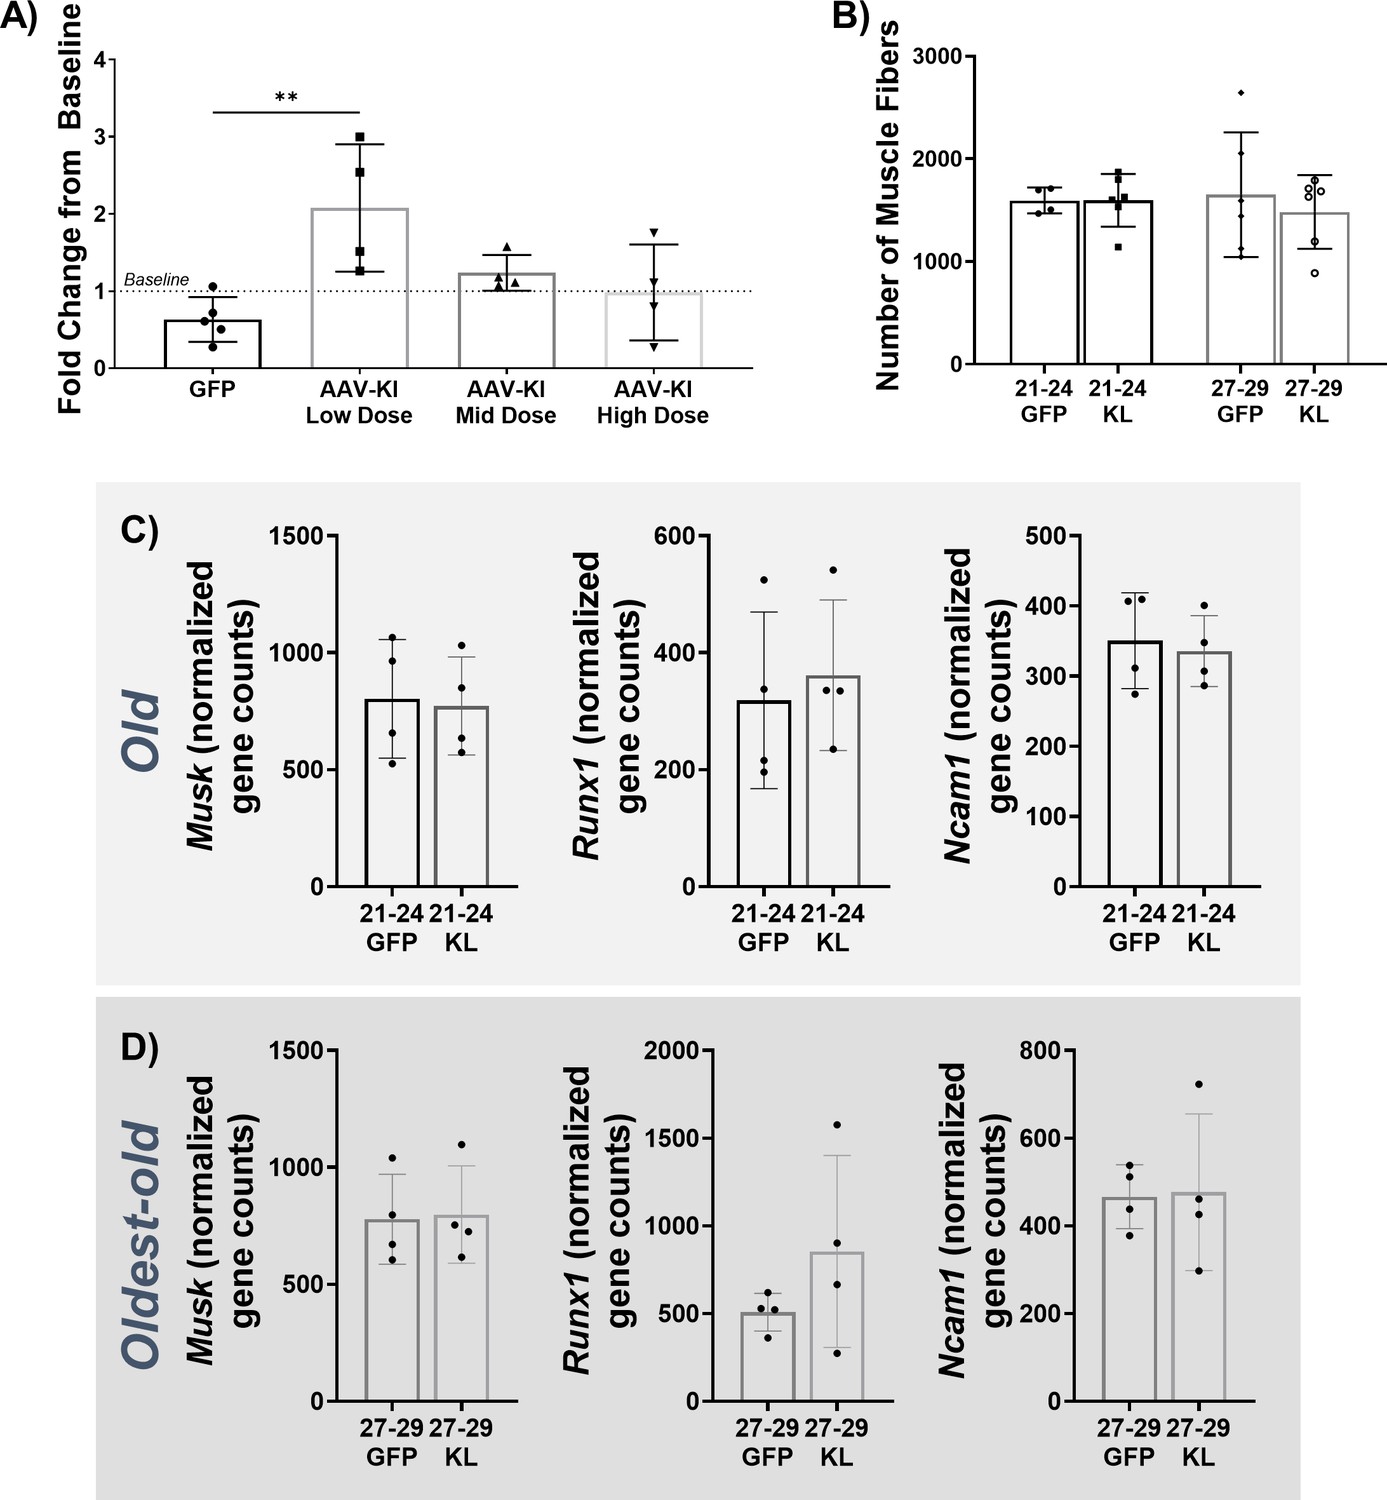
AAV-Administration in uninjured female Mice.
(A) The ratio of whole-body endurance of old (21–24 months) female mice 14 days after receiving GFP or AAV-Kl at three different doses (3 × 10⁸ vg/mouse (low dose), 1 × 10⁹ vg/mouse (mid dose), and 3 × 10⁹ vg/mouse (high dose), N = 17, one-way ANOVA). (B) Total number of muscle fibers in the TA cross-sections of old and oldest-oldest (27–29 months) female mice treated with GFP or AAV-Kl (old N = 10, oldest-old N = 12). (C) Transcript reads of denervation-related genes in old mice (N = 8). (D) Transcript reads of denervation-related genes in oldest-old mice (N = 8). Data presented as mean ± SD error bars (**p<0.01).
Figure 7 with 2 supplements
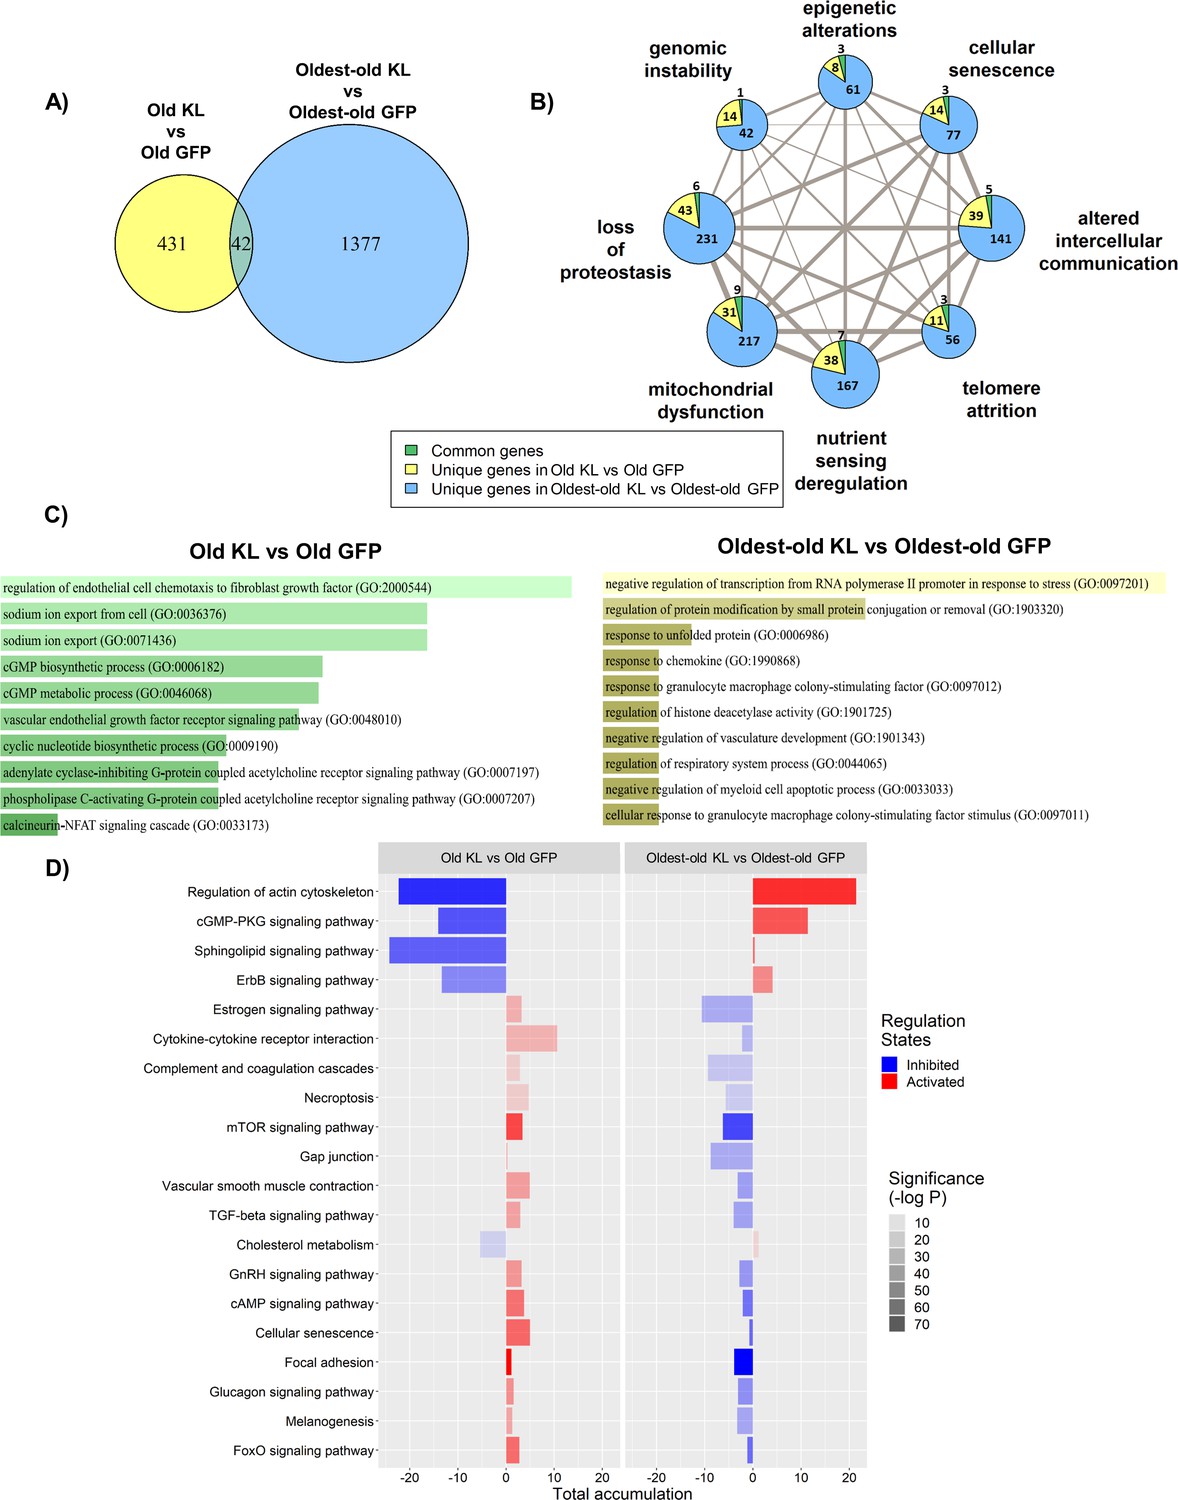
The effect of AAV-Kl administration on genes associated with hallmarks of aging is age-dependent.
(A) Venn Diagram showing the number of differentially expressed (DE) genes between groups treated with AAV-Kl (n = 4) vs AAV-GFP (n = 4) mice. (B) Network plot with each node as a pie chart that denotes the total number of DE genes in that hallmark, and the wedges denote the proportion of DE genes between groups treated with AAV-Kl vs AAV-GFP for each hallmark of aging. The edge weights denote the number of genes that are common between the two connected hallmarks. The node sizes are proportional to the number of genes that fall into each hallmark. (C) Barplots showing GO terms associated with old vs old klotho (green), and oldest-old vs oldest-old klotho (yellow) DE genes. (D) Bar plot showing the top 20 KEGG pathways that change oppositely between old and oldest-old groups after AAV-Kl treatment ranked by largest absolute difference in total accumulation. Total accumulation is a measure of gene perturbation.
-
Figure 7—source data 1
Raw Data for Figure 7—figure supplement 1A-C.
- https://cdn.elifesciences.org/articles/61138/elife-61138-fig7-data1-v2.xlsx
Figure 7—figure supplement 1
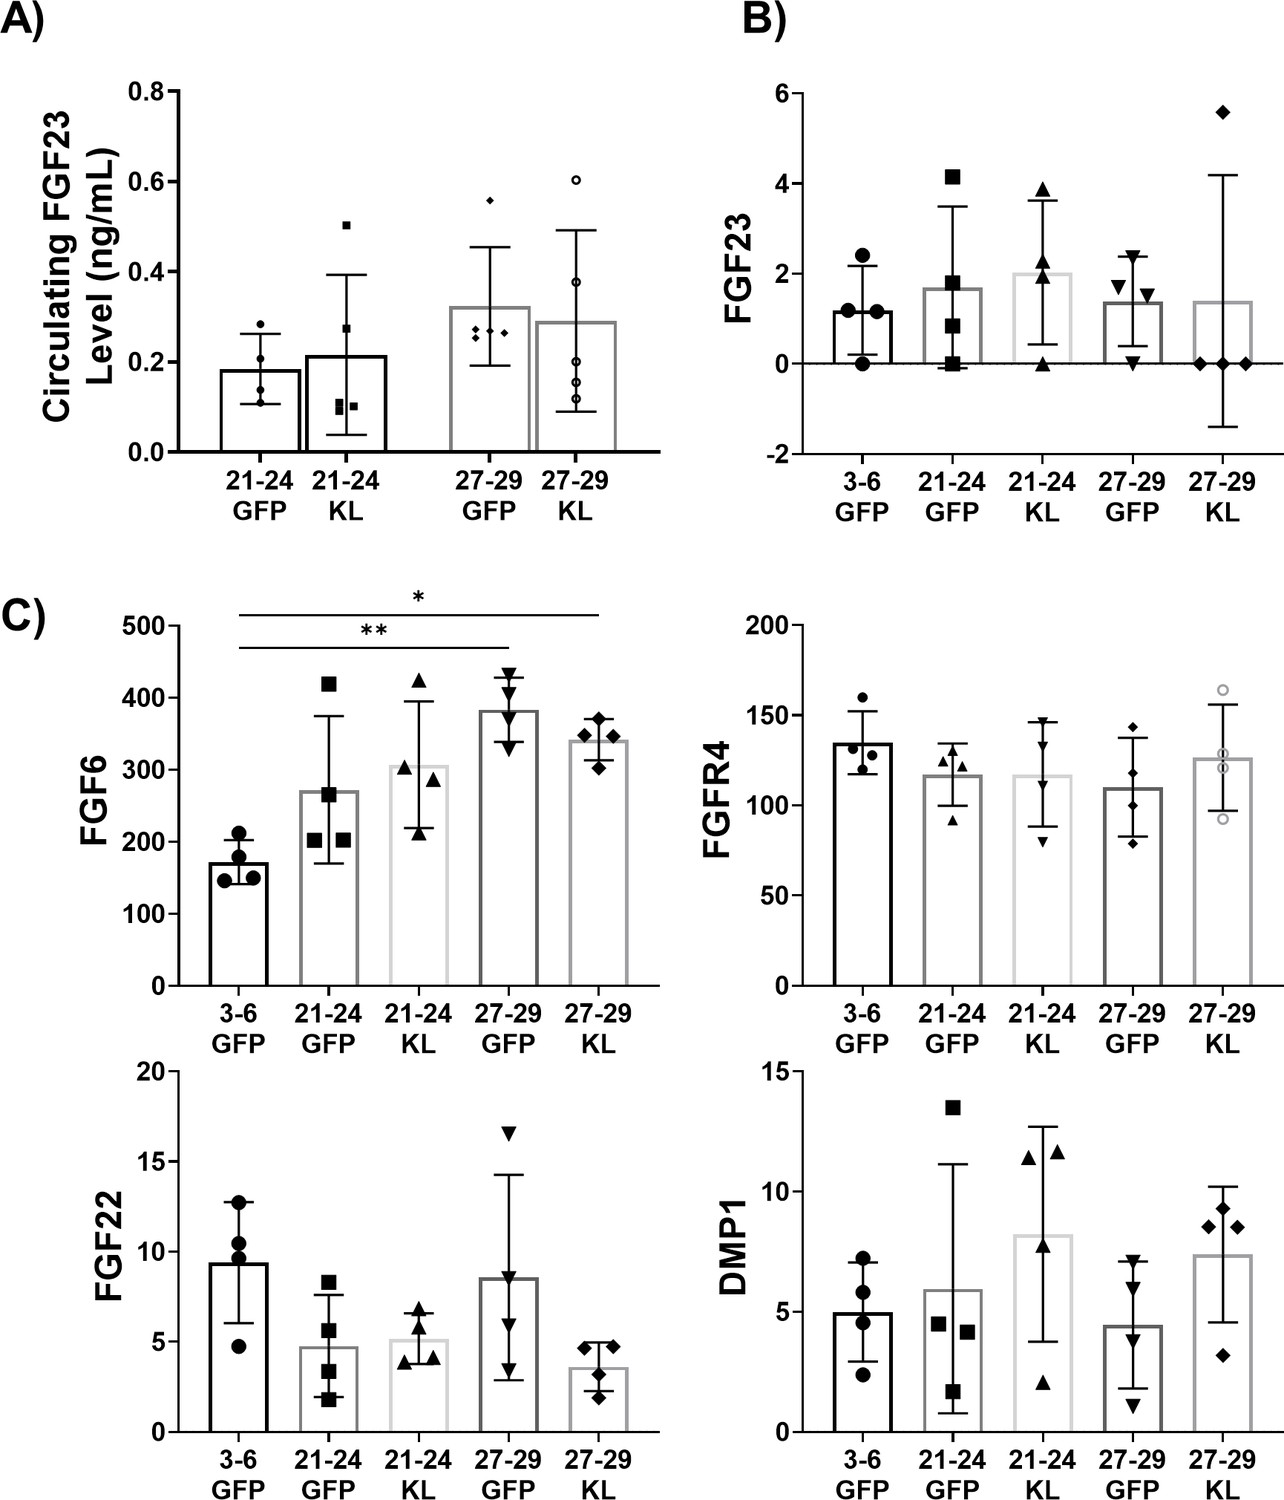
Investigation of the Klotho-FGF23 interaction in uninjured female mice with AAV-Kl treatment.
(A) Circulating FGF23 in the serum of old (21–24 months, N = 9) and oldest-old (27-29 months N = 10) female mice treated with GFP or AAV-Kl. (B) Gene count normalized to library size for FGF23 in the gastroc of old and oldest-old female mice treated with GFP or AAV-Kl compared to young (3–6 months) female mice treated with GFP (N = 20). (C) Gene count normalized to library size for primary interactors of FGF23 (N = 20, one-way ANOVA). All data presented as mean ± SD (*p<0.05, **p<0.01).
Figure 7—figure supplement 2
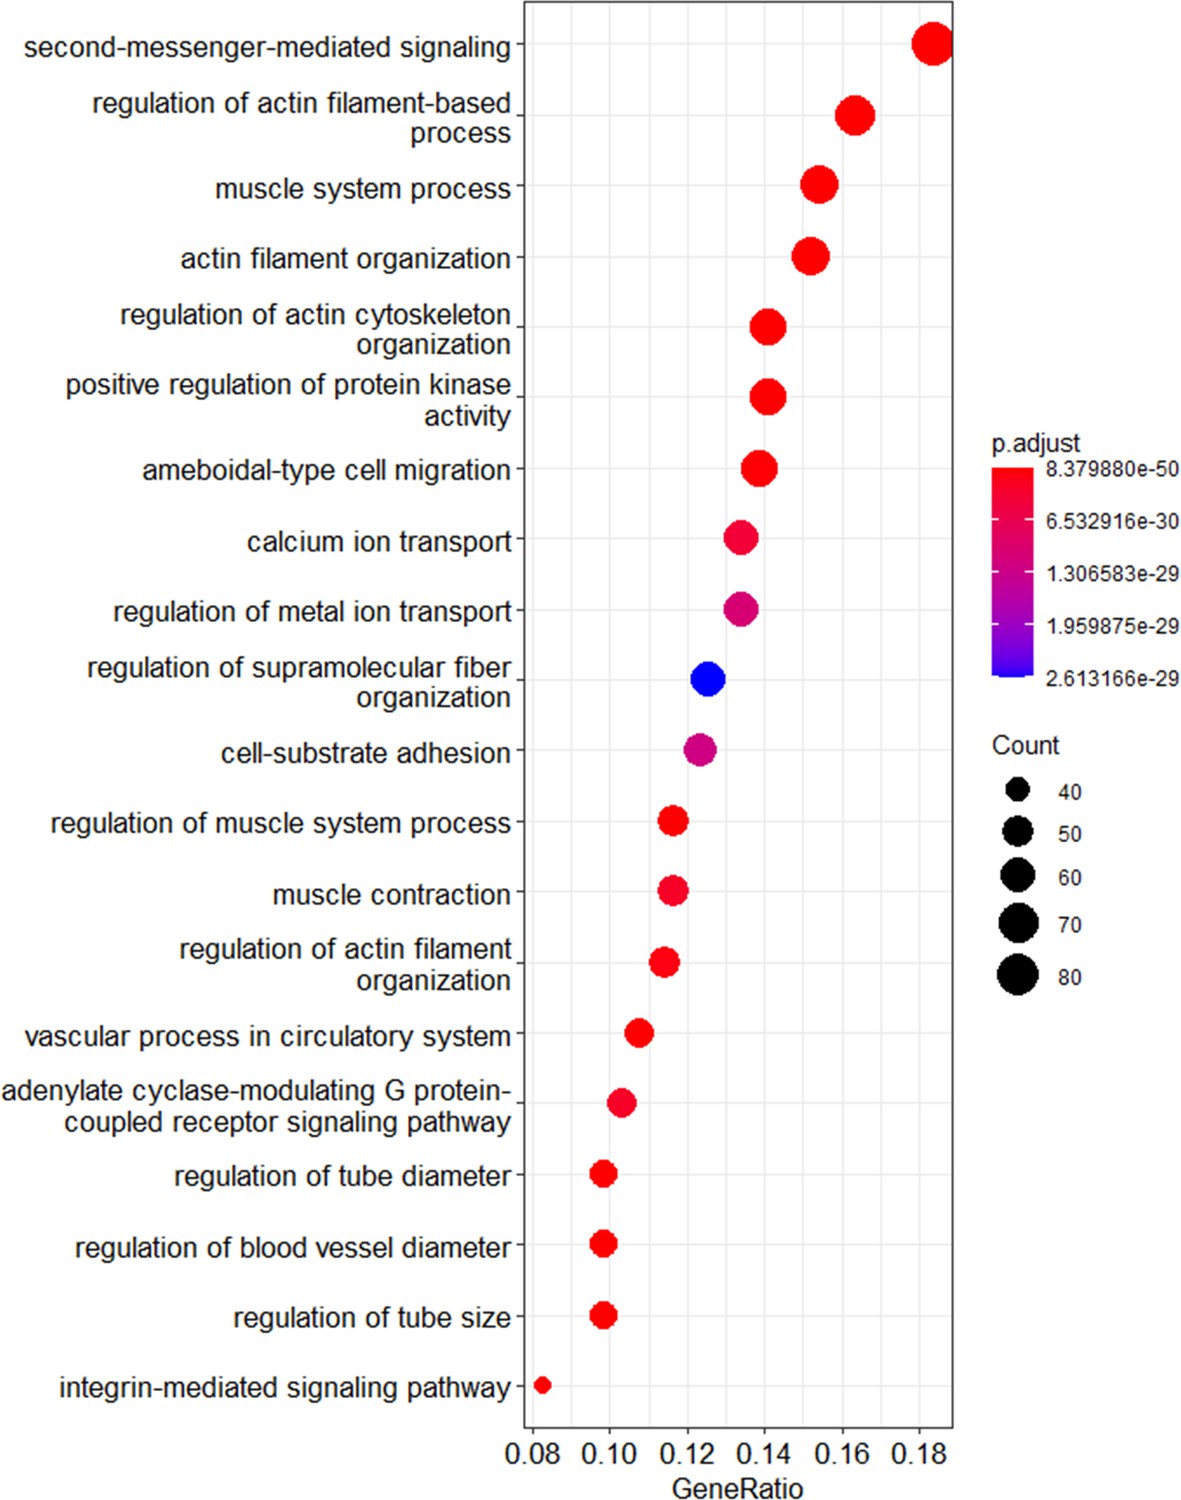
Dot plot of GO terms showing age-dependency of calcium ion transport and signaling with Klotho intervention.
These are GO terms associated with top three pathways differently perturbed between old and oldest-old mice with AAV-Kl intervention. The size of the circle represents the number of genes that are associated with each of the GO term.
Figure 8
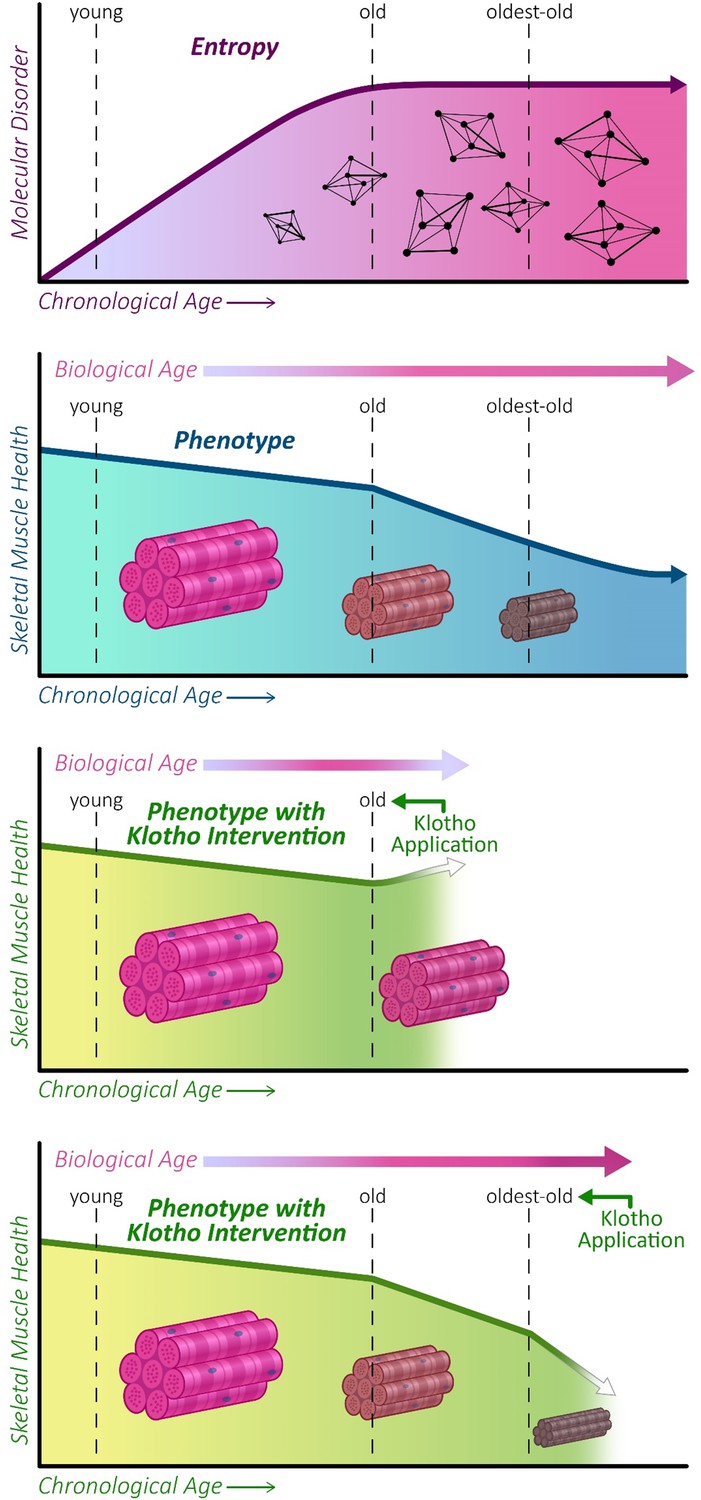
Graphical abstract.
Entropy increases with increasing age before plateauing at old age (21–24 months) in mice (top panel). This is concomitant with a decline in skeletal muscle function, which continues to progress into oldest-old age (second panel). We show that AAV-Kl administration can rescue muscle functional declines when administered to old mice (third panel), but this effect is lost when AAV-Klotho is delivered to oldest-old (27–29 months) mice (bottom panel).
Author response image 1
Tables
Table 1
The top 25 GO terms associated with DE genes from old vs. old AAV-KL treated mice.
| Term | P-value | Adjusted P-value | Odds Ratio | Combined Score | |
|---|---|---|---|---|---|
| regulation of endothelial cell chemotaxis to fibroblast growth factor (GO:2000544) | 8.17E-10 | 1.51332E-08 | 266.631818 | 5579.371 | |
| sodium ion export from cell (GO:0036376) | 7.41E-15 | 2.92305E-13 | 149.472477 | 4863.183 | |
| sodium ion export (GO:0071436) | 7.41E-15 | 2.92305E-13 | 149.472477 | 4863.183 | |
| cGMP biosynthetic process (GO:0006182) | 1.79E-21 | 1.98668E-19 | 90.9116279 | 4343.159 | |
| cGMP metabolic process (GO:0046068) | 1.41E-23 | 2.15989E-21 | 82.1943925 | 4324.53 | |
| vascular endothelial growth factor receptor signaling pathway (GO:0048010) | 2.24E-39 | 2.73359E-36 | 47.4914842 | 4226.557 | |
| cyclic nucleotide biosynthetic process (GO:0009190) | 6.81E-18 | 4.38219E-16 | 97.8152425 | 3866.443 | |
| adenylate cyclase-inhibiting G-protein coupled acetylcholine receptor signaling pathway (GO:0007197) | 3.18E-08 | 4.17609E-07 | 221.689342 | 3827.416 | |
| phospholipase C-activating G-protein coupled acetylcholine receptor signaling pathway (GO:0007207) | 3.18E-08 | 4.17609E-07 | 221.689342 | 3827.416 | |
| calcineurin-NFAT signaling cascade (GO:0033173) | 8.94E-12 | 2.35047E-10 | 119.031963 | 3028.225 | |
| cellular potassium ion homeostasis (GO:0030007) | 8.32E-13 | 2.71081E-11 | 100.657895 | 2799.85 | |
| cellular sodium ion homeostasis (GO:0006883) | 7.48E-14 | 2.64978E-12 | 89.6743119 | 2710.338 | |
| cellular monovalent inorganic cation homeostasis (GO:0030004) | 6.58E-15 | 2.68262E-13 | 82.3862069 | 2690.261 | |
| cellular response to forskolin (GO:1904322) | 3.21E-09 | 5.4068E-08 | 133.309091 | 2607.271 | |
| response to forskolin (GO:1904321) | 3.21E-09 | 5.4068E-08 | 133.309091 | 2607.271 | |
| transmembrane receptor protein tyrosine kinase signaling pathway (GO:0007169) | 1.92E-67 | 4.69774E-64 | 16.4566607 | 2528.075 | |
| ceramide metabolic process (GO:0006672) | 4.51E-24 | 7.3577E-22 | 45.96 | 2470.574 | |
| regulation of cardiac conduction (GO:1903779) | 1.84E-30 | 4.49925E-28 | 35.7165215 | 2445.428 | |
| peptidyl-serine dephosphorylation (GO:0070262) | 2.96E-10 | 6.14116E-09 | 103.915718 | 2279.845 | |
| cyclic purine nucleotide metabolic process (GO:0052652) | 3.13E-19 | 2.38927E-17 | 51.9335548 | 2212.838 | |
| calcineurin-mediated signaling (GO:0097720) | 2.63E-11 | 6.62923E-10 | 89.2694064 | 2174.732 | |
| cAMP biosynthetic process (GO:0006171) | 2.28E-12 | 6.89002E-11 | 80.5221968 | 2158.455 | |
| positive regulation of protein kinase B signaling (GO:0051897) | 1.97E-36 | 1.20529E-33 | 22.916681 | 1884.074 | |
| regulation of myosin-light-chain-phosphatase activity (GO:0035507) | 1.09E-07 | 1.28925E-06 | 110.839002 | 1776.808 | |
| cyclic nucleotide metabolic process (GO:0009187) | 1.16E-15 | 5.76736E-14 | 48.8926097 | 1681.61 | |
Table 2
The top 25 GO terms associated with DE genes from old vs. old AAV-Kl treated mice.
| Term | P-value | Adjusted P-value | Odds Ratio | Combined Score | |
|---|---|---|---|---|---|
| negative regulation of transcription from RNA polymerase II promoter in response to stress (GO:0097201) | 0.000331 | 0.09424241 | 13.1472045 | 105.3348 | |
| regulation of protein modification by small protein conjugation or removal (GO:1903320) | 0.00023 | 0.07658759 | 9.8657932 | 82.66108 | |
| response to unfolded protein (GO:0006986) | 5.3E-06 | 0.00896227 | 5.72185053 | 69.50717 | |
| response to chemokine (GO:1990868) | 0.006044 | 0.307829996 | 13.1300353 | 67.07703 | |
| response to granulocyte macrophage colony-stimulating factor (GO:0097012) | 0.006044 | 0.307829996 | 13.1300353 | 67.07703 | |
| regulation of histone deacetylase activity (GO:1901725) | 0.006044 | 0.307829996 | 13.1300353 | 67.07703 | |
| negative regulation of vasculature development (GO:1901343) | 0.006044 | 0.307829996 | 13.1300353 | 67.07703 | |
| regulation of respiratory system process (GO:0044065) | 0.006044 | 0.307829996 | 13.1300353 | 67.07703 | |
| negative regulation of myeloid cell apoptotic process (GO:0033033) | 0.006044 | 0.307829996 | 13.1300353 | 67.07703 | |
| cellular response to granulocyte macrophage colony-stimulating factor stimulus (GO:0097011) | 0.006044 | 0.307829996 | 13.1300353 | 67.07703 | |
| regulation of microtubule nucleation (GO:0010968) | 0.006044 | 0.307829996 | 13.1300353 | 67.07703 | |
| cellular response to chemokine (GO:1990869) | 0.006044 | 0.307829996 | 13.1300353 | 67.07703 | |
| RNA stabilization (GO:0043489) | 0.000787 | 0.169749244 | 7.17396343 | 51.27482 | |
| chaperone-mediated protein complex assembly (GO:0051131) | 0.000787 | 0.169749244 | 7.17396343 | 51.27482 | |
| mitochondrial translation (GO:0032543) | 1.36E-06 | 0.004970703 | 3.63077317 | 49.05655 | |
| 3'-UTR-mediated mRNA destabilization (GO:0061158) | 0.003735 | 0.29111327 | 8.75813296 | 48.95746 | |
| primary miRNA processing (GO:0031053) | 0.003735 | 0.29111327 | 8.75813296 | 48.95746 | |
| cellular response to leucine starvation (GO:1990253) | 0.003735 | 0.29111327 | 8.75813296 | 48.95746 | |
| endothelial tube morphogenesis (GO:0061154) | 0.003735 | 0.29111327 | 8.75813296 | 48.95746 | |
| negative regulation of inclusion body assembly (GO:0090084) | 0.003735 | 0.29111327 | 8.75813296 | 48.95746 | |
| mitochondrial gene expression (GO:0140053) | 4.92E-05 | 0.025776303 | 4.79736196 | 47.58752 | |
| regulation of transcription from RNA polymerase II promoter involved in heart development (GO:1901213) | 0.010022 | 0.41209955 | 9.84699647 | 45.32527 | |
| mitochondrial electron transport, ubiquinol to cytochrome c (GO:0006122) | 0.002072 | 0.281362729 | 7.30242982 | 45.12396 | |
| mitochondrial translational elongation (GO:0070125) | 8.63E-06 | 0.00896227 | 3.6976622 | 43.11427 | |
| mitochondrial translational termination (GO:0070126) | 1.22E-05 | 0.00896227 | 3.59162667 | 40.63 | |
Table 3
Top 25 GO terms associated with DE genes from oldest-old vs. oldest-old AAV-Kl-treated mice.
| Klotho mediated Bi-phasic KEGG Pathways Gene Expression | ||||||||
|---|---|---|---|---|---|---|---|---|
| Old + log2FC | Oldest-Old + log2FC | |||||||
| Regulation of actin cytoskeleton | F2 | -1.92627 | Bcarl | 0.40772 | Rras | 0.30578 | Rhoa | 0.08657 |
| Kng2 | -1.09411 | Arpc3 | 0.22899 | Pik3rl | -0.94428 | Itga5 | 0.30051 | |
| Diaph2 | 0.25901 | Brkl | 0.17587 | Rafl | -0.19865 | Hras | 0.22869 | |
| Itga9 | 0.39371 | Arhgap35 | -0.24801 | Pfn1 | 0.19127 | |||
| Pdgfrb | -0.35413 | Pip4k2c | -0.16982 | Pfn2 | -0.20196 | |||
| ltgax | 1.6131 | Apc2 | -0.52877 | |||||
| Arpc2 | 0.1243 | Cdc42 | 0.11714 | |||||
| cGMP-PKG signaling | F2 | -1.9263 | Dgke | -0.3491 | Pik3rl | -0.94428 | Cyth1 | 0.13784 |
| Lpar3 | 1.82228 | Pdgfrb | -0.35413 | Rafl | -0.19865 | Rhoa | 0.08657 | |
| Adcy9 | -0.20643 | Dnm3 | -0.54357 | Hras | 0.22869 | |||
| Rras | 0.30578 | Pla224e | -0.25837 | |||||
| Sphingolipid signaling pathway | Kng2 | -1.0941 | Sgppl | -0.1274 | Pik3rl | -0.94428 | Hras | 0.22869 |
| Map3k5 | 0.27371 | Rafl | -0.19865 | |||||
| Ctsd | 0.17911 | Rhoa | 0.08657 | |||||
Key resources table
| Reagent type (species) or resource | Designation | Source or reference | Identifiers | Additional information |
|---|---|---|---|---|
| Gene (Mus musculus) | klotho (Kl) | MGI | MGI:1101771 | |
| Strain, strain background (mouse) | C57BL/6J | NIA | RRID:IMSR_JAX:000664 | |
| Cell line (Homo sapiens) | HEK-293H | Thermo Fisher | Cat#: 11631017 RRID:CVCL_6643 | For vector construction |
| Antibody | Anti-Laminin (Rabbit polyclonal) | Abcam | Cat#: ab11575, RRID:AB_298179 | IF(1:500) |
| Antibody | Anti-Type IIA Fibers (mouse monoclonal) | DSHB | Cat#: SC-71, RRID:AB_2147165 | IF(1:100) |
| Antibody | Anti-Type IIB Fibers (mouse monoclonal) | DSHB | Cat#: BF-F3, RRID:AB_2266724 | IF(1:100) |
| Antibody | Anti-Collagen IV (rabbit polyclonal) | Abcam | Cat#: ab6586, RRID:AB_305584 | IF(1:500) |
| Antibody | Anti-Klotho capture antibody (goat polyclonal) | R and D Systems | Cat#: AF1819, RRID:AB_2296612 | MSD-ELISA(4 µg/mL) |
| Antibody | Anti-Klotho detection antibody (goat polyclonal) | R and D Systems | Cat#: BAF1819, RRID:AB_2131927 | MSD-ELISA(1 µg/mL) |
| Antibody | Anti-CD31 (rat monoclonal) | Thermo Fisher | Cat#:1 11–0311081, RRID:AB_465011 | FACS(1:500) |
| Antibody | Anti-CD45 (mouse monoclonal) | Thermo Fisher | Cat#: 11-0451-81, RRID:AB_465049 | FACS(1:500) |
| Antibody | Anti-Sca1 (rat monoclonal) | Thermo Fisher | Cat#: 25-5981-82, RRID:AB_469669 | FACS(1:33) |
| Antibody | Anti-α−7 (rat monoclonal) | Thermo Fisher | Cat#: MA5-23555, RRID:AB_2607368 | FACS(1:200) |
| Peptide, recombinant protein | Klotho | R and D Systems | Cat#: 1819 KL-050 | MSD-ELISA |
| Other | Lipidtox stain | Thermo Fisher | Cat#: H34476 | IF(1:500) |
| Other | DAPI stain | Invitrogen | Cat#: D1306 RRID:AB_2629482 | IF(1:1000) |
| Other | Trichrome Stain Solution | Sigma | Cat#: HT10516 | |
| Other | Weigarts’s Haemotoxylin | Poly Scientific R and D | Cat#: S216B | |
| Other | Bouin’s solution | Sigma | Cat#: HT101128 | |
| Commercial assay or kit | Mouse Klotho ELISA | Cloud-Clone Corp. | Cat#: SEH757Mu | Lot: L180223640 |
| Commercial assay or kit | FGF23 ELISA | Abcam | Cat#: ab213863 | Lot: GR3326863 |
| Commercial assay or kit | AllPrep DNA/RNA 96 kit | Qiagen | Cat#: 80311 | |
| Chemical compound, drug | Poly/Bed 812 | Polysciences | Cat#: 08792–1 | |
| Chemical compound, drug | Cardiotoxin | Sigma | Cat#: 217503 | |
| Recombinant DNA reagent | AAV-GFP | Strobel et al., 2019 | AAV8-LP1-eGFP | |
| Recombinant DNA reagent | AAV-Klotho | This paper | AAV8-LP1-mKlotho Mouse Klotho version of AAV vector | |
| Sequence-based reagent | LP-1 promoter (forward) | This paper | PCR primers | GACCCCCTAAAATGGGCAAA |
| Sequence-based reagent | LP-1 promoter (reverse) | This paper | PCR primers | TGCCCCAGCTCCAAGGT |
| Biological sample (M. musculus) | Mouse gastrocnemius muscle | NIA | Freshly dissected from C57BL/6J mice | |
| Biological sample (M. musculus) | Mouse serum | NIA | Freshly dissected from C57BL/6J mice | |
| Biological sample (M. musculus) | Mouse tibialis anterior muscle | NIA | Collected fresh from C57BL/6J via cardiac puncture | |
| Software, algorithm | STAR_2.7.0a | Dobin et al., 2013 | RRID:SCR_004463 | |
| Software, algorithm | R | R Project for Statistical Computing | RRID:SCR_001905 | |
| Software, algorithm | ggplot2 | R Project for Statistical Computing | RRID:SCR_014601 | R package |
| Software, algorithm | clusterProfiler | Bioconductor | RRID:SCR_016884 | R package |
| Software, algorithm | VennDiagram | R Project for Statistical Computing | RRID:SCR_002414 | R package |
| Software, algorithm | igraph | R Project for Statistical Computing | RRID:SCR_019225 | R package |
| Software, algorithm | BioMart | BioMart Project | RRID:SCR_002987 | R package |
| Software, algorithm | Fiji-ImageJ | NIH | RRID:SCR_002285 | |
| Software, algorithm | MuscleJ Macro | Mayeuf-Louchart et al., 2018 | RRID:SCR_020995 | |
| Software, algorithm | GraphPad Prism v9.0 | GraphPad | RRID:SCR_002798 | |
| Software, algorithm | R ShinyApp resource | This paper | https://sruthisivakumar.shinyapps.io/HallmarksAgingGenes/ | Gene classification based on hallmarks of aging. Building details are provided in ‘Hallmarks of aging genes classification' (Materials and methods). |
| Software, algorithm | Python Streamlit | This paper | https://network-entropy-calculator.herokuapp.com/ | Network entropy calculatorapp hosted on Heroku |
| Software, algorithm | GitHub | This paper | https://github.com/sruthi-hub/sarcopenia-network-entropy | Code for RNA -seq network entropy provided with explanation |
| Other | STRING | STRING Consortium | RRID:SCR_005223 | Protein interaction database |
Table 4
Antibody/stain list.
Primary antibodies and corresponding dilutions used for immunofluorescence imaging.
| Antibody/stain | Source | Dilution |
|---|---|---|
| Rabbit anti-Laminin | Abcam ab11575 | 1:500 |
| Lipidtox Red Stain | Invitrogen H34476 | 1:200 |
| Collagen IV | Abcam ab6586 | 1:500 |
| Type IIA Muscle Fibers | DSHB SC-71 | 1:100 |
| Type IIB Muscle Fibers | DSHB BF-F3 | 1:100 |
| DAPI Stain | Invitrogen D1306 | 1:1000 |
Additional files
-
Supplementary file 1
Full list of KEGG pathways affected by Klotho treatment in old and oldest-old animals.
- https://cdn.elifesciences.org/articles/61138/elife-61138-supp1-v2.pdf
-
Supplementary file 2
Search terms and network properties for hallmarks of aging genes.
- https://cdn.elifesciences.org/articles/61138/elife-61138-supp2-v2.docx
-
Transparent reporting form
- https://cdn.elifesciences.org/articles/61138/elife-61138-transrepform-v2.docx
Download links
A two-part list of links to download the article, or parts of the article, in various formats.
Downloads (link to download the article as PDF)
Open citations (links to open the citations from this article in various online reference manager services)
Cite this article (links to download the citations from this article in formats compatible with various reference manager tools)
The biphasic and age-dependent impact of klotho on hallmarks of aging and skeletal muscle function
eLife 10:e61138.
https://doi.org/10.7554/eLife.61138


